 Jifan Shi1,2*
 Kenji Kirihara3,4
 Mariko Tada3
 Mao Fujioka3
 Kaori Usui3
 Daisuke Koshiyama3Tsuyoshi Araki3
 Luonan Chen5,6,7,8
 Kiyoto Kasai1,3*
 Kazuyuki Aihara1,2*
- 1International Research Center for Neurointelligence, The University of Tokyo Institutes for Advanced Study, The University of Tokyo, Tokyo, Japan
- 2Institute of Industrial Science, The University of Tokyo, Tokyo, Japan
- 3Department of Neuropsychiatry, Graduate School of Medicine, The University of Tokyo, Tokyo, Japan
- 4Disability Services Office, The University of Tokyo, Tokyo, Japan
- 5Center for Excellence in Molecular Cell Science, Shanghai Institute of Biochemistry and Cell Biology, Chinese Academy of Sciences, Shanghai, China
- 6Guangdong Institute of Intelligence Science and Technology, Zhuhai, China
- 7School of Life Science and Technology, ShanghaiTech University, Shanghai, China
- 8Key Laboratory of Systems Biology, Hangzhou Institute for Advanced Study, University of Chinese Academy of Sciences, Chinse Academy of Sciences, Hangzhou, China
The excellence of the brain is its robustness under various types of noise and its flexibility under various environments. However, how the brain works is still a mystery. The critical brain hypothesis proposes a possible mechanism and states that criticality plays an important role in the healthy brain. Herein, using an electroencephalography dataset obtained from patients with psychotic disorders (PDs), ultra-high risk (UHR) individuals and healthy controls (HCs), and its dynamical network analysis, we show that the brain of HCs remains around a critical state, whereas that of patients with PD falls into more stable states. Meanwhile, the brain of UHR individuals is similar to that of PD in terms of entropy but is analogous to that of HCs in causality patterns. These results not only provide evidence for the criticality of the normal brain but also highlight the practicability of using an analytic biophysical tool to study the dynamical properties of mental diseases.
Introduction
Studying the human brain is a large project, which involves investigating its organization, structure, function, and association with behavior. Detecting the physical mechanisms underlying the working of the brain is one of the most important topics. On the one hand, the brain should be well-structured to process information appropriately. On the other hand, it must be flexible enough to adapt to various environments and emergencies.
The critical brain hypothesis provides an intriguing explanation for the mechanism of the working of the brain, which assumes that in the normal brain, neural networks work near a critical state (Beggs, 2015; Massobrio et al., 2015; Beggs and Timme, 2012). Self-organized criticality (Cocchi et al., 2017; Lee et al., 2019) is one argument of the critical brain hypothesis, which has been supported by the neuronal avalanche phenomenon experimentally (Beggs and Plenz, 2003; Petermann et al., 2009): the size of the cortical activities exhibits power laws. Studies have also found a possibility that this critical mechanism in the brain could ensure maximized capacity and transmission of information (Haldeman and Beggs, 2005; Shew et al., 2009; Shew et al., 2011). However, although neuronal avalanches and power laws provide important statistical descriptions of the critical brain, an intrinsic dynamical interpretation is still missing.
The dynamical network analysis or dynamical network marker (DNM) theory has been studied in the recent decade; it provides a dynamics-based tool to detect the changes in a complex system under perturbation, especially near the critical point (Chen et al., 2012; Liu et al., 2012; Kuehn, 2011; Shi et al., 2016). The DNM theory generalizes the approach of detecting early warning signals of critical slowing down phenomena (Scheffer et al., 2001; Scheffer, 2009; Scheffer et al., 2009) to complex networks. According to the DNM theory, a core subnetwork called a dynamical network (DNMnet) can be found, which is the leading subnetwork of the system toward criticality. Its components (called the DNM group) exhibit large deviations in signals and strong correlations between them around the critical state. DNM groups can not only act as a marker for the criticality of complex systems but also provide an approach for predicting disease, economic crashes, etc (Liu et al., 2014a; Liu et al., 2015; Richard et al., 2016; Lesterhuis et al., 2017; Li et al., 2013; Liu et al., 2014b; Yang et al., 2018; Liu et al., 2019; Dakos and Bascompte, 2014).
Herein, we used electroencephalography (EEG) (Cooper et al., 2014) data recorded from healthy control subjects (HCs), ultra-high risk (UHR) individuals, and patients with psychotic disorder (PD) to explore states of the brain using the DNM theory. By analyzing the dynamical properties of the DNM group of the neural network in the brain, we found that brains of HCs were at a critical state, whereas those of patients with PD were stuck in more stable less-critical states. Brains of UHR individuals fell in a medial state with similar low entropy as those of patients with PD, but a weak causality pattern was observed between electrodes similar to HC. These results based on DNM modeling not only provide an evidence of the critical brain hypothesis but also show a biophysical framework to study the brain and mental diseases.
Results
Construction of the DNMnet
The 64-channel EEG data were recorded from subjects with the two-tone auditory oddball paradigm (see Methods). Mathematically, we suppose that the dynamics of brain signals under the standard stimulus evolves as follows:
where
where the matrix
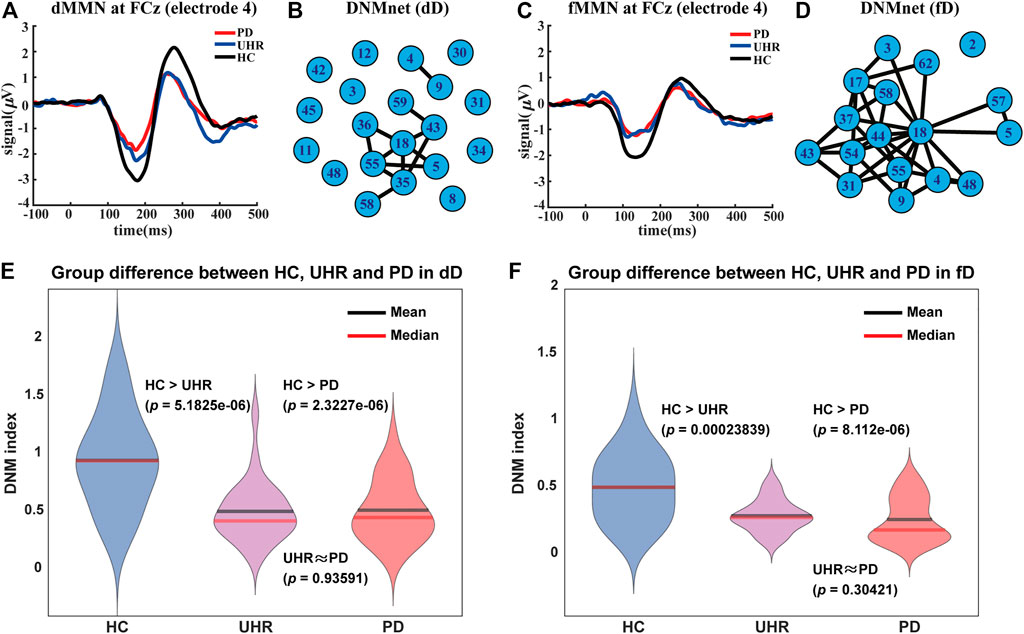
FIGURE 1. Auditory mismatch negativity (MMN) patterns, dynamical networks (DNMnet), and DNM indices of the three groups (HC, UHR, and PD). (A) is the duration MMN (dMMN) pattern and (C) is the frequency MMN (fMMN) pattern for the electrode FCz (channel number 4). (B) and (D) are DNMnets constructed in the duration deviation (dD) case and the frequency deviation (fD) case, respectively. (B) has 20 nodes and 12 edges which exhibited significant differences (the one-sided Wilcoxon rank-sum test,
Criticality of the Brain: MMN Pattern and DNMIndex
Mismatch negativity (MMN) (Erickson et al., 2016) is one of the most well-known patterns in PD, whose amplitude of neural activities is reduced compared to the healthy brain. MMN is associated with cognitive impairments (Chung et al., 2017) and can serve as a biomarker for early interventions (Bodatsch et al., 2015) and development of novel treatments (Perez et al., 2017; Kantrowitz et al., 2018). However, mechanisms underlying altered connectivity remain unknown in the clinical field. Using the DNM theory, we found that the MMN amplitude is explained by the difference process
A DNMIndex was designed to measure the criticality based on the characteristics extracted from the DNMnet as follows:
where “Π
Criticality of the Brain: Entropy
Mutual information between each pairs of nodes over time and its entropy are important metrics for isotropy and the criticality of a network. Based on the nodes in the DNMnet, we define the mutual information over time from node
where
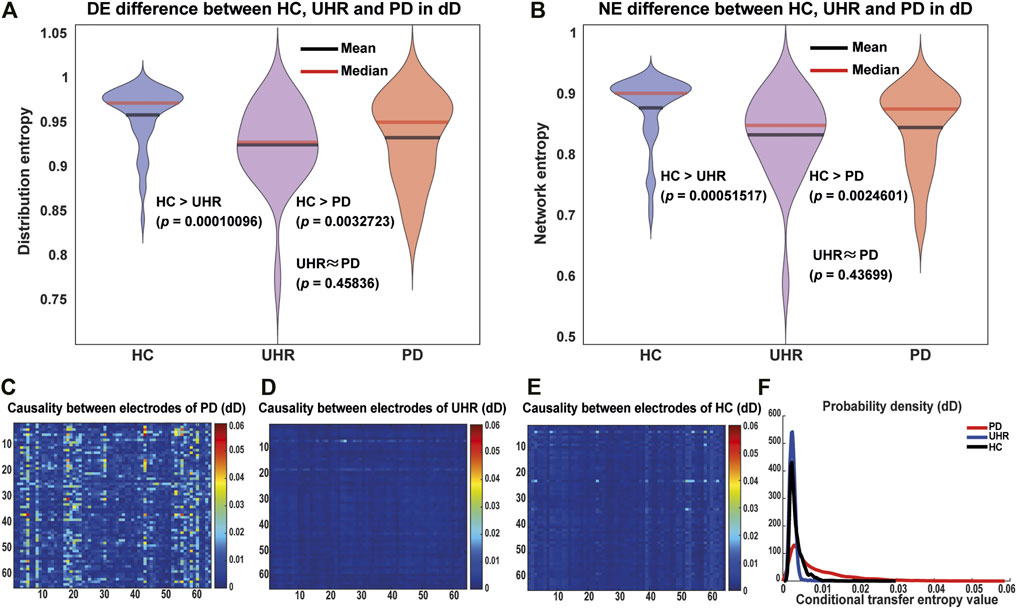
FIGURE 2. Entropy and causality difference between the HC, UHR, and PD groups in the duration deviant (dD) case. (A) Violin plot for the distribution entropy of mutual information between each pair of nodes. (B) Network entropy. For “HC > UHR” and “HC > PD”, p-values were calculated by the one-sided Wilcoxon rank-sum test, while for “UHR ≈ PD”, the two-sided Wilcoxon rank-sum test was used. The HC group exhibited significantly higher entropy than the PD and UHR groups. The PD and UHR groups did not significant differences. (C–E) Heatmaps of the direct causality between 64 electrodes measured by the conditional transfer entropy (CTE). (F) shows probability density functions of the CTE. On average the PD has much stronger direct causalities between electrodes than the HC/UHR.
In the biological sense, the high entropy at the critical state reflects a possibility that the brain can send information to different brain regions in time to deal with various stimuli.
Criticality of the Brain: Causality Pattern
The causality pattern is another evidence for criticality, which can be detected by the conditional transfer entropy (CTE) between different nodes, which is given as
where CMI denotes the condition mutual information, x and y are two variables to detect causality,
ANCOVA for DNMIndex, DE, and NE
For EEG data, we performed analysis of covariance (ANCOVA) with age, premorbid IQ, and antipsychotic dose as covariates because these variables were significantly different among groups (Supplementary Table S1). For the duration deviant experiments, all these covariates showed no significant effects (F1,91 < 2.58, p > 0.11). Therefore, these factors did not affect our findings in the duration deviant experiments. For the frequency deviant experiments, premorbid IQ showed significant effects, whereas age and antipsychotic dose showed no significant effects (F1,91 < 0.75, p > 0.39). Therefore, we performed ANCOVA with premorbid IQ as a covariate in the frequency deviant experiments.
ANCOVA of the DNMIndex in the frequency deviant condition revealed significant effects of groups (F2,95 = 6.61, p = 0.01) and premorbid IQ (F1,95 = 11.08, p < 0.001). Post-hoc analyses revealed that the HC group had a significantly higher mean value than the PD (p < 0.001) and the UHR (p = 0.004) groups, while the difference between the PD and UHR groups was not significant (p = 1.00).
ANCOVA of DE in the frequency deviant condition revealed significant effects of groups (F2,95 = 5.72, p = 0.005) and premorbid IQ (F1,95 = 6.80, p = 0.01). Post-hoc analyses revealed that the HC group had a significantly higher mean value than the PD group (p = 0.003), while the difference between the HC and UHR groups (p = 0.33) and the difference between the UHR and PD groups (p = 0.48) were not significant. ANCOVA of NE in the frequency deviant condition revealed significant effects of groups (F2,95 = 5.44, p = 0.006) and premorbid IQ (F1,95 = 8.43, p = 0.005). Post-hoc analyses revealed that the HC group had a significantly higher mean value than the PD group (p = 0.004), while the difference between the HC and UHR groups (p = 0.58) and the difference between the UHR and PD groups (p = 0.31) were not significant.
These findings revealed the lower DNMIndex, lower distribution entropy, and lower network entropy of the frequency deviant experiments in the PD group even after controlling premorbid IQ. In UHR, the DNMIndex was lower, whereas DE and NE showed insignificant difference for the frequency deviant experiments after controlling premorbid IQ.
Application of Criticality: Risk of Mental Disease
The level of the criticality of the brain contained in the DNMnet can provide a quantitative measure to weigh the risk of mental disease. From the EEG samples, we applied an ensemble classifier based on the DNMnet (see Methods). AUCs and cross validations were used to test the training accuracy and to ensure the reliability of the classifier (Supplementary Figure S8). With the final risk output, we found that the PD group exhibited the highest risk, and the HC group showed the lowest risk, whereas the UHR group evinced a medial risk (Figure 3A for the dD case and Figure 3B for the fD case). This risk analysis indicates that DNM results could help distinguish between the three groups and has a potential to guide prepsychotic diagnosis.
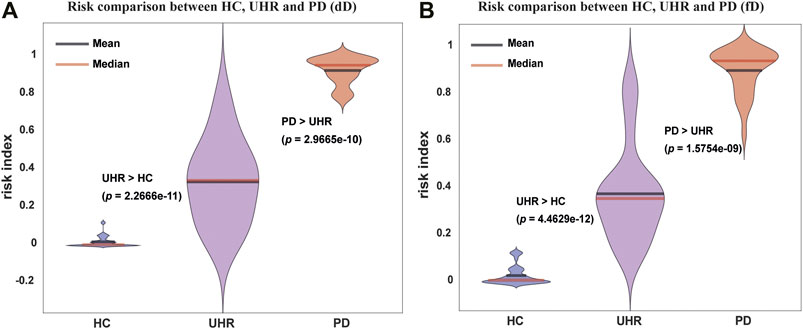
FIGURE 3. Risk analysis of the HC, UHR, and PD groups for the duration deviant experiment (dD) dataset and the frequency deviant experiment (fD) dataset with DNM features. (A) and (B) Violin plots of risks for three groups in the dD and fD cases, respectively. The HC always has the lowest and the PD has the highest risk, whereas the UHR exhibits a medial risk. The one-sided Wilcoxon rank-sum test was used to determine the significance of difference between groups.
Discussion
In this study, we built a dynamical network model to explore the criticality of the brain. It not only provides a dynamics-based explanation of the traditional MMN patterns, but also uses features of the model (the DNMIndex, the entropy, and the causality pattern) to support the fact that the healthy brain is around the critical state. A risk index for PDs also indicates the practicality of the DNMnet, which can highlight the criticality of the neuronal network.
Criticality is an important concept for the activity of the brain. Around the critical state, the healthy brain can adapt to new situations and deal with various stimuli in a timely manner. However, if the DNMnet in the brain falls into a more stable state, as in the PD group, the stability may lead to cognitive inflexibility and functional impairments (Serrano-Guerrero et al., 2020). Previous studies reported altered connectivity underlying MMN in psychotic disorders (Dima et al., 2012; Ranlund et al., 2016; Braeutigam et al., 2018). However, MMN does not highlight the dynamical mechanism to clarify its reduction in psychotic disorders. Therefore, the DNMnet used in the current study reveals that MMN is only an external presentation of the changes in the criticality.
The UHR group in this study showed lower DNMIndex, DE, and NE compared to the HC group. These findings suggest that the DNMnet of the UHR has already fallen into the stable states before onset of psychosis. However, in the direct causality network constructed by the CTE, we found that the direct causality between electrodes for the UHR group was as weak as the HC. As the CTE detects the direct influence from electrode to electrode, while the DE and NE consider the long-range global communication, we speculate a possibility that the UHR group has healthy local functions similar to the HC group, but impaired global functions similar to the PD group. The lack of variation may eventually pull the UHR into a more stable state, similar to the PD group. It could be one way to explain why the brain of UHR individuals works normally as HC compared to those of PD, but eventually the slowing down variation makes it fall into the stable PD state.
In the application of risk analyses, we only used the information from the DNMnet, which is a subnetwork of the entire 64 channels, to estimate the risk of psychosis for each sample. We also compared it with the result of the risk estimated by the MMN amplitude (Supplementary Table S4; Supplementary Figures S9, S10). The DNMnet exhibited the same efficiency as the MMN risk which uses features from all channels. These findings indicate that the much simpler DNMnet can serve as not only a mechanistic biomarker (Pine and Leibenluft, 2015) but also as a pragmatic biomarker (Paulus, 2015) for diagnosing mental diseases.
There are several limitations in this study. First, potential medication effects may have influenced the findings because participants in UHR or PD took medication. Whether medication biases dynamic network markers needs to be clarified with medication-naïve participants in the future study. Second, this work is designed as a cross-sectional study. Therefore, we could not identify when the brain falls into stable states. Future longitudinal studies will clarify the trajectory of dynamic states in psychotic disorders.
In conclusion, we found that the criticality is a key feature of the healthy brain. Based on the DNM theory, the brain of HC was close to the critical states, whereas those of UHR individuals or patients with PD fell into more stable states. Our analysis not only offers a new viewpoint toward understanding the dynamic brain but also provides a possibility of a biophysical approach for researching other mental disorders.
Methods
Subjects
A total of 49 HC subjects, 24 UHR individuals, and 29 patients with PD participated in this study, which contained participants of the Integrative Neuroimaging Studies for Schizophrenia Targeting Early Intervention and Prevention (IN-STEP) (Koike et al., 2013). Detailed participant information is provided in the Supplementary Notes and Supplementary Table S1. The Research Ethics Committee of the Faculty of Medicine, The University of Tokyo, approved this study (approval No. 629, 2226). We conducted this study in accordance with the Declaration of Helsinki. Written informed consent was obtained from all the participants.
Electroencephalography Data
A 64-channel Geodesic EEG System (Electrical Geodesics Inc, Eugene, OR) was used to acquire EEG data. Electrodes were referenced to the vertex, and impedances were kept below 50 kΩ. The sampling rate was 500 Hz, and the analog filter bandpass was set at 0.1–100 Hz. The locations of the EEG electrodes are shown in Supplementary Figure S1A.
Stimuli and Procedure
The two-tone auditory oddball paradigm with 2000 stimuli was performed for each subject when obtaining EEG data. For the duration deviant (dD) experiments, 90% stimuli were standard tones (1,000 Hz, 50 ms) and 10% were deviant tones (1,000 Hz, 100 ms). For the frequency deviant (fD) experiments, 90% stimuli were standard tones (1,000 Hz, 50 ms) and 10% were deviant tones (1,200 Hz, 50 ms). All stimuli were 80 dB SPL with a 1 ms rise/fall time. The stimulus onset asynchrony was 500 ms. The oddball paradigms were counter-balanced, and tones were presented binaurally through earphones while participants watched a silent cartoon.
EEG Data Preprocessing
Original 64-channel signal files (Supplementary Figure S1B) were input into MATLAB (9.3.0) and were further preprocessed using the EEGLAB (v14_1_1b) package (Delorme and Makeig, 2004) (Supplementary Figures S1C–E). Detailed preprocessing procedures are provided in the Supplementary Material. Finally, corrected epochs (deviant epochs with the mean signal of standard epochs being subtracted for each sample) were utilized for further analyses (Supplementary Figure S1F).
Auditory Mismatch Negativity
Corrected epochs were obtained by subtracting the event-related potential (ERP) waveforms in response to the standard stimuli from those in response to the deviant stimuli. We defined the peak latency as the most negative peak between 100 and 250 ms relative to the onset, and the MMN amplitude was calculated as the mean signal around the peak latency (we used the window of 135–205 ms for the duration MMN and the window of 100–200 ms for the frequency MMN) (Nagai et al., 2013). The MMN patterns for the 64 electrodes in the three groups (PD, UHR, and HC) under dD and fD are shown in Supplementary Figures S3 and S4, respectively. Using the MMN amplitude for each channel as the feature, we can compute p-values of the group difference under the Wilcoxon rank-sum test. After FDR correction, we identified 12 electrodes (Nos. 3, 4, 5, 9, 17, 18, 22, 30, 43, 54, 55, and 58) in the dD and 12 electrodes (Nos. 3, 4, 5, 8, 9, 17, 18, 30, 43, 54, 55, and 58) in the fD that exhibited significant difference (adjusted p < 0.05) between the HC and UHR/PD groups, albeit insignificant difference (adjusted p > 0.05) between the UHR and the PD groups. It should be noticed that all electrodes with significant MMN difference were located in the fronto-central area.
Dynamical Network (DNMnet)
The neuronal signal under standard stimuli is supposed to obey the dynamics in Eq. 1, whereas the corrected epochs after preprocessing follow Eq. 2. Criticality is defined as when the dynamics is around a codimension-1 local bifurcation (Chen et al., 2012). The network of electrodes can be partitioned into a DNM group and a non-DNM group (Chen et al., 2012) by measuring the fluctuations of signals and their correlations between electrodes for each sample. The DNMnet is the leading network for complex systems that drives the system toward or away from critical states. Two conditions for constructing the DNMnet were used in this study:
1. Any member of the nodes in DNMnet is highly fluctuating around a critical point.
2. Any edge in the DNMnet becomes very strong around the critical state.
The one-sided paired-sample t-test and the one-sided Wilcoxon rank-sum test were used for selected nodes and edges, respectively. We selected nodes and edges with significant statistical difference between HC and PD groups. Significance was set at
We remark that the Lyapunov Exponent is also a possible measure for detecting criticality. We note that the dynamical network we used here refers to the leading subnetwork (Chen et al., 2012). In the celebrated paper on synchronization (Arenas et al., 2008), the dynamical network is considered as the whole system of the interacting dynamical units. In this manuscript, most of the time we use the notation the DNMnet to avoid the confusion.
Measures for the Criticality
When calculating the DNMIndex using Eq. 3, the corrected epochs were used as the signal. Nodes and edges in the DNMnet were considered.
We denote a network as
where
is the normalized mutual information over the entire network. Mutual information
where
is the normalized mutual information exiting each node. We use the full network between nodes in DNMnet to calculate the DE and NE. If the brain works around a critical state, some increasing mutual information will expand their distribution density on the network. Thus, DE and NE are larger at a critical state than at non-critical states. High entropy also reflects a possibility that the brain can send information to different brain regions in time to deal with various stimuli.
For the CTE defined in Eq. 5, every pair between 64 electrodes is considered to construct the causality patterns in (Figures 2C–E). CTE is also calculated under Gaussian approximation as
Estimation of Psychotic Risk
Using the knowledge of the DNMnet after dynamical network analysis, we applied an ensemble classification on the EEG data to estimate the risk index for psychosis. A flowchart of the risk estimation is shown in Supplementary Figure S2.
We assume that there are
where
Statistical Analyses
We used SPSS (IBM Corp., New York, United States) and MATLAB 9.3.0 (MathWorks Inc.) for statistical analyses. For demographic and clinical data, we performed a chi-squared test, independent t-tests, and analysis of variance (ANOVA) for comparison among groups. Bonferroni correction was performed in post-hoc analyses of ANOVA. For EEG data, we performed paired-sample t-tests and Wilcoxon rank-sum tests to compare difference in the MMN, DNM measures, and risks between different groups. When we quantified an alternative hypothesis of a one-side inequality, such as some index with HC > PD, we used the one-side Wilcoxon rank-sum tests. While we quantified an alternative hypothesis of a two-side inequality, such as some index with UHR≠PD (i.e., UHR < PD or UHR > PD), we used the two-side Wilcoxon rank-sum tests. False discovery rate (FDR) was also controlled for multiple comparisons (Benjamini and Hochberg, 1995). Analysis of covariance (ANCOVA) with age, premorbid IQ, and antipsychotic dose as covariates were also conducted, which showed that they did not affect the difference of measures for criticality between groups.
Data Availability Statement
The original contributions presented in the study are included in the article/Supplementary Material, further inquiries can be directed to the corresponding authors.
Ethics Statement
The studies involving human participants were reviewed and approved by the Research Ethics Committee of the Faculty of Medicine, The University of Tokyo (approval No. 629, 2226). Written informed consent to participate in this study was provided by the participants.
Author Contributions
JS, KIK, and KA designed the study. KEK, MT, MF, KU, DK, TA, and KIK performed the experiments and collected the data. JS, LC, and KA designed the model. JS and KEK analyzed the data, and performed the calculations. JS, KEK, and KA wrote the manuscript. All authors discussed the results and revised the manuscript.
Funding
This work was supported by the Japan Science and Technology Agency (Moonshot R&D Grant Number JPMJMS2021); Japan Society for the Promotion of Science (JSPS KAKENHI under Grant Numbers JP20H05921, JP16H06395, JP16H06399, JP16K21720, JP18K07588, and JP15H05707); Japan Agency for Medical Research and Development (AMED under Grant Numbers JP21dm0207069, JP21dm0307001, JP21dm0307004, and JP21dm0307009); National Key R&D Program of China (No. 2017YFA0505500); National Natural Science Foundation of China (NSFC No. 61403363 and 11901272); and Shanghai Municipal Science and Technology Major Project (No. 2017SHZDZX01). This work was supported in part by UTokyo Center for Integrative Science of Human Behavior (CiSHuB), Instiute of AI and Beyond of UTokyo, and by the International Research Center for Neurointelligence (WPI-IRCN) at The University of Tokyo Institutes for Advanced Study (UTIAS).
Conflict of Interest
KIK reports grants from Lily, grants from MSD, grants and personal fees from Astellas, grants and personal fees from Takeda, grants and personal fees from Dainippon-Sumitomo, grants from Novartis, grants from Tanabe-Mitsubishi, grants from Eisai, grants and personal fees from Otsuka, grants from Shionogi, grants from Ono Pharma, personal fees from Fuji-film-Wako, personal fees from Yoshitomi, personal fees from Kyowa, personal fees from Janssen, and personal fees from Meiji Seika Pharma, outside the submitted work during the past 36 months. KA reports grants and personal fees from KKE, grants and personal fees from NEC, grants from Sysmex, personal fees from Novo Nordisk Japan, and grants and personal fees from Toyota Central R&D Labs., outside the submitted work during the past 36 months.
The remaining authors declare that the research was conducted in the absence of any commercial or financial relationships that could be construed as a potential conflict of interest.
Publisher’s Note
All claims expressed in this article are solely those of the authors and do not necessarily represent those of their affiliated organizations, or those of the publisher, the editors and the reviewers. Any product that may be evaluated in this article, or claim that may be made by its manufacturer, is not guaranteed or endorsed by the publisher.
Supplementary Material
The Supplementary Material for this article can be found online at: https://www.frontiersin.org/articles/10.3389/fnetp.2021.755685/full#supplementary-material
References
Arenas, A., Díaz-Guilera, A., Kurths, J., Moreno, Y., and Zhou, C. (2008). Synchronization in Complex Networks. Phys. Rep. 469 (3), 93–153. doi:10.1016/j.physrep.2008.09.002
Beggs, J. (2015). Editorial: Can There Be a Physics of the Brain. Phys. Rev. Lett. 114 (22), 220001. doi:10.1103/physrevlett.114.220001
Beggs, J. M., and Plenz, D. (2003). Neuronal Avalanches in Neocortical Circuits. J. Neurosci. 23 (35), 11167–11177. doi:10.1523/jneurosci.23-35-11167.2003
Beggs, J. M., and Timme, N. (2012). Being Critical of Criticality in the Brain. Front. Physio. 3, 163. doi:10.3389/fphys.2012.00163
Benjamini, Y., and Hochberg, Y. (1995). Controlling the False Discovery Rate: A Practical and Powerful Approach to Multiple Testing. J. R. Stat. Soc. Ser. B (Methodological) 57 (1), 289–300. doi:10.1111/j.2517-6161.1995.tb02031.x
Bodatsch, M., Brockhaus-Dumke, A., Klosterkötter, J., and Ruhrmann, S. (2015). Forecasting Psychosis by Event-Related Potentials-Systematic Review and Specific Meta-Analysis. Biol. Psychiatry 77 (11), 951–958. doi:10.1016/j.biopsych.2014.09.025
Braeutigam, S., Dima, D., Frangou, S., and James, A. (2018). Dissociable Auditory Mismatch Response and Connectivity Patterns in Adolescents with Schizophrenia and Adolescents with Bipolar Disorder with Psychosis: A Magnetoencephalography Study. Schizophrenia Res. 193, 313–318. doi:10.1016/j.schres.2017.07.048
Chen, L., Liu, R., Liu, Z.-P., Li, M., and Aihara, K. (2012). Detecting Early-Warning Signals for Sudden Deterioration of Complex Diseases by Dynamical Network Biomarkers. Sci. Rep. 2, 342. doi:10.1038/srep00342
Chung, D. T., Ryan, C. J., Hadzi-Pavlovic, D., Singh, S. P., Stanton, C., and Large, M. M. (2017). Suicide Rates after Discharge from Psychiatric Facilities. JAMA Psychiatry 74 (7), 694–702. doi:10.1001/jamapsychiatry.2017.1044
Cocchi, L., Gollo, L. L., Zalesky, A., and Breakspear, M. (2017). Criticality in the Brain: A Synthesis of Neurobiology, Models and Cognition. Prog. Neurobiol. 158, 132–152. doi:10.1016/j.pneurobio.2017.07.002
Dakos, V., and Bascompte, J. (2014). Critical Slowing Down as Early Warning for the Onset of Collapse in Mutualistic Communities. Proc. Natl. Acad. Sci. USA 111 (49), 17546–17551. doi:10.1073/pnas.1406326111
Delorme, A., and Makeig, S. (2004). EEGLAB: an Open Source Toolbox for Analysis of Single-Trial EEG Dynamics Including Independent Component Analysis. J. Neurosci. Methods 134 (1), 9–21. doi:10.1016/j.jneumeth.2003.10.009
Dima, D., Frangou, S., Burge, L., Braeutigam, S., and James, A. C. (2012). Abnormal Intrinsic and Extrinsic Connectivity within the Magnetic Mismatch Negativity Brain Network in Schizophrenia: a Preliminary Study. Schizophrenia Res. 135, 23–27. doi:10.1016/j.schres.2011.12.024
Erickson, M. A., Ruffle, A., and Gold, J. M. (2016). A Meta-Analysis of Mismatch Negativity in Schizophrenia: from Clinical Risk to Disease Specificity and Progression. Biol. Psychiatry 79 (12), 980–987. doi:10.1016/j.biopsych.2015.08.025
Haldeman, C., and Beggs, J. M. (2005). Critical Branching Captures Activity in Living Neural Networks and Maximizes the Number of Metastable States. Phys. Rev. Lett. 94, 058101. doi:10.1103/PhysRevLett.94.058101
Kantrowitz, J. T., Epstein, M. L., Lee, M., Lehrfeld, N., Nolan, K. A., Shope, C., et al. (2018). Improvement in Mismatch Negativity Generation during D-Serine Treatment in Schizophrenia: Correlation with Symptoms. Schizophrenia Res. 191, 70–79. doi:10.1016/j.schres.2017.02.027
Kéfi, S., Dakos, V., Scheffer, M., Van Nes, E. H., and Rietkerk, M. (2013). Early Warning Signals Also Precede Non-catastrophic Transitions. Oikos 122 (5), 641–648. doi:10.1111/j.1600-0706.2012.20838.x
Koike, S., Takano, Y., Iwashiro, N., Satomura, Y., Suga, M., Nagai, T., et al. (2013). A Multimodal Approach to Investigate Biomarkers for Psychosis in a Clinical Setting: the Integrative Neuroimaging Studies in Schizophrenia Targeting for Early Intervention and Prevention (IN-STEP) Project. Schizophrenia Res. 143 (1), 116–124. doi:10.1016/j.schres.2012.11.012
Kuehn, C. (2011). A Mathematical Framework for Critical Transitions: Bifurcations, Fast-Slow Systems and Stochastic Dynamics. Physica D: Nonlinear Phenomena 240 (12), 1020–1035. doi:10.1016/j.physd.2011.02.012
Lee, H., Golkowski, D., Jordan, D., Berger, S., Ilg, R., Lee, J., et al. (2019). Relationship of Critical Dynamics, Functional Connectivity, and States of Consciousness in Large-Scale Human Brain Networks. NeuroImage 188, 228–238. doi:10.1016/j.neuroimage.2018.12.011
Lesterhuis, W. J., Bosco, A., Millward, M. J., Small, M., Nowak, A. K., and Lake, R. A. (2017). Dynamic versus Static Biomarkers in Cancer Immune Checkpoint Blockade: Unravelling Complexity. Nat. Rev. Drug Discov. 16 (4), 264–272. doi:10.1038/nrd.2016.233
Li, M., Zeng, T., Liu, R., and Chen, L. (2013). Detecting Tissue-specific Early Warning Signals for Complex Diseases Based on Dynamical Network Biomarkers: Study of Type 2 Diabetes by Cross-Tissue Analysis. Brief. Bioinform. 15 (2), 229–243. doi:10.1093/bib/bbt027
Liu, R., Chen, P., Aihara, K., and Chen, L. (2015). Identifying Early-Warning Signals of Critical Transitions with strong Noise by Dynamical Network Markers. Sci. Rep. 5, 17501. doi:10.1038/srep17501
Liu, R., Li, M., Liu, Z.-P., Wu, J., Chen, L., and Aihara, K. (2012). Identifying Critical Transitions and Their Leading Biomolecular Networks in Complex Diseases. Sci. Rep. 2, 813. doi:10.1038/srep00813
Liu, R., Wang, X., Aihara, K., and Chen, L. (2014b). Early Diagnosis of Complex Diseases by Molecular Biomarkers, Network Biomarkers, and Dynamical Network Biomarkers. Med. Res. Rev. 34 (3), 455–478. doi:10.1002/med.21293
Liu, R., Yu, X., Liu, X., Xu, D., Aihara, K., and Chen, L. (2014a). Identifying Critical Transitions of Complex Diseases Based on a Single Sample. Bioinformatics 30 (11), 1579–1586. doi:10.1093/bioinformatics/btu084
Liu, X., Chang, X., Leng, S., Tang, H., Aihara, K., and Chen, L. (2019). Detection for Disease Tipping Points by Landscape Dynamic Network Biomarkers. Natl. Sci. Rev. 6, 775–785. doi:10.1093/nsr/nwy162
Massobrio, P., de Arcangelis, L., Pasquale, V., Jensen, H. J., and Plenz, D. (2015). Criticality as a Signature of Healthy Neural Systems. Front. Syst. Neurosci. 9, 22. doi:10.3389/fnsys.2015.00022
Nagai, T., Tada, M., Kirihara, K., Yahata, N., Hashimoto, R., Araki, T., et al. (2013). Auditory Mismatch Negativity and P3a in Response to Duration and Frequency Changes in the Early Stages of Psychosis. Schizophr Res. 150 (2-3), 547–554. doi:10.1016/j.schres.2013.08.005
Paulus, M. P. (2015). Pragmatism Instead of Mechanism. JAMA Psychiatry 72 (7), 631–632. doi:10.1001/jamapsychiatry.2015.0497
Perez, V. B., Tarasenko, M., Miyakoshi, M., Pianka, S. T., Makeig, S. D., Braff, D. L., et al. (2017). Mismatch Negativity Is a Sensitive and Predictive Biomarker of Perceptual Learning during Auditory Cognitive Training in Schizophrenia. Neuropsychopharmacol 42 (11), 2206–2213. doi:10.1038/npp.2017.25
Petermann, T., Thiagarajan, T. C., Lebedev, M. A., Nicolelis, M. A., Chialvo, D. R., and Plenz, D. (2009). Spontaneous Cortical Activity in Awake Monkeys Composed of Neuronal Avalanches. Proc. Natl. Acad. Sci. U S A. 106 (37), 15921–15926. doi:10.1073/pnas.0904089106
Pine, D. S., and Leibenluft, E. (2015). Biomarkers with a Mechanistic Focus. JAMA Psychiatry 72 (7), 633–634. doi:10.1001/jamapsychiatry.2015.0498
Ranlund, S., Adams, R. A., Díez, Á., Constante, M., Dutt, A., Hall, M. H., et al. (2016). Impaired Prefrontal Synaptic Gain in People with Psychosis and Their Relatives during the Mismatch Negativity. Hum. Brain Mapp. 37 (1), 351–365. doi:10.1002/hbm.23035
Richard, A., Boullu, L., Herbach, U., Bonnafoux, A., Morin, V., Vallin, E., et al. (2016). Single-cell-based Analysis Highlights a Surge in Cell-To-Cell Molecular Variability Preceding Irreversible Commitment in a Differentiation Process. Plos Biol. 14 (12), e1002585. doi:10.1371/journal.pbio.1002585
Scheffer, M., Bascompte, J., Brock, W. A., Brovkin, V., Carpenter, S. R., Dakos, V., et al. (2009). Early-warning Signals for Critical Transitions. Nature 461 (7260), 53–59. doi:10.1038/nature08227
Scheffer, M., Carpenter, S., Foley, J. A., and Folke, B. (2001). Catastrophic Shifts in Ecosystems. Nature 413 (6856), 591–596. doi:10.1038/35098000
Scheffer, M. (2009). Critical Transitions in Nature and Society. Princeton, NJ: Princeton University Press.
Serrano-Guerrero, E., Ruiz-Veguilla, M., Martín-Rodríguez, A., and Rodríguez-Testal, J. F. (2020). Inflexibility of Beliefs and Jumping to Conclusions in Active Schizophrenia. Psychiatry Res. 284, 112776. doi:10.1016/j.psychres.2020.112776
Shew, W. L., Yang, H., Petermann, T., Roy, R., and Plenz, D. (2009). Neuronal Avalanches Imply Maximum Dynamic Range in Cortical Networks at Criticality. J. Neurosci. 29 (49), 15595–15600. doi:10.1523/JNEUROSCI.3864-09.2009
Shew, W. L., Yang, H., Yu, S., Roy, R., and Plenz, D. (2011). Information Capacity and Transmission Are Maximized in Balanced Cortical Networks with Neuronal Avalanches. J. Neurosci. 31 (1), 55–63. doi:10.1523/JNEUROSCI.4637-10.2011
Shi, J., Li, T., and Chen, L. (2016). Towards a Critical Transition Theory under Different Temporal Scales and Noise Strengths. Phys. Rev. E 93 (3), 032137. doi:10.1103/PhysRevE.93.032137
Keywords: critical brain hypothesis, dynamical network analysis, criticality of the neuronal network, psychotic disorder, schizophrenia, mismatch negativity, risk of mental disorder, dynamical network marker
Citation: Shi J, Kirihara K, Tada M, Fujioka M, Usui K, Koshiyama D, Araki T, Chen L, Kasai K and Aihara K (2022) Criticality in the Healthy Brain. Front. Netw. Physiol. 1:755685. doi: 10.3389/fnetp.2021.755685
Received: 09 August 2021; Accepted: 15 December 2021;
Published: 18 January 2022.
Edited by:
Eckehard Schöll, Technische Universität Berlin, GermanyReviewed by:
Keiichi Kitajo, National Institute for Physiological Sciences (NIPS), JapanRico Berner, Humboldt University of Berlin, Germany
Copyright © 2022 Shi, Kirihara, Tada, Fujioka, Usui, Koshiyama, Araki, Chen, Kasai and Aihara. This is an open-access article distributed under the terms of the Creative Commons Attribution License (CC BY). The use, distribution or reproduction in other forums is permitted, provided the original author(s) and the copyright owner(s) are credited and that the original publication in this journal is cited, in accordance with accepted academic practice. No use, distribution or reproduction is permitted which does not comply with these terms.
*Correspondence: Jifan Shi, c2hpamlmYW5AaXJjbi5qcA==; Kiyoto Kasai, a2FzYWltZEBnbWFpbC5jb20=; Kazuyuki Aihara, YWloYXJhQHNhdC50LnUtdG9reW8uYWMuanA=