 Isabelle Ayoub
 Haikady N. Nagaraja2
94% of researchers rate our articles as excellent or good
Learn more about the work of our research integrity team to safeguard the quality of each article we publish.
Find out more
BRIEF RESEARCH REPORT article
Front. Nephrol., 27 January 2022
Sec. Glomerular disease
Volume 1 - 2021 | https://doi.org/10.3389/fneph.2021.797431
Background: Proteinuria is a known risk factor for progression of chronic kidney disease. Proteinuria magnitude can be estimated by measuring spot urine protein-to-creatinine ratio (least accurate), 24-h urine collection for protein (24 P), or 24-h protein–creatinine ratio (24 PCR). The MDRD study found that 24 P measured at baseline was the strongest single predictor of the rate of GFR decline during study follow-up. However, predictive powers of 24 P and 24 PCR have not been compared in the literature. The current study addresses this question using the MDRD cohort data.
Methods: The study is a retrospective analysis of prospectively collected data from the MDRD cohort using simple and multiple regression models. Slope of measured GFR (mGFR) over time was used as the response and models that included baseline 24 PCR or 24 P were compared for the entire sample and for subgroups formed by restricting the values of 24-h creatinine and 24 P.
Results: Log 24 P and Log 24 PCR correlated almost equally with mGFR slope. However, in simple linear regression models and multivariable linear regression models adjusting for age and sex, the model with 24 PCR had a higher R2 than the corresponding one that had 24 P except for the subgroup 24 P < 1 g.
Conclusion: We observe that 24 PCR may be a better marker of proteinuria magnitude in predicting decline in kidney function compared to 24 P in particular for patients with 24 P ≥ 1. This finding needs validation in prospective clinical trials.
Proteinuria is a known risk factor for progression of chronic kidney disease (1, 2). Proteinuria magnitude can be estimated by measuring a randomly collected spot urine protein-to-creatinine ratio (least accurate), 24-h urine collection for protein (24 P) or the protein-to-creatinine ratio from a 24-h urine collection (24 PCR). A random spot urine PCR cannot reliably assess 24 P or changes in 24 P (3). The time of the random urine collection, the degree of proteinuria, and the underlying cause of kidney disease affect the accuracy of random spot urine PCR (4, 5). In clinical trials, 24 P or 24 PCR are being used to quantify proteinuria as an entry criterion and for trial endpoints. For instance, the Supportive Versus Immunosuppressive Therapy for the Treatment of Progressive IgA Nephropathy (STOP IgAN) trial (6) used 24 P to determine inclusion but used 24 PCR to define study endpoints. Conversely, the Abatacept and Cyclophosphamide Combination Therapy for Lupus Nephritis (ACCESS) trial used 24 PCR for both study entry and endpoints (7). The Modification of Diet in Renal Disease (MDRD) study found that 24 P measured at baseline was an independent predictor of glomerular filtration rate (GFR) decline during study follow-up (8). Other studies in glomerular diseases have shown that 24 P, sustained proteinuria (24 P), and time-averaged proteinuria (24 P) after treatment were predictors of long-term GFR decline (9–13).
The advantage that 24 PCR has over 24 P is that it corrects for either over- or under-collection of an intended 24-h urine sample. However, as mentioned in several studies, a 24 P can be adjusted based on the measured:expected creatinine ratio in the intended 24-h sample (3, 14, 15). Unfortunately, this adjustment is not routinely applied in clinical trials and perhaps rarely in clinical practice. Whether 24 P or 24 PCR is the better predictor of GFR trajectory has not been reported. Our hypothesis is that 24 PCR is a better predictor of GFR decline than 24 P. To the best of our knowledge, the present work will be the first to assess whether 24 P or 24 PCR is a better predictor of GFR decline. The strength of this study is that GFR was measured directly and not estimated from serum creatinine levels.
This is a retrospective analysis of prospectively collected data. Slopes of measured GFR (mGFR) over time as a function of baseline 24 PCR and 24 P were compared. The study was approved by The Ohio State University Institutional Review Board.
The study population included all patients from the MDRD trial who had a baseline 24-h urine protein and urine creatinine level, and an mGFR at baseline and at the end of the study. Table 1 and Supplementary Tables 1, 2 describe patient characteristics.
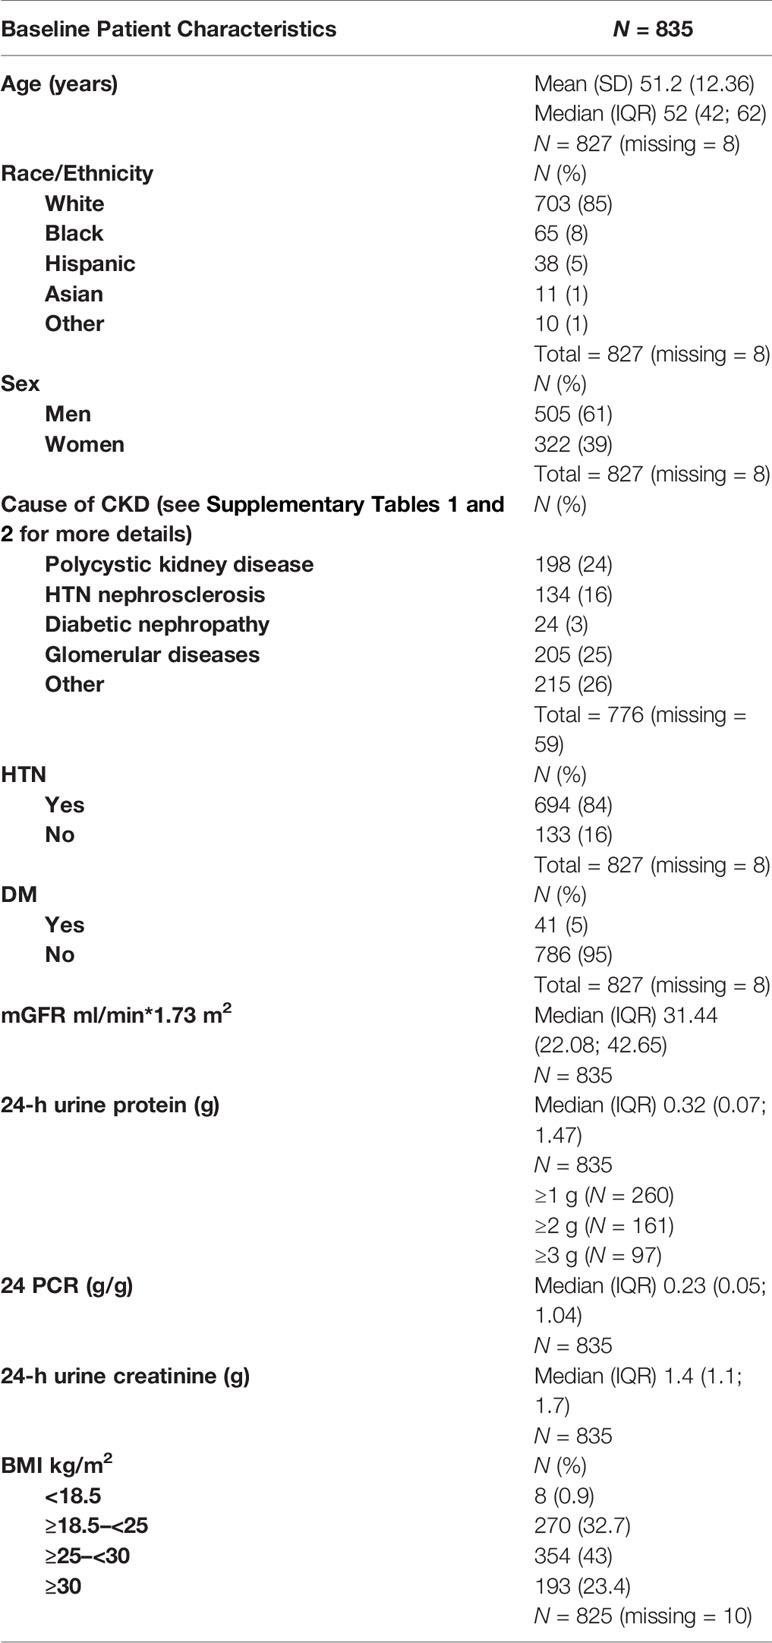
Table 1 Patient characteristics.
GFR was measured as the renal clearance of 125I- iothalamate (16, 17). Baseline mGFR was the last mGFR in the baseline period of the MDRD study. 24 P and 24 PCR were measured from 24-h urine samples. The baseline 24 P and PCR were measured from the last 24-h urine collection in the baseline period of the MDRD study. Expected 24-h urine creatinine levels were calculated on 827 patients with available baseline age and weight and were compared with the measured 24-h urine creatinine levels to determine the completeness of the 24-h urine collections (15). A total of 827 patients (99.7%) had an intended 24-h urine that was ≥50% complete, thereby reliably estimating the PCR of a complete 24-h urine collection (3). 24-h P were not corrected as this is not routinely applied in clinical practice.
The primary goal of this study was to compare the rate of decline in kidney function in an individual according to 24 PCR versus 24-h P. The secondary goal was to examine the effect of age, sex, race, BMI, and baseline mGFR on proteinuria and decline in kidney function.
Individual linear regression lines were fit to determine the rate of decline in GFR for each subject. Association between the GFR slope and baseline values of log (24 P) and log (24 PCR) were examined using Pearson correlation coefficient. Log scale for 24 P and 24 PCR was used to improve a normal fit to the data (4). Significance of correlations was established using t-tests, and to determine the equality of dependent correlations, Steiger’s test (1980, Eq. 14) was used (18). Scatter plot of 24 PCR versus 24 P was used to examine the variability in the 24 PCR as a function of 24 P that revealed a systematic sex effect (Supplement 2). Association between log (24 PCR) and log (24 P) and sex was examined using multiple linear regression (Supplement 3). Association between the GFR slope and sex, race/ethnicity, BMI, age, and baseline values of mGFR, 24 P, and 24 PCR was examined using analysis of variance or simple linear regression methods, as appropriate. Using the covariates with significant association, multiple regression models with and without interactions were developed to predict the slope of GFR decline. A four-factor model with sex, age, 24 P, and 24 PCR, and their interactions as predictors with all significant predictors, developed for the entire data set was checked for outliers and normality of residuals. After removing 11 outliers with studentized residuals outside (-4,4), this model was used to compare the predictive powers of baseline 24 P and 24 PCR for the entire data set, and for two subgroups: (a) subjects with baseline 24-h urine creatinine values ≤ 800 or ≥ 1,200 mg and (b) its subsets with baseline 24 P values of <1 g, ≥1 g, ≥2 g, and ≥3 g. The subgroup excluding 24-h urine creatinine values near 1,000 mg (1 g) was selected since the PCR value would have a denominator of 1 and therefore would strongly approximate the 24-h P value. This investigation was repeated for single- and three-factor sub-models that included 24 P or 24 PCR as predictors. Prediction equations based on various models were generated. Vuong’s test, implemented using the nonnest2 package in R (19), was used to compare non-nested three-factor models (20). All other statistical analyses were done using JMP 13 (SAS Institute, Cary, NC). Level of significance was set at 0.05 and no adjustments were made for multiple testing.
The final study population included 835 patients from the MDRD cohort that had baseline 24 P, 24 PCR, and an mGFR at baseline and at the end of the study. The mean duration of study follow-up was 2.2 years. There was a statistically significant correlation between GFR slope and log (24 P) (Pearson correlation, r = −0.2946, p < 0.0001), and between GFR slope and log (24 PCR) (r = −0.2929, p < 0.0001). Of these 835 patients, we then excluded 254 who had 24-h urine creatinine between 800 and 1,200 mg to eliminate concordance between 24 P and 24 PCR. In the excluded cohort, there was a near-perfect association between 24 PCR and 24 P and the association between these variables and GFR slope was identical (Supplement 4). For the sub-cohort of 581 patients, there was a statistically significant correlation between GFR slope and log (24 P) (r = −0.2677, p < 0.0001) and between GFR slope and log (24 PCR) (r = −0.2693, p < 0.0001). However, these correlations were not significantly different from each other (Table 2, third column). This result was consistent as well across the following subgroups: 24 P <1 g, ≥1 g, ≥2 g, and ≥3 g (Table 2). Nonetheless, in all subgroups except for 24 P <1 g, the correlation between GFR slope and log (24 PCR) was consistently higher than the one between GFR slope and log (24 P), and the difference in correlations increased as the proteinuria cutoff increased.
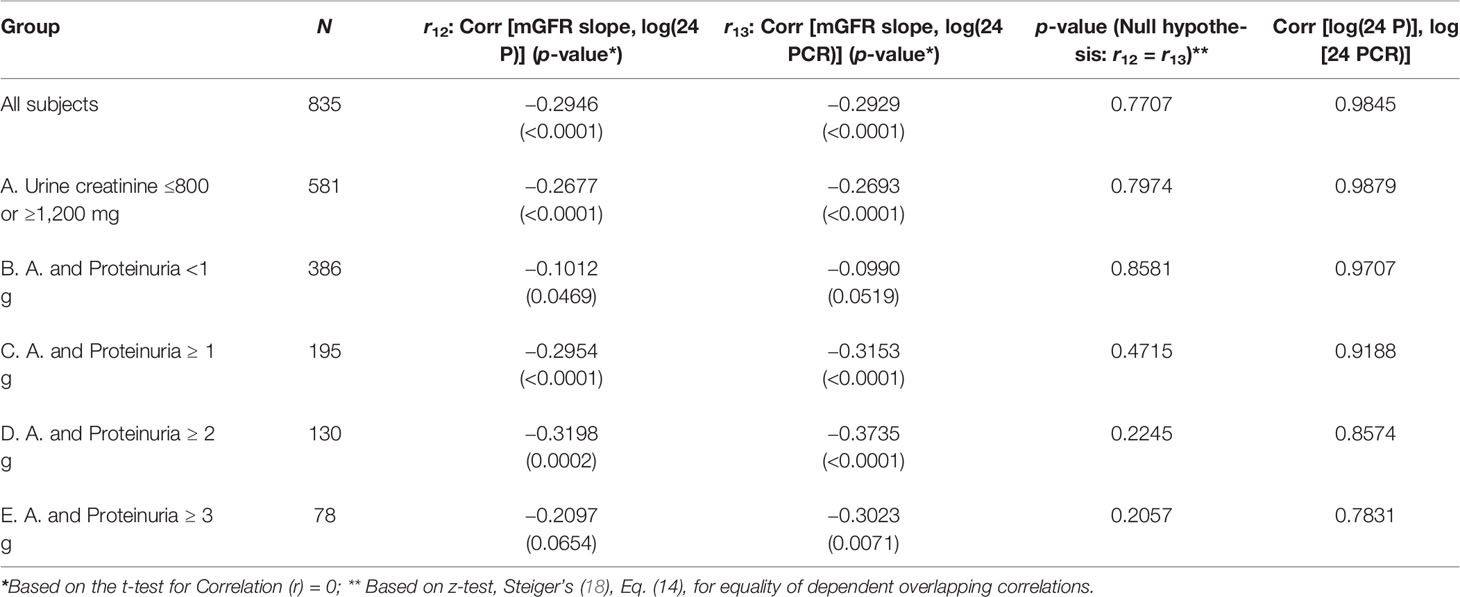
Table 2 Comparisons of pearson correlations (Corr) of variables with overlapping correlations.
Using simple linear regression analysis, Model R2 was consistently higher in model 1 (24 PCR) compared to model 1 (24 P) except for the subgroup 24 P <1 g where R2 was higher in model 1 (24 P) (Table 3A). The associations between GFR slope and the variables sex, race/ethnicity, age, BMI, and baseline mGFR were examined individually. Only age (r = 0.09, p = 0.007) and sex [mean GFR slope (Female–Male) = 0.0875, p = 0.029] were also significantly associated with GFR slope. The variables age, sex, 24 PCR, 24 P, and the only 2 significant interactions (sex * 24 P and sex * 24 PCR) were all significant predictors of the full model 2 developed for the entire cohort (Table 3B). It is worth noting that in this full model that contains both 24 PCR and 24 P, the p-value of the slope estimate for 24 PCR was significant across all subgroups except for 24 P <1 g and ≥3 g and it was lower than that of 24 P, which was not significant in all subgroups. Furthermore, sex * 24 PCR interaction effect had smaller p-values than that of sex * 24 P in all cases (details not shown) and it was significant in more subgroups (Table 3B). Finally model 3 (24 PCR) that included 24 PCR, age, sex, and the interaction (sex * 24 PCR) was compared to model 3 (24 P) that included 24 P, age, sex, and the interaction (sex * 24 P) (Table 3C). Model R2 was higher in model 3 (24 PCR) compared to model 3 (24 P) except for the subgroup 24 P <1 g where both R2 were very small and similar. Although in the six different pairs of non-nested models considered in Table 3C, model R2 in model 3 (24 PCR) and model 3 (24 P) are distinguishable except for subgroup 24 P<1 g, the Vuong test showed a significant superiority of model 3 (24 PCR) over model 3 (24 P) only for the sub-cohort (urine creatinine (≤800 mg, ≥1,200 mg) but not in the subgroups of proteinuria where the p-value was close to being significant (Table 3C). Regression equations for the entire cohort in models 1, 2, and 3 are summarized in Supplementary Table 3.
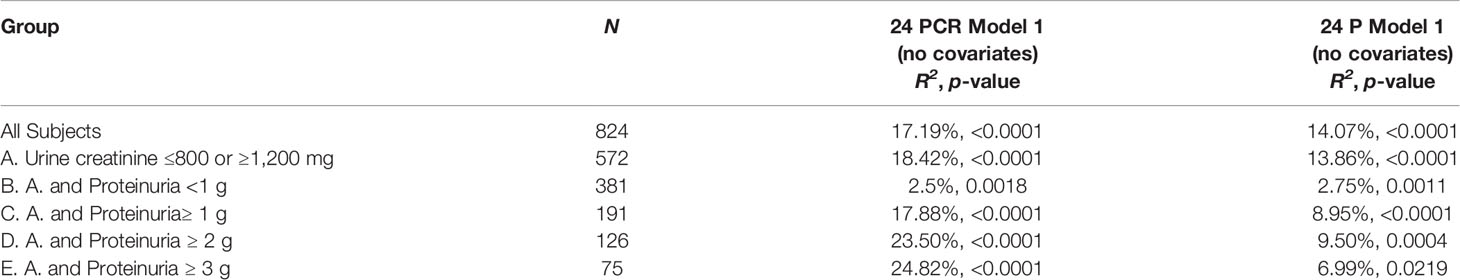
Table 3A Simple linear regression models (24 PCR Model 1 and 24 P Model 1): Summary findings.
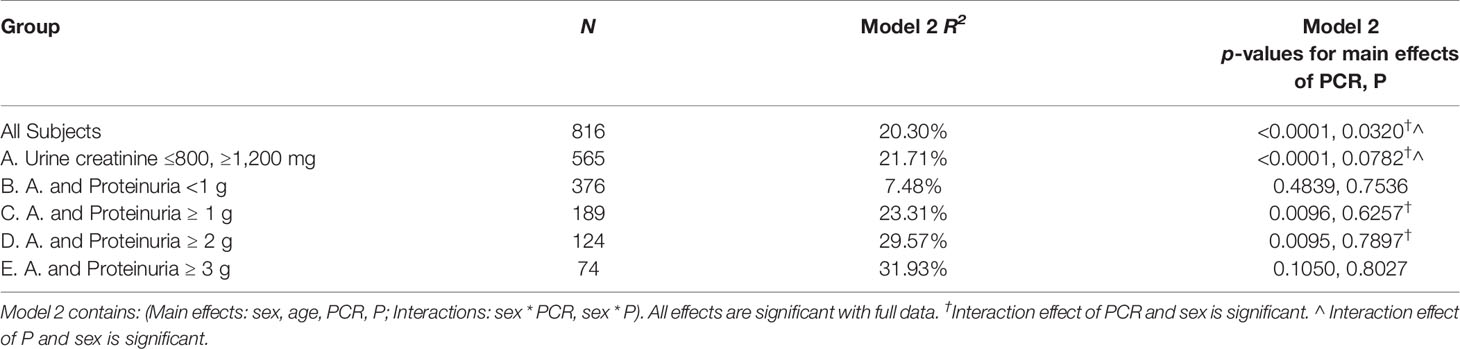
Table 3B Full multivariable linear regression model 2: Summary findings.

Table 3C Multivariable linear regression model 3: Summary findings.
Proteinuria is an established clinical biomarker of prognosis in chronic kidney diseases (2). Nephrotic range proteinuria is arbitrarily defined as 24 P ≥ 3.5 g (21). At least in clinical trials, there is no consensus as to whether 24 P or 24 PCR represents a better criterion for inclusion and a better endpoint. Using the MDRD cohort, we found that 24 PCR might be a more favorable marker compared to 24 P in predicting decline in kidney function. Confounders and interactions will not be specifically discussed in detail although they are important; however, they are not directly relevant to the main goal of this work.
Log 24 P and Log 24 PCR correlated with each other and separately almost equally to mGFR slope. However, in simple linear regression models (24 PCR model 1 and 24 P model 1) and multivariable linear regression models adjusting for age and sex (24 PCR model 3 and 24 P model 3), the model that had 24 PCR had a higher R2 than the corresponding one that had 24 P except for the subgroup 24 P <1 g. When both 24 PCR and 24 P were included in the same model 2, the p-values for the slope estimate of 24 PCR and its interaction were lower and more frequently significant compared to the 24 P ones. In addition, Vuong test in Model 3 showed that the model that had 24 PCR was a better fit than that of 24 P with statistical significance for the sub-cohort (24-h urine creatinine ≤800 mg or ≥1,200 mg). One way of thinking about the 24 PCR being a better predictor can be speculated as follows: all factors held constant, a 24 P adjusted for 24-h creatinine (24 PCR) is actually adjusting proteinuria for the size of the individual’s nephrons. For any given 24 P, 24 PCR can vary enormously from individual to individual. Filtered protein is known to induce tubulo-interstitial damage (22–26). It is plausible that for a given amount of filtered protein load, larger nephrons are less susceptible to damage than smaller nephrons given the difference in ratio of protein load to glomerular basement membrane surface area.
As mentioned earlier, in the sub-group 24 P <1, the model R2 in both 24 P and 24 PCR model 1 and model 3 was lower and almost equal. On the other hand, R2 in 24 PCR model 1 and 3 increased progressively in the sub-groups of proteinuria (≥1, 2, and 3) compared to the entire cohort and was higher than the corresponding R2 in 24 P models 1 and 3. These observations suggest that for a proteinuric endpoint of <1 g/day, whether we use 24 P or 24 PCR is the same. However, for therapeutic decisions and especially if the 24 P ≥1, it may be more reasonable to use 24 PCR for a proteinuria threshold to avoid over- or under-treating. For simplicity and moving forward, we propose establishing 24 PCR as a standard for proteinuria entry criterion and as a marker for endpoint in clinical trials.
This study has several limitations. It is a retrospective analysis of the MDRD cohort. The cohort was not balanced in terms of cause of chronic kidney disease and did not include active immune-mediated kidney diseases with modest or marked proteinuria. It is also known that GFR progression in heterogeneous populations may not be linear. However, in spite of the limited MDRD individual level data, the use of linear regression models to estimate the slope of mGFR results in highly interpretable coefficient compared to more complex models. Although we attempted to adjust for the potential effect of relevant covariates such as age and sex, we acknowledge that other factors not included may still play a confounding role such as blood pressure profile and medications received throughout the study follow-up. The sample size in the proteinuria subgroups was small and likely affected the significance of the Vuong test for better model fitting. The difference between 24 P and 24 PCR as well as their potential clinical implications were not examined. This would have included eligibility for enrollment in clinical trials as well as standard of care management based on 24 PCR versus 24 P cutoff in a cohort of patients with active proteinuric glomerular diseases.
In summary, we observe that 24 PCR may be a better marker of proteinuria magnitude in predicting decline in kidney function compared to 24 P in particular for patients with 24 P ≥1. Certainly, this finding needs validation in prospective clinical trials and cannot be assumed to apply to active and non-active proteinuric glomerular diseases.
Publicly available datasets were analyzed in this study. This data can be found here: MDRD dataset.
The studies involving human participants were reviewed and approved by The Ohio State University Institutional Review Board. Written informed consent for participation was not required for this study in accordance with the national legislation and the institutional requirements.
IA: Design, analysis and writing. HN: Data analysis and writing. RK: Writing and editing. BR: Editing. UB: Design, analysis and editing. All authors contributed to the article and approved the submitted version.
BR reports personal fees from Aurinia, Calliditas, ChemoCentryx, Retrophin, Novartis, Morphosys, EMD Serono, Bristol Myers Squibb, Janssen, Omeros, and AstraZeneca; non-financial support from Lupus Foundation of America; and grants from the National Institutes of Health (NIH), outside the submitted work.
The remaining authors declare that the research was conducted in the absence of any commercial or financial relationships that could be construed as a potential conflict of interest.
All claims expressed in this article are solely those of the authors and do not necessarily represent those of their affiliated organizations, or those of the publisher, the editors and the reviewers. Any product that may be evaluated in this article, or claim that may be made by its manufacturer, is not guaranteed or endorsed by the publisher.
The Supplementary Material for this article can be found online at: https://www.frontiersin.org/articles/10.3389/fneph.2021.797431/full#supplementary-material
1. Sarnak MJ, Astor BC. Implications of Proteinuria: CKD Progression and Cardiovascular Outcomes. Adv. Chronic Kidney Dis (2011) 18:258–66. doi: 10.1053/j.ackd.2011.04.002
2. Cravedi P, Remuzzi G. Pathophysiology of Proteinuria and Its Value as an Outcome Measure in Chronic Kidney Disease. Br J Clin Pharmacol (2013) 76:516–23. doi: 10.1111/bcp.12104
3. Birmingham DJ, Rovin BH, Shidham G, Nagaraja HN, Zou X, Bissell M, et al. Spot Urine Protein/Creatinine Ratios Are Unreliable Estimates of 24 H Proteinuria in Most Systemic Lupus Erythematosus Nephritis Flares. Kidney Int (2007) 72:865–70. doi: 10.1038/sj.ki.5002421
4. Hogan MC, Reich HN, Nelson PJ, Adler SG, Cattran DC, Appel GB, et al. The Relatively Poor Correlation Between Random and 24-Hour Urine Protein Excretion in Patients With Biopsy-Proven Glomerular Diseases. Kidney Int (2016) 90:1080–9. doi: 10.1016/j.kint.2016.06.020
5. Kobayashi S, Amano H, Terawaki H, Ogura M, Kawaguchi Y, Yokoo T. Spot Urine Protein/Creatinine Ratio as a Reliable Estimate of 24-Hour Proteinuria in Patients With Immunoglobulin A Nephropathy, But Not Membranous Nephropathy. BMC Nephrol (2019) 20:306. doi: 10.1186/s12882-019-1486-8
6. Rauen T, Eitner F, Fitzner C, Sommerer C, Zeier M, Otte B, et al. Intensive Supportive Care Plus Immunosuppression in IgA Nephropathy. N Engl J Med (2015) 373:2225–36. doi: 10.1056/NEJMoa1415463
7. Group AT. Treatment of Lupus Nephritis With Abatacept: The Abatacept and Cyclophosphamide Combination Efficacy and Safety Study. Arthritis Rheumatol (2014) 66:3096–104. doi: 10.1002/art.38790
8. Peterson JC, Adler S, Burkart JM, Giecne T, Hebert LA, Hunsicker LG, et al. Blood Pressure Control, Proteinuria, and the Progression of Renal Disease. The Modification of Diet in Renal Disease Study. Ann Internal Med (1995) 123:754–62. doi: 10.7326/0003-4819-123-10-199511150-00003
9. Dall’Era M, Cisternas MG, Smilek DE, Straub L, Houssiau F, Cervera R, et al. Predictors of Long-Term Renal Outcome in Lupus Nephritis Trials: Lessons Learned From the Euro-Lupus Nephritis Cohort. Arthritis Rheumatol (2015) 67:1305–13. doi: 10.1002/art.39026
10. Tamirou F, Lauwerys BR, Dall’Era M, Mackay M, Rovin B, Cervera R, et al. A Proteinuria Cut-Off Level of 0.7 G/Day After 12 Months of Treatment Best Predicts Long-Term Renal Outcome in Lupus Nephritis: Data From the MAINTAIN Nephritis Trial. Lupus Sci Med (2015) 2:e000123. doi: 10.1136/lupus-2015-000123
11. Thompson A, Carroll K, Inker LA, Floege J, Perkovic V, Boyer-Suavet S, et al. Proteinuria Reduction as a Surrogate End Point in Trials of IgA Nephropathy. Clin J Am Soc Nephrol (2019) 14:469–81. doi: 10.2215/CJN.08600718
12. Troost JP, Trachtman H, Spino C, Kaskel FJ, Friedman A, Moxey-Mims MM, et al. Proteinuria Reduction and Kidney Survival in Focal Segmental Glomerulosclerosis. Am. J. Kidney Dis: Off J Natl Kidney Found (2021) 77:216–25. doi: 10.1053/j.ajkd.2020.04.014
13. Canney M, Barbour SJ, Zheng Y, Coppo R, Zhang H, Liu Z-H, et al. Quantifying Duration of Proteinuria Remission and Association With Clinical Outcome in IgA Nephropathy. J Am Soc Nephrol: JASN (2021) 32:436–47. doi: 10.1681/ASN.2020030349
14. Hebert LA, Birmingham DJ, Shidham G, Rovin B, Nagaraja HN, Yu CY. Random Spot Urine Protein/Creatinine Ratio is Unreliable for Estimating 24-Hour Proteinuria in Individual Systemic Lupus Erythematosus Nephritis Patients. Nephron Clin Pract (2009) 113:c177–82. doi: 10.1159/000232599
15. Glassock RJ, Fervenza FC, Hebert L, Cameron JS. Nephrotic Syndrome Redux. Nephrol Dialysis Transplant: Off. Publ. Eur. Dialysis Transplant Assoc Eur Renal Assoc (2015) 30:12–7. doi: 10.1093/ndt/gfu077
16. Levey AS, Greene T, Schluchter MD, Cleary PA, Teschan PE, Lorenz RA, et al. Glomerular Filtration Rate Measurements in Clinical Trials. Modification of Diet in Renal Disease Study Group and the Diabetes Control and Complications Trial Research Group. J Am Soc Nephrol: JASN (1993) 4:1159–71. doi: 10.1681/ASN.V451159
17. Perrone RD, Steinman TI, Beck GJ, Skibinski CI, Royal HD, Lawlor M, et al. Utility of Radioisotopic Filtration Markers in Chronic Renal Insufficiency: Simultaneous Comparison of 125I-Iothalamate, 169Yb-DTPA, 99mtc-DTPA, and Inulin. The Modification of Diet in Renal Disease Study. Am J Kidney Dis: Off J Natl. Kidney Found (1990) 16:224–35. doi: 10.1016/S0272-6386(12)81022-5
18. Steiger JH. Tests for Comparing Elements of a Correlation Matrix. psychol Bull (1980) 87(2):245–51. doi: 10.1037/0033-2909.87.2.245
19. Merkle E, You D, Schneider L, Bae S. Package Nonnest2, Tests of non-Nested Models, Version 0.5-5 (2020). Available at: https://cran.r-project.org/web/packages/nonnest2.
20. Vuong QH. Likelihood Ratio Tests for Model Selection and non-Nested Hypotheses. Econo-metrica (1989) 57:307–33. doi: 10.2307/19125571989
21. Berman LB, Schreiner GE. Clinical and Histologic Spectrum of the Nephrotic Syndrome. Am J Med (1958) 24:249–67. doi: 10.1016/0002-9343(58)90314-0
22. Barnes JL, Gorin Y. Myofibroblast Differentiation During Fibrosis: Role of NAD(P)H Oxidases. Kidney Int (2011) 79:944–56. doi: 10.1038/ki.2010.516
23. Zoja C, Morigi M, Figliuzzi M, Bruzzi I, Oldroyd S, Benigni A, et al. Proximal Tubular Cell Synthesis and Secretion of Endothelin-1 on Challenge With Albumin and Other Proteins. Am J Kidney Dis: Off J Natl Kidney Found (1995) 26:934–41. doi: 10.1016/0272-6386(95)90058-6
24. Drumm K, Bauer B, Freudinger R, Gekle M. Albumin Induces NF-kappaB Expression in Human Proximal Tubule-Derived Cells (IHKE-1). Cell. Physiol. Biochem: Int. J Exp Cell Physiol Biochem Pharmacol (2002) 12:187–96. doi: 10.1159/000066278
25. Tang S, Leung JC, Abe K, Chan KW, Chan LYY, Chan TM, et al. Albumin Stimulates Interleukin-8 Expression in Proximal Tubular Epithelial Cells In Vitro and In Vivo. J Clin Invest (2003) 111:515–27. doi: 10.1172/JCI16079
Keywords: proteinuria, 24h protein, 24h protein/creatinine, progression of kidney disease, measured GFR
Citation: Ayoub I, Nagaraja HN, Kang R, Rovin B and Bhatt U (2022) Which Is a Better Predictor of GFR Decline: 24-h Urine Protein or 24-h Protein–Creatinine Ratio? An Exploration of the MDRD Study Data. Front. Nephrol. 1:797431. doi: 10.3389/fneph.2021.797431
Received: 18 October 2021; Accepted: 13 December 2021;
Published: 27 January 2022.
Edited by:
Smaragdi Marinaki, Laiko General Hospital of Athens, GreeceReviewed by:
Valerie Luyckx, University Children’s Hospital Zurich, SwitzerlandCopyright © 2022 Ayoub, Nagaraja, Kang, Rovin and Bhatt. This is an open-access article distributed under the terms of the Creative Commons Attribution License (CC BY). The use, distribution or reproduction in other forums is permitted, provided the original author(s) and the copyright owner(s) are credited and that the original publication in this journal is cited, in accordance with accepted academic practice. No use, distribution or reproduction is permitted which does not comply with these terms.
*Correspondence: Isabelle Ayoub, SXNhYmVsbGUuYXlvdWJAb3N1bWMuZWR1
Disclaimer: All claims expressed in this article are solely those of the authors and do not necessarily represent those of their affiliated organizations, or those of the publisher, the editors and the reviewers. Any product that may be evaluated in this article or claim that may be made by its manufacturer is not guaranteed or endorsed by the publisher.
Research integrity at Frontiers
Learn more about the work of our research integrity team to safeguard the quality of each article we publish.