
94% of researchers rate our articles as excellent or good
Learn more about the work of our research integrity team to safeguard the quality of each article we publish.
Find out more
REVIEW article
Front. Nat. Prod., 30 July 2024
Sec. Structural and Stereochemical Analysis
Volume 3 - 2024 | https://doi.org/10.3389/fntpr.2024.1414506
This article is part of the Research TopicNMR insights into Natural Product ChemistryView all 6 articles
 Fernanda M. M. Ocampos1,2*
 Ana Julia B. de Souza3
 Gabriel H. Ribeiro4
 Luísa S. Almeida5Nara R. B. Cônsolo1
 Luiz Alberto Colnago2
Metabolomics is one of the “omics” sciences that can reveal the metabolic phenotype of organisms. This capability makes it a valuable tool for plant investigation, as plants present a vast chemical diversity. From the analytical point of view, two main techniques are frequently used in metabolomics and are often complementary: Mass spectrometry (MS) and Nuclear Magnetic Resonance (NMR) spectroscopy. Here, we describe NMR and its applications in plant metabolomics. We start by contextualizing the research field to then explore study design, sample collection, sample preparation, NMR data acquisition, and data analysis, showing the key features for achieving quality and relevant results. Within these topics, the most common databases used for plant metabolites identification and assignments are listed, as these help to shorten the laborious task of metabolomics investigation of natural products. Concerning NMR parameters, we discuss the key pulse sequences, recommend acquisition parameters, and examine the data each sequence can provide. Similarly, we delve into data analysis, highlighting the most commonly used chemometric methods and how to achieve high-quality results. Therefore, this review aims to provide a comprehensive guide for NMR-based metabolomics analysis of plants.
The word metabolomics began to appear in the literature circa 1960s and since the 2000s the annual number of publications that mention this approach has been increasing every year (Judge and Ebbels, 1962; Fiehn, 2002). The increase in these studies can be related to the ability of the analytical methods to identify and quantify the metabolites that occur in a given organism as a function of its genetics, age, disease, and or environmental influence, among other factors (Idle and Gonzalez, 2007; Sévin et al., 2015; Newgard, 2017). With such details, metabolomics allows to differentiate between living beings, organs, tissues, cells, etc. (Aldridge and Rhee, 2014). This approach is broadly applied in different fields of research, for instance, plants, agriculture, food, microbiology, pharmaceutics, ecology, and biological science, among others. In fact, when focusing on the area of interest of this review, the relevance of the term “plant metabolomics” has also increased in the last 10 years (Figure 1).
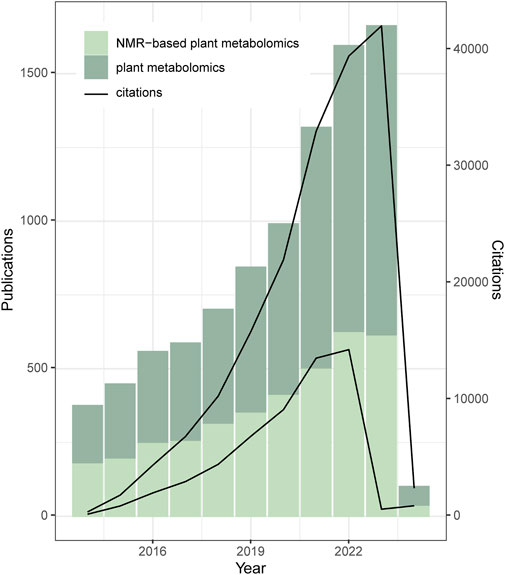
Figure 1. Number of scientific publications and citations per year related to plant metabolomics. Data obtained from Web of Science accessed in February 2024 using the words “plant metabolomics” or “NMR-based plant metabolomics,” for the period 2014–2024.
In general, metabolomics aims to determine any type of metabolite in a sample of interest (Nicholson et al., 1999; Fiehn, 2002). These low molecular mass compounds (MM < 3,000 Da) – that vary in molecular mass, biological function, and chemical properties – are the result of the biological processes happening in an organism at the specific moment when the sample is collected. Thus, powerful analytical tools are necessary to evaluate such heterogeneous and complex samples. Capabilities such as the limit of detection (LOD), the resolution, the possibility of identification, and the quantification of a large number of metabolites are valuable features (Kim et al., 2011).
Nuclear Magnetic Resonance spectroscopy (NMR) and Mass Spectrometry (MS) are the analytical tools used in the majority of the metabolomic studies (Nagana Gowda and Raftery, 2015; Markley et al., 2017; Patel et al., 2021). Each of these powerful techniques has pros and cons, and they are often used in combination due to their complementary capabilities (Bingol et al., 2015; Nagana Gowda and Raftery, 2015; Zhao et al., 2016; Bingol, 2018). NMR and MS are highly reproducible and require minimal sample preparation steps. This characteristic is crucial for metabolomic approaches, as they typically involve analyzing a large number of samples. The efficiency and reliability of NMR and MS make them indispensable tools in metabolomics, allowing for high-throughput analysis and consistent results (Lenz and Wilson, 2007). The main advantage of MS is its low LOD and the low limit of quantification (LOQ), i.e., high sensitivity, leading to the identification of a range of hundreds of metabolites in a single sample. However, the analysis is destructive and hyphenation with chromatography is necessary to provide more information for compound identification (e.g., LC-MS and GC-MS) (Wolfender et al., 2009). Another issue is that the identification of metabolites by MS is often only putative, which may lead to misidentifications (Zhou et al., 2013). Conversely, NMR-based metabolomics is a nondestructive approach that allows the simultaneous identification and quantification of metabolites. 1H NMR spectroscopy is the most used approach, as 1H is highly abundant in nature – one spectrum can be acquired in a few minutes. The main bottlenecks are a) the relatively high LOD and LOQ, indicating lower sensitivity compared to MS – this results in detecting only a few dozen metabolites per sample, specifically those with concentrations exceeding 1 µM – and b) the signal overlapping caused by the small spectral width (SW) of the 1H (Nagana Gowda and Raftery, 2015). The structure identification in mixtures is not simple, but some databases help to shorten this step. From 2005 to 2014 the number of metabolomic publications using MS was higher than those using NMR (Nagana Gowda and Raftery, 2015). Besides the low sensitivity and the signal overlapping, the high costs of high-field NMR spectrometers, not only for purchasing and installing but also for maintenance are among the reasons why NMR is not the most used technique for metabolomics. However, “NMR-based plant metabolomics” plays an important role in “plant metabolomics,” as shown by Figure 1, which compares the two terms showing their number of publications and citations between 2014 and 2024 in the Web of Science database.
Primary metabolism of an organism provides compounds, called primary metabolites (carbohydrates, lipids, and proteins) essential for the organism’s existence. They play essential roles in plant reproduction, growth, and energy storage. On the other hand, some organisms also have a secondary metabolism responsible for producing specialized metabolites, which are involved in the survival and perpetuation of the species, being the key feature that makes communication and interactions between organisms possible, a subject investigated by the Chemical Ecology Sciences (Faulkner, 2001; Harvey, 2008; Dayan et al., 2009; Cantrell et al., 2012; Schneider, 2013; David et al., 2014; Raguso et al., 2015; Schulz et al., 2015; Sparks et al., 2017; Rodrigues et al., 2020). These specialized metabolites are, among other functions, an alternative defense mechanism to the immune system of other organisms. The biosynthetic pathways of these compounds are sophisticated and energetically expensive (Stone and Williams, 1992), leading to diverse chemical structures with different biological activities. Among the organisms that biosynthesize natural products (NP) are plants, the object of this review. The fact that the term “plants” comprehends all the organisms included in the kingdom Plantae implies its very heterogeneous characteristics (Cavalier-Smith, 1981). The specialized metabolites are specific to each plant species and are required for the plant to survive under biotic and abiotic stresses (Valentino et al., 2020). This metabolic diversity that happens between different species of plants is the reason that makes it very difficult to build a comprehensive metabolomic database. NP are used as sources or inspirations for biologically active molecules that are commercially available such as medicines, supplements, and agrochemicals (Faulkner, 2001; Harvey, 2008; Dayan et al., 2009; Cantrell et al., 2012; David et al., 2014; Sparks et al., 2017; Rodrigues et al., 2020; Ocampos et al., 2021). In this context, NMR is the candidate of choice to work with samples where new or rare metabolites are present because it has the power to determine the chemical structure of compounds without the need for expensive standards. Relatedly, isomer differentiation is also possible by using NMR, being an advantage of the technique. Furthermore, working with plants also brings the possibility of isotopically labeling substrates to, for instance, use 13C to investigate metabolite pathways (Kikuchi et al., 2004; Böttcher et al., 2010; Chen et al., 2011). The range of NMR experiments that can be used to obtain more information is vast and is the main strength of working with the metabolomics of plants. The NMR advantages to the investigation of NP and plants are several and the goal here is to inspire the reader who is interested in exploring it for NMR-based metabolomics.
In this review, we aim to guide the reader through the most used protocols and practices in NMR-based plant metabolomics between 2014 and 2024, showing a general recommended protocol, from experiment design and sample collecting to data analysis. We will discuss NMR applications in the field in the last 10 years, recent advances in NMR instrumentation, and explore important features in data analysis. However, while this work aims to serve as a step-by-step guide, we strongly encourage reading additional relevant references in the field, many of which are cited in this review.
The biosynthesis of specialized metabolites starts from glycolysis and divides into four basic pathways, acetate, shikimate, mevalonate, and methylerythritol phosphate, and then diversifies depending on the cell, stage of maturity, and, above all, environmental signals (Li Y. et al., 2020). Specialized metabolites are divided into three main classes: phenolic compounds, nitrogenous secondary products, and terpenes (Figure 2), and their regulation is highly susceptible to biotic and abiotic stress (Deborde et al., 2017). For example, light supply is essential for photosynthetic activity, but the excess can inactivate or even deteriorate the photosynthetic reaction centers of chloroplasts, and induce photoinhibition (Li Y. et al., 2020). Conversely, low solar radiation can interrupt plant growth due to the lower net photosynthetic rate (Taiz et al., 2017). A study with Byrsonima intermedia L. demonstrated the effects of varying natural solar irradiation across seasons. These studies show a progressive increase in the concentration of phenolic compounds (such as galloylquinic acid and flavonoids) from summer to winter, reaching their highest concentration in winter, while triterpenes peak in summer (Zanatta et al., 2021). In the same study, but with the species Serjania marginata, the highest concentration of saponins was found in spring, with a decrease in winter, and in a similar way to B. intermedia, there were higher concentrations of phenolicsin winter (Zanatta et al., 2021).
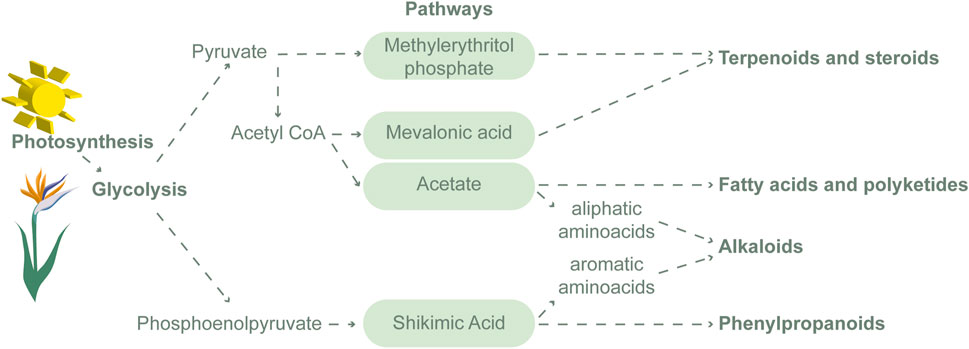
Figure 2. Schematic representation of the biosynthesis of specialized metabolites.
The optimum temperature range has a direct influence on plant development (Taiz et al., 2017). The biosynthesis of specialized metabolites is directly related to the plant’s ability to tolerate the extreme temperature, demonstrating acclimatization or adaptation to the imposed condition (Glaubitz et al., 2017). According to Joshi et al. (2023) phenolic compounds, and superoxide dismutase, among other antioxidant enzymes, play an important role in the abiotic stress tolerance of Musa spp. as they reduce the concentration of reactive oxygen species (ROS) overproduced during severe frosts. In contrast, excessive heat stress combined with drought promoted the activation of flavonoid biosynthesis to mitigate oxidative damage caused by the environment in Cleopatra mandarin (Citrus reshniyan Hort. Ex Tan) plants (Zandalinas et al., 2017).
Soils with excessive saline concentration can promote plant imbalance, affecting nutrient absorption and dropping photosynthetic rates (Li et al., 2020). This environmental stress influences the biosynthesis of specialized metabolites (Per et al., 2017). A study with Carthamus tinctorius L. under salt stress for 30 days showed that it did not compromise the plant growth but found a notable increase in gallic acid, which enabled the sequestration of ROS and allowed its full development (Gengmao et al., 2015). Another study on the induction of saline stress on Brassica nigra L, showed an increase in anthocyanins as salinity increased (Ghassemi-Golezani et al., 2020).
Some metals present in low concentrations in the soil, such as zinc, copper, and molybdenum, support plant development. However, at high levels, or in the presence of other metals such as cadmium and mercury, they can be absorbed by the roots and transported to accumulate in various plant tissues. This process leads to physiological and metabolic changes which interrupt homeostasis in the plant and stimulate the concentration of ROS (Li Y. et al., 2020). Toxic concentrations of metals can also inhibit other processes such as germination and maturation, by altering the distribution and concentration of carbohydrates and proteins in the plant, which hinders the absorption of nutrients and affects specialized metabolism (Berni et al., 2019). Substances with low molecular mass, responsible for neutralizing these ROS, act as chelators of heavy metals and prevent cellular oxidation. Gynura pseudochina, is an example where flavonoids act as phytochelatins sequestering zinc and cadmium, while catechins neutralize the excess of iron (Anjitha et al., 2021).
Water deficit results in the interruption of cellular homeostasis, directly affecting plant physiology such as osmotic potential, stomatal conductance, carboxylation efficiency, and photosynthetic rate. Consequently, these changes adversely impact the vegetative development and productivity of the plant (Hussain et al., 2018). However, plants trigger different survival strategies, such as the accumulation of primary metabolites that act as osmoprotectants, signaling phytohormones and secondary metabolites with antioxidant activity (Yadav et al., 2021). For instance, Salvadora persica L., under water deficit accumulated osmoprotective compounds such as sucrose, glucose, glycerol, malic and citric acids, coumarin, gallic acid, and chlorogenic acid (Rangani et al., 2020). Another example is a work conducted with Bauhinia ungulata L., where different water availability regimes caused an increase in D-pinitol, an osmoprotective compound (Borim de Souza et al., 2023).
Additionally, the biosynthesis of metabolites can be triggered by tissue injuries, attacks by pests and pathogens, circadian rhythms, and geographical location (Li Y. et al., 2020). For instance, antibacterial flavonoids selectively target cells of the pathogen, inhibiting its spreading and preventing the production of biofilms (Kaur et al., 2022).
NP concentration depends on environmental conditions, the part of the plant, maturity stage, and time of day (Li Y. et al., 2020). Therefore, an essential step in the analysis is the standardization of collection, where the same time of day should be considered for all samples, with similar Sun exposure characteristics, harvest region (e.g., the middle third of the plant, third leaf of the branch, symptom-free leaves, mature leaves, etc.), and efficiency in conducting the collection to avoid metabolic alterations caused by enzymatic reactions (Zhao et al., 2022).
A single plant does not represent the true reality imposed by the environment, therefore biological replicates should be planned, considering between 3 and 5 in vivo repetitions, as mixing more plants in the sample contributes not only to the quality of the information but also to supply the ideal amount for sample preparation (Salem et al., 2020). However, this number of replicas should be increased (±6) if the work aims to differentiate many distinct groups of plants (Kim et al., 2010).
After harvesting the plant material, it is recommended to separate them, allocating them according to their general classification (e.g., leaves, flowers, fruits, roots, etc.), and subsequently, to prevent any enzymatic degradation, rapid cooling is recommended, such as immediate freezing using liquid nitrogen, or storage in a refrigerator at −80°C, which can ensure months without altering the metabolic profile of the collected plant material (Kim et al., 2010).
Upon starting the extraction preparation, the plant material should be dried, as the presence of water can stimulate enzymatic reactions in the plant tissue, alter the pH of the extract, and even lead to the overlap of the H2O signal (Krakowska-Sieprawska et al., 2022). Nowadays, there are several drying methods available, such as convection, the use of desiccants like silica, and freeze-drying, which currently stands out as the most used technique since it provides the highest yield of dry material with the least loss of metabolites, as frozen water is sublimated under low pressure, making it a gentle and less degrading technique (Jovanović et al., 2021).
With the dried material, the next step is to grind the plant material to maximize the efficiency of extraction by increasing the surface area in contact with the solvent, using techniques such as mortar and manual grinding, knife mill, and tissue laser, with the best grinding quality ensuring particles of 70–150 µm and at least 20–100 mg of ground plant powder for extraction (Deborde et al., 2019).
A quality control (QC) sample, composed of a pool of all samples in the experiment should be prepared and extracted in the same manner as all the other samples. This sample is useful for calibrating the NMR equipment and for verifying the precision and accuracy of the data generated from complex biological samples. This ensures that the metabolomic data is reliable and can be used to draw meaningful biological conclusions.
Subsequently, the appropriate solvent should be chosen based on the nature of the plant material, ensuring complete dissolution of the extract and detection of the highest number of compounds possible, quickly to avoid any contamination (Salem et al., 2022). Additionally, the proportion to be used should be considered, as low-concentration extracts can be corrected but ensure lower resonance detection. However, highly concentrated extracts may not record many resonances due to increased viscosity, making it extremely important to recognize the material used, the objective of the work, which solvent(s) to use, and the correct quantities (Halabalaki et al., 2014).
Many extraction protocols for NMR are widely discussed in world literature (Kim et al., 2010; Halabalaki et al., 2014; Deborde et al., 2017; 2019; Salem et al., 2020). They consist of using solvents, usually deuterated ones, whose typical characteristics are related to the polarity of the compound classes to be investigated, for example, methanol, ethanol, water, or acids (e.g., perchloric acid) to extract polar or semi-polar metabolites, while non-polar substances are extracted from pure chloroform or combined with methanol or phosphate buffer (Kim et al., 2010). In order to maximize the extraction of metabolites, temperature variations, ultrasound, or microwave may be employed (Deborde et al., 2019).
It is difficult to capture all compounds in a single solvent due to different physical-chemical characteristics, therefore, it can be done fractionally, combining two or more solvents or methods, such as precipitation of the organic solvent or single or multiple solid phase extraction (Salem et al., 2020). For instance, a work with B. ungulata L. used deuterated methanol and water solvents (7:3 v/v) (Borim de Souza et al., 2023). Another possibility is using two-phase solvents, which require their separation, such as evaporation of the first solvent and its redissolution in the appropriate solvent, as in the work carried out in Arabidopsis thaliana (Sekiyama et al., 2010).
Given the diversity of specialized metabolites within plants, the metabolite annotation is often one of the most laborious tasks. However, NMR databases aim to enable the identification of various compounds from uni (1D) and bidimensional (2D) NMR experiments that have already been reported previously, thus optimizing an important part of the chemical profiling determination process. Moreover, various NPs originating from primary and specialized metabolism are often found in plants. Consequently, common metabolites frequently have pure standards commercially available. As a result, a large part of the structural elucidation processes of NMR can be assisted by bioinformatics, using databases that comprehend valuable information on features already determined for these compounds (Table 1).
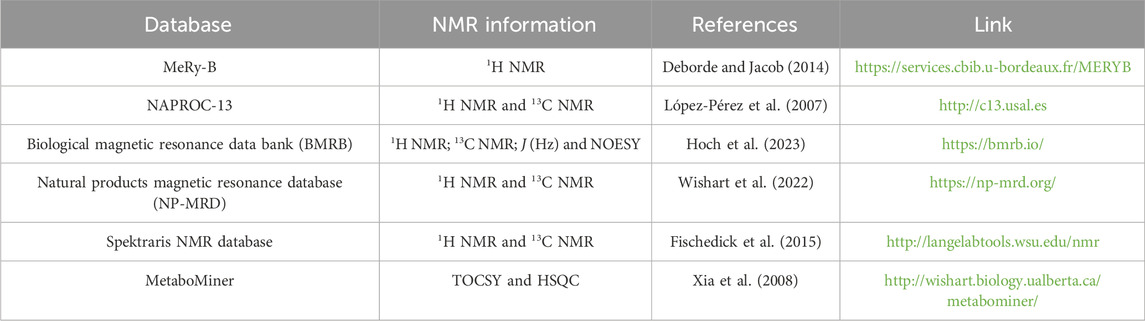
Table 1. Databases for Natural products investigation, showing the NMR information that it contains, references in the literature and a link for access.
Since the introduction of commercial NMR spectrometers in late 1950, NMR has been an essential technique for the structural determination of pure organic compounds including plant NP (Kim et al., 2010; Deborde et al., 2019). The initial applications were based on continuous wave spectrometers, up to 2.3 T (100 MHz), and practically dedicated to 1H spectra. When compared to other spectroscopic or spectrometric techniques NMR was known as a technique with a high LOD or lower receptivity, which is a limiting factor when working with NP in very low concentration. Therefore, since then, the major goal of NMR spectroscopists has been the improvement not only of the resolutions but principally to reduce LOD. Both features are directly related to the homogeneity and intensity of the NMR magnetic field (B0). Furthermore, the chemical shift (Hz) increases linearly with B0 and signal intensity increases with B03/2.
The first big step for reducing the LOD desired for NP structural elucidation started at the end of 1960 with the introduction of Pulse and Fourier transform NMR. These new spectrometers accelerate the time necessary for 1H spectral acquisition and allow the routine detection of nuclei with lower receptivity (lower natural abundance and lower gyromagnetic ratio) like 13C. The 13C spectra obtained by FT spectrometers can be considered an important landmark in NP structural elucidation. In the 1970-decade the introduction of commercial superconductor magnets also improved resolution and sensitivity allowing the analysis of very diluted samples. In the 1970 decade, another NMR breakthrough was the introduction of bidimensional or multidimensional NMR spectroscopy that improves resolution and allows the observation of homo or heteronuclear correlations through chemical bonds or space. These procedures were another giant step for NP structural determination (Eisenreich and Bacher, 2007).
More recently the introduction of very high field magnets – up to 28.2 T (1.2 GHz) – and cryoprobes allowed the analysis of NP in very low concentration (nM), i.e., more than four orders of magnitude lower than the concentration necessary for the NMR spectrometers used up to the 1970 decade (Kim et al., 2010; Deborde et al., 2019; Salem et al., 2020). The latest promising breakthrough in NP analysis has been the use of hyperpolarization techniques such as dynamic nuclear polarization (DNP) and para-hydrogen techniques that could enhance the signal-to-noise ratio (S/N) by several orders of magnitude. Therefore, advances in NMR spectroscopy have provided a new level of application in the metabolomics analysis of plant tissues, animals, biological fluids, and complex NP mixtures. These advancements have significantly enhanced the ability to analyze and understand the metabolic profiles of various biological systems (Kovacs et al., 2005; Kovtunov et al., 2018).
1H NMR-based metabolomics is the main approach used since the 1D 1H spectrum is also responsible for providing an overview of the main compounds present in the samples. The 1D 13C NMR spectrum is used in cases when the overlapping of signals in the 1H spectrum is high, being helpful for samples that contain metabolites such as terpenes and saponins. On the other hand, 2D contour maps such as correlation spectroscopy (COSY), J-resolved, hetero-nuclear single quantum correlation (HSQC), hetero-nuclear multiple bond correlation (HMBC), etc., offer complete information without the need for fractionation and are widely used to confirm the data obtained from 1D NMR spectra, as well as allowing the elucidation of small compounds (Deborde et al., 2017). Another positive point is the possibility of quantifying compounds from the 1H NMR spectrum, where the integral of the signal and its proportion to the number of originating atoms makes it possible to quantify NP without the need to use standard compounds (Santos and Colnago, 2013; Wang et al., 2021).
The following instructions describe recommendations for the installation and optimization of metabolomics NMR parameter sets for NP investigation, intending to guide the use through the setup and optimization of experimental protocols. Figure 3 shows the preparational steps needed for the optimization and acquisition of the NMR experiments (Beckonert et al., 2007; Kim et al., 2010; Deborde et al., 2019).
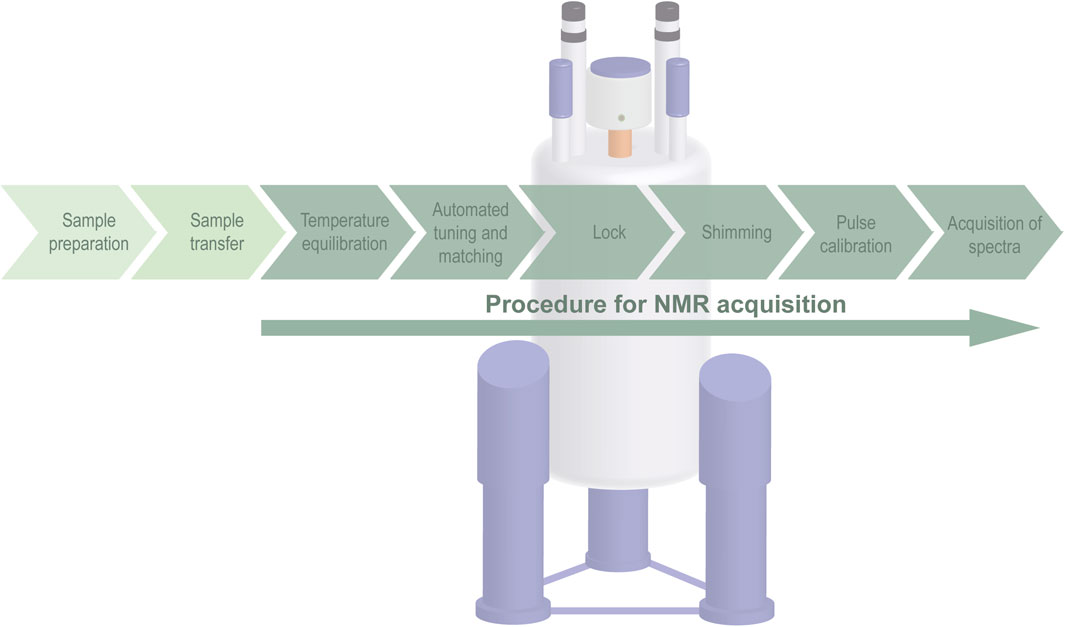
Figure 3. Step-by-step procedure for NMR data acquisition.
A critical step in metabolomics is the sample preparation method, as described in Section 2.2. The sample preparation includes all steps of transforming the sample into a solution, from harvesting to the extraction of metabolites, the last not applicable for high resolution-magic angle spinning (HR-MAS NMR) analysis.
As NMR chemical shifts are dependent on sample temperature it is important to use the same temperature for all samples used in a given experiment. Therefore, in NMR-based metabolomics, the spectra must be acquired at a constant temperature, generally, at 298 K (25°C). The thermal equilibrium of the sample is reached within a few minutes. An important aspect is that the temperature must be calibrated using a standard methanol sample, for example.
The probe tuning and matching is another step that must be taken before acquiring each spectrum. These procedures maximize the transmission of radio frequency pulses and consequently the sensitivity (Hwang and Hoult, 1998; Bendet-Taicher et al., 2014).
Deuterium resonance, from the deuterated solvent, is utilized to provide an internal lock signal to avoid drift in the magnetic field during the NMR experiments (Bendet-Taicher et al., 2014).
Shimming is another critical step that is carried out to generate an ideally perfect homogeneous magnetic field (B0) over a region of the sample volume. A non-uniform B0 can lead to a low-quality spectrum, for example, uninterpretable broadened signals with insufficient resolution and S/N. Ideally, the internal reference signal width at full halfwidth (FHW) should be less than 1 Hz.
The pulse width (µs) optimization is also an important step to maximize the sensitivity to guarantee the signal reproducibility over time, and to avoid artifacts in the NMR spectra. Ideally, for 1H NMR-based plant metabolomics the 1H 90° pulse calibration can be performed in the QC sample, as this is a representative sample for the whole group (Nishizaki et al., 2021).
In 1H NMR metabolomics, a crucial stage involves the selection of an appropriate pulse sequence to ensure the acquisition of high-quality data. The high complexity of NPs is a challenge to 1H NMR assignment due to the signal overlap, thereby limiting the detection, identification, and quantification of metabolites. Therefore, several pulse sequences have been developed and employed to improve the quality of the NMR spectra. However, in NMR-based metabolomics, only a few of them are used and there are common parameters between those that are discussed as follows. As the most used NMR spectrometers are manufactured by Bruker, the names of the NMR parameters in this review are referred to the Bruker equipment (Breton and Reynolds, 2013; Chen et al., 2023).
- Number of scans (NS) = should be set to ensure a good S/N in the spectra. High S/N is primordial for ensuring an accurate integration of the signals, which allows for quantification in metabolomics. For errors <1%, in the integration of a signal, a S/N of at least 250:1 is required. Therefore, the accuracy of the measurement of the compound concentration in the samples is defined directly by the S/N and can be adjusted by the NS selected. S/N ∼ √[Ns].
- SW = is the bandwidth or range of the frequencies around a center frequency (O1). The SW must be set much larger than the signal bandwidth. Furthermore, a broad SW also simplifies baseline correction. SW = 1/2 × Dwell time (DT-the time interval between two data points). For metabolomics, usually, an SW of 20 ppm is recommended to give space to cut distortions in the edges of the baseline.
- Time domain (TD) = is the number of data points (np) acquired in the TD signal, i.e., during the Free Induction Decay (FID) signal. It depends on the ratio acquisition time (AQ) and dwell time (TD = AQ/DT). Normally TD ranges from 32 to 128 K data points.
- AQ = is the time used to acquire the NMR signal (FID). This value should be at least 3 T2* to avoid truncation errors that lead to baseline distortions in the final spectrum. The AQ should be long enough for maximum spectrum resolution. AQ = DT × TD.
- Delays time (D1) = The recycle delay time should be chosen for quantitative NMR analysis. It is essential to have a repetition time (RT = D1 + AQ) at least 5 times the longitudinal relaxation time (T1) of the slowest relaxing signal from a nucleus of interest in the sample.
- Receiver gain (RG) = should be set to provide the highest signal intensity, without reaching the maximum value of analogic to digital converter (ADC). The saturation of ADC causes severe spectral distortion. In metabolomics it is recommended to use the same RG within all samples, thus using a pool of all samples to set the parameter.
The pulse sequences described below are the most frequently used in metabolomics. They are described in order of increasing complexity and their main acquisition parameters are described (Beckonert et al., 2007; Kim et al., 2010).
The simplest 1H NMR pulse sequence consists of a single pulse, followed by AQ and D1. Suggested acquisition parameters: NS = 128, TD = 32,768, D1 = 2 s, SW = 20 ppm, and AQ = 1.36 s.
In water-containing samples, it is necessary to have good suppression of the water signal to use the maximum dynamic range of the ADC, and consequently enhance the digital resolution and the visualization of the NMR signals. The selection and optimization of the solvent suppression pulse sequence are key steps for ensuring the performance of the 1D NMR spectrum since each sequence has its disadvantages and implications in the NMR spectra profiles. Among the features is reproducibility, which is one of the most critical items for metabolomics studies, negligible reduction or incrementation of S/N values, and no distortion or dephased signals, mainly in the signals close to the suppressed resonance. Two important parameters for presaturation quality are correctly setting the transmitter offset frequency (O1) to the exact resonance frequency where the water signal is placed and adjusting the power level of irradiation (pL9) for optimal suppression. Although several sequences can be used for water suppression (e.g., zgpr and zgcppr), 1D-NOESY-presat is the most used water suppression pulse sequence for acquiring 1H NMR spectra of NP samples. The 1D- NOESY-presat employs the first increment of a NOESY pulse sequence with water irradiation during the relaxation delay (D1, s) and the mixing time (D8, ms). The pulse sequence consisted of –D1-90°-t-90°-tm-90º-AQ, t is a short delay typically of ∼3 us, 90° represents a 90° RF pulse, and tm is the mixing time. Additionally, there are pulse sequences that use magnetic field gradients, which improves the quality of solvent suppression (e.g., noesygppr1d). It is important to highlight that the parameters D1 and D8 are determining factors for presaturation quality (Mckay, 2011).
- Suggested acquisition parameters: RD = 4.0 s, tm ranges of 100–150 ms; SW = 20 ppm, TD = 32 K; AQ = 1.36 s; number of dummy scans (DS) of 16; NS = 64–128 depending on S/N, and the RG is set to fill the dynamic range of ADC.
T2 filter has been used to attenuate the NMR signals from macromolecules that may be present in samples and eliminate their overlap with the metabolite’s signals which prevents signal integration and quantification. The Carr-Purcell-Meiboom-Gill (CPMG) (P. McIntosh, 2013) is the most common T2 filter sequence used in metabolomics studies. The pulse sequence consisted of–D1-90°-(t-180°-t)n-AQ, where t echo time, n represents the number of loops, and 180° represents the 180° RF pulse. It is important to highlight that the parameters, number of loops, and echo time are determining factors for the attenuation of macromolecular signals. The T2 filter suppresses preferentially the broad signal of macromolecules but also suppresses the sharp signal of sample metabolites. The main restriction to the use of these types of sequences in metabolomic approaches is that they may interfere with the area of the signals, not being recommended for quantification. In plant metabolomics, normally a solvent extraction step is applied, in which macromolecules are removed. Thus, the T2 filter is necessary in HR-MAS experiments to remove the broad signals from macromolecules.
- Suggested acquisition parameters: number of loops, n = 80 or higher (depending on the intensity of macromolecular signals), echo time, t = 400 μs, giving a total echo time = 64 ms; the D1 = 4.0 s; SW = 20 ppm, TD = 32 K AQ = 1.36 s, DS = 16, O1 is the frequency of suppression of the solvent signal, number of scans, and the RG is set to fill the dynamic range of ADC.
The high complexity of NP matrices is still a challenge to NMR spectroscopy due to the signal overlap, thereby limiting the detection, identification, and quantification of metabolites. Therefore, new pulse sequences that simplify the 1H NMR spectrum have been developed. The pure shift NMR that includes methods such as PYSCHE (Pure shift yielded by chirp excitation suppression) is a new approach to plant metabolomics. In this sequence, the spin-spin couplings in the 1H NMR spectrum are suppressed to obtain only singlet lines that result in better spectral resolution and decreased signal overlap. Wessjohann et al. (Stark et al., 2020) compared the results of PYSCHE and conventional 1H NMR experiments of Hypericum plant extracts. They found that the quantitative information of the metabolites obtained from the binned PSYCHE spectra presented no significant difference with results from the binned convention 1H NMR spectra, making this sequence a good choice for metabolite quantification (Stark et al., 2020; AU - Lopez et al., 2021).
Another new promising pulse sequence is the “Designed Refocused Excitation And optional Mixing for Targets In vivo and Mixture Elucidation” (DREAMTIME). This technique allows for the isolation of target metabolites from a complex mixture being a good candidate for target plant metabolomics. The main advantages are that it can be used for relative and absolute quantification as it can provide a clean spectrum, with no superimposition of signals. One inconvenience of DREAM TIME is that it is not possible to select molecules with no J-coupling systems, thus, if a target does not have at least a doublet, it cannot be seen by using DREAMTIME (Jenne et al., 2022).
The majority of NMR metabolomic studies are based on 1D 1H NMR, however signal overlap is a strong limitation in the studies. 13C NMR offers several advantages for metabolomics study, either alone or as a complement to 1H NMR (Clendinen et al., 2014; Clendinen et al., 2015; Clendinen et al., 2015; Edison et al., 2019). The main advantage is the large chemical shift range of 13C signals compared to 1H, which allows greater 13C chemical shift dispersion in comparison to 1H NMR (Dayrit and Dios, 2017). This provides less overlap in the NMR spectra and more efficient statistical analysis. Furthermore, the metabolites predominantly contain carbons backbone, and 13C NMR can detect this directly; the signals in the 13C spectra with 1H decoupling are singlets, resulting in less spectral overlap. Due to its low natural abundance and gyromagnetic ratio, the sensitivity of 13C is more than 5000-fold lower than 1H. Therefore, the time and quantity of the sample necessary to acquire a sufficient NS is long, and metabolomics by 13C NMR has limited use. Selective improvement of sensitivity is performed with 13C-enriched samples. In some cases, isotopic labeling is simple and cost-effective, however, it is indeed an expensive approach (Clendinen et al., 2014; Clendinen et al., 2015).
Dey et al. (2020) showed that the 13C NMR approach could significantly enhance an untargeted metabolomics study. In this study, it was possible to carry out specific identifications of metabolites using 13C NMR, and according to the authors, perhaps the most important aspect of the technique was to prevent the misassignment of metabolites proposed by 1H NMR.
Later, Dey et al. (2023) also described an untargeted NMR-based metabolomic based on dissolution dynamic nuclear polarization (d-DNP), which was the application of hyperpolarization on natural abundance 13C in an NMR metabolomics study. The dissolution dynamic nuclear polarization (d-DNP) enhanced the sensitivity of 13C NMR for complex metabolite mixtures, leading to the detection of highly sensitive 13C NMR. In d-DNP, nuclear spins of a sample are doped with a polarizing agent, usually a free radical, and polarized in the solid state with microwave irradiation, at cryogenic temperatures in a high magnetic field. Then, there is rapid dissolution and transfer of the sample to the NMR spectrometer, where hyperpolarized signals are acquired in the liquid state (Kovtunov et al., 2018; Dey et al., 2023).
The identification of metabolites within a complex mixture often cannot be clearly assigned on 1H NMR spectra (Moco, 2022). The assignment of these metabolites requires additional information that can be obtained by 2D NMR Among 2D NMR experiments, the 1H-1H J-resolved counter map has proven to be very useful by dispersing the overlapping signals into a second dimension, it reduces the overlap and increases the possibilities for the metabolites assignment. Other 2D NMR experiments normally used for this purpose are COSY, total correlation spectroscopy (TOCSY), HMBC, and HSQC (Schroeder et al., 2007; Breton and Reynolds, 2013; Huang et al., 2024).
Furthermore, some studies using more complex pulse sequences such as ADEQUATE (Saurí et al., 2019), INADEQUATE (Ismail et al., 2021), HSQC-TOCSY, and LR-HSQMBC (longe-range heteronuclear single quantum multiple bond correlation) have been performed to identify some compounds in mixture complexes (Motiram-Corral et al., 2020). In the following paragraphs, NMR parameters are suggested for the acquisition of 2D spectra (Kim et al., 2010).
1H – 1H COSY, the pulse sequence with pre-sat. Suggested acquisition parameters: RD = 1 s; size of fid in F1 = 512 and F2 = 4,096 points; SW of 6,361 × 6,361 Hz; NS = 8 for each increment. Zero fill data to 4,096 × 4,096 points and apply a sine2 bell-shaped window function shifted by/2 in the F1 and/4 in the F2 dimension before States-TPPI type 2D Fourier transformation.
1H J-resolved: J-resolved pulse sequence with two-pulse echo sequence with water pre-sat. Suggested acquisition parameters: RD = 1.5 s; size of fid in F1 = 64 and F2 = 4,096 points; SW of 66 × 6,361 Hz; NS = 16 for each increment; apply a sine bell-shaped window function in both dimensions before magnitude mode 2D Fourier transformation. Tilt the resulting spectra along the rows by 45° relative to the frequency axis and symmetrize about the central line along F2.
1H-13C HSQC: Suggested acquisition parameters: RD = 1 s; size of fid in F1 = 256 and F2 = 4,096 points using 32 coefficients before magnitude type 2D Fourier transformation and apply a sine bell-shaped window function shifted by/2 in the F1 dimension and/6 in the F2 dimension; SW of 27,164 × 6,361 Hz; scans number of 256 for each increment.
1H-13C HMBC: Suggested acquisition parameters: D1 = 1 s; size of fid in F1 = 256 and F2 = 4,096 points using 32 coefficients before magnitude type 2D Fourier transformation and apply a sine bell-shaped window function shifted by/2 in the F1 dimension and/6 in the F2 dimension.; SW of 27,164 × 6,361 Hz; NS = 256 for each increment.
Currently, quantitative NMR (qNMR) is progressively gaining attention in applications in metabolomics since the quantitative measurement of multiple compounds in a mixture can be an important tool for chemometric analyses. In this approach, the quantified metabolites give rise to a matrix that can be used for multivariate analysis. In recent decades, several publications have reported the application of qNMR-based in NP research (Chauthe et al., 2012; Simmler et al., 2014; Truzzi et al., 2021; 2024; Zhang et al., 2021; Colella et al., 2022; Dadiotis et al., 2022; Çiçek et al., 2022; Girbu et al., 2023; Tian et al., 2023; Trendafilova et al., 2023). Liquid state 1H NMR is a commonly used tool in this research domain. Reviews have been published addressing important aspects of qNMR, which focus on sample preparation, data acquisition, data processing evaluation calculation, and quality assurance (method validation) (Pauli, 2001; Pauli et al., 2005; Simmler et al., 2014). More recently, Wang et al. (2021) extensively revised qNMR details in the article titled Research Progress of NMR in Natural Product Quantification.
Quantification by NMR is based on the fundamental relationship that the signal area (As) of an NMR spectrum is directly proportional to the number of nuclear spins (Ns). This relationship is according to Equation As = Ks × Ns, where Ks is a spectrometer constant. NMR is a primary analytical technique that enables the determination of the concentration of compounds without the necessity of a primary standard of the specific compound. The main method utilized for absolute quantification is the internal standard method with a known concentration, and there is no need to calculate response factors or calibration curves. Another major advantage of qNMR is its capability to quantification of several compounds in complex mixtures without the need for individual component separation. However, qNMR analysis can be limited due to certain aspects observed in samples from NP. In many cases, the 1H NMR spectra obtained from NP present a significant number of overlooked and unassigned signals. In the qNMR analysis, the signal used for quantification must be unequivocally assigned. Another aspect, particularly with secondary metabolites, is their presence at low concentrations, often below the LOQ (Griffiths, 1998; Malz and Jancke, 2005; Bharti and Roy, 2012).
For quantitative NMR measurements, several experimental parameters need optimization before acquiring qNMR spectra. In addition to the parameters mentioned above, some important factors to be considered for the acquisition of 1H qNMR spectra will be highlighted below.
Repetition time: To meet the fundamental principles of qNMR measurements, the nuclear spins must be in thermal equilibrium. Repetition time (RT) is defined as the sum of AQ and D1 and is dependent on spin-lattice NMR relaxation time (T1) (Bloembergen et al., 1948). The Inversion-Recovery (IR) is the standard pulse sequence for determining T1. As the relaxation process is exponential it is necessary to use a RT >> T1 to reach the thermal equilibrium. For example, 5T1 reaches 99.33% and 7T1 approximately 99.9% of excited nuclear spins. Therefore, the error caused by RT = 7 × T1 is in the order of 0.1% and it is the RT suggested for qNMR experiments (Malz and Jancke, 2005; Bharti and Roy, 2012).
Specificity and selectivity: in qNMR, the NMR signal areas are the main basis for analyte quantification. Therefore, the NMR signal used for the quantification of the analyte should be unambiguous to the chemical compound. Furthermore, the signal in the 1H NMR spectrum utilized for quantification should ideally be selective and have little or no overlap with signals from other components in the mixture (Malz and Jancke, 2005; Bharti and Roy, 2012).
Internal standard: The use of internal standard method is widely used for qNMR (Cullen et al., 2013) The internal standard must be physically and chemically stable and not overlap with other signal analytes. The most commonly internal standards are 4,4-dimethyl-4-silapentane-1-sulfonic acid (DSS) (Zürn et al., 2019; Lund et al., 2020), 3-(trimethylsilyl)propionic-2, 2, 3, 3-d4 (TMSP) (Jayaprakasha et al., 2013; Yan et al., 2016; Rasheed et al., 2018; Li et al., 2019; Li et al., 2020 W.; Oliveira et al., 2021), pyrazine (Hsieh et al., 2018; Feng et al., 2020; 2021; Zhang et al., 2020), 1,3,5-trichloro-2-nitrobenzene (Çiçek et al., 2018), maleic acid (Liu et al., 2010; Khatib et al., 2016), and fumaric acid (Rundlöf et al., 2010).
S/N: For a precision greater than 99% (uncertainty less than 1%), the S/N has to be at least 200:1. The S/N ratio can also be increased by increasing the number of scans (Malz and Jancke, 2005).
The use of 13C qNMR is limited by several factors like lower receptivity and long T1 (Caytan et al., 2007; Keeler, 2013). Even so, some works have reported the 13C qNMR method (Duquesnoy et al., 2008; Colombo et al., 2015; Kazalaki et al., 2015) For instance, a series of non-psychoactive cannabinoids, such as cannabidiol, cannabidiolic acid, cannabigerol, and cannabigerolic acid in female inflorescences of different hemp varieties were quantified by the 13C qNMR approach (Marchetti et al., 2019).
1H high-resolution magic angle spinning (HR-MAS) NMR is another approach, largely executed to determine metabolites in samples without any extraction or separation. The HR-MAS NMR technique combines solid- and liquid-state NMR techniques, allowing the use of suspended samples. NMR spectra can be acquired with spectral resolution like spectra from liquid-state NMR experiments but from suspension samples with restricted molecular mobility. In HR-MAS, the sample is rotated quickly around, and the axis is oriented at an angle of 54.7°, known as the magic angle, about the direction of the static magnetic field. Sample spinning rate at the magic angle HR-MAS probes can vary from 100 Hz to a few KHz. Spinning removes the broadening arising from chemical shift anisotropy, residual hetero- and homonuclear dipolar coupling, and magnetic susceptibility variations (Keifer et al., 1996; Lindon et al., 2009; Farroq et al., 2013).
The HR-MAS NMR technique has been widely used for studying metabolic profiles in NP (Augustijn et al., 2021) One of the most common applications in HR-MAS-based metabolomics is investigating the influences of biotic and abiotic stress (Coutinho et al., 2017; Pagter et al., 2017; Santos et al., 2017; Mazzei et al., 2018; de Oliveira et al., 2019; Taglienti et al., 2020). de Oliveira et al. (2019) demonstrated that the metabolic profiles of soybean stems and leaves were altered in response to a disease caused by the fungus Sclerotinia sclerotiorum. Other studies have highlighted the potential of the technique to differentiate cultivars, like apple cultivars (Vermathen et al., 2011). Furthermore, HR-MAS has been employed for discrimination of tomato (Sánchez Pérez et al., 2011), Withania somnifera (Bharti et al., 2011), melon (Delgado-Goñi et al., 2013), rice (Song et al., 2016), persimmon (Santos et al., 2018), Panax ginseng (Yoon et al., 2019), seeds of Prunus culcis (Salvo et al., 2020), and herbal medicines (Flores et al., 2020). HR-MAS NMR combined with multivariate analysis has proven to be a powerful tool for authenticating organic foods regarding their geographical origin (Cohen et al., 2024), for instance, tomatoes (Sánchez Pérez et al., 2011; Mallamace et al., 2014). Additionally, the HR-MAS has been utilized to characterize well-known medicinal plants used in traditional medicine, such as Berberis laurina (Berberidaceae). In the study on the genus Berberis L., a total of 17 metabolites were identified, revealing that the metabolic pattern changes of the leaves over time are seasonally dependent (Ali et al., 2020). Several studies have also been conducted to evaluate the ripening process and storage of fruits (Vermathen et al., 2017; Yoon et al., 2019) HR-MAS analysis has further been applied in the quality control of seven Passiflora-based herbal medicines, using metabolic fingerprinting to confirm plant species and identity biomarkers. Vitexin and isovitexin were identified as major compounds in three of these herbal medicines (Flores et al., 2020).
Following the acquisition of spectral data, signal pre-processing implements appropriate mathematical techniques to reduce the impact of undesired signal fluctuations (Oliveri et al., 2019). In other words, it is helpful to enhance S/N and decrease experimental variations on the acquired dataset (Dayananda et al., 2023). Examples of those techniques encompass phase correction, baseline adjustment, and peak alignment and referencing. The phase correction reduces baseline drifts by zero-order correction–frequency independent–or first-order correction–frequency dependent (Ebrahimi et al., 2018). Baseline adjustment may provide further enhancements in the accuracy of predictions made from frequency-domain spectra because signal area is related to metabolite concentration. Therefore, properly adjusting the baseline improves data accuracy for quantification. Signal alignment is important to ensure correct metabolite chemical shift displacement, caused by temperature fluctuations or small changes in the sample’s pH (Oliveri et al., 2019). For NMR users, TopSpin (Bruker) is probably the most used software to address these procedures. Moreover, pre-processing is included in software such as Chenomix (Chenomix Inc., Edmonton, Canada), in which these three pre-processing steps are directly related to proper metabolite target identification and quantification (Liland, 2011). To further comprehension of these procedures and mathematical signal pre-processing (e.g., normalization, mean centering, scaling, and derivative algorithms) we recommend the papers of Ebrahimi and coworkers and Olivieri and coworkers (Ebrahimi et al., 2018; Oliveri et al., 2019).
Generally, for untargeted studies spectral binning (also called bucketing) may be applied. This process involves segmenting the spectrum into a specific number of bins and aggregating all measurements within each bin to create a matrix with a reduced number of variables. This would provide a reduction in computer data processing (Liland, 2011). Authors recommend the software MesTreNova (Mestrelab) and Amix (Bruker BioSpin) for data binning. However, binning is not a mandatory step, as the complete matrix composed of all the data points of spectra can also be used for the chemometric analysis. Peak deconvolution is the core algorithm for software such as Chenomix, used for metabolite quantification. Although Chenomix has a library of metabolites that do not comprehend many specialized metabolites, when samples are expected to present compounds such as primary metabolites, deconvolution offers a streamlined approach to data integration in cases where peaks overlap. By utilizing deconvolution, signals can be integrated more accurately in 1D spectra, reducing errors in quantitative parameters such as NMR spectrum noise, phasing errors, and baseline approximation (Correia et al., 2023).
Defined in 1974 by Svante Wold (chemometrics) is “the art of extracting chemically relevant information from data produced in chemical experiments” (Wold, 1995). This leads to matrices with a greater number of variables and consequently an increased amount of data in omics, particularly in instances where binning is not employed (Trygg et al., 2007). Another reason for larger matrices is technological advancements that enable continuous data acquisition, such as utilizing autosamplers. As an important step in plant metabolomics studies, the use of chemometrics enables a proper choice to relate and differentiate data from a set of controls and treated samples. There is also the possibility to include additional information on the samples for the data modeling, such as qualitative attributes. However, it is crucial to acknowledge that the ability to understand and interpret the fundamental chemical or biological alterations linked to class disparities should not be overshadowed by discriminatory capability (Bylesjö et al., 2006; Trygg et al., 2007).
Therefore, an appropriate experimental design, as we have mentioned in the previous sections, is critical to maximize the chemical information collected. The goal of experimental design is to strategically plan and execute experiments to obtain optimal information with minimal resources and effort (Trygg et al., 2007). Trygg et al. (2007) proposed essential steps in planning a metabolomic study as follows. The first step is defining the aim, before starting any experiment. At this point, it is important to define the type of metabolomic study (untargeted or targeted) and the type of methods that may be used to achieve it. This approach optimizes both the efficiency of experimental time and resources. The second one is the selection of objects. In plant metabolomics, it relates to appropriately defining a sample number (n) to represent the population observed. Additionally, it relates to choosing the best characteristics to define each evaluated group. These strategies aim to effectively systematize the experiment’s setup and provide quality group characteristics. The third one is the sample preparation and characterization. This stage impacts directly on spectral data collected from NMR experiments. Even though NMR metabolomics’ great advantage relies on the ability to analyze samples non-destructively, with minimal sample preparation, the proper extraction method or the removal large size molecules such as chlorophyll by using Solid Phase Extraction (SPE) may influence the chemical information to be seen on spectral data (Kim et al., 2010; Nagana Gowda and Raftery, 2015). The last step is the evaluation of the collected dataset. At this point, the choice of a proper chemometric strategy (e.g., uni- or multivariate analysis, unsupervised or supervised analysis) plays a key role in answering the problem proposed in the first step. Having a comprehensive understanding of chemometrics calculations enables more effective analysis and the production of dependable data insights. Failing to consider statistical methodologies may lead to the necessity of complex and less commonly understood statistical tests, resulting in confusing and challenging-to-explain outcomes. Additionally, improper sample sizes can result in wasted resources and compromised experimental results (Mcdonald, 2009). We recommend the review of Hendriks et al. (2011) for a thorough understanding of metabolomics experimental design.
Concerning data analysis, the combination of univariate and multivariate approaches provides a wider comprehension of plant metabolomics (Deborde et al., 2017). For a better comprehension of why and when to use uni and/or multivariate data analysis, we suggest further reading of Saccenti et al. (2013). In the present work, we bring a few definitions of the most commonly used tests on uni- and multivariate analysis of plant metabolomics and provide a few examples and comments on literature reports.
Generally, multivariate analysis are the first ones performed by plant metabolomic essays to obtain a deeper comprehension of similarities and dissimilarities in a given dataset (Lavine and Rayens, 2009; Deborde et al., 2017). These chemometric tests utilize spectral information–binning integrals or metabolite concentrations–to assess the simultaneous relationships among variables (Saccenti et al., 2013). Exploratory data analysis techniques, such as Hierarchical Cluster Analysis (HCA) and Principal Component Analysis (PCA), are characterized as unsupervised methods presenting the data without making assumptions about specific classes or groupings. These analyses provide data overview without the need for previous cluster information and reveal, if existent, outliers and group trends (Madsen et al., 2010). On the other hand, discriminant classification techniques, such as Linear Discriminant Analysis (LDA), Partial Least Squares Discriminant Analysis (PLS-DA), and Orthogonal Partial Least Squares Discriminant Analysis (OPLS-DA), are utilized to assign samples to predefined classes based on their most likely classification (Oliveri et al., 2020).
The HCA algorithm employs recursive splits to create clusters using sample distance (such as Euclidean, Mahalanobis, Ward, or Manhattan distance) and linkage criteria among groups. The calculated clusters generally result in class overlap if the class characteristics are not clear to the model. Results are represented on a dendrogram (Granato et al., 2018). In contrast, PCA is a statistical technique utilized in chemometrics to streamline data by identifying and eliminating redundancies, ultimately decreasing the number of variables to improve analysis efficiency. This process involves creating a new set of independent linear components (the Principal Components–PC) that are fewer in number compared to the original dimensions, reducing data dimensionality, and removing correlated information (Madsen et al., 2010). A recent application of unsupervised analysis was reported by Marion et al. (2020). They proposed the use of an Adaptive Clustering around Latent Variables (AdaCLV), a strategy similar to PCA, due to the clustering of variables with dimensionality reduction. AdaCLV automatically identifies spectral variables that are most distinct between samples, assigns them to variable clusters, and calculates non-orthogonal latent variables for each cluster. Cluster membership is then determined by estimating degrees of membership that reflect the importance of variables within a cluster. This allows for the ranking of variables for biomarker validation. Ultimately, only variables that effectively differentiate samples (potential biomarkers) have nonzero cluster membership degrees (Marion et al., 2020).
On the other hand, the first discriminant analysis worth mentioning is LDA. This technique is used for dimensionality reduction to improve class separation. LDA classification utilizes the Mahalanobis distance and calculates a single pooled covariance matrix S instead of individual estimates for each class (Xanthopoulos et al., 2013). In PLS-DA class modeling the dataset is structured into a Xij matrix in which the i lines represent the samples while the j columns represent the instrumental variables and a Yin matrix, which contains the values for the property of interest being evaluated and its number of columns depends on the number of classes under study. Both matrices X and Y are broken down into new synthetic variables known as Latent Variables (LV). These LV scores are optimized to differentiate between the sample groups based on the factor being analyzed. The PLS method emphasizes enhancing the relationship between the dependent variable and the scores, indicating that the latent variables represent the most effective directions for distinguishing the classes being studied. However, unlike PCA which contains uncorrelated information in its PC, PLS-DA may exhibit some level of correlation among its LVs. This correlation is a result of rotations performed during the calculation to improve the classification between groups (Deborde et al., 2017). By adding an orthogonal filtering step to the PLS-DA method, OPLS-DA can effectively separate the systematic variation of interest by mitigating the influence of confounding sources. This process eliminates any uncorrelated information in matrix X that may impact its relationship with matrix Y (Bylesjö et al., 2006; Holmes et al., 2006).
The literature reports several statistical software for chemometrics strategies. Some software like SIMCA (www.sartorius.com), Unscrambler, OriginPro, and GraphPad have statistical tools incorporated into their routines. Softwares such as R and MatLab (www.mathworks.com) require statistical packages to run multivariate calculations and a basic knowledge of their related programming languages. For R software some examples include the caret, randomForest, e1071, and chemometrics packages–available at Comprehensive R Archive Network (CRAN) repository. For MatLab, the PCA Toolbox and Classification Toolbox can be used (Ballabio and Consonni, 2013; Ballabio, 2015) for exploratory and discriminant analysis. Moreover, online platforms such as MetaboAnalyst (https://www.metaboanalyst.ca) and BiostatFlow (biostatflow.org) are alternatives relatively easy to use but with less autonomy for the operator to perform the chemometric data analysis (Xia et al., 2012; Jacob et al., 2018). Figure 4 summarizes the uses of uni- and multivariate for extracting data relevant information. For a better comprehension of multivariate data modeling, we recommend the work of Araújo Gomes and coworkers (de Araújo Gomes et al., 2023).

Figure 4. Fluxogram of potential insights for the analysis of plant metabolomics data using uni- and multivariate analysis.
Generally, plant metabolomics studies start by performing a PCA for unbiased data analysis and then performing a PLS-DA to observe cluster differentiation (Pan et al., 2014; Bevilacqua et al., 2017; Hong et al., 2020; Boutchouang et al., 2024). Another strategy is to additionally perform an OPLS-DA to enhance the goodness-of-fit and the predictive ability (Lawal et al., 2017; Hernández-Bolio et al., 2018; Farhadi et al., 2019). As an example, Kortesniemi et al. (2015) used PCA to observe possible trends to differentiate seed extracts Brassica napus L. and Brassica rapa L. In sequence, they performed a PLS-DA and OPLS-DA. OPLS-DA resulted in improved group separation, however, failed to present great prediction metrics. This example highlights that the data set contains the key information to distinguish between groups of interest and that when satisfactory prediction metrics are not found, there may be no relevant differences between the evaluated groups. When traditional methods, such as discriminant analysis, are ineffective in achieving group separation, it may be valuable to consider utilizing machine learning or deep learning approaches as an alternative solution. Their effectiveness is derived from their ability to acquire complex non-linear models from extensive training data sets (Kong et al., 2020). Although these approaches are still rare in plant metabolomics, they have been used for peak picking, denoising, chemical shift prediction, and mixture component identification and may be the natural future of plant metabolomics, which may come with the increasing data sizes by analyzing a bigger n and bigger populations where there is more noise (Wang et al., 2023). To evaluate and classify different plant flavors, Wang et al. (2023) used DeepMID on their data. The model was able to identify mixtures of metabolites extracted from plants (natural plant flavors) and artificial mixtures of formulated plant flavors with great accuracy and a true positive rate. DeepMID algorithm consists of three major components: data augmentation, a pseudo-Siamese convolutional neural network, and lastly provides a mixture identification model. The high values achieved in accuracy are related to the ability of the model on combining experimental data and an NMR spectral database to predict the analyzed samples behavior (Wang et al., 2023). SVM is a highly effective tool for predictive pattern recognition in processing a vast amount of experimental data. SVM’s predictive capabilities are based on the use of hypersurfaces to accurately classify data (Lavine and Rayens, 2009). In the SVM algorithm, a quadratic optimization problem is resolved to optimize the margin between instances of two distinct classes, either within the initial input space or in a higher-dimensional space through the application of kernel functions. RF algorithm is built upon a collection of multiple decision trees. This methodology centers on improving classification accuracy by creating an ensemble of trees. This ensemble then collaborates to select the most appropriate class based on a well-defined training dataset (Gromski et al., 2014). Examples of the use of SVM and RF worth mentioning are the studies of Miros et al. (2020), Ramírez-Meraz et al. (2020), and Lund et al. (2017). To evaluate Hypericum perforatum L. (Common St John’s wort) response to altered light spectra, Miros and coworkers used SVM and RF models. They observed that these clustering alternatives presented a better discriminate power (improvements in accuracy) rather than the OPLS-DA overfitted model (Miros et al., 2020). A similar result was obtained by Ramírez-Meraz and coworkers. They used RF to determine chemical divergences among ten jalapeño peppers. The use of RF obtained a more accurate classifier than a previous OPLS-DA calculated (Ramírez-Meraz et al., 2020). Meanwhile, Lund and coworkers used SVM for identification of chemical markers which separate the European Crataegus and North American Crataegus species from each other. The analysis provided relevant information on group characteristics regarding the spectral bins in the phenolics region (6–8 ppm). In accordance with Miros et al. (2020), their findings in RF models also outperformed a supervised model, but in this case, PLS-DA (Lund et al., 2017).
To evaluate the performance of multivariate models it is important to estimate the best classification metric. The values of R, R2, Q2, p-value, VIP scores, True Positive Rate (TPR), True Negative Rate (TNR), accuracy, and Receiver Operating Characteristic (ROC) curve are the ones most evaluated for metabolomic multivariate analysis. The description of each parameter mentioned is listed in Table 2. A correct interpretation of these combined metrics allows a proper interpretation of the predictive power of the model used (Bevilacqua et al., 2017). It is possible to validate these metrics using an external set for model validation or by cross-validation procedures (e.g., k-fold, leave-one-out-cross-validation, Monte-Carlo, 2CV) (Triba et al., 2015).
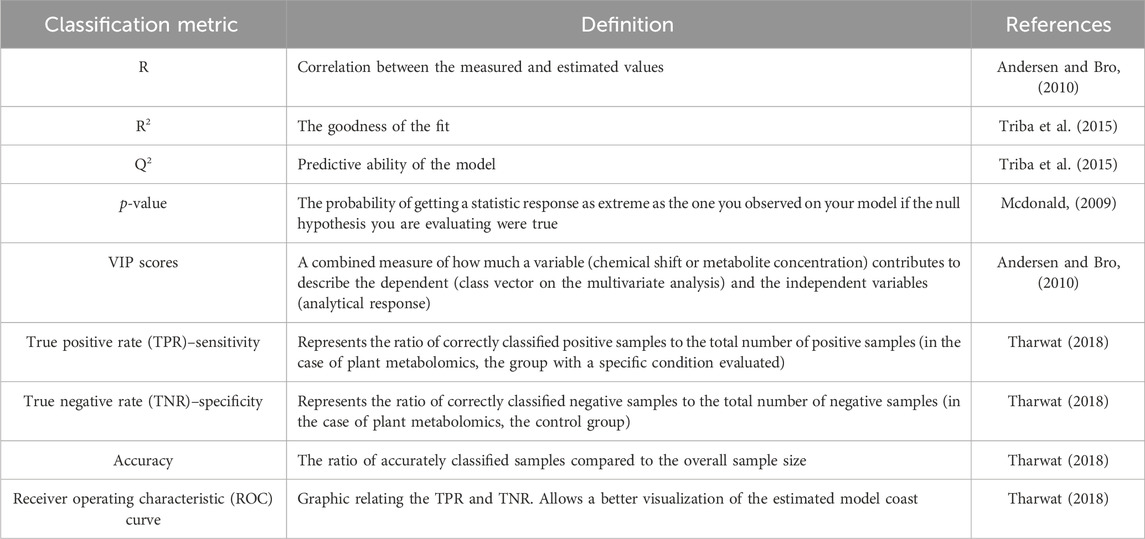
Table 2. Description of performance parameters for multivariate models.
Classification metrics contain information about the ability of the calculated model to characterize data based on spectral similarity. For example, poor values of R2 indicate an unsatisfactory regression model. Meanwhile, divergences in R2 and Q2 indicate an overfitted model. VIP scores contain information about the variable relevance of the proposed model. When a variable presents VIP < 1, it signifies a variable of low significance that may be considered for removal (Andersen and Bro, 2010). The p-value observed in multivariate analysis has the same statistical principle as the one observed in univariate analysis. A statistically significant result (p < 0.05) indicates that the predictive model successfully identified differences in the analytical responses of the dataset across the evaluated classes. Alternatively, the null hypothesis is accepted, indicating that the samples evaluated do not demonstrate variation based on the classes being assessed. Consequently, the observations are deemed insignificant (Mcdonald, 2009). Accuracy, TPR, TNR, and the ROC curve are the most effective measures for evaluating whether the model leans towards a type I or type II error. Type I error on uni-or multivariate statistics is related to the ability of the model to assume a high number of false positive samples (high TPR), which leads to rejecting the null hypothesis even though it is not true. The opposite situation, failing to reject the null hypothesis even though it is not true (high TNR), is related to the false negative samples, or type II error.
In contrast with multivariate analysis, the univariate data approach encompasses tests for determining the statistical relevance of discrete data measurements from nominal variables (e.g., experimentally observed characteristics) or measured variables (e.g., metabolite concentration). Here we present some theoretical concepts useful for plant metabolomics essays based on the Handbook of Biological Statistics (https://www.biostathandbook.com). When you choose to conduct univariate statistics, you are selecting to analyze a null hypothesis based on discrete measurements assuming data with normal distribution. The null hypothesis serves as the initial assumption that is considered to be accurate. Subsequently, data collected is used to determine whether the null hypothesis holds or should be disproven. In plant metabolomics, a null hypothesis could be assumed as “different plant conditions do not affect primary metabolites production”. When evaluating the presence or absence of primary metabolites or sample characteristics (e.g., blue or pink flower color, fungal infection or not) on distinguished plant conditions we use nominal variable comparison. To perform it, we recommend Fisher’s exact test because it provides information on an independence test in the analysis of two nominal variables to determine if there is a significant difference in proportions based on the values of the other variable (Mcdonald, 2009).
For primary metabolite concentration comparison, we recommend the use of tests for multiple measurement variables. They encompass one-way and two-way ANOVA, paired t-test, Wilcoxon test, and Tukey’s test. Table 3 provides a brief description of these tests. Describing a few examples of the use of univariate tests on plant metabolomics there is Boutchouang et al. (2024) used Wilcoxon test to evaluate statistical relevance on 20 metabolites upon different nominal variables (genotype) of Theobroma cacao L. Hernández-Guerrero et al. (2021) performed a one-way ANOVA to determine significant discrepancies in metabolites concentration on Bean cultivars (Phaseolus vulgaris L.). A similar procedure was performed by Borim de Souza et al. (2023) by using one-way ANOVA to analyze the statistical relevance of the concentration variance of L-proline, D-pinitol, kaempferol, and quercetin between treatments. In addition, they performed a Tukey’s test to evaluate the contrast between the metabolite means.
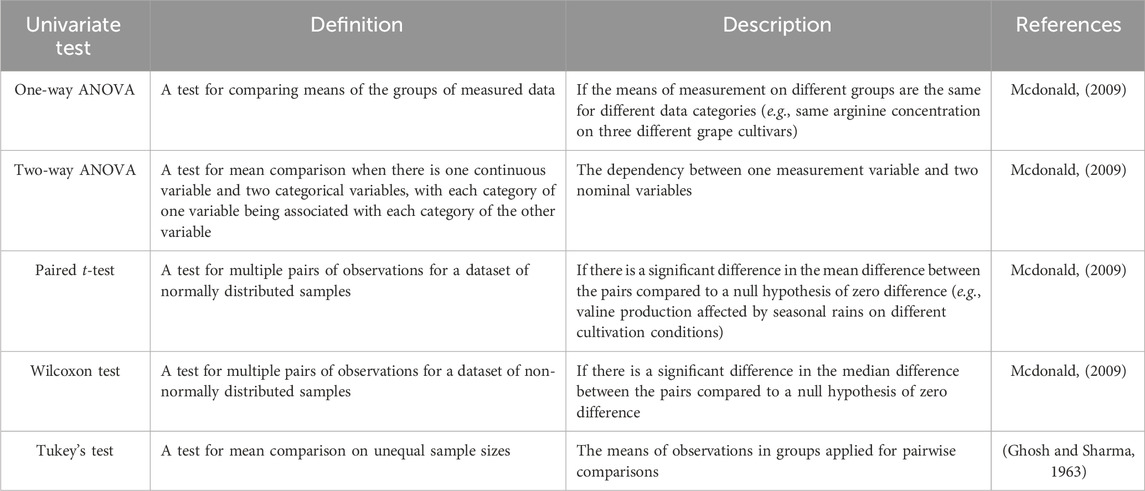
Table 3. Description of univariate tests frequently used for NMR-based metabolomics.
Additionally, there is a univariate correction test available for mitigating the familywise error rate, known as Bonferroni’s correction which is recommended in situations where the occurrence of a single false positive among a set of tests would have significant implications. This correction method is particularly beneficial when dealing with a limited number of multiple comparisons and aiming to identify one or two potentially significant findings. However, in cases involving a substantial number of multiple comparisons and a search for numerous potentially significant results, applying the Bonferroni correction may result in an increased risk of false negatives. We recommend consulting the Handbook of Biological Statistics for further comprehension of this correction (Mcdonald, 2009).
Finally, the univariate statistics for plant metabolomics analyze metabolomic features independently. A great advantage is that it presents powerful information on testing target metabolites. Limitations of these approaches include the lack of consideration of potential interactions between various metabolic features and feature information needed to assume normal distribution (Alonso et al., 2015).
In summary, there is no right or wrong calculus to use in plant metabolomics. It is important to address the most adequate ones to achieve the aim of the study. However, we recommend having in mind the parsimonious principle–using minimal parameters to accurately describe a dataset and make precise predictions–when choosing the best chemometrics approach to data analysis (Seasholtz and Kowalski, 1993).
NP investigation is relevant to a wide range of research fields, including basic and applied sciences. One of the easiest applied sciences applications to remember is drug discovery, in which bioactive NP’s chemical scaffolds are used to give rise to commercial drugs (Atanasov et al., 2021). For a more comprehensive view of new drugs originating from NP, we recommend the review from Newman and Cragg (2020) which gives an enhanced comprehension of the worldwide approved drugs by year. Another important applied field where plant metabolomics is relevant is agriculture, for instance, searching for new pesticides and herbicides or the investigation of biotic and abiotic stresses in plant metabolism (Coutinho et al., 2016; 2017; 2018; Camargo et al., 2020; Borim de Souza et al., 2023). Food sciences and fraud testing is also an application as shown by McGrath et al. (2018) and Silva Barbosa Correia et al. (2024). In the scope of basic sciences, are plant phenotyping (Hall et al., 2022) and chemical ecology (Kuhlisch and Pohnert, 2015), among others.
A well-planned and designed experiment is the basis for achieving quality results, and sample collection and preparation are directly related to this topic. For that, having a clear hypothesis will determine the important features to consider. Accordingly, an extensive review of the literature, focusing on the specialized metabolites expected to be found in the selected species can shorten the way of the later and laborious step of metabolite assignment. As mentioned before, the number of biological replicates – NMR is highly reproducible, so technical replicates are not necessary – to obtain statistical significance. Therefore, the question to be answered by a study will determine the number of replicates to be used, generally using a higher number of samples (n) increases the quality of the results. To specify, numbers frequently used by researchers are three or five replicates (Kim et al., 2010). However, an n > 10 is more suitable for well-controlled NMR-based metabolomic approaches. For instance, when searching for biomarkers of a species, the higher the noise is (e.g., too similar groups or unclear hypothesis), the higher this n should be. This increased sample size helps to ensure the statistical robustness and reliability of the results, allowing for better differentiation between true biological signals and noise (McGrath et al., 2018; Powers et al., 2024).
Accordingly, the time of collection, part of the plant to be harvested, and quenching for stopping enzymatic reactions are some of the details that are involved in the experiment design. Figure 5 represents a workflow of the steps that are important to get reproducible and meaningful results from data.
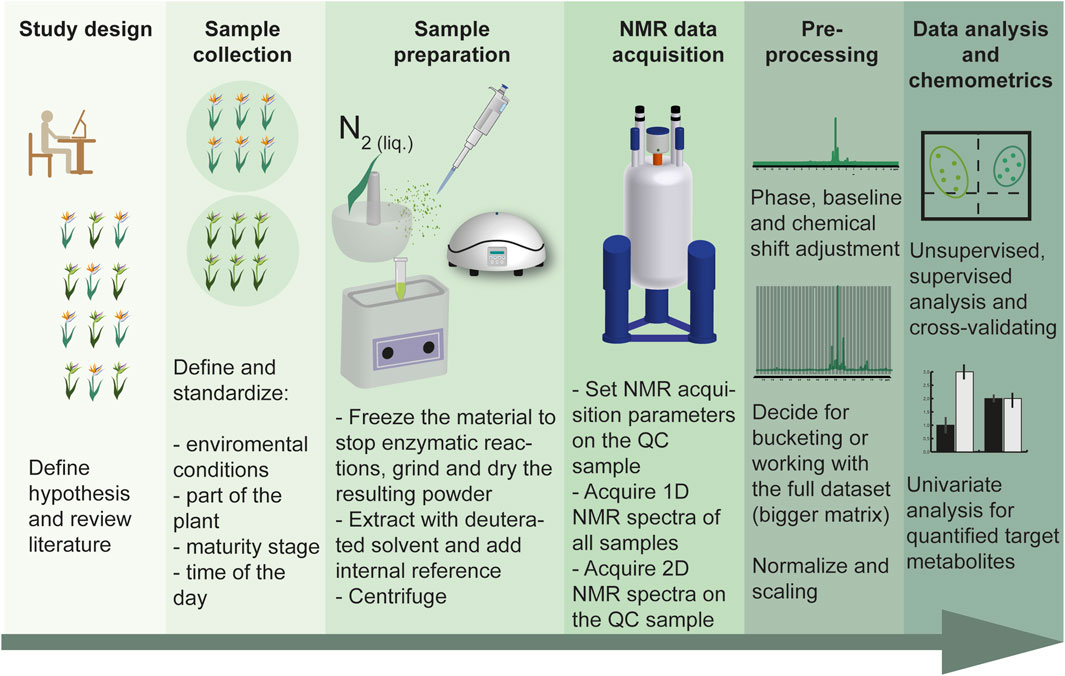
Figure 5. Workflow for plant metabolomics showing all the necessary steps for obtaining meaningful results.
Another fundamental aspect of plant metabolomics is to acknowledge that in most of the protocols, an extraction step is required. This means that it is not possible to obtain a comprehensive view of the metabolome, and for that other approaches such as HR-MAS may be employed. Moreover, solvent interactions must be considered as occasionally they may change the chemical structure of a metabolite (Maltese et al., 2009; Choi and Verpoorte, 2014; Ocampos et al., 2017; Schneider, 2017).
Innovative discovery methods are the means to find new bioactive compounds (Pye et al., 2017). NMR approach and weaknesses have been already presented in this review and innovations in instrumentation are arriving to address its weaknesses. According to Wishart (2019), three main tendencies are guiding technology development: lowering the costs (i.e., buying and maintaining), decreasing the size of NMR instruments, and increasing sensitivity. Examples of these are benchtops, cryogen-free superconducting magnet technology, high-temperature superconducting, higher field magnets (now up to 1.2 GHz), nuclear and spin hyperpolarization (e.g., Dynamic Nuclear Polarization – DNP), 1H and 13C Cryoprobes, all these already available for use (Wishart, 2019). New technologies specifically to plant metabolomics – such as IVDr for biofluids – that standardize the procedure and make high throughput screening more reliable, are a possible near future of the daily routine of uncovering plant metabolomics. However, new, and more complex 1- and 2D pulse sequences may help as well to address higher sensitivity and to select targeted metabolites (e.g., Pure Shift NMR).
As 1D NMR is the most used type of experiment for NMR metabolomics, recording 2D NMR experiments in the pool of all the samples is important to validate structure identification. Preparation procedures for acquiring NMR experiments must be carried out for each sample to ensure the optimization of the experiments, resulting in the highest signal intensity in the spectra and contour maps. Additionally, 1D and 2D experiments, along with their respective acquisition setups, are recommended based on Plant metabolomics NMR literature but should be optimized according to the specific requirements of the planned study. The homonuclear 1H-1H COSY and TOCSY and the heteronuclear 1H-13C HSQC and HMBC are commonly employed to aid metabolite assignments. Finally, preparing a quality control (QC) sample, composed of the pool of all samples, is not only used to acquire 2D experiments but also to calculate pulse power, the offset region for water signal pre-saturation, and shimming. Spectra phasing, baseline corrections, and chemical shift referencing are NMR data processing parameters that should be performed and reported in publications (Powers et al., 2024). Accordingly, choosing and reporting the treatment given to the dataset to create a matrix suitable for chemometrics analysis are important features. Besides, it is necessary to specify whether bucketing was performed, the size of the buckets, and the pretreatment used to generate the matrix (e.g., normalization and scaling method).
The statistical aspects connected to the metabolomics workflow (Figure 5) are also relevant. This way, reporting univariate statistical significance by checking the p-value and false discovery rate or multiple hypothesis correction methods increases the confidence of the study. Regarding multivariate analysis, it is important to report R2 and Q2 values to correlate predicted and original data. Having a set of samples aside for cross-validating for determining the p-value the analysis is another aspect frequently not found in the literature (Powers et al., 2024). Goodacre et al. (2007) proposed the minimum reported standards for data analysis, all of which we presented and discussed in this review, together with other references. Lastly, to make possible the peer validation of results, it is imperative to deposit the data that originated the study results in public data repositories (McAlpine et al., 2019; Powers et al., 2024).
Predictions by experts in the field, for instance by Kim et al. (2011), indicated trends such as single-cell metabolomics, standardization of methods and procedures, and creation of a common public database. The field has not yet achieved these goals, but progress has been made, given the recent development of data repositories and progress in reporting the data and methods properly (Powers et al., 2024). Finally, NMR-based plant metabolomics has a promising future, as high-throughput studies give rise to huge datasets that, when well designed, have the potential to solve more complex problems in basic and applied plant sciences.
FO: Writing–review and editing, Writing–original draft, Visualization, Supervision, Project administration, Conceptualization. AS: Visualization, Writing–review and editing, Writing–original draft, Conceptualization. GR: Writing–review and editing, Writing–original draft, Visualization, Conceptualization. LA: Writing–review and editing, Writing–original draft, Visualization, Conceptualization. NC: Writing–review and editing, Writing–original draft, Visualization, Supervision, Conceptualization. LC: Writing–review and editing, Writing–original draft, Visualization, Validation, Supervision, Conceptualization.
The author(s) declare that financial support was received for the research, authorship, and/or publication of this article. FO thanks CNPq (151121/2023-0) and FAPESP (2023/11605-2) for financial support and fellowships. AS thanks FAPESP (2021/10123-9) for the fellowship. LA thanks CNPq (141537/2021-3) for the scholarship. LC thanks FAPESP (2021/12694-3) for fundings.
All authors are grateful to the finance agencies that directly or indirectly enabled this work: CNPq, FAPESP, and Finep. FO thanks CNPq (151121/2023-0) and FAPESP (2023/11605-2) for fellowships. AS thanks FAPESP (2021/10123-9) for the fellowship. LA thanks CNPq (141537/2021-3) for the scholarship. LC thanks FAPESP (2021/12694-3) for fundings. The authors also thank the institutions USP and Embrapa for the infrastructure.
The authors declare that the research was conducted in the absence of any commercial or financial relationships that could be construed as a potential conflict of interest.
The reviewer MADSF declared a shared affiliation with the author GR to the handling editor at the time of review.
All claims expressed in this article are solely those of the authors and do not necessarily represent those of their affiliated organizations, or those of the publisher, the editors and the reviewers. Any product that may be evaluated in this article, or claim that may be made by its manufacturer, is not guaranteed or endorsed by the publisher.
Aldridge, B. B., and Rhee, K. Y. (2014). Microbial metabolomics: innovation, application, insight. Curr. Opin. Microbiol. 19, 90–96. doi:10.1016/j.mib.2014.06.009
Ali, S., Badshah, G., Da Ros Montes D’Oca, C., Ramos Campos, F., Nagata, N., Khan, A., et al. (2020). High-resolution magic angle spinning (HR-MAS) NMR-based fingerprints determination in the medicinal plant Berberis laurina. Molecules 25, 3647. doi:10.3390/molecules25163647
Alonso, A., Marsal, S., and Julià, A. (2015). Analytical methods in untargeted metabolomics: state of the art in 2015. Front. Bioeng. Biotechnol. 3, 23. doi:10.3389/fbioe.2015.00023
Andersen, C. M., and Bro, R. (2010). Variable selection in regression-a tutorial. J. Chemom. 24, 728–737. doi:10.1002/cem.1360
Anjitha, K. S., Sameena, P. P., and Puthur, J. T. (2021). Functional aspects of plant secondary metabolites in metal stress tolerance and their importance in pharmacology. Plant Stress 2, 100038. doi:10.1016/J.STRESS.2021.100038
Atanasov, A. G., Zotchev, S. B., Dirsch, V. M., Orhan, I. E., Banach, M., Rollinger, J. M., et al. (2021). Natural products in drug discovery: advances and opportunities. Nat. Rev. Drug Discov. 2021 20 (3), 200–216. doi:10.1038/s41573-020-00114-z
Augustijn, D., de Groot, H. J. M., and Alia, A. (2021). HR-MAS NMR applications in plant metabolomics. Molecules 26, 931. doi:10.3390/molecules26040931
Au - Lopez, J. M., Au - Leyva, V., and Au - Maruenda, H. (2021). Pure shift nuclear magnetic resonance: a new tool for plant metabolomics. JoVE, e62719. doi:10.3791/62719
Ballabio, D. (2015). A MATLAB toolbox for Principal Component Analysis and unsupervised exploration of data structure. Chemom. Intelligent Laboratory Syst. 149, 1–9. doi:10.1016/j.chemolab.2015.10.003
Ballabio, D., and Consonni, V. (2013). Classification tools in chemistry. Part 1: linear models. PLS-DA. Anal. Methods 5, 3790–3798. doi:10.1039/c3ay40582f
Beckonert, O., Keun, H. C., Ebbels, T. M. D., Bundy, J., Holmes, E., Lindon, J. C., et al. (2007). Metabolic profiling, metabolomic and metabonomic procedures for NMR spectroscopy of urine, plasma, serum and tissue extracts. Nat. Protoc. 2, 2692–2703. doi:10.1038/nprot.2007.376
Bendet-Taicher, E., Müller, N., and Jerschow, A. (2014). Dependence of NMR noise line shapes on tuning, matching, and transmission line properties. Concepts Magn. Reson Part B Magn. Reson Eng. 44, 1–11. doi:10.1002/cmr.b.21253
Berni, R., Luyckx, M., Xu, X., Legay, S., Sergeant, K., Hausman, J. F., et al. (2019). Reactive oxygen species and heavy metal stress in plants: impact on the cell wall and secondary metabolism. Environ. Exp. Bot. 161, 98–106. doi:10.1016/J.ENVEXPBOT.2018.10.017
Bevilacqua, M., Bro, R., Marini, F., Rinnan, Å., Rasmussen, M. A., and Skov, T. (2017). Recent chemometrics advances for foodomics. TrAC Trends Anal. Chem. 96, 42–51. doi:10.1016/J.TRAC.2017.08.011
Bharti, S. K., Bhatia, A., Tewari, S. K., Sidhu, O. P., and Roy, R. (2011). Application of HR-MAS NMR spectroscopy for studying chemotype variations of Withania somnifera (L.) Dunal. Magnetic Reson. Chem. 49, 659–667. doi:10.1002/mrc.2817
Bharti, S. K., and Roy, R. (2012). Quantitative 1H NMR spectroscopy. TrAC Trends Anal. Chem. 35, 5–26. doi:10.1016/j.trac.2012.02.007
Bingol, K. (2018). Recent advances in targeted and untargeted metabolomics by NMR and MS/NMR methods. High-Throughput 2018 7, 9–7. doi:10.3390/HT7020009
Bingol, K., Bruschweiler-Li, L., Yu, C., Somogyi, A., Zhang, F., and Brüschweiler, R. (2015). Metabolomics beyond spectroscopic databases: a combined MS/NMR strategy for the rapid identification of new metabolites in complex mixtures. Anal. Chem. 87, 3864–3870. doi:10.1021/ac504633z
Bloembergen, N., Purcell, E. M., and Pound, R. V. (1948). Relaxation effects in nuclear magnetic resonance absorption. Phys. Rev. 73, 679–712. doi:10.1103/PhysRev.73.679
Borim de Souza, A. J., Ocampos, F. M. M., Catoia Pulgrossi, R., Dokkedal, A. L., Colnago, L. A., Cechin, I., et al. (2023). NMR-based metabolomics reveals effects of water stress in the primary and specialized metabolisms of Bauhinia ungulata L. (Fabaceae). Metabolites 13, 381. doi:10.3390/metabo13030381
Böttcher, T., Pitscheider, M., and Sieber, S. A. (2010). Natural products and their biological targets: proteomic and metabolomic labeling strategies. Angew. Chem. Int. Ed. 49, 2680–2698. doi:10.1002/anie.200905352
Boutchouang, R. P., Fliniaux, O., Eyamo, J. V. E., Djabou, A. S. M., Fontaine, J. X., Molinié, R., et al. (2024). Metabolome profiling of cacao (Theobroma cacao L.) callus under drought stress conditions induced by polyethylene glycol (PEG) as osmoticant. Phytochem. Anal. 35, 708–722. doi:10.1002/pca.3323
Breton, R. C., and Reynolds, W. F. (2013). Using NMR to identify and characterize natural products. Nat. Prod. Rep. 30, 501–524. doi:10.1039/C2NP20104F
Bylesjö, M., Rantalainen, M., Cloarec, O., Nicholson, J. K., Holmes, E., and Trygg, J. (2006). OPLS discriminant analysis: combining the strengths of PLS-DA and SIMCA classification. J. Chemom. 20, 341–351. doi:10.1002/cem.1006
Camargo, M. S., Coutinho, I. D., Lourenço, S. A., Soares, M. K. M., Colnago, L. A., Appezzato-da-Glória, B., et al. (2020). Potential prophylactic role of silicon against brown rust (Puccinia melanocephala) in sugarcane. Eur. J. Plant Pathol. 157, 77–88. doi:10.1007/s10658-020-01982-2
Cantrell, C. L., Dayan, F. E., and Duke, S. O. (2012). Natural products as sources for new pesticides. J. Nat. Prod. 75, 1231–1242. doi:10.1021/np300024u
Cavalier-Smith, T. (1981). Eukaryote kingdoms: seven or nine? Biosystems 14, 461–481. doi:10.1016/0303-2647(81)90050-2
Caytan, E., Remaud, G. S., Tenailleau, E., and Akoka, S. (2007). Precise and accurate quantitative 13C NMR with reduced experimental time. Talanta 71, 1016–1021. doi:10.1016/j.talanta.2006.05.075
Chauthe, S. K., Sharma, R. J., Aqil, F., Gupta, R. C., and Singh, I. P. (2012). Quantitative NMR: an applicable method for quantitative analysis of medicinal plant extracts and herbal products. Phytochem. Anal. 23, 689–696. doi:10.1002/pca.2375
Chen, W.-P., Yang, X.-Y., Harms, G. L., Gray, W. M., Hegeman, A. D., and Cohen, J. D. (2011). An automated growth enclosure for metabolic labeling of Arabidopsis thaliana with (13)C-carbon dioxide - an in vivo labeling system for proteomics and metabolomics research. Proteome Sci. 9, 9–14. doi:10.1186/1477-5956-9-9
Chen, X., Bertho, G., Caradeuc, C., Giraud, N., and Lucas-Torres, C. (2023). Present and future of pure shift NMR in metabolomics. Magnetic Reson. Chem. 61, 654–673. doi:10.1002/mrc.5356
Choi, Y. H., and Verpoorte, R. (2014). Metabolomics: what you see is what you extract. Phytochem. Anal. 25, 289–290. doi:10.1002/pca.2513
Çiçek, S. S., Girreser, U., and Zidorn, C. (2018). Quantification of the total amount of black cohosh cycloartanoids by integration of one specific 1H NMR signal. J. Pharm. Biomed. Anal. 155, 109–115. doi:10.1016/j.jpba.2018.03.056
Çiçek, S. S., Moreno Cardenas, C., and Girreser, U. (2022). Determination of total sennosides and sennosides A, B, and A1 in Senna leaflets, pods, and tablets by two-dimensional qNMR. Molecules 27, 7349. doi:10.3390/molecules27217349
Clendinen, C. S., Lee-McMullen, B., Williams, C. M., Stupp, G. S., Vandenborne, K., Hahn, D. A., et al. (2014). 13C NMR metabolomics: applications at natural abundance. Anal. Chem. 86, 9242–9250. doi:10.1021/ac502346h
Clendinen, C. S., Pasquel, C., Ajredini, R., and Edison, A. S. (2015). 13C NMR metabolomics: INADEQUATE network analysis. Anal. Chem. 87, 5698–5706. doi:10.1021/acs.analchem.5b00867
Clendinen, S., Stupp, S., Wang, B., Garrett, J., and Edison, S. (2016). 13C metabolomics: NMR and IROA for unknown identification. Curr. Metabolomics 4, 116–120. doi:10.2174/2213235X04666160407212156
Cohen, C. G., Mazer, B. D., and Jean-Claude, B. J. (2024). Molecular profiling of peanut under raw, roasting, and autoclaving conditions using high-resolution magic angle spinning and solution 1H NMR spectroscopy. Molecules 29, 162. doi:10.3390/molecules29010162
Colella, M. F., Salvino, R. A., Gaglianò, M., Litrenta, F., Oliviero Rossi, C., Le Pera, A., et al. (2022). NMR spectroscopy applied to the metabolic analysis of natural extracts of cannabis sativa. Molecules 27, 3509. doi:10.3390/molecules27113509
Colombo, C., Aupic, C., Lewis, A. R., and Pinto, B. M. (2015). In situ determination of fructose isomer concentrations in wine using 13C quantitative nuclear magnetic resonance spectroscopy. J. Agric. Food Chem. 63, 8551–8559. doi:10.1021/acs.jafc.5b03641
Correia, B. S. B., Piagge, P. M. F. D., Almeida, L. S., Ribeiro, G. H., de Souza Peixoto, C., Colnago, L. A., et al. (2023). “The use of NMR based metabolomics to discriminate patients with viral diseases,” in COVID-19 metabolomics and diagnosis (Cham: Springer International Publishing), 129–174. doi:10.1007/978-3-031-15889-6_7
Coutinho, I. D., Baker, J. M., Ward, J. L., Beale, M. H., Creste, S., and Cavalheiro, A. J. (2016). Metabolite profiling of sugarcane genotypes and identification of flavonoid glycosides and phenolic acids. J. Agric. Food Chem. 64, 4198–4206. doi:10.1021/acs.jafc.6b01210
Coutinho, I. D., Henning, L. M. M., Döpp, S. A., Nepomuceno, A., Moraes, L. A. C., Marcolino-Gomes, J., et al. (2018). Flooded soybean metabolomic analysis reveals important primary and secondary metabolites involved in the hypoxia stress response and tolerance. Environ. Exp. Bot. 153, 176–187. doi:10.1016/J.ENVEXPBOT.2018.05.018
Coutinho, I. D., Moraes, T. B., Mertz-Henning, L. M., Nepomuceno, A. L., Giordani, W., Marcolino-Gomes, J., et al. (2017). Integrating high-resolution and solid-state magic angle spinning NMR spectroscopy and a transcriptomic analysis of soybean tissues in response to water deficiency. Phytochem. Anal. 28, 529–540. doi:10.1002/pca.2702
Cullen, C. H., Ray, G. J., and Szabo, C. M. (2013). A comparison of quantitative nuclear magnetic resonance methods: internal, external, and electronic referencing. Magnetic Reson. Chem. 51, 705–713. doi:10.1002/mrc.4004
Dadiotis, E., Mitsis, V., Melliou, E., and Magiatis, P. (2022). Direct quantitation of phytocannabinoids by one-dimensional 1H qNMR and two-dimensional 1H-1H COSY qNMR in complex natural mixtures. Molecules 27, 2965. doi:10.3390/molecules27092965
David, B., Wolfender, J.-L., and Dias, D. A. (2014). The pharmaceutical industry and natural products: historical status and new trends. Phytochem. Rev. 14, 299–315. doi:10.1007/s11101-014-9367-z
Dayan, F. E., Cantrell, C. L., and Duke, S. O. (2009). Natural products in crop protection. Bioorg Med. Chem. 17, 4022–4034. doi:10.1016/j.bmc.2009.01.046
Dayananda, B., Owen, S., Kolobaric, A., Chapman, J., and Cozzolino, D. (2023). Pre-processing applied to instrumental data in analytical chemistry: a brief review of the methods and examples. Crit. Rev. Anal. Chem., 1–9. doi:10.1080/10408347.2023.2199864
Dayrit, F. M., and Dios, A. C. de (2017). in 1H and 13C NMR for the profiling of natural product extracts: theory and applications. Editors E. Sharmin, and F. Zafar (Rijeka, Croatia: IntechOpen). Ch. 5. doi:10.5772/intechopen.71040
de Araújo Gomes, A., Azcarate, S. M., Špánik, I., Khvalbota, L., and Goicoechea, H. C. (2023). Pattern recognition techniques in food quality and authenticity: a guide on how to process multivariate data in food analysis. TrAC Trends Anal. Chem. 164, 117105. doi:10.1016/J.TRAC.2023.117105
Deborde, C., Fontaine, J. X., Jacob, D., Botana, A., Nicaise, V., Richard-Forget, F., et al. (2019). Optimizing 1D 1H-NMR profiling of plant samples for high throughput analysis: extract preparation, standardization, automation and spectra processing. Metabolomics 15, 28–12. doi:10.1007/s11306-019-1488-3
Deborde, C., and Jacob, D. (2014). MeRy-B, a metabolomic database and knowledge base for exploring plant primary metabolism. Methods Mol. Biol. 1083, 3–16. doi:10.1007/978-1-62703-661-0_1
Deborde, C., Moing, A., Roch, L., Jacob, D., Rolin, D., and Giraudeau, P. (2017). Plant metabolism as studied by NMR spectroscopy. Prog. Nucl. Magn. Reson Spectrosc. 102–103, 61–97. doi:10.1016/j.pnmrs.2017.05.001
Delgado-Goñi, T., Campo, S., Martín-Sitjar, J., Cabañas, M. E., San Segundo, B., and Arús, C. (2013). Assessment of a 1H high-resolution magic angle spinning NMR spectroscopy procedure for free sugars quantification in intact plant tissue. Planta 238, 397–413. doi:10.1007/s00425-013-1924-y
de Oliveira, C. S., Lião, L. M., and Alcantara, G. B. (2019). Metabolic response of soybean plants to Sclerotinia sclerotiorum infection. Phytochemistry 167, 112099. doi:10.1016/j.phytochem.2019.112099
Dey, A., Charrier, B., Martineau, E., Deborde, C., Gandriau, E., Moing, A., et al. (2020). Hyperpolarized NMR metabolomics at natural 13C abundance. Anal. Chem. 92, 14867–14871. doi:10.1021/acs.analchem.0c03510
Dey, A., Charrier, B., Ribay, V., Dumez, J.-N., and Giraudeau, P. (2023). Hyperpolarized 1H and 13C NMR spectroscopy in a single experiment for metabolomics. Anal. Chem. 95, 16861–16867. doi:10.1021/acs.analchem.3c02614
Duquesnoy, E., Castola, V., and Casanova, J. (2008). Identification and quantitative determination of carbohydrates in ethanolic extracts of two conifers using 13C NMR spectroscopy. Carbohydr. Res. 343, 893–902. doi:10.1016/j.carres.2008.01.001
Ebrahimi, P., Viereck, N., Bro, R., and Engelsen, S. B. (2018). Chemometric analysis of NMR spectra. Mod. Magn. Reson., 1649–1668. doi:10.1007/978-3-319-28388-3_20
Edison, A. S., Le Guennec, A., Delaglio, F., and Kupče, Ē. (2019). in Practical guidelines for 13C-based NMR metabolomics BT - NMR-based metabolomics: methods and protocols. Editors G. A. N. Gowda, and D. Raftery (New York, NY: Springer), 69–95. doi:10.1007/978-1-4939-9690-2_5
Eisenreich, W., and Bacher, A. (2007). Advances of high-resolution NMR techniques in the structural and metabolic analysis of plant biochemistry. Phytochemistry 68, 2799–2815. doi:10.1016/j.phytochem.2007.09.028
Farhadi, F., Asili, J., Iranshahy, M., and Iranshahi, M. (2019). NMR-based metabolomic study of asafoetida. Fitoterapia 139, 104361. doi:10.1016/j.fitote.2019.104361
Farroq, H., Soong, R., Simpson, A. J., Courtier-Murias, D., and Kingery, W. (2013). HR-MAS NMR spectroscopy: a practical guide for natural samples. Curr. Org. Chem. 17, 3013–3031. doi:10.2174/13852728113179990126
Feng, Y., Li, Q., Qiu, D., and Li, G. (2021). Graphene assisted in the analysis of coumarins in angelicae pubescentis radix by dispersive liquid–liquid microextraction combined with 1H-qNMR. Molecules 26, 2416. doi:10.3390/molecules26092416
Feng, Y., Li, Q., Yang, L., Zhang, Y., and Qiu, D. (2020). The use of 1H-qNMR method for simultaneous determination of osthol, columbianadin, and isoimperatorin in angelicae pubescentis radix. J. AOAC Int. 103, 851–856. doi:10.1093/jaoacint/qsz031
Fiehn, O. (2002). Metabolomics-the link between genotypes and phenotypes. Plant Mol. Biol. 48, 155–171. doi:10.1023/a:1013713905833
Fischedick, J. T., Johnson, S. R., Ketchum, R. E. B., Croteau, R. B., and Lange, B. M. (2015). NMR spectroscopic search module for Spektraris, an online resource for plant natural product identification – taxane diterpenoids from Taxus×media cell suspension cultures as a case study. Phytochemistry 113, 87–95. doi:10.1016/J.PHYTOCHEM.2014.11.020
Flores, I. S., Martinelli, B. C. B., and Lião, L. M. (2020). High-resolution magic angle spinning nuclear magnetic resonance (HR-MAS NMR) as a tool in the determination of biomarkers of Passiflora-based herbal medicines. Fitoterapia 142, 104500. doi:10.1016/j.fitote.2020.104500
Gengmao, Z., Yu, H., Xing, S., Shihui, L., Quanmei, S., and Changhai, W. (2015). Salinity stress increases secondary metabolites and enzyme activity in safflower. Ind. Crops Prod. 64, 175–181. doi:10.1016/J.INDCROP.2014.10.058
Ghassemi-Golezani, K., Hassanzadeh, N., Shakiba, M. R., and Esmaeilpour, B. (2020). Exogenous salicylic acid and 24-epi-brassinolide improve antioxidant capacity and secondary metabolites of Brassica nigra. Biocatal. Agric. Biotechnol. 26, 101636. doi:10.1016/J.BCAB.2020.101636
Ghosh, M. N., and Divakar, S. (1963). Power of Tukey’s test for non-additivity. J. R. Stat. Soc. Series B Stat. Methodol. 25 (1), 213–219. doi:10.1111/j.2517-6161.1963.tb00503.x
Girbu, V., Organ, A., Grinco, M., Cotelea, T., Ungur, N., Barba, A., et al. (2023). Identification, quantitative determination and isolation of pomolic acid from lavender (Lavandula angustifolia Mill.) wastes. Sustain Chem. Pharm. 33, 101140. doi:10.1016/j.scp.2023.101140
Glaubitz, U., Li, X., Schaedel, S., Erban, A., Sulpice, R., Kopka, J., et al. (2017). Integrated analysis of rice transcriptomic and metabolomic responses to elevated night temperatures identifies sensitivity- and tolerance-related profiles. Plant Cell. Environ. 40, 121–137. doi:10.1111/pce.12850
Goodacre, R., Broadhurst, D., Smilde, A. K., Kristal, B. S., Baker, J. D., Beger, R., et al. (2007). Proposed minimum reporting standards for data analysis in metabolomics. Metabolomics 3, 231–241. doi:10.1007/s11306-007-0081-3
Granato, D., Santos, J. S., Escher, G. B., Ferreira, B. L., and Maggio, R. M. (2018). Use of principal component analysis (PCA) and hierarchical cluster analysis (HCA) for multivariate association between bioactive compounds and functional properties in foods: a critical perspective. Trends Food Sci. Technol. 72, 83–90. doi:10.1016/j.tifs.2017.12.006
Griffiths, L. (1998). Assay by nuclear magnetic resonance spectroscopy: quantification limits. Analyst 123, 1061–1068. doi:10.1039/A800625C
Gromski, P. S., Xu, Y., Correa, E., Ellis, D. I., Turner, M. L., and Goodacre, R. (2014). A comparative investigation of modern feature selection and classification approaches for the analysis of mass spectrometry data. Anal. Chim. Acta 829, 1–8. doi:10.1016/j.aca.2014.03.039
Halabalaki, M., Bertrand, S., Stefanou, A., Gindro, K., Kostidis, S., Mikros, E., et al. (2014). Sample preparation issues in NMR-based plant metabolomics: optimisation for vitis wood samples. Phytochem. Anal. 25, 350–356. doi:10.1002/PCA.2497
Hall, R. D., D’Auria, J. C., Silva Ferreira, A. C., Gibon, Y., Kruszka, D., Mishra, P., et al. (2022). High-throughput plant phenotyping: a role for metabolomics? Trends Plant Sci. 27, 549–563. doi:10.1016/J.TPLANTS.2022.02.001
Harvey, A. L. (2008). Natural products in drug discovery. Drug Discov. Today 13, 894–901. doi:10.1016/j.drudis.2008.07.004
Hendriks, M. M. W. B., Eeuwijk, F. A. van, Jellema, R. H., Westerhuis, J. A., Reijmers, T. H., Hoefsloot, H. C. J., et al. (2011). Data-processing strategies for metabolomics studies. TrAC - Trends Anal. Chem. 30, 1685–1698. doi:10.1016/j.trac.2011.04.019
Hernández-Bolio, G. I., Kutzner, E., Eisenreich, W., de Jesús Torres-Acosta, J. F., and Peña-Rodríguez, L. M. (2018). The use of 1H–NMR metabolomics to optimise the extraction and preliminary identification of anthelmintic products from the leaves of Lysiloma latisiliquum. Phytochem. Anal. 29, 413–420. doi:10.1002/pca.2724
Hernández-Guerrero, C. J., Villa-Ruano, N., Zepeda-Vallejo, L. G., Hernández-Fuentes, A. D., Ramirez-Estrada, K., Zamudio-Lucero, S., et al. (2021). Bean cultivars (Phaseolus vulgaris L.) under the spotlight of NMR metabolomics. Food Res. Int. 150, 110805. doi:10.1016/J.FOODRES.2021.110805
Hoch, J. C., Baskaran, K., Burr, H., Chin, J., Eghbalnia, H. R., Fujiwara, T., et al. (2023). Biological magnetic resonance data bank. Nucleic Acids Res. 51, D368–D376. doi:10.1093/NAR/GKAC1050
Holmes, E., Tsang, T. M., and Tabrizi, S. J. (2006). The application of NMR-based metabonomics in neurological disorders. NeuroRX 3, 358–372. doi:10.1016/j.nurx.2006.05.004
Hong, X., Mat Isa, N., Fakurazi, S., and Safinar Ismail, I. (2020). Phytochemical and anti-inflammatory properties of Scurrula ferruginea (Jack) Danser parasitising on three different host plants elucidated by NMR-based metabolomics. Phytochem. Anal. 31, 15–27. doi:10.1002/pca.2861
Hsieh, L.-Y., Chan, H.-H., Kuo, P.-C., Hung, H.-Y., Li, Y.-C., Kuo, C.-L., et al. (2018). A feasible and practical 1H NMR analytical method for the quality control and quantification of bioactive principles in Lycii Fructus. J. Food Drug Anal. 26, 1105–1112. doi:10.1016/j.jfda.2018.01.001
Huang, Z., Bi, T., Jiang, H., and Liu, H. (2024). Review on NMR as a tool to analyse natural products extract directly: molecular structure elucidation and biological activity analysis. Phytochem. Anal. 35, 5–16. doi:10.1002/pca.3292
Hussain, M., Farooq, S., Hasan, W., Ul-Allah, S., Tanveer, M., Farooq, M., et al. (2018). Drought stress in sunflower: physiological effects and its management through breeding and agronomic alternatives. Agric. Water Manag. 201, 152–166. doi:10.1016/J.AGWAT.2018.01.028
Hwang, F., and Hoult, D. I. (1998). Automatic probe tuning and matching. Magn. Reson Med. 39, 214–222. doi:10.1002/mrm.1910390208
Idle, J. R., and Gonzalez, F. J. (2007). Metabolomics. Cell. Metab. 6, 348–351. doi:10.1016/j.cmet.2007.10.005
Ismail, F. M. D., Nahar, L., and Sarker, S. D. (2021). Application of INADEQUATE NMR techniques for directly tracing out the carbon skeleton of a natural product. Phytochem. Anal. 32, 7–23. doi:10.1002/pca.2976
Jacob, D., Deborde, C., and Moing, A. (2018). BioStatFlow, a statistical analysis workflow for “omics” data. INRAE. doi:10.15454/1.5572412770331912E12
Jayaprakasha, G. K., Nagana Gowda, G. A., Marquez, S., and Patil, B. S. (2013). Rapid separation and quantitation of curcuminoids combining pseudo two-dimensional liquid flash chromatography and NMR spectroscopy. J. Chromatogr. B 937, 25–32. doi:10.1016/j.jchromb.2013.08.011
Jenne, A., Bermel, W., Michal, C. A., Gruschke, O., Soong, R., Ghosh Biswas, R., et al. (2022). DREAMTIME NMR spectroscopy: targeted multi-compound selection with improved detection limits. Angew. Chem. Int. Ed. 61, e202110044. doi:10.1002/ANIE.202110044
Joshi, R. U., Singh, A. K., Singh, V. P., Rai, R., and Joshi, P. (2023). A review on adaptation of banana (Musa spp.) to cold in subtropics. Plant Breed. 142, 269–283. doi:10.1111/PBR.13088
Jovanović, A. A., Lević, S. M., Pavlović, V. B., Marković, S. B., Pjanović, R. V., Đorđević, V. B., et al. (2021). Freeze vs. Spray drying for dry wild thyme (thymus serpyllum L.) extract formulations: the impact of gelatin as a coating material. Molecules 26, 3933–3949. doi:10.3390/MOLECULES26133933
Judge, M. T., and Ebbels, T. M. D. (1962). Problems, principles and progress in computational annotation of NMR metabolomics data. Metabolomics 1, 102. doi:10.1007/s11306-022-01962-z
Kaur, S., Samota, M. K., Choudhary, M., Choudhary, M., Pandey, A. K., Sharma, A., et al. (2022). How do plants defend themselves against pathogens-Biochemical mechanisms and genetic interventions. Physiology Mol. Biol. Plants 28, 485–504. doi:10.1007/s12298-022-01146-y
Kazalaki, A., Misiak, M., Spyros, A., and Dais, P. (2015). Identification and quantitative determination of carbohydrate molecules in Greek honey by employing 13C NMR spectroscopy. Anal. Methods 7, 5962–5972. doi:10.1039/C5AY01243K
Keifer, P. A., Baltusis, L., Rice, D. M., Tymiak, A. A., and Shoolery, J. N. (1996). A comparison of NMR spectra obtained for solid-phase-synthesis resins using conventional high-resolution, magic-angle-spinning, and high-resolution magic-angle-spinning probes. J. Magn. Reson A 119, 65–75. doi:10.1006/jmra.1996.0052
Khatib, M., Pieraccini, G., Innocenti, M., Melani, F., and Mulinacci, N. (2016). An insight on the alkaloid content of Capparis spinosa L. root by HPLC-DAD-MS, MS/MS and 1H qNMR. J. Pharm. Biomed. Anal. 123, 53–62. doi:10.1016/j.jpba.2016.01.063
Kikuchi, J., Shinozaki, K., and Hirayama, T. (2004). Stable isotope labeling of Arabidopsis thaliana for an NMR-based metabolomics approach. Plant Cell. Physiol. 45, 1099–1104. doi:10.1093/PCP/PCH117
Kim, H. K., Choi, Y. H., and Verpoorte, R. (2010). NMR-based metabolomic analysis of plants. Nat. Protoc. 5, 536–549. doi:10.1038/nprot.2009.237
Kim, H. K., Choi, Y. H., and Verpoorte, R. (2011). NMR-based plant metabolomics: where do we stand, where do we go? Trends Biotechnol. 29, 267–275. doi:10.1016/j.tibtech.2011.02.001
Kong, X., Zhou, L., Li, Z., Yang, Z., Qiu, B., Wu, X., et al. (2020). Artificial intelligence enhanced two-dimensional nanoscale nuclear magnetic resonance spectroscopy. npj Quantum Inf. 6, 79. doi:10.1038/s41534-020-00311-z
Kortesniemi, M., Vuorinen, A. L., Sinkkonen, J., Yang, B., Rajala, A., and Kallio, H. (2015). NMR metabolomics of ripened and developing oilseed rape (Brassica napus) and turnip rape (Brassica rapa). Food Chem. 172, 63–70. doi:10.1016/j.foodchem.2014.09.040
Kovacs, H., Moskau, D., and Spraul, M. (2005). Cryogenically cooled probes—a leap in NMR technology. Prog. Nucl. Magn. Reson Spectrosc. 46, 131–155. doi:10.1016/j.pnmrs.2005.03.001
Kovtunov, K. V., Pokochueva, E. V., Salnikov, O. G., Cousin, S. F., Kurzbach, D., Vuichoud, B., et al. (2018). Hyperpolarized NMR spectroscopy: d-DNP, PHIP, and SABRE techniques. Chem. Asian J. 13, 1857–1871. doi:10.1002/asia.201800551
Krakowska-Sieprawska, A., Kiełbasa, A., Rafińska, K., Ligor, M., and Buszewski, B. (2022). Modern methods of pre-treatment of plant material for the extraction of bioactive compounds. Molecules 27, 730–750. doi:10.3390/MOLECULES27030730
Kuhlisch, C., and Pohnert, G. (2015). Metabolomics in chemical ecology. Nat. Prod. Rep. 32, 937–955. doi:10.1039/C5NP00003C
Lavine, B. K., and Rayens, W. S. (2009). “Classification: basic concepts,” in Comprehensive chemometrics: chemical and biochemical data analysis (Elsevier), 507–515.
Lawal, U., Maulidiani, M., Shaari, K., Ismail, I. S., Khatib, A., and Abas, F. (2017). Discrimination of Ipomoea aquatica cultivars and bioactivity correlations using NMR-based metabolomics approach. Plant Biosyst. 151, 833–843. doi:10.1080/11263504.2016.1211198
Lenz, E. M., and Wilson, I. D. (2007). Analytical strategies in metabonomics. J. Proteome Res. 6, 443–458. doi:10.1021/pr0605217
Li, W., Zhao, F., Pan, J., and Qu, H. (2020a). Influence of ethanol concentration of extraction solvent on metabolite profiling for Salviae Miltiorrhizae Radix et Rhizoma extract by 1H NMR spectroscopy and multivariate data analysis. Process Biochem. 97, 158–167. doi:10.1016/j.procbio.2020.06.008
Li, X., Wang, X., Hong, D., Zeng, S., Su, J., Fan, G., et al. (2019). Metabolic discrimination of different rhodiola species using 1H-NMR and GEP combinational chemometrics. Chem. Pharm. Bull. (Tokyo) 67, 81–87. doi:10.1248/cpb.c18-00509
Li, Y., Kong, D., Fu, Y., Sussman, M. R., and Wu, H. (2020b). The effect of developmental and environmental factors on secondary metabolites in medicinal plants. Plant Physiology Biochem. 148, 80–89. doi:10.1016/j.plaphy.2020.01.006
Liland, K. H. (2011). Multivariate methods in metabolomics - from pre-processing to dimension reduction and statistical analysis. TrAC - Trends Anal. Chem. 30, 827–841. doi:10.1016/j.trac.2011.02.007
Lindon, J. C., Beckonert, O. P., Holmes, E., and Nicholson, J. K. (2009). High-resolution magic angle spinning NMR spectroscopy: application to biomedical studies. Prog. Nucl. Magn. Reson Spectrosc. 55, 79–100. doi:10.1016/j.pnmrs.2008.11.004
Liu, N. Q., Choi, Y. H., Verpoorte, R., and van der Kooy, F. (2010). Comparative quantitative analysis of artemisinin by chromatography and qNMR. Phytochem. Anal. 21, 451–456. doi:10.1002/pca.1217
López-Pérez, J. L., Therón, R., del Olmo, E., and Díaz, D. (2007). NAPROC-13: a database for the dereplication of natural product mixtures in bioassay-guided protocols. Bioinformatics 23, 3256–3257. doi:10.1093/BIOINFORMATICS/BTM516
Lund, J. A., Brown, P. N., and Shipley, P. R. (2017). Differentiation of Crataegus spp. guided by nuclear magnetic resonance spectrometry with chemometric analyses. Phytochemistry 141, 11–19. doi:10.1016/j.phytochem.2017.05.003
Lund, J. A., Brown, P. N., and Shipley, P. R. (2020). Quantification of North American and European Crataegus flavonoids by nuclear magnetic resonance spectrometry. Fitoterapia 143, 104537. doi:10.1016/j.fitote.2020.104537
Madsen, R., Lundstedt, T., and Trygg, J. (2010). Chemometrics in metabolomics-A review in human disease diagnosis. Anal. Chim. Acta 659, 23–33. doi:10.1016/j.aca.2009.11.042
Mallamace, D., Corsaro, C., Salvo, A., Cicero, N., Macaluso, A., Giangrosso, G., et al. (2014). A multivariate statistical analysis coming from the NMR metabolic profile of cherry tomatoes (The Sicilian Pachino case). Phys. A Stat. Mech. its Appl. 401, 112–117. doi:10.1016/j.physa.2013.12.054
Maltese, F., van der Kooy, F., and Verpoorte, R. (2009). Solvent derived artifacts in natural products chemistry. Nat. Prod. Commun. 4, 1934578X0900400–454. doi:10.1177/1934578x0900400326
Malz, F., and Jancke, H. (2005). Validation of quantitative NMR. J. Pharm. Biomed. Anal. 38, 813–823. doi:10.1016/j.jpba.2005.01.043
Marchetti, L., Brighenti, V., Rossi, M. C., Sperlea, J., Pellati, F., and Bertelli, D. (2019). Use of 13C-qNMR spectroscopy for the analysis of non-psychoactive cannabinoids in fibre-type cannabis sativa L. (Hemp). Molecules 24, 1138. doi:10.3390/molecules24061138
Marion, R., Govaerts, B., and von Sachs, R. (2020). AdaCLV for interpretable variable clustering and dimensionality reduction of spectroscopic data. Chemom. Intelligent Laboratory Syst. 206, 104169. doi:10.1016/j.chemolab.2020.104169
Markley, J. L., Brüschweiler, R., Edison, A. S., Eghbalnia, H. R., Powers, R., Raftery, D., et al. (2017). The future of NMR-based metabolomics. Curr. Opin. Biotechnol. 43, 34–40. doi:10.1016/J.COPBIO.2016.08.001
Mazzei, P., Cozzolino, V., and Piccolo, A. (2018). High-resolution magic-angle-spinning NMR and magnetic resonance imaging spectroscopies distinguish metabolome and structural properties of maize seeds from plants treated with different fertilizers and arbuscular mycorrhizal fungi. J. Agric. Food Chem. 66, 2580–2588. doi:10.1021/acs.jafc.7b04340
McAlpine, J. B., Chen, S.-N., Kutateladze, A., MacMillan, J. B., Appendino, G., Barison, A., et al. (2019). The value of universally available raw NMR data for transparency, reproducibility, and integrity in natural product research. Nat. Prod. Rep. 36, 35–107. doi:10.1039/C7NP00064B
Mcdonald, J. H. (2009). Handbook of biological statistics second edition. Available at: http://udel.edu/∼mcdonald/statpermissions.html.
McGrath, T. F., Haughey, S. A., Patterson, J., Fauhl-Hassek, C., Donarski, J., Alewijn, M., et al. (2018). What are the scientific challenges in moving from targeted to non-targeted methods for food fraud testing and how can they be addressed? – Spectroscopy case study. Trends Food Sci. Technol. 76, 38–55. doi:10.1016/j.tifs.2018.04.001
McIntosh, P. (2013). in Cpmg bt - encyclopedia of biophysics. Editor G. C. K. Roberts (Berlin, Heidelberg: Springer Berlin Heidelberg), 386. doi:10.1007/978-3-642-16712-6_320
Mckay, R. T. (2011). How the 1D-NOESY suppresses solvent signal in metabonomics NMR spectroscopy: an examination of the pulse sequence components and evolution. Concepts Magnetic Reson. Part A 38A, 197–220. doi:10.1002/cmr.a.20223
Miros, F. N., Murch, S. J., and Shipley, P. R. (2020). Exploring feature selection of St John’s wort grown under different light spectra using 1H-NMR spectroscopy. Phytochem. Anal. 31, 670–680. doi:10.1002/pca.2932
Moco, S. (2022). Studying metabolism by NMR-based metabolomics. Front. Mol. Biosci. 9, 882487. doi:10.3389/fmolb.2022.882487
Motiram-Corral, K., Nolis, P., Saurí, J., and Parella, T. (2020). LR-HSQMBC versus LR-selHSQMBC: enhancing the observation of tiny long-range heteronuclear NMR correlations. J. Nat. Prod. 83, 1275–1282. doi:10.1021/acs.jnatprod.0c00058
Nagana Gowda, G. A., and Raftery, D. (2015). Can NMR solve some significant challenges in metabolomics? J. Magnetic Reson. 260, 144–160. doi:10.1016/J.JMR.2015.07.014
Newgard, C. B. (2017). Metabolomics and metabolic diseases: where do we stand? Cell. Metab. 25, 43–56. doi:10.1016/j.cmet.2016.09.018
Newman, D. J., and Cragg, G. M. (2020). Natural products as sources of new drugs over the nearly four decades from 01/1981 to 09/2019. J. Nat. Prod. 83, 770–803. doi:10.1021/acs.jnatprod.9b01285
Nicholson, J. K., Lindon, J. C., and Holmes, E. (1999). “Metabonomics”: understanding the metabolic responses of living systems to pathophysiological stimuli via multivariate statistical analysis of biological NMR spectroscopic data. Xenobiotica 29, 1181–1189. doi:10.1080/004982599238047
Nishizaki, Y., Lankin, D. C., Chen, S.-N., and Pauli, G. F. (2021). Accurate and precise external calibration enhances the versatility of quantitative NMR (qNMR). Anal. Chem. 93, 2733–2741. doi:10.1021/acs.analchem.0c02967
Ocampos, F. M. M., de Souza, A. J. B., Antar, G. M., Wouters, F. C., and Colnago, L. A. (2021). Phytotoxicity of schiekia timida seed extracts, a mixture of phenylphenalenones. Molecules 26, 4197. doi:10.3390/molecules26144197
Ocampos, F. M. M., Paetz, C., Antar, G. M., Menezes, R. C., Miguel, O. G., and Schneider, B. (2017). Phytochemical profile of schiekia orinocensis (haemodoraceae). Phytochem. Lett. 21, 139–145. doi:10.1016/j.phytol.2017.06.008
Oliveira, E. S. C., Pontes, F. L. D., Acho, L. D. R., do Rosário, A. S., da Silva, B. J. P., de, A., et al. (2021). qNMR quantification of phenolic compounds in dry extract of Myrcia multiflora leaves and its antioxidant, anti-AGE, and enzymatic inhibition activities. J. Pharm. Biomed. Anal. 201, 114109. doi:10.1016/j.jpba.2021.114109
Oliveri, P., Malegori, C., and Casale, M. (2020). “Chemometrics: multivariate analysis of chemical data,” in Chemical analysis of food: techniques and applications. Second Edition (Elsevier), 33–76. doi:10.1016/B978-0-12-813266-1.00002-4
Oliveri, P., Malegori, C., Simonetti, R., and Casale, M. (2019). The impact of signal pre-processing on the final interpretation of analytical outcomes – a tutorial. Anal. Chim. Acta 1058, 9–17. doi:10.1016/J.ACA.2018.10.055
Pagter, M., Yde, C. C., and Kjær, K. H. (2017). Metabolic fingerprinting of dormant and active flower primordia of ribes nigrum using high-resolution magic angle spinning NMR. J. Agric. Food Chem. 65, 10123–10130. doi:10.1021/acs.jafc.7b03788
Pan, Q., Dai, Y., Nuringtyas, T. R., Mustafa, N. R., Schulte, A. E., Verpoorte, R., et al. (2014). Investigation of the chemomarkers correlated with flower colour in different organs of catharanthus roseus using nmr-based metabolomics. Phytochem. Anal. 25, 66–74. doi:10.1002/pca.2464
Patel, M. K., Pandey, S., Kumar, M., Haque, M. I., Pal, S., and Yadav, N. S. (2021). Plants metabolome study: emerging tools and techniques. Plants 10, 2409–2410. doi:10.3390/PLANTS10112409
Pauli, G. F. (2001). qNMR — a versatile concept for the validation of natural product reference compounds. Phytochem. Anal. 12, 28–42. doi:10.1002/1099-1565(200101/02)12:1<28::AID-PCA549>3.0.CO;2-D
Pauli, G. F., Jaki, B. U., and Lankin, D. C. (2005). Quantitative 1H NMR: development and potential of a method for natural products analysis. J. Nat. Prod. 68, 133–149. doi:10.1021/np0497301
Per, T. S., Khan, N. A., Reddy, P. S., Masood, A., Hasanuzzaman, M., Khan, M. I. R., et al. (2017). Approaches in modulating proline metabolism in plants for salt and drought stress tolerance: phytohormones, mineral nutrients and transgenics. Plant Physiology Biochem. 115, 126–140. doi:10.1016/j.plaphy.2017.03.018
Powers, R., Andersson, E. R., Bayless, A. L., Brua, R. B., Chang, M. C., Cheng, L. L., et al. (2024). Best practices in NMR metabolomics: current state. TrAC Trends Anal. Chem. 171, 117478. doi:10.1016/J.TRAC.2023.117478
Pye, C. R., Bertin, M. J., Lokey, R. S., Gerwick, W. H., and Linington, R. G. (2017). Retrospective analysis of natural products provides insights for future discovery trends. Proc. Natl. Acad. Sci. 114, 5601–5606. doi:10.1073/pnas.1614680114
Raguso, R. A., Agrawal, A. A., Douglas, A. E., Jander, G., Kessler, A., Poveda, K., et al. (2015). The raison d’être of chemical ecology. Ecology 96, 617–630. doi:10.1890/14-1474.1
Ramírez-Meraz, M., Méndez-Aguilar, R., Hidalgo-Martínez, D., Villa-Ruano, N., Zepeda-Vallejo, L. G., Vallejo-Contreras, F., et al. (2020). Experimental races of Capsicum annuum cv. jalapeño: chemical characterization and classification by 1H NMR/machine learning. Food Res. Int. 138, 109763. doi:10.1016/j.foodres.2020.109763
Rangani, J., Panda, A., and Parida, A. K. (2020). Metabolomic study reveals key metabolic adjustments in the xerohalophyte Salvadora persica L. during adaptation to water deficit and subsequent recovery conditions. Plant Physiology Biochem. 150, 180–195. doi:10.1016/J.PLAPHY.2020.02.036
Rasheed, D. M., Porzel, A., Frolov, A., El Seedi, H. R., Wessjohann, L. A., and Farag, M. A. (2018). Comparative analysis of Hibiscus sabdariffa (roselle) hot and cold extracts in respect to their potential for α-glucosidase inhibition. Food Chem. 250, 236–244. doi:10.1016/j.foodchem.2018.01.020
Rodrigues, R. P., Baroni, A. C. M., Carollo, C. A., Demarque, D. P., Pardo, L. F. L., de Rezende, L. M. P., et al. (2020). Synthesis, phytotoxic evaluation and in silico studies for the development of novel natural products-inspired herbicides. Biocatal. Agric. Biotechnol. 24, 101559. doi:10.1016/j.bcab.2020.101559
Rundlöf, T., Mathiasson, M., Bekiroglu, S., Hakkarainen, B., Bowden, T., and Arvidsson, T. (2010). Survey and qualification of internal standards for quantification by 1H NMR spectroscopy. J. Pharm. Biomed. Anal. 52, 645–651. doi:10.1016/j.jpba.2010.02.007
Saccenti, E., Hoefsloot, H. C. J., Smilde, A. K., Westerhuis, J. A., and Hendriks, M. M. W. B. (2013). Reflections on univariate and multivariate analysis of metabolomics data. Metabolomics 10, 361–374. doi:10.1007/s11306-013-0598-6
Salem, M. A., Souza, L. P.De, Serag, A., Fernie, A. R., Farag, M. A., Ezzat, S. M., et al. (2020). Metabolomics in the context of plant natural products research: from sample preparation to metabolite analysis. Metabolites 10, 37–10. doi:10.3390/METABO10010037
Salem, M. A., Wang, J. Y., and Al-Babili, S. (2022). Metabolomics of plant root exudates: from sample preparation to data analysis. Front. Plant Sci. 13, 1062982. doi:10.3389/fpls.2022.1062982
Salvo, A., Rotondo, A., Mangano, V., Grimaldi, M., Stillitano, I., D’Ursi, A. M., et al. (2020). High-resolution magic angle spinning nuclear magnetic resonance (HR-MAS-NMR) as quick and direct insight of almonds. Nat. Prod. Res. 34, 71–77. doi:10.1080/14786419.2019.1576043
Sánchez Pérez, E. M., García López, J., Iglesias, M. J., López Ortiz, F., Toresano, F., and Camacho, F. (2011). HRMAS-nuclear magnetic resonance spectroscopy characterization of tomato “flavor varieties” from Almería (Spain). Food Res. Int. 44, 3212–3221. doi:10.1016/j.foodres.2011.08.012
Santos, A. D. da C., Fonseca, F. A., Dutra, L. M., Santos, M. de F. C., Menezes, L. R. A., Campos, F. R., et al. (2018). 1H HR-MAS NMR-based metabolomics study of different persimmon cultivars (Diospyros kaki) during fruit development. Food Chem. 239, 511–519. doi:10.1016/j.foodchem.2017.06.133
Santos, M. D. S., and Colnago, L. A. (2013). Validação de método quantitativo por RMN de 1H para análises de formulações farmacêuticas. Quim Nova 36, 324–330. doi:10.1590/S0100-40422013000200020
Santos, O. N. A., Folegatti, M. V., Dutra, L. M., Andrade, I. P. de S., Fanaya, E. D., Lena, B. P., et al. (2017). Tracking lipid profiles of Jatropha curcas L. seeds under different pruning types and water managements by low-field and HR-MAS NMR spectroscopy. Ind. Crops Prod. 109, 918–922. doi:10.1016/j.indcrop.2017.09.066
Saurí, J., Ndukwe, I. E., Reibarkh, M., Liu, Y., Williamson, R. T., and Martin, G. E. (2019). in Chapter one - new variants of the ADEQUATE experiments (Academic Press), 1–56. doi:10.1016/bs.arnmr.2019.04.001
Schneider, B. (2013). “Chemical ecology,” in eMagRes (John Wiley and Sons, Ltd), 451–466. doi:10.1002/9780470034590.emrstm1341
Schneider, B. (2017). Phenylphenalenone glycosides: occurrence, structure revision, and substituent effects on the steric orientation. Phytochem. Lett. 21, 104–108. doi:10.1016/j.phytol.2017.06.004
Schroeder, F. C., Gibson, D. M., Churchill, A. C. L., Sojikul, P., Wursthorn, E. J., Krasnoff, S. B., et al. (2007). Differential analysis of 2D NMR spectra: new natural products from a pilot-scale fungal extract library. Angew. Chem. Int. Ed. 46, 901–904. doi:10.1002/anie.200603821
Schulz, S., Kubanek, J., and Piel, J. (2015). Editorial: chemical ecology. Nat. Prod. Rep. 32, 886–887. doi:10.1039/C5NP90027A
Seasholtz, M. B., and Kowalski, B. (1993). The parsimony principle applied to multivariate calibration. Elsevier Science Publishers B.V.
Sekiyama, Y., Chikayama, E., and Kikuchi, J. (2010). Profiling polar and semipolar plant metabolites throughout extraction processes using a combined solution-state and high-resolution magic angle spinning NMR approach. Anal. Chem. 82, 1643–1652. doi:10.1021/ac9019076
Sévin, D. C., Kuehne, A., Zamboni, N., and Sauer, U. (2015). Biological insights through nontargeted metabolomics. Curr. Opin. Biotechnol. 34, 1–8. doi:10.1016/j.copbio.2014.10.001
Silva Barbosa Correia, B., Ferraz de Arruda, H., Spricigo, P. C., Ceribeli, C., Souza Almeida, L., Rodrigues Cardoso, D., et al. (2024). Emerging studies of NMR-based metabolomics of fruits regarding botanic family species associated with postharvest quality. J. Food Compos. Analysis 130, 106136. doi:10.1016/J.JFCA.2024.106136
Simmler, C., Napolitano, J. G., McAlpine, J. B., Chen, S. N., and Pauli, G. F. (2014). Universal quantitative NMR analysis of complex natural samples. Curr. Opin. Biotechnol. 25, 51–59. doi:10.1016/j.copbio.2013.08.004
Song, E.-H., Kim, H.-J., Jeong, J., Chung, H.-J., Kim, H.-Y., Bang, E., et al. (2016). A 1H HR-MAS NMR-based metabolomic study for metabolic characterization of rice grain from various oryza sativa L. Cultivars. J. Agric. Food Chem. 64, 3009–3016. doi:10.1021/acs.jafc.5b05667
Sparks, T. C., Hahn, D. R., and Garizi, N. V. (2017). Natural products, their derivatives, mimics and synthetic equivalents: role in agrochemical discovery. Pest Manag. Sci. 73, 700–715. doi:10.1002/ps.4458
Stark, P., Zab, C., Porzel, A., Franke, K., Rizzo, P., and Wessjohann, L. A. (2020). PSYCHE—a valuable experiment in plant NMR-metabolomics. Molecules 25, 5125. doi:10.3390/molecules25215125
Stone, M. J., and Williams, D. H. (1992). On the evolution of functional secondary metabolites (natural products). Mol. Microbiol. 6, 29–34. doi:10.1111/j.1365-2958.1992.tb00834.x
Taglienti, A., Tiberini, A., Ciampa, A., Piscopo, A., Zappia, A., Tomassoli, L., et al. (2020). Metabolites response to onion yellow dwarf virus (OYDV) infection in ‘Rossa di Tropea’ onion during storage: a 1H HR-MAS NMR study. J. Sci. Food Agric. 100, 3418–3427. doi:10.1002/jsfa.10376
Taiz, L., Zeiger, E., Moller, I. max, and Murphy, A. (2017). Fisiologia e desenvolvimento vegetal Diversidade vegetal.
Tian, D., Huang, L., Zhang, Z., Tian, Z., Ge, S., Wang, C., et al. (2023). A novel approach for quantitative determination of cellulose content in tobacco via 2D HSQC NMR spectroscopy. Carbohydr. Res. 526, 108790. doi:10.1016/j.carres.2023.108790
Tharwat, A. (2018). Classification assessment methods. Appl. Comput. Inform. 17 (1), 168–192. doi:10.1016/j.aci.2018.08.003
Trendafilova, A., Staleva, P., Petkova, Z., Ivanova, V., Evstatieva, Y., Nikolova, D., et al. (2023). Phytochemical profile, antioxidant potential, antimicrobial activity, and cytotoxicity of dry extract from rosa damascena mill. Molecules 28, 7666. doi:10.3390/molecules28227666
Triba, M. N., Le Moyec, L., Amathieu, R., Goossens, C., Bouchemal, N., Nahon, P., et al. (2015). PLS/OPLS models in metabolomics: the impact of permutation of dataset rows on the K-fold cross-validation quality parameters. Mol. Biosyst. 11, 13–19. doi:10.1039/c4mb00414k
Truzzi, E., Marchetti, L., Benvenuti, S., Righi, V., Rossi, M. C., Gallo, V., et al. (2021). A novel qNMR application for the quantification of vegetable oils used as adulterants in essential oils. Molecules 26, 5439. doi:10.3390/molecules26185439
Truzzi, E., Piazza, D. V., Rossi, M. C., Benvenuti, S., and Bertelli, D. (2024). NMR-based analytical methods for quantifying boswellic acids in extracts employed for producing food supplements: comparison of 13C-qNMR and 1H-NMR/PLS-R methods. J. Food Meas. Charact. 18, 1900–1912. doi:10.1007/s11694-023-02310-y
Trygg, J., Holmes, E., and Lundstedt, T. (2007). Chemometrics in metabonomics. J. Proteome Res. 6, 469–479. doi:10.1021/pr060594q
Valentino, G., Graziani, V., D’Abrosca, B., Pacifico, S., Fiorentino, A., and Scognamiglio, M. (2020). NMR-based plant metabolomics in nutraceutical research: an overview. Molecules 25, 1444–1466. doi:10.3390/MOLECULES25061444
Vermathen, M., Marzorati, M., Baumgartner, D., Good, C., and Vermathen, P. (2011). Investigation of different apple cultivars by high resolution magic angle spinning NMR. A feasibility study. J. Agric. Food Chem. 59, 12784–12793. doi:10.1021/jf203733u
Vermathen, M., Marzorati, M., Diserens, G., Baumgartner, D., Good, C., Gasser, F., et al. (2017). Metabolic profiling of apples from different production systems before and after controlled atmosphere (CA) storage studied by 1H high resolution-magic angle spinning (HR-MAS) NMR. Food Chem. 233, 391–400. doi:10.1016/j.foodchem.2017.04.089
Wang, Y., Wei, W., Du, W., Cai, J., Liao, Y., Lu, H., et al. (2023). Deep-learning-based mixture identification for nuclear magnetic resonance spectroscopy applied to plant flavors. Molecules 28, 7380. doi:10.3390/molecules28217380
Wang, Z. F., You, Y. L., Li, F. F., Kong, W. R., and Wang, S. Q. (2021). Research progress of NMR in natural product quantification. Molecules 26, 6308–6326. doi:10.3390/MOLECULES26206308
Wishart, D. S. (2019). NMR metabolomics: a look ahead. J. Magnetic Reson. 306, 155–161. doi:10.1016/J.JMR.2019.07.013
Wishart, D. S., Sayeeda, Z., Budinski, Z., Guo, A. C., Lee, B. L., Berjanskii, M., et al. (2022). NP-MRD: the natural products magnetic resonance database. Nucleic Acids Res. 50, D665–D677. doi:10.1093/NAR/GKAB1052
Wolfender, J.-L., Glauser, G., Boccard, J., and Rudaz, S. (2009). MS-Based plant metabolomic approaches for biomarker discovery. Nat. Prod. Commun. 4, 1934578X0900401. doi:10.1177/1934578X0900401019
Xanthopoulos, P., Pardalos, P. M., and Trafalis, T. B. (2013). Robust data mining. doi:10.1007/978-1-4419-9878-1
Xia, J., Bjorndahl, T. C., Tang, P., and Wishart, D. S. (2008). MetaboMiner - semi-automated identification of metabolites from 2D NMR spectra of complex biofluids. BMC Bioinforma. 9, 507–516. doi:10.1186/1471-2105-9-507
Xia, J., Mandal, R., Sinelnikov, I. V., Broadhurst, D., and Wishart, D. S. (2012). MetaboAnalyst 2.0-a comprehensive server for metabolomic data analysis. Nucleic Acids Res. 40, 127–133. doi:10.1093/nar/gks374
Yadav, B., Jogawat, A., Rahman, M. S., and Narayan, O. P. (2021). Secondary metabolites in the drought stress tolerance of crop plants: a review. Gene Rep. 23, 101040. doi:10.1016/J.GENREP.2021.101040
Yan, K. J., Chu, Y., Huang, J. H., Jiang, M. M., Li, W., Wang, Y. F., et al. (2016). Qualitative and quantitative analyses of Compound Danshen extract based on 1H NMR method and its application for quality control. J. Pharm. Biomed. Anal. 131, 183–187. doi:10.1016/j.jpba.2016.08.017
Yoon, D., Choi, B.-R., Ma, S., Lee, J. W., Jo, I.-H., Lee, Y.-S., et al. (2019). Metabolomics for age discrimination of ginseng using a multiplex approach to HR-MAS NMR spectroscopy, UPLC–QTOF/MS, and GC × GC–TOF/MS. Molecules 24, 2381. doi:10.3390/molecules24132381
Zanatta, A. C., Vilegas, W., and Edrada-Ebel, R. (2021). UHPLC-(ESI)-HRMS and NMR-based metabolomics approach to access the seasonality of Byrsonima intermedia and Serjania marginata from Brazilian cerrado flora diversity. Front. Chem. 9, 710025. doi:10.3389/fchem.2021.710025
Zandalinas, S. I., Sales, C., Beltrán, J., Gómez-Cadenas, A., and Arbona, V. (2017). Activation of secondary metabolism in citrus plants is associated to sensitivity to combined drought and high temperatures. Front. Plant Sci. 7, 1954. doi:10.3389/fpls.2016.01954
Zhang, Y., Li, Q., Feng, Y., Yang, L., Qiu, D., and Guo, Y. (2020). Multi-index quantitative evaluation of angelicae sinesis radix based on 1H-qNMR. J. AOAC Int. 103, 1633–1638. doi:10.1093/jaoacint/qsaa054
Zhang, Y.-Y., Zhang, J., Zhang, W.-X., Wang, Y., Wang, Y.-H., Yang, Q.-Y., et al. (2021). Quantitative 1H nuclear magnetic resonance method for assessing the purity of dipotassium glycyrrhizinate. Molecules 26, 3549. doi:10.3390/molecules26123549
Zhao, J., Wang, M., Saroja, S. G., and Khan, I. A. (2022). NMR technique and methodology in botanical health product analysis and quality control. J. Pharm. Biomed. Anal. 207, 114376. doi:10.1016/J.JPBA.2021.114376
Zhao, L., Huang, Y., Hu, J., Zhou, H., Adeleye, A. S., and Keller, A. A. (2016). 1H NMR and GC-MS based metabolomics reveal defense and detoxification mechanism of cucumber plant under nano-Cu stress. Environ. Sci. Technol. 50, 2000–2010. doi:10.1021/acs.est.5b05011
Zhou, B., Xiao, J. F., and Ressom, H. W. (2013). Prioritization of putative metabolite identifications in LC-MS/MS experiments using a computational pipeline. Proteomics 13, 248–260. doi:10.1002/PMIC.201200306
Keywords: NMR, plants, metabolomics, workflow, pulse sequences
Citation: Ocampos FMM, de Souza AJB, Ribeiro GH, Almeida LS, Cônsolo NRB and Colnago LA (2024) NMR-based plant metabolomics protocols: a step-by-step guide. Front. Nat. Produc. 3:1414506. doi: 10.3389/fntpr.2024.1414506
Received: 09 April 2024; Accepted: 10 July 2024;
Published: 30 July 2024.
Edited by:
Alan Diego Conceição Santos, Federal University of Amazonas, BrazilReviewed by:
Gabin Bitchagno, Royal Botanic Gardens, Kew, United KingdomCopyright © 2024 Ocampos, de Souza, Ribeiro, Almeida, Cônsolo and Colnago. This is an open-access article distributed under the terms of the Creative Commons Attribution License (CC BY). The use, distribution or reproduction in other forums is permitted, provided the original author(s) and the copyright owner(s) are credited and that the original publication in this journal is cited, in accordance with accepted academic practice. No use, distribution or reproduction is permitted which does not comply with these terms.
*Correspondence: Fernanda M. M. Ocampos, Zm9jYW1wb3NAdXNwLmJy
Disclaimer: All claims expressed in this article are solely those of the authors and do not necessarily represent those of their affiliated organizations, or those of the publisher, the editors and the reviewers. Any product that may be evaluated in this article or claim that may be made by its manufacturer is not guaranteed or endorsed by the publisher.
Research integrity at Frontiers
Learn more about the work of our research integrity team to safeguard the quality of each article we publish.