 Ravinder Lamba
 Gaurav Bhanjana
 Neeraj Dilbaghi
 Vivek Gupta
 Sandeep Kumar
94% of researchers rate our articles as excellent or good
Learn more about the work of our research integrity team to safeguard the quality of each article we publish.
Find out more
ORIGINAL RESEARCH article
Front. Nanotechnol., 28 March 2025
Sec. Environmental Nanotechnology
Volume 7 - 2025 | https://doi.org/10.3389/fnano.2025.1563705
This article is part of the Research TopicNanomaterials for Affordable Biomedical Devices, Environmental and Energy ApplicationsView all 6 articles
Introduction: Lithium plays an important role in the modern technology-driven world, as it is an essential component of numerous renewable energy devices such as solar panels, wind turbines, and electric vehicles. The usage of lithium has increased in portable electronics, as a catalyst in the medical field, and various other applications that have increased its demand gradually in recent years. The harmful effects of the extraction and disposal of lithium need to be considered simultaneously along with exploring its applications in numerous frontier areas. The methods employed for lithium extraction can lead to air and water pollution, land degradation, and pose a risk of groundwater contamination. Therefore, the quantification of lithium ions through easy, quick, reliable, and affordable methods is highly desired.
Methods: Herein, a reliable and fast response electrochemical sensing strategy has been employed using Ag-doped Co3O4 nanochips (Ag@CNCs) for lithium detection in field samples. Hexahydrate cobalt nitrate [Co(NO3)2·6H2O] has been used as a precursor for the synthesis of Ag@CNCs through the co-precipitation method followed by calcination.
Results and discussion: The synthesised Ag@CNCs have a face-centred cubic structure, with an average crystallite size of 14.7 nm as evidenced through x-ray diffraction analysis. Further, Ag@CNCs exhibit two distinct band gap energies (Eg) of 1.55 eV and 2.08 eV corresponding to two absorption peaks in the UV-visible spectrum. The developed electrochemical sensor by utilising Ag@CNCs exhibited remarkable electrocatalytic performance for lithium detection, attaining a high sensitivity of 78.66 μAmM−1cm−2 and a notable limit of detection of 5 μM, enabling direct quantification without requiring pretreatment.
Lithium and its related compounds have attained centre stage in technological applications due to their diverse industrial applications, notably in lithium and lithium-ion batteries (Blomgren, 2017). In recent years, lithium consumption and production have risen at an annual pace of approximately 3% (Vikström et al., 2013). It is foreseen that the demand for electric vehicles is expected to increase significantly. Not only for electric vehicles but also for consumer electronics, the need for batteries is expected to rise swiftly, reaching a maximum of 2.5 TWh by the year 2030 (Xu et al., 2023). Powering electric vehicles is the most well-known application of lithium-ion batteries, which are expected to account for up to sixty percent of all new automobile sales by the year 2030 (Berckmans et al., 2017). In the case of new electric vehicles like the Tesla Model S, for instance, the battery consumes approximately 12 kg of lithium (Deng and Aifantis, 2023). Therefore, in recent decades, there is significant increase in mining activities of lithium extraction, these mining activities negatively impacted the environment and the health of wildlife and local communities (Kaunda, 2020). Mostly, the extraction of lithium is accomplished by a method known as brine mining that involves the pumping of saltwater to the surface, where it is evaporated, and lithium and other minerals are extracted (Sterba et al., 2019). As a result, the level of lithium is raised in the soil, and it may potentially enter the food chain because it is mobile in both surface and groundwater and is easily absorbed by plants. Also, if we do not dispose of these lithium batteries appropriately, it can cause lithium pollution and affect different species significantly. Lithium has the potential to penetrate the environment and contaminate both the soil and the water. Knowing that the reserves of lithium will not be adequate to meet future demand, it is essential to utilise available material in an economic and sustainable manner (Robinson et al., 2018).
Also, in humans, the absence of lithium does not demonstrate any discernible symptoms, and it is not considered a necessary nutrient for essential functions. On the other hand, a low intake of lithium has been linked to the modulation of neurotransmission, as it suppresses excitatory neurotransmitters like dopamine and glutamate while enhancing GABA-mediated neurotransmission, which suggests that low amounts of lithium have positive impacts on living organisms. Low levels of lithium in humans correlated with a decrease in the rate of cell proliferation, as well as an impairment in reproductive function and a reduction in life expectancy (Shakoor et al., 2023). Besides this, lithium carbonate serves a therapeutic function; it has been successfully utilised for over 50 years in the treatment of bipolar disorders and has also been given to patients with dementia-related diseases (Lozano et al., 2013). Thus, careful monitoring of the appropriate lithium dosage for each patient is of utmost importance, as lithium levels can be affected by a range of factors and metabolic processes. Additionally, unregulated high levels of lithium may lead to permanent damage of the nervous system and adversely affect kidney function. However, when lithium is administered at high concentrations to humans (for instance, 15 mg L−1–20 mg L−1 blood concentrations), it can be harmful, leading to symptoms like nausea, visual impairment, kidney problems, and even serious health issues such as coma and cardiac arrest (Oruch et al., 2014). The accurate and precise measurement of lithium levels in biofluids, including urine and blood, needs to be performed regularly to manage problems that may arise due to elevated levels of lithium. Electrochemical detection has been preferred for quantitative analysis due to its reliability, capability, and rapid response for on-site detection of several contaminants (He et al., 2023). The fascinating properties of metal oxides, like fast electron transport, catalytic properties, morphology tweaking, and a greater number of active sites by virtue of their high surface area, make them the most sought-after material in electrochemical detection (Fazio et al., 2021; Elugoke et al., 2024). In addition to being a magnetic p-type semiconductor, Co3O4 possesses two oxidation states, namely Co2+ and Co3+, and has attracted significant interest due to its exceptional electrocatalytic activity (Abdallah and Awad, 2020). Co3O4 having (111) planes demonstrates higher surface energy and a greater number of active sites in comparison to Co3O4 having (001) planes, which results in better adsorption and interaction with analytes, thus enhancing the electrochemical response. Furthermore, density functional theory (DFT) reveals that the electronic structure of Co3O4 having (111) plane orientation is more advantageous compared to the (001) orientation (Yu et al., 2013). Additionally, silver doping increases the surface area of Co3O4 nanoparticles, which results in an increase in the number of active sites for catalytic reactions. There is a synergistic effect that occurs when Ag and Co3O4 are combined, which results in an improvement in the catalytic performance of Co3O4. Also, the incorporation of silver enhances the charge transfer efficiency, which is an essential component of catalytic processes. Further, the band gap of Co3O4 is decreased due to the Ag doping, which results in improved light absorption and a more effective utilisation of energy in photocatalytic applications (Abdallah and Awad, 2020; Alem et al., 2023). Overall, silver doping enhances the catalytic activity of Co3O4 nanoparticles. This study presents a simple, quick, and sensitive approach for detection of lithium via electrochemical sensing. The cyclic voltammetry technique in a three-electrode system having gold wire as a working electrode modified with Ag@CNCs is utilised for the detection of lithium. Furthermore, the fabricated sensor demonstrated significant applicability for the analysis of lithium in real samples.
All reagents were purchased form Sigma Aldrich with 99.99% purity while lithium chloride was purchased from Qualigens Fine Chemicals with 99% purity and used as such without any further purification.
Ag@Co3O4 nanoparticles were synthesised using the coprecipitation method. This method involves preparing a 0.1M solution of CoCl2.6H2O in a total volume of 100 mL using distilled water. 2 mL silver nitrate (0.1M) was mixed into the earlier solution while employing magnetic stirring (400 rpm) at ambient temperature for a period of 15 min. Afterwards, a 1M solution of sodium hydroxide (NaOH), the base solution, was gradually added dropwise until the pH of the solution attained 12. Afterwards, the mixture underwent heating for 6 h at 333 K while being subjected to continuous magnetic stirring. The resulting precipitates were filtered and washed multiple times with distilled water and ethanol to achieve a neutral pH. Thereafter, the obtained, black-coloured precipitates underwent a drying process for 4 h at 363 K in a hot air oven, after which they were manually crushed to obtain fine black powder. Finally, the material underwent annealing for a duration of 4 h at a temperature of 873 K in a muffle furnace.
The synthesised Ag@CNCs were evaluated for their morphological, structural, and optical properties. The model/make-7610F Plus/JEOL (FE-SEM) with EDS was utilised for examining morphological and elemental composition characteristics, while the Benchtop Miniflex X-ray diffractometer (Rigaku) was employed to analyse structural and crystal phases. The instrument (Malvern Panalytical, Netherland) utilized to examine the characteristics of Ag@CNCs in a liquid medium, such as hydrodynamic size and zeta potential. X-ray photoelectron spectroscopy (XPS) utilising the Model PHI 5000 Versaprobe III was employed to analyse oxidation state. The chemical composition was evaluated using Fourier transform infrared (FTIR) spectroscopy employing a Perkin Elmer spectrum model. The optical characteristics were assessed through UV-visible spectroscopy (Varian Cary-5000). An electrochemical study was conducted utilising Autolab potentiostat and galvanostat.
Before modifying the gold electrode with the synthesised Ag@CNCs, the bare gold electrode underwent polishing with a slurry of 0.05 μm alumina powder on a cloth pad for approximately 5 min. Then the gold electrode was rinsed with distilled water and sonicated in pure ethanol for 10 min to remove any residual alumina particles. Following this, the electrode was cleaned using double-distilled water and was then allowed to dry at room temperature. One milligram of the Ag@CNCs was dissolved in 5 mL of ethanol and then homogenised through ultrasonication for a duration of 15 min. A single drop of the Ag@CNCs mixture was applied to the electrode and allowed to dry for 2 h at 40°C, facilitating solvent evaporation and leading to the formation of a layer of nanoparticles. Subsequently, a single drop of Nafion binder was applied to the distribution layer and allowed to dry at room temperature. Finally, the electrode was utilised as a working electrode for the detection of lithium and all experiments were performed in triplicates with their mean and standard deviation values plotted in their respective plots.
The electrochemical detection of lithium was conducted utilising a cyclic voltammetric technique within a three-electrode system, potentiostat, and galvanostat of Autolab. In the three-electrode system, the working electrode consisted of gold wire of diameter 2 mm modified with Ag@CNCs, while the counter electrode was made of platinum, and the reference electrode was Ag/AgCl (saturated KCl). Lithium chloride (99% pure), purchased from Qualigens Fine Chemicals, served as a lithium source. A notable reduction peak was detected around −0.4 V during the CV scan ranging from −1 V to +1 V in a 0.04 mM lithium chloride solution, suggesting the electrochemical reduction of lithium. The graphical abstract (Figure 1) illustrates the proposed reduction mechanism below.
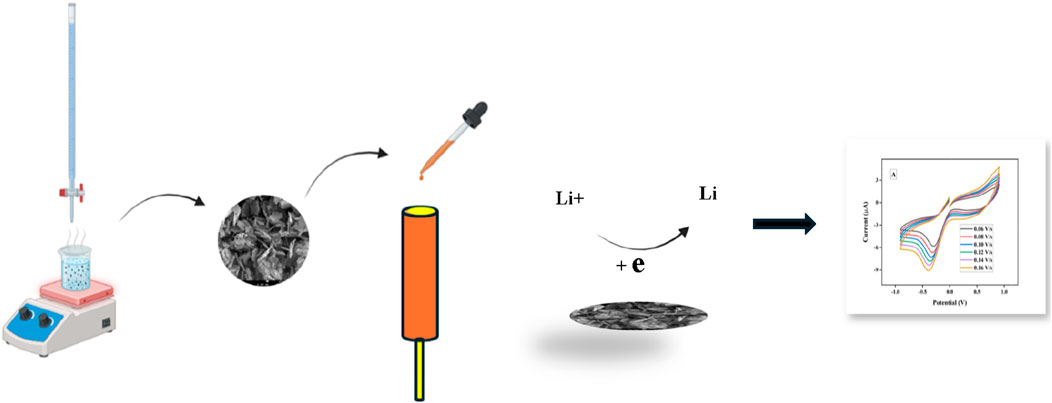
Figure 1. Proposed electrochemical reduction of lithium on working electrode.
Figure 2 shows the X-ray diffraction pattern of Ag@CNCs. The spectrum was recorded from 20° to 80° to confirm the phase and crystal structure of the materials that were synthesised.
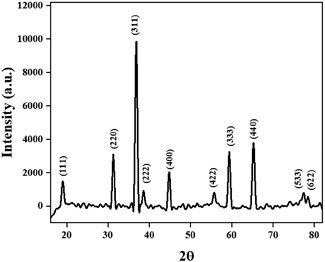
Figure 2. XRD spectrum of Ag@CNCs.
The Fourier Transform Infrared spectroscopy of the Ag@CNCs has been recorded within the spectral range of 500 cm−1 to 4,200 cm−1, as represented in Figure 3.
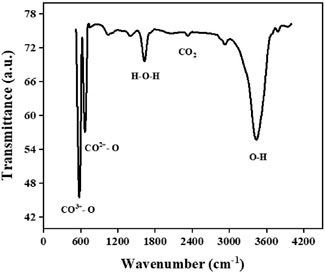
Figure 3. FTIR spectrum of Ag@CNCs.
Figure 4a illustrates the UV–Vis absorption spectrum of the Ag@CNCs and Co3O4 nanoparticles. The two significant peaks are observed in absorption spectrum. Corresponding to these two absorption peaks two different band gap energies are founded via using the Tauc equation as represented in Figure 4b.
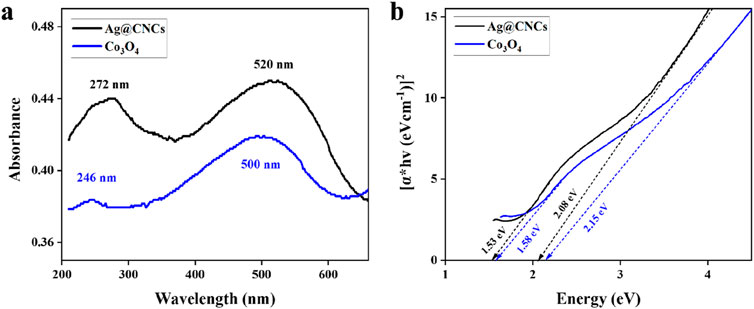
Figure 4. (a) UV-vis spectrum (b) Tauc plot of Ag@CNCs and Co3O4 nanoparticles.
FE-SEM with EDX mapping has been utilised to examine surface morphology and elemental composition of prepared samples. Figure 5a represents FESEM images of the CNCs, illustrating that the nanoparticles exhibit a chip-like morphology. Figure 5b represents an EDX mapping of the different elements present in CNCs.
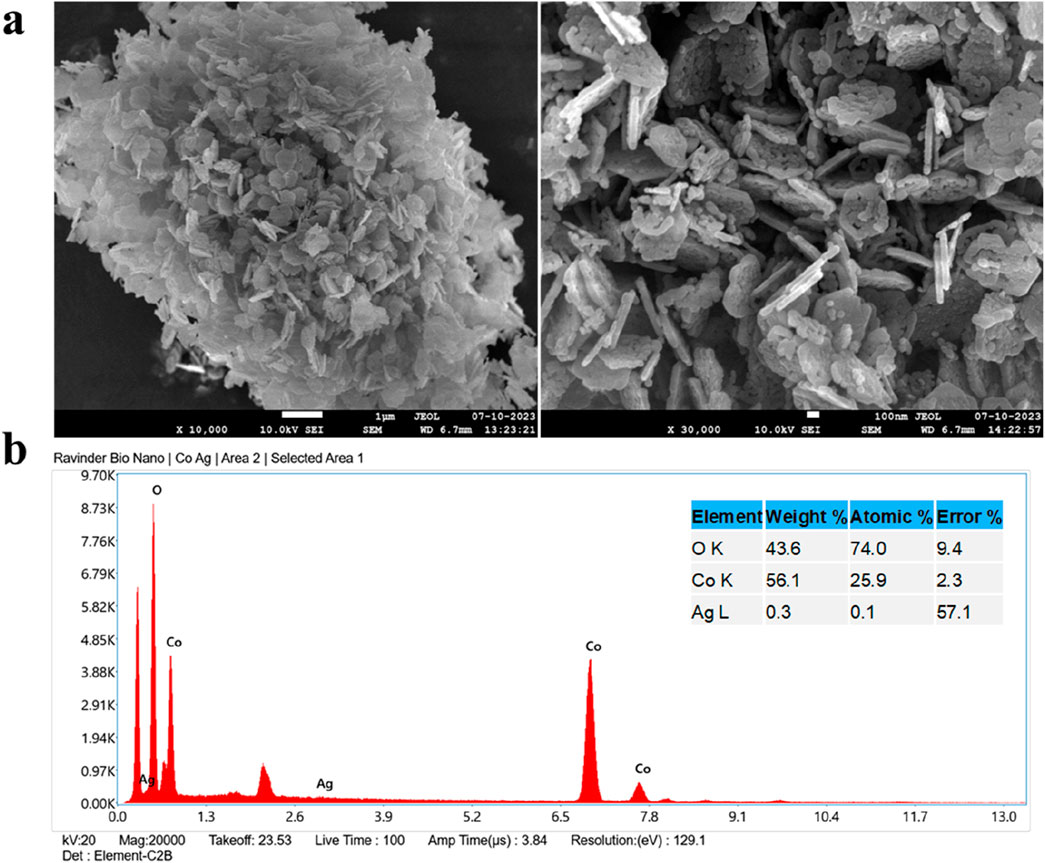
Figure 5. (a) FESEM images (b) EDX spectrum of Ag@CNCs.
The hydrodynamic size of Ag@CNCs was shown in Figure 6.
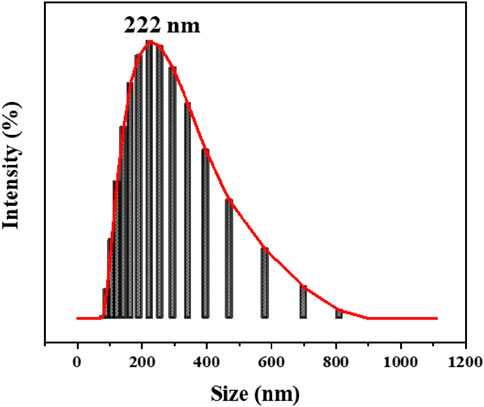
Figure 6. Particle size analysis of Ag@CNCs.
Figure 7 presents the results of our analysis of the surface composition and chemical state of materials using X-ray photoelectron spectroscopy (XPS).
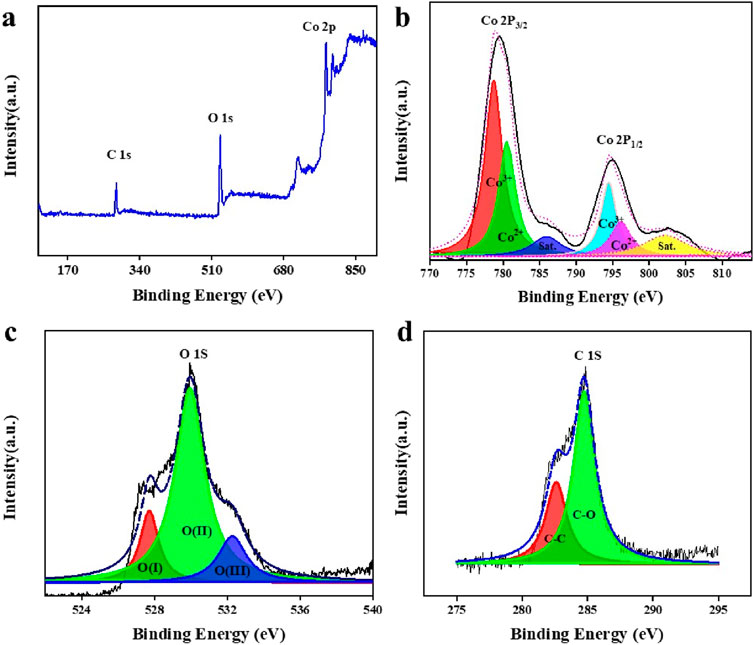
Figure 7. (a) XPS spectrum of Ag@CNCs, (b) Co 2p, (c) O 1s, and (d) C 1s.
Figure 8 illustrates the nitrogen adsorption and desorption isotherms of Ag@CNCs and Co3O4 nanoparticles.
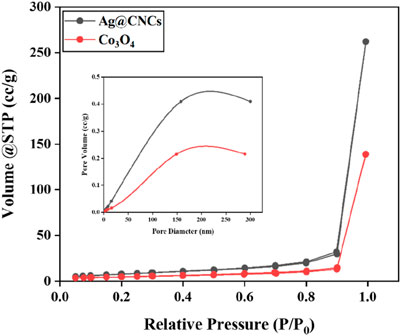
Figure 8. Surface area and pore size analysis.
Figure 9a represents the electrochemical impedance spectroscopy (EIS) result of both the unmodified gold electrode and the gold electrodes modified with Ag@CNCs and Co3O4 nanoparticles in a 4 mM KCl electrolyte solution, and Figure 9b represents the CV response of both the unmodified gold electrode and the gold electrodes modified with Ag@CNCs in a 0.04 mM LiCl solution.
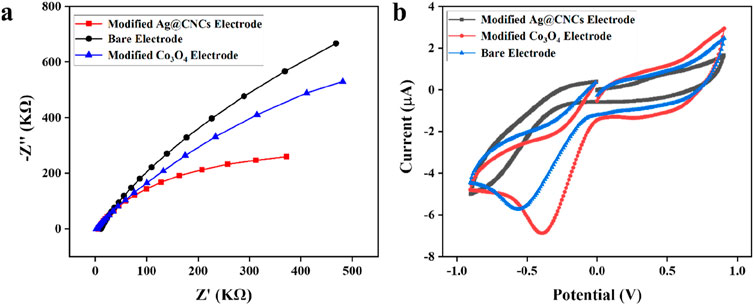
Figure 9. (a) Nyquist plot (b) C-V response of bare electrode and modified electrodes.
Different pH levels were tested to determine the optimal pH level for lithium detection using cyclic voltammetry. Figure 10 illustrates the CV scan at various pH levels.
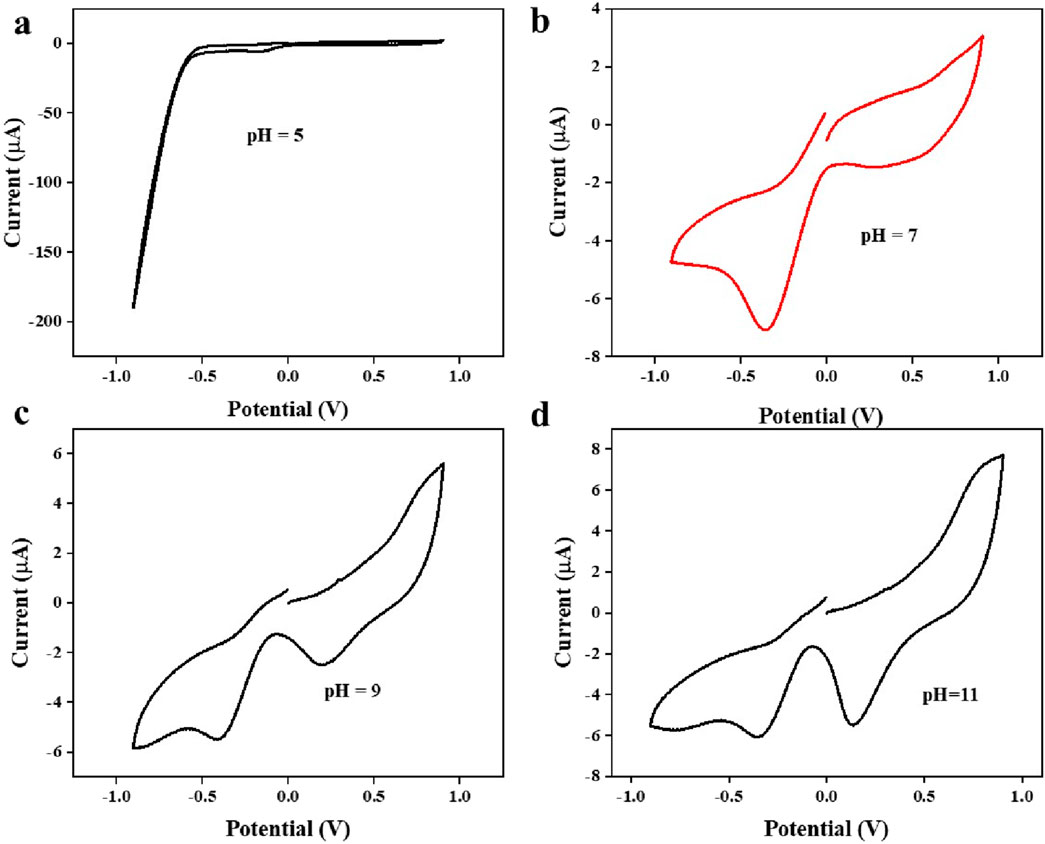
Figure 10. The influence of varying pH levels in the cyclic voltammetry study (a) pH = 5, (b) pH = 7, (c) pH = 9, (d) pH = 11.
The CV scan for lithium detection is presented in Figure 11 with negative control, distilled water blank, and known lithium-spiked sample.
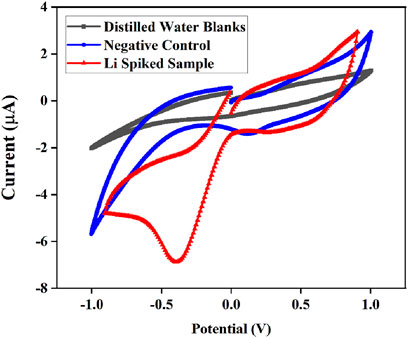
Figure 11. C-V response of modified electrode in blank, negative control and in spiked sample.
Figure 12a illustrates the effect of scan rates on the peak current value examined through cyclic voltammetry (CV) in a 0.05 mM lithium concentration solution using the modified sensor. Additionally, the peak current response demonstrates a strong linear relationship with the square root of the scan rate (Figure 12b).
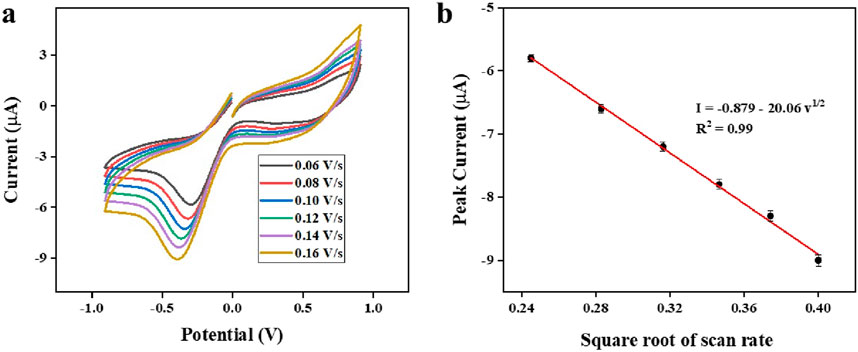
Figure 12. (a): CV response of the modified electrode at different scan rates (b): Peak current vs. square root of scan rate.
Figure 13a illustrates the response of the CV curve with different lithium concentrations (0.01–0.05 mM) at a scan rate of 0.08 Vs−1, in the potential range of −1 V to +1 V. The peak current response demonstrates a strong linear correlation with concentration (Figure 13b).
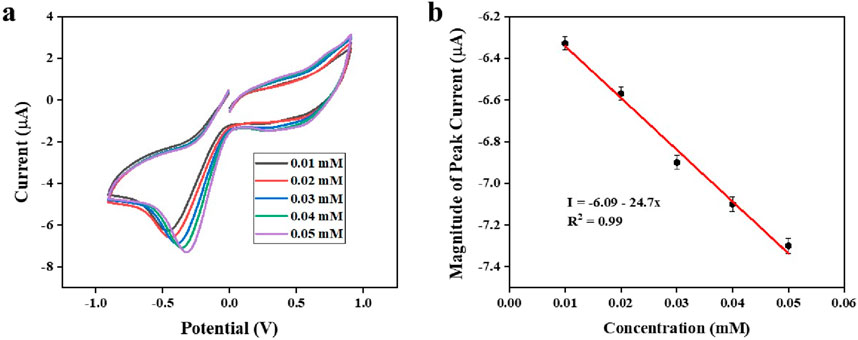
Figure 13. (a): CV response of the modified electrode at different lithium concentrations (b): peak current vs. concentration of lithium.
Figure 14 shows that the developed sensor was effective in obtaining identifiable signals from real samples intentionally contaminated with lithium.
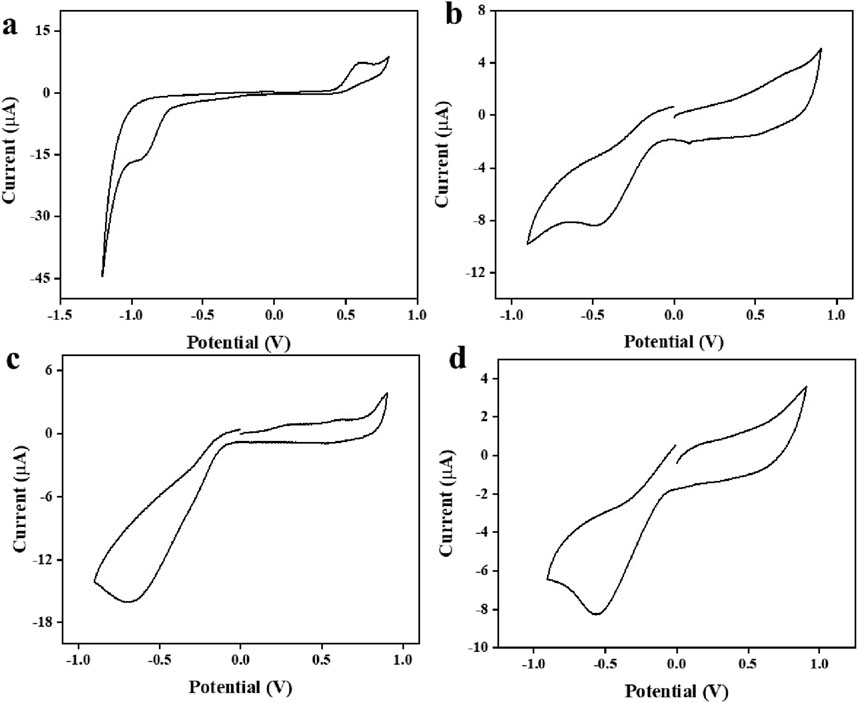
Figure 14. C-V response of developed sensor in real samples (a) urine sample (b) groundwater (c) municipal supply water (d) RO water.
Possible interference via substances analogous to lithium, such as sodium, potassium, calcium and ammonia was evaluated and presented in Figure 15.
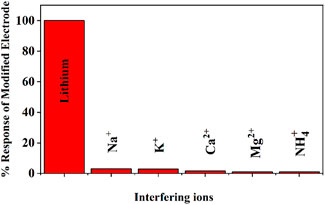
Figure 15. Interference results for various possible interfering species (concentration of interfering species 1 µM).
The phase and crystal structure of Ag@CNCs were confirmed through X-ray diffraction analysis, with the spectrum recorded in the range from 20° to 80°, as illustrated in Figure 2. The XRD peaks observed at 2θ values of 19.01°, 31.26°, 36.84°, 44.78°, 55.66°, 59.38°, 65.19°, 77.41°, and 78.52° belong to the crystal planes (111), (220), (311), (400), (422), (333), (440), (533), and (622) of cubic Co3O4, respectively. Another observation at 38.60° could be related to the (222) plane of the Co3O4 lattice, as well as the metallic FCC phase of Ag. The identified planes correspond to the face-centred cubic structure of Co3O4 nanoparticles, characterised by the space group Fd-3m (227), with Co2+ ions situated in the tetrahedral sites and Co3+ ions in the octahedral sites. The distinct peaks demonstrate the higher crystallinity of the synthesised sample, with no indications of additional phases or impurities observed. The crystallinity index of the Ag@CNCs is approximately 66%, calculated by dividing the area of all crystalline peaks by the area of all peaks. The lattice constant, as determined by Bragg’s law, is found to be a = 8.088 Å, which is slightly greater than the theoretical value of a = 8.084 Å. The larger size of the silver ion in comparison to the cobalt ion results in an increased lattice constant (Moro et al., 2013; Abdallah and Awad, 2020). The average crystalline size of Ag@CNCs was determined using the Scherrer Equation: D = kλ/(β cosθ) (Kaushik et al., 2024). D denotes crystal size, β denotes full width at half maximum (FWHM), λ indicates the wavelength of the X-ray source (0.15 nm), θ indicates the angle corresponding to the peaks, and k is the Scherrer constant (0.9). The calculations for the different peaks are described in Table 1. We find the average crystalline size of Ag@CNCs to be 14.7 nm.
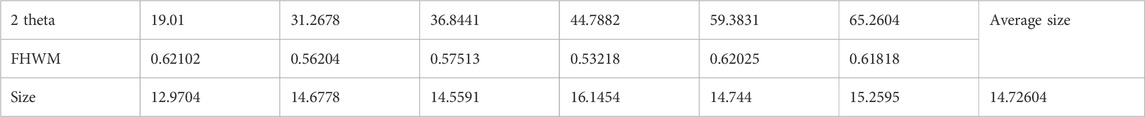
Table 1. Calculation of crystalline size using the Scherrer equation.
Two separate spikes were observed at 674 cm−1 and 580 cm−1, which correspond to the stretching vibration modes of Co2+-O and Co3+-O respectively, as represented in Figure 3. The observed peaks came from the tetrahedral and octahedral sites related to the cubic structure of the Co3O4 nanoparticles. The vibrational frequency is influenced by the bond length, as well as the atomic weight of the metallic ions involved. The variation in bond length of octahedral and tetrahedral sites results in distinct vibrational frequencies within the cubic spinel structure. The other two peaks observed at 3,435 cm−1 and 1,631 cm−1, indicate the stretching, and bending vibrations of the adsorption of water molecules from the environment. Furthermore, a minor peak was observed at 2,340 cm−1, suggesting the presence of carbon dioxide, which is likely absorbed from the surrounding medium due to high surface are of Ag@CNCs (Ranjith Kumar et al., 2018; Pandey et al., 2022).
Figure 4a illustrates the UV–Vis absorption spectrum of the Ag@CNCs and Co3O4 nanoparticles. The two significant peaks are observed in absorption spectrum. Corresponding to these two absorption peaks two different band gap energies are founded via using the Tauc equation as represented in Figure 4b. The two significant absorption peaks of Ag@CNCs were observed at 272 nm and 520 nm which are red shifted compared to the absorption peaks of Co3O4 nanoparticles. These observed peaks are linked to the charge transfer processes involving O2− ➔ Co2+ and O2− ➔ Co3+ respectively, which validate the formation of Co3O4 nanoparticles (Ravi Dhas et al., 2015). Consequently, two band gap energies (Eg) are derived using the Tauc equations:
Hydrodynamic size of Ag@CNCs was showed in Figure 6. The Ag@CNCs exhibit a hydrodynamic average particle size of 222 nm with standard deviation of 58.8 nm and a zeta potential of 36.4 mV with standard deviation of 4.9 mV. The values presented represent the mean of 30 individual measurements obtained through the use of instrument. The 36.4 mV zeta potential value of Ag@CNCs indicates sufficient repulsive forces to maintain the stability of Ag@CNCs particles in solution.
The chemical composition and valence of the Ag@CNCs were characterized through XPS analysis. Figure 7b represents the XPS spectra corresponding to the Cobalt 2p orbitals. Two principal peaks are observable at 779.5 eV and 795 eV, which correspond to the Co 2p3/2 and Co 2p1/2 spin-orbit states, respectively. The fitted peaks observed at 778.8 eV and 794.4 eV correspond to the Co3+ oxidation state, while the peaks at 780.6 eV and 796.3 eV are indicative of the Co2+ oxidation state (Zhang et al., 2022). Figure 7c illustrates the deconvoluted spectra of the oxygen 1s orbital, revealing three prominent peaks within the spectra: 527.7 eV corresponds to O (I), 529.9 eV to O (II), and 532.3 eV to O (III), which are linked to the lattice oxygen ions, surface adsorbed oxygen ions, and adsorbed water/OH, respectively. The presence of surface-adsorbed oxygen can be discerned as a consequence of the oxygen vacancies within the crystal structure, which arise from the enrichment of Ag ions. Furthermore, the C 1S peak illustrated in Figure 7d, deconvolution of peak reveals two distinct peaks at binding energies of 282.5 eV and 284.7 eV, which correspond to C–C and C–O, respectively, thereby indicating the presence of organic carbon (Liu, 2021).
The Figure 8 illustrates the nitrogen adsorption and desorption isotherms of Ag@CNCs and Co3O4 nanoparticles by utilizing Autosorb iQ Station 3 instrument. The total surface area, pore volume, and average pore diameter of Ag@CO3O4, as determined via BJH analysis were found 37.102 m2/g, 0.410 cc/g, and 56.021 nm, respectively. In contrast, the corresponding values for CO3O4 were 18.777 m2/g, 0.216 cc/g, and 52.324 nm. This shows that the incorporation of Ag increases the surface area of nanoparticles to a considerable extent.
Electrochemical impedance spectroscopy (EIS) was performed on both the unmodified gold electrode and the gold electrodes modified with Ag@CNCs and Co3O4 nanoparticles in a 4 mM KCl electrolyte solution. A notably larger radius semicircle was observed for the bare electrode and Co3O4 nanoparticles in comparison to the semicircle generated by the modified electrode by Ag@CNCs in the Nyquist plot illustrated in Figure 9a. The observed decrease in the radius of the semi-circle indicates that the bare electrode and Co3O4 nanoparticles exhibited greater resistance to electron transfer when compared to the modified electrode with Ag@CNCs as the increased surface area provides the more active site for reaction to occur which can facilitate faster charge transfer and leads to lower impedance. This clearly showed the enhanced conductive properties of the Ag@CNCs, presenting low interfacial resistance and improved electron transfer processes (Ahmad et al., 2016). The CV scan of both the bare and modified electrodes from −1 V to +1 V in 0.04 mM lithium chloride solution is presented in Figure 9b. The bare gold electrode shows no discernible peak, whereas a significant reduction peak was observed at approximately at −0.4 V and −0.6 V for the modified gold electrode with Ag@CNCs and Co3O4 nanoparticles respectively highlighting the potency of Ag@CNCs in identifying lithium (Singh and Kumbhat, 2021).
Different pH levels were tested using cyclic voltammetry to find the optimal pH level for lithium detection. Figure 10 represents the CV scan at various pH levels, as the reduction process is significantly influenced by pH representing the dependence of electrochemical detection of lithium on pH. The optimal pH level is 7, as at this pH a significant reduction peak is observed (Bhanjana et al., 2019b).
For quality control, the modified Ag@CNCs electrode was evaluated using blanks and experimental controls. The CV scan for lithium detection is presented in Figure 11 with negative control, distilled water blank, and known lithium-spiked sample. Whereas a lithium-spiked sample exhibits a reduction peak, distilled water blank and negative control samples do not show any detection peaks.
The effect of scan rates on the peak current response at the modified sensor was examined using the cyclic voltammetry technique in a 0.5 mM lithium concentration solution. As presented in Figure 12a, the magnitude of peak current values shows a rise as the scan rate rises from 0.06 to 0.16 V/s, suggesting that scan rates have a substantial impact on the electrochemical behavior of the developed sensors. Furthermore, the peak current response shows a robust linear correlation with the square root of the scan rate (Figure 12b). The resulting linear regression equation: I = −20.06v1/2–0.879, shows an R2 value of 0.99, which suggests that the electrochemical reduction reaction adheres to a standard diffusion-controlled process (Sharma et al., 2024).
To confirm the effectiveness of the Ag@CNCs in the electrochemical detection of lithium, the reduction peak current must exhibit a significant increase as lithium concentration rises. To achieve this, CV curves were obtained with varying concentrations of lithium (0.01–0.05 mM) at a scan rate of 0.08 Vs−1, spanning the potentials from −1 V to +1 V (Figure 13a). The peak current response shows a robust linear correlation with concentration (Figure 13b) with the resulting linear regression equation: I = −2.47x – 6.09, exhibiting an R2 value of 0.99 implying that the electrodes exhibit significant electrocatalytic activity. The sensor sensitivity was measured through the use of the calibration curve, calculated by dividing the slope of the curve by the surface area of the working electrode (0.0314 cm2). The sensitivity was determined to be 78.66 µAmM−1cm−2. The limit of detection (LOD) was found to be 5 µM derived using formula 3 σ/b, where ‘b’ denotes the slope of the calibration curve and ‘σ’ indicates the standard deviation value of the response, demonstrating a broad linear range (Bhanjana et al., 2019a). Also, the fabricated lithium sensor demonstrated notably great reproducibility. It was observed that the fabricated sensor maintained its activity for over 2 months when stored properly during periods of inactivity.
The practicality of the developed sensor was evaluated through the detection of lithium in real field samples using electrochemical sensing. Figure 14 illustrates that identifiable signals were obtained from samples that were intentionally contaminated, confirming the effectiveness of the developed sensor. Additionally, ICP-OES technique was carried out simultaneously using the same contaminated samples. Table 2 displays the origin of the actual sample, the quantity of spiking, and the recovered amount of lithium.
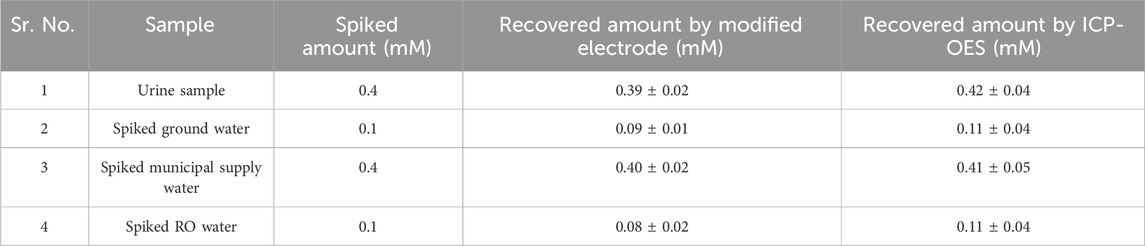
Table 2. Quantitative measurement of lithium levels in real samples that have been artificially contaminated with lithium.
Possible interference via substances analogous to lithium, such as sodium, potassium, and calcium, was evaluated and presented in Figure 15 (concentration of interfering species 1 µM). Furthermore, additional possible interfering agents found in actual water samples have been also considered during the interference studies. The results clearly indicate that the modified sensor exhibited minimal interference from possible interfering substances.
The fabricated sensor in the current technique is reviewed against the performance of previously documented lithium sensors. The comparison data is presented in Table 3. The current technique clearly demonstrates a superior figure of merits in comparison to previously reported research investigations. Therefore, the present technique can be effectively utilized for both real and laboratory sample electrochemical testing of lithium.
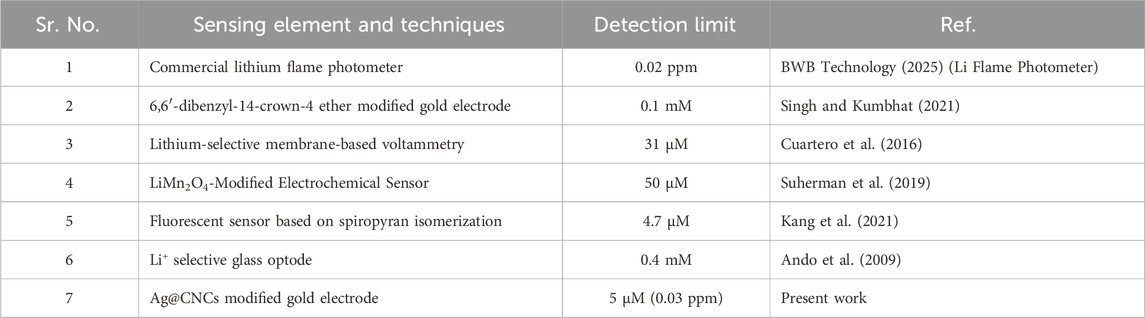
Table 3. Comparative study of different sensing technologies of lithium sensing.
In conclusion, the co-precipitation approach was employed to produce Co3O4 nanochips doped with Ag. Multiple techniques were employed to examine the physical and chemical properties of Ag@CNCs. The results indicate that the synthesized Ag@CNCs exhibit a crystalline structure characterized by a face-centered cubic structure with phase space Fd-3m (227), featuring (111) planes instead of (001) planes, that enhances the electrochemical activity by providing a greater number of active sites. The incorporation of silver (Ag) in nanostructures enhances optical properties by decreasing the band gap and improves the detection capabilities of cobalt oxide nanoparticles. Electrochemical sensor was fabricated by utilizing the Ag@CNCs for the detection of lithium in real-field samples. The fabricated sensor exhibited significant electrocatalytic activity for lithium detection, achieving a sensitivity of 78.66 μA mM−1 cm−2 and a limit of detection of 5 μM, allowing it for direct measurement without pretreatment. The importance of identifying lithium in water is derived from its ability to track and deal with contamination issues. This is crucial for the protection of aquatic ecosystems and the safety of water for the wellbeing of both humans and the environment.
The original contributions presented in the study are included in the article/supplementary material, further inquiries can be directed to the corresponding authors.
RL: Data curation, Formal Analysis, Writing–original draft. GB: Methodology, Supervision, Writing–review and editing. ND: Supervision, Writing–review and editing. VG: Formal Analysis, Validation, Writing–review and editing. SK: Conceptualization, Investigation, Supervision, Writing–review and editing.
The author(s) declare that financial support was received for the research and/or publication of this article. The authors thank MoE, Govt. of India, for a research grant vide letter No. SPARC/2019-2020/P2065/SL dated 28-07-2023. Ravinder Lamba is thankful to UGC, Govt. of India for providing SRF vide letter number 1399/(CSIR-UGC NET JUNE 2019) dated 16 December 2019. Gaurav Bhanjana is thankful to CSIR, Govt. of India for providing CSIR-SRA (No. B-12998 dated 31 March 2023). Sandeep Kumar thanks Department of Science and Technology, Govt of India for DST-PURSE grant (No. SR/PURSE/2024/350 dated 14-10-2024).
The authors declare that the research was conducted in the absence of any commercial or financial relationships that could be construed as a potential conflict of interest.
The author(s) declared that they were an editorial board member of Frontiers, at the time of submission. This had no impact on the peer review process and the final decision.
The author(s) declare that no Generative AI was used in the creation of this manuscript.
All claims expressed in this article are solely those of the authors and do not necessarily represent those of their affiliated organizations, or those of the publisher, the editors and the reviewers. Any product that may be evaluated in this article, or claim that may be made by its manufacturer, is not guaranteed or endorsed by the publisher.
Abdallah, A. M., and Awad, R. (2020). Study of the structural and physical properties of Co3O4 nanoparticles synthesized by Co-precipitation method. J. Supercond. Nov. Magn. 33, 1395–1404. doi:10.1007/s10948-019-05296-1
Ahmad, Z., Atiq, S., Abbas, S. K., Ramay, S. M., Riaz, S., and Naseem, S. (2016). Structural and complex impedance spectroscopic studies of Mg-substituted CoFe2O4. Ceram. Int. 42, 18271–18282. doi:10.1016/j.ceramint.2016.08.154
Al Boukhari, J., Zeidan, L., Khalaf, A., and Awad, R. (2019). Synthesis, characterization, optical and magnetic properties of pure and Mn, Fe and Zn doped NiO nanoparticles. Chem. Phys. 516, 116–124. doi:10.1016/j.chemphys.2018.07.046
Alem, A. F., Worku, A. K., Ayele, D. W., Wubieneh, T. A., Teshager, A. abebaw, mihret kndie, T., et al. (2023). Ag doped Co3O4 nanoparticles for high-performance supercapacitor application. Heliyon 9, e13286. doi:10.1016/j.heliyon.2023.e13286
Ando, Y., Hiruta, Y., Citterio, D., and Suzuki, K. (2009). A highly Li+-selective glass optode based on fluorescence ratiometry. Analyst 134 (11), 2314. doi:10.1039/b912756a
Berckmans, G., Messagie, M., Smekens, J., Omar, N., Vanhaverbeke, L., and Van Mierlo, J. (2017). Cost projection of state of the art lithium-ion batteries for electric vehicles up to 2030. Energies (Basel) 10, 1314. doi:10.3390/en10091314
Bhanjana, G., Chaudhary, G. R., Dilbaghi, N., Chauhan, M., Kim, K.-H., and Kumar, S. (2019a). Novel electrochemical sensor for mononitrotoluenes using silver oxide quantum dots. Electrochim Acta 293, 283–289. doi:10.1016/j.electacta.2018.10.042
Bhanjana, G., Toor, I., Chaudhary, G. R., Dilbaghi, N., Kim, K.-H., and Kumar, S. (2019b). Direct redox sensing of uranium using copper oxide quantum dots. J. Mol. Liq. 292, 111455. doi:10.1016/j.molliq.2019.111455
Blomgren, G. E. (2017). The development and future of lithium ion batteries. J. Electrochem Soc. 164, A5019–A5025. doi:10.1149/2.0251701jes
BWB Technology (2025). Li flame photometer. Available online at: https://www.bwbtech.com/products/the-bwb-li-flame-photometer-.
Cuartero, M., Crespo, G. A., and Bakker, E. (2016). Ionophore-Based voltammetric ion activity sensing with thin layer membranes. Anal. Chem. 88 (3), 1654–1660. doi:10.1021/acs.analchem.5b03611
Deng, H., and Aifantis, K. E. (2023). “Applications of lithium batteries,” in Rechargeable ion batteries (Wiley), 83–103.
Elugoke, S. E., Ganesh, P., Kim, S., and Ebenso, E. E. (2024). Common transition metal oxide nanomaterials in electrochemical sensors for the diagnosis of monoamine neurotransmitter-related disorders. ChemElectroChem 11. doi:10.1002/celc.202300578
Fazio, E., Spadaro, S., Corsaro, C., Neri, G., Leonardi, S. G., Neri, F., et al. (2021). Metal-oxide based nanomaterials: synthesis, characterization and their applications in electrical and electrochemical sensors. Sensors 21, 2494. doi:10.3390/s21072494
He, Q., Wang, B., Liang, J., Liu, J., Liang, B., Li, G., et al. (2023). Research on the construction of portable electrochemical sensors for environmental compounds quality monitoring. Mater Today Adv. 17, 100340. doi:10.1016/j.mtadv.2022.100340
Kang, J., Li, E., Cui, L., Shao, Q., Yin, C., and Cheng, F. (2021). Lithium ion specific fluorescent reversible extraction-release based on spiropyran isomerization combining crown ether coordination and its bioimaging. Sensors Actuators B Chem. 327, 128941. doi:10.1016/j.snb.2020.128941
Kaunda, R. B. (2020). Potential environmental impacts of lithium mining. J. Energy and Nat. Resour. Law 38, 237–244. doi:10.1080/02646811.2020.1754596
Kaushik, S., Agarwal, A., Sanghi, S., Chauhan, M., Vermani, V., Kumar, A., et al. (2024). Investigation of crystal structure, morphology and Raman spectroscopy of single-phase double perovskite Sr2NiWO6. AIP Conf. Proc. 3045, 040007. doi:10.1063/5.0201164
Liu, Y. (2021). Achieving high electrochemical performance Li-S batteries by the employment of Co3O4 nanospheres as sulfur hosts. Ionics (Kiel) 27, 1537–1542. doi:10.1007/s11581-021-03952-y
Lozano, R., Marin, S. G., Freire, I., and Gomez, (2013). The efficacy of Li in bipolar disorder. Neuropsychiatr. Dis. Treat. 953, 953. doi:10.2147/NDT.S48383
Moro, F., Yu Tang, S. V., Tuna, F., and Lester, E. (2013). Magnetic properties of cobalt oxide nanoparticles synthesised by a continuous hydrothermal method. J. Magn. Magn. Mater 348, 1–7. doi:10.1016/j.jmmm.2013.07.064
Oruch, R., Elderbi, M. A., Khattab, H. A., Pryme, I. F., and Lund, A. (2014). Lithium: a review of pharmacology, clinical uses, and toxicity. Eur. J. Pharmacol. 740, 464–473. doi:10.1016/j.ejphar.2014.06.042
Pal, J., and Chauhan, P. (2010). Study of physical properties of cobalt oxide (Co3O4) nanocrystals. Mater Charact. 61, 575–579. doi:10.1016/j.matchar.2010.02.017
Pandey, V., Adiba, A., Munjal, S., and Ahmad, T. (2022). Optical bandgap tuning of cubic spinel Co3O4 by annealing temperature. Mater. (Oxf) 26, 101554. doi:10.1016/j.mtla.2022.101554
Ranjith Kumar, E., Srinivas, C., Deepty, M., Pradeep, I., Mehar, M. V. K., Prajapat, C. L., et al. (2018). Synergistic effect of heat treatment on structural, magnetic and dielectric properties of spinel ferrite nanoparticles. J. Mater. Sci. Mater. Electron. 29, 20968–20977. doi:10.1007/s10854-018-0241-4
Ravi Dhas, C., Venkatesh, R., Jothivenkatachalam, K., Nithya, A., Suji Benjamin, B., Moses Ezhil Raj, A., et al. (2015). Visible light driven photocatalytic degradation of Rhodamine B and Direct Red using cobalt oxide nanoparticles. Ceram. Int. 41, 9301–9313. doi:10.1016/j.ceramint.2015.03.238
Robinson, B. H., Yalamanchali, R., Reiser, R., and Dickinson, N. M. (2018). Lithium as an emerging environmental contaminant: mobility in the soil-plant system. Chemosphere 197, 1–6. doi:10.1016/j.chemosphere.2018.01.012
Shakoor, N., Adeel, M., Ahmad, M. A., Zain, M., Waheed, U., Javaid, R. A., et al. (2023). Reimagining safe lithium applications in the living environment and its impacts on human, animal, and plant system. Environ. Sci. Ecotechnology 15, 100252. doi:10.1016/j.ese.2023.100252
Sharma, B., Jain, S., Kumar, S., and Dilbaghi, N. (2024). ZnO 2/CNT nanocomposite-based electrochemical sensors for the detection of trinitrotoluene. ACS Chem. Health and Saf. 31, 85–97. doi:10.1021/acs.chas.3c00096
Singh, U., and Kumbhat, S. (2021). Ready to use electrochemical sensor strip for point-of-care monitoring of serum lithium. Electroanalysis 33 (2), 393–399. doi:10.1002/elan.202060393
Sterba, J., Krzemień, A., Riesgo Fernández, P., Escanciano García-Miranda, C., and Fidalgo Valverde, G. (2019). Lithium mining: accelerating the transition to sustainable energy. Resour. Policy 62, 416–426. doi:10.1016/j.resourpol.2019.05.002
Suherman, A. L., Rasche, B., Godlewska, B., Nicholas, P., Herlihy, S., Caiger, N., et al. (2019). Electrochemical detection and quantification of lithium ions in authentic human saliva using LiMn 2 O 4 -modified electrodes. ACS Sensors 4 (9), 2497–2506. doi:10.1021/acssensors.9b01176
Vikström, H., Davidsson, S., and Höök, M. (2013). Lithium availability and future production outlooks. Appl. Energy 110, 252–266. doi:10.1016/j.apenergy.2013.04.005
Xu, C., Behrens, P., Gasper, P., Smith, K., Hu, M., Tukker, A., et al. (2023). Electric vehicle batteries alone could satisfy short-term grid storage demand by as early as 2030. Nat. Commun. 14, 119. doi:10.1038/s41467-022-35393-0
Yu, X.-Y., Meng, Q.-Q., Luo, T., Jia, Y., Sun, B., Li, Q.-X., et al. (2013). Facet-dependent electrochemical properties of Co3O4 nanocrystals toward heavy metal ions. Sci. Rep. 3, 2886. doi:10.1038/srep02886
Keywords: lithium, Co3O4 nanochips (CNCs), doping, electrochemical sensing, nanomaterial
Citation: Lamba R, Bhanjana G, Dilbaghi N, Gupta V and Kumar S (2025) Fabrication and evaluation of nanomaterial based electrochemical sensor for robust detection of lithium. Front. Nanotechnol. 7:1563705. doi: 10.3389/fnano.2025.1563705
Received: 20 January 2025; Accepted: 19 March 2025;
Published: 28 March 2025.
Edited by:
Xiaoyu Gao, Baylor University, United StatesReviewed by:
Anirban Kundu, Anthesis Group, CanadaCopyright © 2025 Lamba, Bhanjana, Dilbaghi, Gupta and Kumar. This is an open-access article distributed under the terms of the Creative Commons Attribution License (CC BY). The use, distribution or reproduction in other forums is permitted, provided the original author(s) and the copyright owner(s) are credited and that the original publication in this journal is cited, in accordance with accepted academic practice. No use, distribution or reproduction is permitted which does not comply with these terms.
*Correspondence: Vivek Gupta, dml2ZWtndXB0YS5za2d0QGdtYWlsLmNvbQ==; Sandeep Kumar, a3NhbmRlZXAzNkB5YWhvby5jb20=; Gaurav Bhanjana, Z2duYmhheWFuYUBnbWFpbC5jb20=
Disclaimer: All claims expressed in this article are solely those of the authors and do not necessarily represent those of their affiliated organizations, or those of the publisher, the editors and the reviewers. Any product that may be evaluated in this article or claim that may be made by its manufacturer is not guaranteed or endorsed by the publisher.
Research integrity at Frontiers
Learn more about the work of our research integrity team to safeguard the quality of each article we publish.