 Christoffer Åberg
 Alwin Jansen
95% of researchers rate our articles as excellent or good
Learn more about the work of our research integrity team to safeguard the quality of each article we publish.
Find out more
ORIGINAL RESEARCH article
Front. Nanotechnol., 18 March 2025
Sec. Computational Nanotechnology
Volume 7 - 2025 | https://doi.org/10.3389/fnano.2025.1537076
This article is part of the Research TopicEmerging Leaders in NanotechnologyView all 5 articles
When nano-sized objects are introduced into biological systems they almost inevitably will be exposed to a compositionally complex fluid environment. It is a general observation that nanoparticles in such environments rapidly get covered by a biomolecular corona composed of proteins, lipids, and sugars that adsorb to the particle surface. While this phenomenon has been extensively studied from an experimental point of view, and to some extent also theoretically and computationally, we still lack a solid theoretical framework. Here we investigate the kinetics of corona formation, particle-to-particle variability in corona composition, and the spatial vicinity of different biomolecules in the corona. We do so under the assumptions that biomolecular adsorption occurs randomly, that adsorption is irreversible, and that there are no biomolecule-biomolecule interactions. We derive analytical formulae but also illustrate their outcomes using for experiments reasonable parameters. Overall, our results, derived under simplifying assumptions, are intended as useful reference points against which both experimental and more realistic computational and theoretical studies can be compared.
The human body may be exposed to nano-sized objects, nanoparticles, from several sources, including from traffic pollution (Rönkkö et al., 2017), nanoplastics in the water (Leslie and Depledge, 2020; Mitrano et al., 2021), and food additives (Peters et al., 2012). Meanwhile, nanoparticles may also be deliberately introduced into the human body, as a means of delivering drugs (van der Meel et al., 2019; Mitchell et al., 2021) or as vaccines (Friedrichs and Bowman, 2021; Nel and Miller, 2021). In all of these situations, the nanoparticle will invariably be exposed to a compositionally complex biological fluid, such as blood (for injected nanoparticles), lung surfactant fluid (inhaled), and gastrointestinal fluid (ingested) (Soliman et al., 2024). Unless specifically designed to avoid it (Barz et al., 2024), the sheer number of different types of biomolecules in biological fluids, together with the nanoparticle interfacial energy, typically leads to the adsorption of a layer of biomolecules onto the nanoparticle surface – the formation of a nanoparticle biomolecular corona (Monopoli et al., 2012). Experimentally it has been observed that for many nanoparticles, the biomolecular corona may be further subdivided into a hard and soft corona (Walczyk et al., 2010). The hard corona is those biomolecules that remain with the nanoparticle for long periods of time, at least several hours (Walczyk et al., 2010), while the soft corona is those biomolecules that exchange much more rapidly, seconds or quicker (Milani et al., 2012), with the surrounding fluid. In many cases, the hard corona biomolecules are likely to be those that bind directly to the nanoparticle surface, while the soft corona biomolecules bind to other biomolecules in the corona, sometimes building up successive biomolecular layers (Milani et al., 2012). Fundamentally, though, it seems preferable to define the hard and soft corona biomolecules based on residence times. Given that many important biological processes occur at minute timescales, the hard corona has been identified as the de facto biological identity of the nanoparticle (Lynch et al., 2009). Consequently, much effort has been devoted to studying the composition of the hard corona, both in terms of proteins (Walkey and Chan, 2012), lipids (Hellstrand et al., 2009; Papafilippou et al., 2023), and sugars (Wan et al., 2015). The composition naturally depends on the biological fluid in question, giving a distinct biological identity, and hence consequent biological interactions, depending upon the exposure route (Westmeier et al., 2015).
While the majority of studies have investigated the biomolecular corona experimentally, it has also been researched computationally. Most such studies have been performed using coarse-grained methods, ranging from modelling the biomolecules as ellipsoids (Vilaseca et al., 2013), to molecularly more resolved approaches (Ding et al., 2013; Wang et al., 2013; Shao and Hall, 2016; Power et al., 2019), but studies with full atomistic resolution have likewise been performed (Yu et al., 2016; Moya et al., 2019). Kinetic models of increasing detail have also been utilised, starting with simple rate equations (Dell’Orco et al., 2010), to rate equations taking into account multiple binding (Darabi Sahneh et al., 2013; Rouse and Lobaskin, 2021), to rate equations taking into account biomolecule-biomolecule interactions (Vilanova et al., 2016). Many aspects of the biomolecular corona nevertheless remain unresolved, both from an experimental and a more theoretical/computational perspective, including its kinetics and dynamics, particle-to-particle variability, and spatial organisation, among others.
Here we study the kinetics, composition, and spatial configuration of the hard biomolecular corona using simple theoretical models. We do so under the assumptions that biomolecular adsorption occurs randomly, that adsorption is irreversible, and that there are no biomolecule-biomolecule interactions. While these assumptions may not all be fulfilled in reality, we stress that the purpose of this work is not mainly to describe experimental results; rather, the objective is to provide a theoretical framework within which to interpret experimental, and even computational and theoretical, results. An example is perhaps best to illustrate: Below we will consider the probability that two different types of biomolecules in the corona are in the vicinity of each other. We will do so without taking into account any interactions between the two biomolecules. This may be a useful approximation for some biomolecule pairs, and the results can then, indeed, be directly compared to experiments. However, say that experimentally it is observed that two biomolecules are often close to each other in the corona, and it is suspected that this is due to a favourable interaction between them (Monopoli et al., 2012). How could we know whether this is, indeed, the case, or whether it is just by chance? Our results would be useful to resolve this question, as they provide the baseline against which to compare experimental results. The situation is quite similar to the ideal gas, which certainly is sometimes useful as an approximation to a real gas, but which is also incredibly useful as the baseline against which observations are measured. It is in this sense that we consider this work a useful framework.
From this perspective, we consider three separate problems related to the biomolecular corona: We start by considering the kinetics of corona formation, with the specific aim of deriving the timescale for complete coverage. We next consider the variability in biomolecular corona composition between particles, that is, how different is the composition particle to particle? Finally, we calculate the probability that two biomolecules in the corona are in the vicinity of each other. Throughout, we focus on analytical results and illustrate the magnitude of them using realistic parameters wherever possible.
For definiteness we will only consider spherical nanoparticles. While this limits the applicability somewhat, it should be noted that spherical particles remain the most studied systems experimentally, so this is in line with experimental efforts. Moreover, we will assume that all particles are the same size, which is often approximately true experimentally. We also focus on the hard biomolecular corona and assume it is formed by those biomolecules that bind directly to the nanoparticle surface (though fundamentally, as already mentioned, the hard corona is defined by residence time). PEGylated nanoparticles, and particles that have been designed to avoid biomolecular adsorption in general (Barz et al., 2024), are thus out of scope of this work.
Furthermore, we will assume that the particle is substantially larger than the biomolecules that adsorb to it. Admittedly, typical nanoparticle sizes whose biomolecular corona has been studied in experiments range from hundreds of nanometres to just a few nanometres. However, nanoparticles in the low nanometre range are of similar size, or even smaller, than many biomolecules, raising the question of whether binding should be described as the formation of a nanoparticle corona or nanoparticle binding to biomolecules. Additionally, several other effects, such as the nanoparticle high curvature relative to the size of the biomolecules, likely become important. Such effects may lead to entirely new phenomena and so it seems reasonable to treat the low nanometre end as a separate case. Focussing on particles substantially larger than biomolecules also has the practical advantage that several mathematical formulae below can be expanded to obtain a simpler form.
While the biomolecular corona typically is made up of a very diverse set of biomolecules, it is necessary to make simplifying assumptions in order to find general conclusions. We will thus assume that all biomolecules have the same size and hence occupy the same area on the nanoparticle surface. This allows us to consider the nanoparticle as being made up of a certain number of binding sites, N. We will use the estimate that the number of binding sites is given by
where R is the radius of the particle and R′ the radius of a biomolecule. In principle one could augment this formula with an additional factor to account for that the biomolecules cannot utilise the full surface of the particle. For example, one could consider the maximum number of biomolecules that could possibly bind to the particle, for which there are models available for spherical biomolecules (Soloviev et al., 2022); for a nanoparticle substantially larger than the biomolecule, such an approach would imply that we should simply multiply the right-hand side of Equation 1 by π/(2√3) ≈ 0.91, the maximum packing density of disks in two dimensions. It is, however, far from clear that biomolecules in the corona can utilise the full extent of maximum packing and random packing might be a better approximation. Furthermore, matters get even more complicated when the corona contains a complex mixture of different biomolecules of different sizes and, for example, smaller biomolecules could fill the gaps left by bigger ones. Overall, we thus use the simple estimate represented by Equation 1 to get the general dependence on the parameters roughly right, but the reader should keep in mind its approximate nature and also consider potential improvements valid under special circumstances (for example, for coronae formed by a single type of a spherical biomolecule).
We assume that the biomolecules in the biological fluid are present in sufficient numbers compared to the biomolecules that actually adsorb, so that we do not have to take into account depletion of a certain biomolecule from the biological fluid. This is not necessarily always the case experimentally, as sometimes experiments are conducted using low biomolecular concentrations, high nanoparticle concentrations, and/or large nanoparticles (which, in combination with a high nanoparticle concentration, leads to a high nanoparticle adsorption site concentration). Furthermore, some biomolecules that adsorb to nanoparticles are present in such low abundance in the biological fluid that their concentration may actually be lower than the nanoparticle (adsorption site) concentration, implying the possibility of their depletion. However, if we consider a nanoparticle that incidentally ends up in a human being in real life, then the nanoparticle concentration is likely to be very low compared to the biological fluid. Thus this assumption is often the more relevant one for realistic situations.
While many of our results will be in terms of (dimensionless) variables, it is nevertheless useful to have specific systems at hand for illustrative purposes and to demonstrate the magnitude of the effects. Typical experimental control parameters include the type of biomolecule dispersion, as well as its concentration, together with nanoparticle size. For the biological dispersion, let us consider experiments on cells which are often conducted with cell culture medium supplemented with bovine serum at a concentration of 10%, corresponding to around 4 mg/mL. Aside from proteins, such a dispersion also contains other biomolecules, such as lipids and sugars, that also form part of the corona. As concentrations of the individual biomolecular species are not so easy to come by, we only take into account the proteins for simplicity. Indeed, even if we just consider the proteins, the number of biomolecules in serum is not well-known, but it will be sufficient for our purposes to make an order of magnitude estimate (Vtyurina et al., 2021). Thus, the most abundant protein in serum is albumin, which has a molecular weight of around 66 kDa; if we take this as a typical protein mass, then 4 mg/mL corresponds to a molar concentration of 60.6 μM or a number concentration of 3.6⋅1022/m3. Naturally, including other biomolecular species such as lipids and sugars would make this estimate higher.
As exemplar nanoparticles, we will consider (spherical) nanoparticles with a radius of 25, 50, and 100 nm, which are all substantially bigger than typical biomolecules. As for the size of ‘a biomolecule’, this is obviously not well-defined as proteins, lipids, sugars, etc. vary widely in size. However, for illustrative purposes we consider the proteins which are the most well-studied. Based on a few different proteins (Vtyurina et al., 2021), we may then estimate that the surface area occupied by a biomolecule in the corona is around 50 nm2, corresponding to a radius of around 4 nm. This number would be substantially lower, for example, for a lipid, but does correspond to the (hydrodynamic) radius of serum albumin (Armstrong et al., 2004), the most common protein in blood plasma (Anderson and Anderson, 2002). With these numbers in mind, we can estimate from Equation 1 that nanoparticles of radius 25, 50, and 100 nm have around 160, 630, and 2500, respectively, adsorption sites.
Finally, while not explicitly considered in our models, it is perhaps worthwhile to note that the nanoparticle dispersion must remain colloidally stable for this approach to make sense.
After these initial considerations we start by considering the kinetics of corona formation, where one of our key objectives is to derive an analytical expression for the timescale of complete corona formation. More specifically, we focus on the hard corona and assume that binding is irreversible so the timescale of complete corona formation is really the timescale of complete nanoparticle coverage. While we thus neglect exchange dynamics of the hard corona biomolecules, this is likely not very severe; the hard corona has been shown to remain with the nanoparticle for several hours (Walczyk et al., 2010), suggesting that the hard corona biomolecules do not leave the complex by themselves and that exchange depends upon the presence of incoming biomolecules (Monopoli et al., 2012). As long as this remains true, the timescale of complete corona formation thus remains the same, with or without exchange (though the composition will change).
Let us denote a nanoparticle with n biomolecules adsorbed to it by NP-BMn. n can range from n = 0, the bare nanoparticle with no biomolecules adsorbed to it, to n = N, a nanoparticle where all available adsorption sites, N, are occupied. Furthermore, we let BM denote a biomolecule. Assuming irreversible binding, we can then write the kinetics of corona formation as the following scheme
Assuming the law of mass action, this kinetic scheme then translates into the differential equation system
where [NP-BMn] is the concentration of nanoparticles with n biomolecules adsorbed to them, [BM] is the concentration of biomolecules, and kn is the rate constant for the adsorption of a biomolecule to a nanoparticle that already has n adsorbed biomolecules. This equation system is similar to previous approaches (Darabi Sahneh et al., 2013; Rouse and Lobaskin, 2021).
Let us now consider the rate constant, k0, for a biomolecule adsorbing to the bare nanoparticle. Under the stated assumptions, we can take this rate constant directly from Smoluchowski’s theory for colloidal aggregation kinetics (Chandrasekhar, 1943; Evans and Wennerström, 1999; Minor and van Leeuwen, 2005); for the association of two spherical objects of different size, the rate constant is given by (Evans and Wennerström, 1999)
where D and D′ are the diffusion coefficients corresponding to a radius of R and R′, respectively. The sum of radii stem from that this is the distance between the centres of the objects upon contact. Likewise, the sum of diffusion coefficients takes into account the mutual diffusion of the particle and the biomolecule; however, for a particle that is substantially larger than the biomolecule, the diffusion is dominated by that of the biomolecule. Under these conditions we can replace the sum of diffusion coefficients by the diffusion coefficient of the biomolecule, as we will shortly do, in particular because this is an assumption that is often implicitly made in the literature. Indeed, using the Stokes-Einstein equation for the diffusion coefficients, we find
where η is the viscosity of the medium, T the absolute temperature, and k the Boltzmann constant. When the size of the particle is much larger than the size of the biomolecule, R′/R ≪ 1, this simplifies to
In this approximation, the rate constant is consequently proportional to the radius of the particle, implying that the rate constant for adsorbing to a particle is higher the larger the particle. This occurs because the probability that a biomolecule collides with a particle is higher the larger the particle, and while the larger particle diffuses slower, this is a smaller effect (not visible in this approximation).
Let us now consider the rate constants, kn for n = 1, 2, … , for adsorbing to a particle when there are already some biomolecules adsorbed to it. Naturally, it will be easier for a biomolecule to find an empty adsorption site in the beginning of corona formation (n low), as most adsorption sites are still available, and hence the rate constant will be similar to the rate constant for adsorbing to the bare particle. Towards the end of corona formation (n comparable to N), when most adsorption sites are already occupied, the rate constant will be lower as it gets increasingly more difficult to find an empty spot. Additionally, there is the small effect that the particle diffuses slower the larger it is, but, as just discussed, we do not expect that to play any role in our approximation.
To begin with, we will work under the assumption that regardless of the number of already adsorbed biomolecules, the whole particle can be adsorbed to, that is, we will not consider the problem of finding an empty adsorption site. This is a good assumption in the initial stages of corona formation, but obviously worsens as empty adsorption sites start filling up. The utility of this assumption is that we may assume the rate constants to be independent of the number of pre-adsorbed biomolecules and equal to the Smoluchowski expression
Under this assumption, and using that no particles have any adsorbed biomolecules initially, the solution to the rate equation system is given by
where [NP] is the total concentration of nanoparticles, whether they have adsorbed biomolecules or not. The expression for [NP-BMN](t) can be reformulated into
where Γ(n) is the gamma function, γ(n,z) the lower incomplete gamma function (Arfken and Weber, 2001; Jeffrey et al., 2007), and P(n, z) the regularised lower incomplete gamma function (Paris, 2010). The last expression is numerically more convenient when N is large, as it typically is in our application.
It is evident from this equation – in fact, already from the differential equation system – that the time dependence is given by the dimensionless quantity
This implies that the kinetics scales directly with the concentration of biomolecules, [BM], and absolute temperature, T (assuming no other effects, e.g., on the stability of the particle or biomolecule dispersions). Furthermore, the kinetics also scales approximately with the radius of the particle, R.
Another observation we may make is that the solution is independent of the total number of adsorption sites, N, aside from when n = N. While we have derived this result under the assumption that a biomolecule does not have to spend time finding an empty adsorption site, we expect this to be a good assumption in the initial stages of corona formation. Thus, the initial stages of corona formation are independent of the size of the particle, in the sense that the number of particles with n adsorbed biomolecules, for n small, evolve in the same way regardless of the size of the particle. (Nevertheless, there is a dependence on the size of the particle, R, ‘hidden’ in the rate constant, k0.)
More concretely, Figure 1A shows the time-evolution of the number of particles with n = 0, 1, 2, and 3 adsorbed biomolecules. As is natural, we observe that the number of bare particles (i.e., particles with 0 biomolecules adsorbed) rapidly decreases with a half-life ∼(k0 [BM])−1. Concomitantly, the number of particles with one adsorbed biomolecule increases, followed, with a bit of a delay, by the number of particles with two adsorbed biomolecules, then by the number of particles with three adsorbed biomolecules, etc., with the delay increasing with more biomolecules adsorbed.
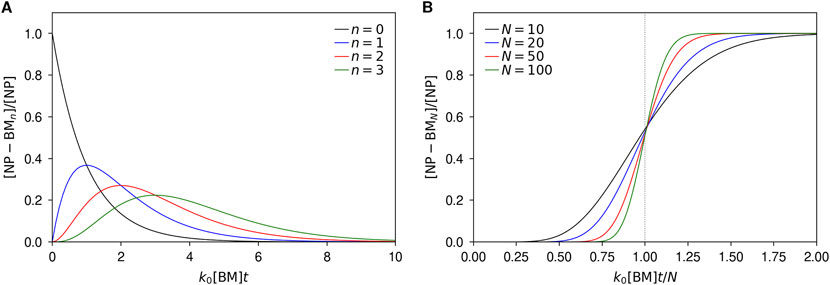
Figure 1. Kinetics of biomolecular corona formation under the assumption that the rate of adsorption is independent of the number of already adsorbed biomolecules. Particle concentrations have been normalised with the total concentration of particles, while time has been rendered dimensionless by multiplying with the rate constant, k0, and biomolecular concentration, [BM]. (A) Concentration of particles with 0, 1, 2, and 3 biomolecules adsorbed to them as a function of time. (B) Concentration of particles fully covered by biomolecules as a function of time and for several different particle sizes (i.e., number of adsorption sites, N). Aside from making time dimensionless, it has been further normalised by the number of adsorption sites, N, so as to present the results on the same scale.
Within this model, the timescale of corona formation is best measured by the number of particles that are completely covered, [NP-BMN]. Figure 1B shows the number of such particles as a function of time, normalising time with the number adsorption sites per particle, N. We observe that when the particle only has N = 10 adsorption sites, the number of fully covered particles grows continuously until all particles are fully covered. However, as the number of adsorption sites (i.e., the size of the particle), increases, the transition from almost no fully covered particles to all particles covered becomes increasingly sharp, and is centered on k0[BM]t ∼ N. Note that for the nanoparticle radii 25, 50, and 100 nm we use as examples, the transition is sharper than illustrated by Figure 1B, as these particle sizes all correspond to more adsorption sites (around 160, 630, and 2500, respectively). The sharpness of the transition is an important outcome, for it implies that when the particle is much larger than the biomolecules, we expect the timescale of corona formation to be given by
where we have used the Smoluchowski expression for the rate constant and inserted the expression (Equation 1) for the total number of adsorption sites, N. This result shows that the timescale of corona formation is inversely proportional to the concentration of biomolecules. Furthermore, it is directly proportional to the radius of the particle.
Let us now estimate what this result implies in terms of explicit numbers. As discussed above, we consider nanoparticle radii of R = 25, 50, and 100 nm, and a biomolecule concentration representing (the protein part of) 10% bovine serum. At a temperature of 25°C the viscosity of water is 890 μPa⋅s. We then find that the timescale of corona formation is 0.2, 0.4 and 0.8 ms for particles of radius R = 25, 50, and 100 nm. In other words, compared to typical experimental timescales (minutes to tens of minutes), corona formation is expected to be very fast, at least under the stated assumptions.
Let us now make more realistic, but mathematically more complex, assumptions on the rate constants. So far we did not take into account that it becomes increasingly difficult for a biomolecule to find an empty site on the particle as corona formation progresses. Determining the probability that a biomolecule can find an empty site on a particle partially covered by other biomolecules in some random arrangement is a formidable problem. Nevertheless, there are useful approximate expressions available in the literature. For instance, the classic result due to Berg and Purcell (1977) can be used to estimate the rate constant for adsorption to a particle when the empty sites are fairly few and well-distributed over the surface. More complex approaches are also available in the literature Rouse and Lobaskin (2021). Here, however, we will use an improvement on the Berg and Purcell formula due to Zwanzig (1990), that has a larger range of validity but nevertheless remains fairly simple, viz.
where the area fraction of occupied sites, ρ, is
so that
again using the Stokes-Einstein equation for the diffusion coefficient and also identifying the Smoluchowski rate constant, k0. For a bare particle (n = 0) this reduces to the Smoluchowski result, as is reasonable. Similarly, for an almost completely occupied particle (n = N − 1) the rate constant becomes
We can compare this to the result expected for a large particle of radius R with a single patch of radius R′, for which it has been derived (Berg and Purcell, 1977; Shoup and Szabo, 1982) that the rate constant is
which is clearly exactly the same result.
Compared to our approximation that the rate constant does not change regardless of the number of adsorbed biomolecules (kn = k0), the rate constant for the last adsorbing biomolecule is consequently reduced by a factor πR/R′. Using a biomolecule radius of 4 nm like above, this amounts to a reduction of around 20, 40, and 80 for a particle radius of R = 25, 50, and 100 nm, respectively. This is a substantial reduction, though it should of course be emphasized that this is in the very last stage of corona formation when only a single free adsorption site remains.
Indeed, we have that
which is a quite slow-varying function of n/N and especially so for R/R′ large. Figure 2 illustrates this for a few selected radii ratios, R′/R. We observe that the rate constant for adsorbing to a nanoparticle with n biomolecules already adsorbed is essentially the same as if the particle was completely bare, as long as the number of already occupied sites is not too large. Especially for larger particles, the range for which the particle appears to be bare is quite large; using the same conditions as described above and a particle radius of 100 nm, the number of occupied sites has to reach 90% before the rate constant is lowered by 25% of the value for a bare particle [this effect is essentially one of the main outcomes of the original Berg and Purcell (1977) work, though reformulated to the present completely different context]. We thus expect that our original model, where we assumed that the rate constant was the same regardless of corona coverage, will provide a reasonable description for an extended period of time during corona formation, especially for large particles.

Figure 2. Rate constant for the adsorption of a biomolecule to a particle as a function of the number of biomolecules already adsorbed. The results are presented for three different particle sizes, in inverse form (k0/kn), and the number of biomolecules already adsorbed has been normalised to the total number of adsorption sites, N.
Let us thus, after these initial deliberations, consider the full model. Due to the simplicity of the kinetic scheme, it admits an analytical solution also when the rate constants depend upon the number of already adsorbed biomolecules, n. Thus the solution now reads
Unfortunately, these expressions are numerically not very stable (in particular for larger n and smaller R′/R) and so a numerical integration of the kinetic scheme often seems better.
Figure 3A shows the time-evolution of the number of particles with n = 0, 1, 2, and 3 adsorbed biomolecules for a nanoparticle of radius R = 25 nm and using a biomolecule radius of R′ = 4 nm as done throughout this work (the number of adsorption sites is then around 160). As expected based on the argument above, we observe no major difference in the kinetics compared to when assuming that the rate constant for adsorption is independent of the number of already adsorbed biomolecules (Figure 1A). This depends very much on the fact that the number of adsorbed biomolecules here is low compared to the number of available sites (n = 0, 1, 2, 3 ≪ N ≈ 160). A bit more detailed comparison between the more realistic kinetics considered here and that which results from assuming that the rate constant is independent of the number of already adsorbed biomolecules is given by Supplementary Figure S1.
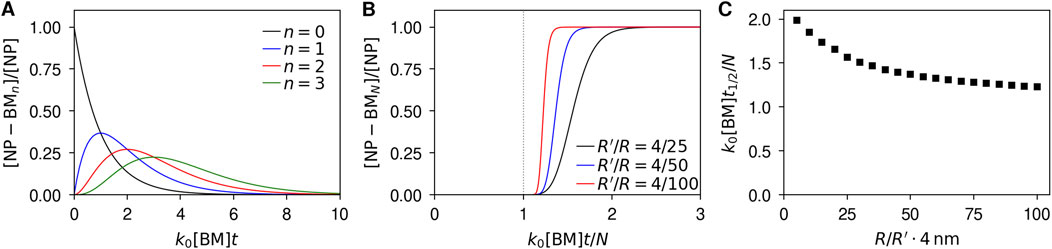
Figure 3. Kinetics of biomolecular corona formation when the rate of adsorption depends on the number of already adsorbed biomolecules. Particle concentrations have been normalised with the total concentration of particles, while time has been rendered dimensionless by multiplying with the rate constant for adsorption to the bare particle, k0, and biomolecular concentration, [BM]. (A) Concentration of particles with 0, 1, 2, and 3 biomolecules adsorbed to them as a function of time for a nanoparticle of radius R = 25 nm and a biomolecule radius of R′ = 4 nm. (B) Concentration of particles fully covered by biomolecules as a function of time and for several different particle sizes. Aside from making time dimensionless, it has been further normalised by the number of adsorption sites, N, so as to present the results on the same scale. Dotted vertical line indicates t = N/k0[BM], the half-time under the assumption that the rate of adsorption is independent of the number of already adsorbed biomolecules (Figure 1B). (C) Half-time as a function of particle size. Half-time is here defined as the time it takes the number of particles with a full corona to reach half of its maximal value, and was divided by the number of adsorption sites, N, as this is the half-time when assuming the rate of adsorption is independent of the number of already adsorbed biomolecules. The results in panels B, C were evaluated by numerical integration, because the analytical solution (Equation 18) is not numerically stable when the number of adsorption sites is large and when considering particles with many adsorbed biomolecules (N ≫ 1 and n ∼ N).
Of more immediate interest to us is the time-evolution of the number of nanoparticles with a full corona, [NP-BMN]. Figure 3B shows the number of such particles as a function of time, normalising time with the number adsorption sites per particle, N. As above (Figure 1B), we observe that the number of particles with a full corona remains negligible for an extended period of time, after which it grows very rapidly and all particles complete their coverage in a short period of time. The larger the particle (relative to a biomolecule) the sharper the transition between no particles with a complete corona and all particles with a complete corona. However, compared to when we assumed that the rate constant was independent of the number of particles already adsorbed (Figure 1B) the time at which the particles become fully covered shifts (most readily illustrated by Supplementary Figure S2).
To quantify this, consider the half-time, t1/2, that is, the time it takes for half of the nanoparticles to have a full corona. When assuming that the rate constant is independent of the number of particles already adsorbed, the half-time is proportional to the number of adsorption sites, N (Figure 1B). Thus, let us consider the half-time divided by the number of adsorption sites, t1/2/N. Figure 3C shows this quantity as a function of particle radius, from which we observe that the shift is fairly moderate, increasing only by a factor of around 1.5 or less for nanoparticles substantially larger than a biomolecule. Thus our final conclusion on the timescale of corona formation remains, at the order of magnitude level, that the corona is completely formed within
Above (in relation to Equation 11) we used this result to estimate that corona formation on nanoparticles of radii R = 25, 50, and 100 nm is complete within a few milliseconds when such nanoparticles are dispersed in cell culture medium containing 10% bovine serum. In doing so, we used a biomolecule concentration estimated based only on the proteins, noting that the concentration would actually be higher if we also consider the lipids, sugars, etc. in the dispersion. A higher concentration would give a consequent decrease in the corona formation time. Overall, we thus conclude that corona formation is, for typical nanoparticle sizes, complete well within a few milliseconds.
Next we consider the composition of the corona and, in particular, how the composition varies particle-by-particle. While many techniques and most studies measure averages over particles, single particle approaches have also been developed, for example, based on electron microscopy (Kelly et al., 2015) or super-resolution fluorescence microscopy (Feiner-Gracia et al., 2017). It is consequently of interest to understand to what extent corona compositions differ among particles.
In doing so, we assume that there are no interactions between the different biomolecules in the corona. This is in line with the general objective of this work, namely, that our results should serve as a baseline against which experimental results can be compared to. Under the assumption that there are no biomolecule-biomolecule interactions, the variability between different particles becomes a combinatorial problem which can be solved analytically. We also assume that the biomolecules in the biological fluid are present in sufficient numbers compared to the biomolecules that actually adsorb, so that we do not have to take into account depletion of a certain biomolecule from the biological fluid.
We consider just two different types of biomolecules, which we may denote type A and type B. Obviously this could represent the situation that the particles were dispersed in a biological fluid only containing two different types of biomolecules. However, our description is equally suitable for a more complex biological fluid, where one is particularly interested in describing a specific biomolecule (say, type A) while not paying particular attention to the identity of all the other biomolecules (type B). Denote the total number of such biomolecules in the dispersion by MA and MB, respectively. Under our stated assumption, both of these numbers are large compared to the total number of biomolecules that actually adsorb to the particles.
Now consider the “first” particle and the number of ways of forming a particle that has adsorbed NA A biomolecules and NB B biomolecules. For the first A biomolecule there are MA biomolecules to choose from, for the second MA − 1, etc., so that in total there are
possibilities. However, since the order of the adsorption is irrelevant, we should reduce this number by the number of permutations of NA objects, so we get
possibilities. If we repeat the same line of reasoning for the B biomolecules we find
different possibilities.
We should now continue by considering the “second” particle, then the “third” and so on (and after all particles have been considered remove particle permutations). However, the combinatorial problem is vastly simplified by our assumption that the number of biomolecules in the dispersion is in excess of the number of biomolecules that adsorb. Under this assumption, the pool of biomolecules is never depleted and the particles become independent of each other. That is, the configuration of one particle does not depend on what the previous particles have adsorbed. Thus the expression above gives the number of possible ways of forming a particle with NA A biomolecules and NB B biomolecules. The assumption that MA and MB are large also allows us to simplify this expression, which, while not crucial, is useful for mathematical expediency. Thus MA − 1 ≈ MA, MA − 2 ≈ MA, … , MA − NA + 1 ≈ MA and similarly for the B biomolecule. We then find that the number of possibilities of forming a particle that has adsorbed NA A biomolecules and NB B biomolecules is approximately
In order to calculate a probability for a particular (NA, NB) configuration, we also need the total number of possible particle configurations. This is given by
Again assuming that MA and MB are large we may simplify this to
We are now ready to calculate the probability, P(NA, NB), of finding a particle with NA A biomolecules and NB B biomolecules. It is given by dividing the above expressions by each other to yield
Alternatively, instead of explicitly calculating the total number of possible particle configurations, one can sum all the possible particle configurations
where we in the first equality have used that NB = N − NA, in the second equality have identified a binomial coefficient, and in the final equality used the binomial theorem; division of the number of possibilities of forming a particle that has adsorbed NA A biomolecules and NB B biomolecules then gives the same expression for the probability (cf. the usage of partition functions, rather than normalised probabilities, in statistical mechanics).
It is useful to translate this to more ‘common’ quantities, rather than the for combinatorics convenient quantities used thus far. We thus let ϕA = MA/(MA + MB) denote the fraction of A biomolecules in the dispersion and likewise let ϕB = MB/(MA + MB) = 1 − ϕA denote the fraction of B biomolecules. We then have
which we may identify with the probability mass function of a binomial distribution with parameters N and ϕA. For particles substantially larger than the biomolecules, the number of adsorption sites, N, is large. We can then use the de Moivre-Laplace approximation to the binomial distribution so that
which is a normal distribution with mean NϕA and variance NϕA × × (1 − ϕA). We thus draw the conclusion that the mean density in the corona is the same as the concentration in the biological fluid, which is of course not unexpected under the stated assumptions. The variance, however, seems less immediately obvious.
To illustrate the results, let us again consider nanoparticles of radii, R = 25, 50, and 100 nm, and the same biomolecule radius R′ = 4 nm used throughout this work. Within our model, the (average) number of biomolecules is governed by ϕA, so to find realistic coronae we have to make a choice of this parameter. Experimentally, though, the number of biomolecules in the corona varies greatly with the biomolecular species so there is no ‘typical’ number. For definiteness, we consider a previous experimental work where the biomolecular corona on polystyrene particles of radius 100 nm was studied using electron microscopy and immunogold labelling (Kelly et al., 2015). When these nanoparticles were exposed to 80% human plasma one observes around 60 transferrin and 60 immunoglobulin G proteins (technically epitopes) in the hard corona in exemplar electron microscopy images. We thus use ϕA = 0.025, 0.05, and 0.1 in our illustration, because the first number indeed results in an average number of A biomolecules of 60 for a particle radius R = 100 nm.
Figure 4 shows shows the distribution of the number of A biomolecules, NA, for these nanoparticle sizes and for the different fractions, ϕA, of A biomolecules. We observe that, for all particle sizes, the more A biomolecules there are in the dispersion, the broader is the distribution. Furthermore, we observe that the width of the distribution is narrower for larger particles, taking into account that a larger particle naturally adsorbs more biomolecules. This is more clearly illustrated by considering the coefficient of variation, that is, the standard deviation of the distribution divided by its mean. Both the binomial distribution (Equation 28) and the normal distribution approximation (Equation 29) gives the coefficient of variation
which indeed exhibits a decrease as a function of particle size (Supplementary Figure S3).
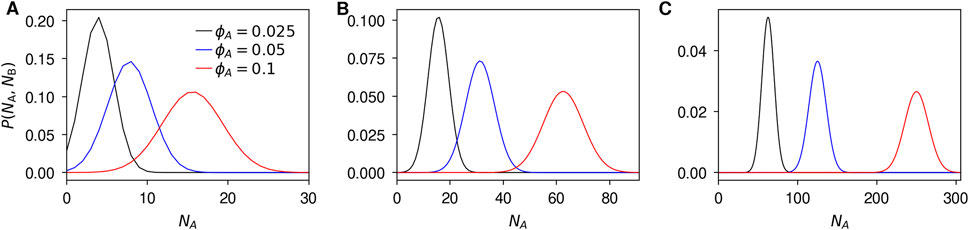
Figure 4. Distribution of the number of A biomolecules in the corona. Particle radius, R, of (A) 25 nm; (B) 50 nm; and (C) 100 nm, and biomolecule radius, R′, of 4 nm. The normal approximation (Equation 29) was used, but the exact results are essentially identical.
While we have derived these results taking into account only the abundance of the biomolecules in the dispersion, we expect that they will remain valid also when the different biomolecules have different affinities for the particle surface, as long as the relevant biomolecules are not depleted from the dispersion. In this case, however, we ought to replace the fraction, ϕA, of A biomolecules in the dispersion with something that takes into account also the affinity, kA, of the A biomolecule to the particle surface. The simplest option would be kAMA/Z, where Z is a normalisation factor to ensure that the probabilities add up to unity.
Finally, we consider how biomolecules are arranged spatially in the particle corona. More specifically, we study the likelihood that two different types of biomolecules are close to each other. In line with the general focus of this work on providing a baseline against which experimental and computational/theoretical results can be compared to, we estimate this likelihood in the absence of any biomolecule-biomolecule interactions. It is perhaps worthwhile to note that experimentally it is, at least in general, not known a priori which biomolecule-biomolecule interactions are present or strong enough to make a difference. Thus one situation where our results could be useful is if it is found experimentally that two biomolecules are often found in close proximity to each other: Is this purely due to chance or should this be interpreted as a biomolecule-biomolecule interaction (or some other mechanism)? The natural reference point is then, indeed, the probability that this happens in the absence of any interactions. Another situation when spatial proximity is of interest is when considering the potential exposure of anomalous epitope combinations (Monopoli et al., 2012; Dawson and Yan, 2021), that is, when two biomolecules expose two different epitopes that are normally not found close together because the biomolecules adsorb close to each other in the corona. What is the likelihood that this happens by chance?
We will thus consider two types of biomolecules, biomolecules of type A and biomolecules of type B, which are present in the corona in some numbers, NA and NB, respectively. There could also be other types of biomolecules in the corona, but they will not affect our considerations. Note that here our starting point is that a given number of biomolecules are present in the corona, so we expect that these considerations will have a wider validity than just a completely random corona composition, as the processes giving the composition have, in a sense, already been included in the starting point. The question we will answer is: What fraction of the NA biomolecules of type A are in the vicinity of one or several of the NB biomolecules of type B? Note that this fraction is, in general, not symmetric in which type of biomolecule is considered A and B. Furthermore, since we are considering the biomolecular corona on a spherical particle, we will consider spatial proximity of the two biomolecules in terms of the geodesic distance on the sphere.
In a previous work (and in a completely different context) we have argued that the fraction, x, of NA objects of type A that are “close” to NB objects of type B, when those objects are put at random into a certain space, is approximately given by Åberg and Robinson (2021)
The main assumption underlying this result is that the probability that an object of one type is close to an object of the other type is independent of the position of all the other objects, which is a good approximation when either type of objects are not too many. The space into which these objects are put is fairly general; in our case it will be the surface of a sphere. The expression is then a good approximation when the number of biomolecules of type A and B on the sphere surface, NA and NB, are not too many. What “close” means is given by the probability, P(ξ), that two objects placed at random into the space are within a given distance, ξ, from each other. The pivotal observation that allows us to progress is that this latter probability may be found from the distribution, f(ρ), of all possible distances, ρ, viz.
The distribution of distances does not depend upon the number of objects, but is a purely geometrical feature of a given space. We have previously derived analytical formulae for the distribution of distances for a few simple geometric shapes (Kelly et al., 2015; Åberg and Robinson, 2021), both in terms of real coordinates but also in terms of projected coordinates, which are sometimes more useful for comparing to experiments (Kelly et al., 2015; Åberg and Robinson, 2021). In our case, we are specifically interested in the distribution of geodesic distances on the sphere, which takes the simple form (Kelly et al., 2015)
This expression is normalised such that its integral over all distances, ρ∈[0,πR], is unity. Insertion of this expression into the probability that two objects are close, P(ξ), then gives
We then find that the fraction of biomolecules of type A that are close to biomolecules of type B in the corona is given by
Now consider the distance, ξ, defining when the two biomolecules objects are “close”. For cases of interest we expect this to be of molecular scale and of the order of the size of the biomolecule, R′. Since we are considering particles much larger than the size of a biomolecule, R′/R ≪ 1, it is consequently consistent to assume ξ/R is small; a Taylor expansion then gives to first non-vanishing order
We observe that the fraction of A biomolecules that are close to B biomolecules is independent of the number, NA, of biomolecules of type A. This is actually an exact result under the stated assumptions, as all previous formulae also share this feature; it will, however, not be the case if the number of objects is many. Furthermore, the fraction of A biomolecules that are close to B biomolecules is directly proportional to the number, NB, of B biomolecules. Finally, in terms of geometry, the fraction of A biomolecules that are close to B biomolecules is directly proportional to the distance, ξ, which defines what ‘close’ means squared, and inversely proportional the radius of the sphere, R, squared. This seems reasonable for a quasi two-dimensional space, though it will be modulated to non-leading order by the finiteness and curvature of the sphere.
To examine the magnitude of the result, let us again consider nanoparticles of radii, R = 25, 50, and 100 nm, and a biomolecule radius of R′ = 4 nm. Furthermore, as a distance of interest, ξ, let us use two biomolecule radii, ξ = 2R’ = 8 nm. The number of biomolecules on the surface clearly depends on the biomolecular species and particle; for definiteness, we again consider polystyrene particles of radius 100 nm exposed to 80% human plasma, for which example electron microscopy images suggest there are around 60 transferrin and immunoglobulin G proteins (technically epitopes) in the corona (Kelly et al., 2015). These numbers correspond to a biomolecule surface density of 5⋅10–4/nm2. We kept this surface density constant and multiplied with the surface area of the particles, resulting in higher numbers of biomolecules on the larger particles. We thus consider a maximum number of B biomolecules of 4, 15, and 65 for a radius of R = 25, 50, and 100 nm.
Figure 5 shows the fraction of A biomolecules that are close to B biomolecules for the three radii and as a function of the number, NB, of B biomolecules. Overall, we observe that the fraction can be quite substantial, reaching numbers as high as 10% – and this is under conditions when the biomolecules occupy just above 2% of the available adsorption sites; for a higher number of biomolecules, this fraction will obviously increase even further. This is an important conclusion from an experimental point of view, as it implies that a substantial proximity of two biomolecules in the corona is not necessarily indicative of interactions or some specific phenomenon.
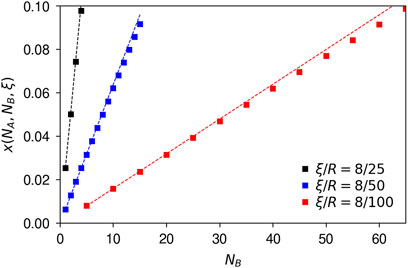
Figure 5. Fraction of A biomolecules close to B biomolecules in the corona. The results are shown for a few different nanoparticle sizes (ξ/R ratios), varying the number of B biomolecules; the results are independent of the number of A biomolecules (as long as the numbers are not too high). (Symbols) Exact results, under the stated assumptions (Equation 35). (Dotted lines) First non-vanishing order approximation (Equation 36). Numerical simulations under the same conditions (Supplementary Figure S4) show that the analytical approximations are very good for these cases.
We also observe from Figure 5 that, for a given number of B biomolecules, the fraction of A biomolecules close to them is substantially higher the smaller the particle, a natural outcome of the fact that, to first non-vanishing order, the fraction scales inversely with the square of the radius of the particle. The figure also shows the roughly linear dependence on the number of B biomolecules.
We have derived these results under the assumption that there are no biomolecule-biomolecule interactions, the idea being that the results are simple enough that they can be used to identify actual examples of biomolecule-biomolecule interactions from experimental data. Once identified, a more detailed description of such cases will, however, has to be done using numerically more complex methods; previous literature has indeed already demonstrated that biomolecule-biomolecule interactions can be incorporated (Vilanova et al., 2016) though not specifically for proximity considerations.
We have presented a “zeroth order” model for the hard biomolecular corona forming on spherical nanoparticles. Our underlying assumptions are that biomolecular adsorption occurs randomly, that adsorption is irreversible, and that there are no biomolecule-biomolecule interactions. These assumptions are fulfilled to varying degrees in real systems. Regardless, our results can serve as a baseline, against which experiments and more realistic and theoretical results can be compared, and we therefore give explicit references to the key equations below. We studied three different aspects of the biomolecular corona: the kinetics of its formation, its variability particle-to-particle, and the spatial proximity of two biomolecules within it.
For the kinetics, we derived an explicit expression for the timescale of complete coverage (Equation 19). This estimate was derived under the assumption that adsorption onto the particle is independent of the number of already adsorbed biomolecules; nevertheless, we showed that it also provides the correct order of magnitude under the more realistic scenario that the adsorption is slower the more adsorbed biomolecules are present. Furthermore, the estimate gets increasingly accurate the larger the particle compared to a biomolecule. In practice, our estimate suggests that corona formation is complete within milliseconds for typical nanoparticle sizes, vastly quicker than typical experimental timescales of minutes or longer.
To estimate the distribution, particle-to-particle, of the number of a certain biomolecule in the corona we assumed that the number of biomolecules is in excess compared to the numbers that adsorb to the particles. Under this assumption we showed that the distribution is a binomial distribution (Equation 28) which can be approximated by a normal distribution (Equation 29) when the particle is substantially larger than the biomolecule.
Finally, as an important question on the spatial organisation of the biomolecular corona, we considered the probability that two biomolecules of the corona would be found in close proximity to each other purely due to chance. We derived an analytical expression (Equation 35) valid as long as the number of the considered biomolecules within the corona are not too many. An interesting outcome is that the probability that two biomolecules are close to each other can become surprisingly large for realistic numbers of biomolecules and particle sizes. A consequence of this is that if it is observed experimentally that two biomolecules are often found close to each other in the corona, this cannot necessarily be interpreted as a result of biomolecule-biomolecule interactions.
Overall, we intend the results derived here to function as reference points to compare future and previous results to. Thereby this work can function as a theoretical framework in further explorations of the many interesting and important aspects of the biomolecular corona.
The original contributions presented in the study are included in the article/Supplementary Material; further inquiries can be directed to the corresponding author.
CÅ: Conceptualization, Formal Analysis, Investigation, Supervision, Writing–original draft. AJ: Investigation, Writing–review and editing.
The authors declare that no financial support was received for the research, authorship, and/or publication of this article.
CÅ acknowledges, with pleasure, many years of stimulating discussions with Prof. K. A. Dawson (University College Dublin, Ireland) on various aspects of the biomolecular corona.
The authors declare that the research was conducted in the absence of any commercial or financial relationships that could be construed as a potential conflict of interest.
CÅ declared that he was an editorial board member of Frontiers, at the time of submission. This had no impact on the peer review process and the final decision.
The authors declare that no Generative AI was used in the creation of this manuscript.
All claims expressed in this article are solely those of the authors and do not necessarily represent those of their affiliated organizations, or those of the publisher, the editors and the reviewers. Any product that may be evaluated in this article, or claim that may be made by its manufacturer, is not guaranteed or endorsed by the publisher.
The Supplementary Material for this article can be found online at: https://www.frontiersin.org/articles/10.3389/fnano.2025.1537076/full#supplementary-material
Åberg, C., and Robinson, A. (2021). Single-molecule localisation microscopy: accounting for chance co-localisation between foci in bacterial cells. Eur. Biophys. J. 50, 941–950. doi:10.1007/s00249-021-01555-z
Anderson, N. L., and Anderson, N. G. (2002). The human plasma proteome. Mol. Cell. Proteomics 1, 845–867. doi:10.1074/mcp.R200007-MCP200
Arfken, G. B., and Weber, H. J. (2001). “Chapter 10 Gamma-factorial function,” in Mathematical methods for physicists (San Diego, California: Academic Press), 631–668.
Armstrong, J. K., Wenby, R. B., Meiselman, H. J., and Fisher, T. C. (2004). The hydrodynamic radii of macromolecules and their effect on red blood cell aggregation. Biophys. J. 87, 4259–4270. doi:10.1529/biophysj.104.047746
Barz, M., Parak, W. J., and Zentel, R. (2024). Concepts and approaches to reduce or avoid protein corona formation on nanoparticles: challenges and opportunities. Adv. Sci. 11, 2402935. doi:10.1002/advs.202402935
Berg, H. C., and Purcell, E. M. (1977). Physics of chemoreception. Biophys. J. 20, 193–219. doi:10.1016/S0006-3495(77)85544-6
Chandrasekhar, S. (1943). Stochastic problems in physics and astronomy. Rev. Mod. Phys. 15, 1–89. doi:10.1103/RevModPhys.15.1
Darabi Sahneh, F., Scoglio, C., and Riviere, J. (2013). Dynamics of nanoparticle-protein corona complex formation: analytical results from population balance equations. PLoS ONE 8, e64690. doi:10.1371/journal.pone.0064690
Dawson, K. A., and Yan, Y. (2021). Current understanding of biological identity at the nanoscale and future prospects. Nat. Nanotechnol. 16, 229–242. doi:10.1038/s41565-021-00860-0
Dell’Orco, D., Lundqvist, M., Oslakovic, C., Cedervall, T., and Linse, S. (2010). Modeling the time evolution of the nanoparticle-protein corona in a body fluid. PLoS ONE 5, e10949. doi:10.1371/journal.pone.0010949
Ding, F., Radic, S., Chen, R., Chen, P., Geitner, N. K., Brown, J. M., et al. (2013). Direct observation of a single nanoparticle–ubiquitin corona formation. Nanoscale 5, 9162–9169. doi:10.1039/C3NR02147E
Evans, D. F., and Wennerström, H. (1999). “Chapter 8 Colloidal stability,” in The colloidal domain: where physics, chemistry, biology, and technology meet (New York: Wiley VCH).
Feiner-Gracia, N., Beck, M., Pujals, S., Tosi, S., Mandal, T., Buske, C., et al. (2017). Super-resolution microscopy unveils dynamic heterogeneities in nanoparticle protein corona. Small 13, 1701631. doi:10.1002/smll.201701631
Friedrichs, S., and Bowman, D. M. (2021). COVID-19 may become nanomedicine’s finest hour yet. Nat. Nanotechnol. 16, 362–364. doi:10.1038/s41565-021-00901-8
Hellstrand, E., Lynch, I., Andersson, A., Drakenberg, T., Dahlbäck, B., Dawson, K. A., et al. (2009). Complete high-density lipoproteins in nanoparticle corona. FEBS J. 276, 3372–3381. doi:10.1111/j.1742-4658.2009.07062.x
A. Jeffrey, D. Zwillinger, I. S. Gradshteyn, and I. M. Ryzhik (2007). “Chapter 8–9 Special functions,” Table of integrals, series, and products (Boston: Academic Press), 859–1048. doi:10.1016/B978-0-08-047111-2.50016-9
Kelly, P. M., Åberg, C., Polo, E., O’Connell, A., Cookman, J., Fallon, J., et al. (2015). Mapping protein binding sites on the biomolecular corona of nanoparticles. Nat. Nanotechnol. 10, 472–479. doi:10.1038/nnano.2015.47
Leslie, H. A., and Depledge, M. H. (2020). Where is the evidence that human exposure to microplastics is safe? Environ. Int. 142, 105807. doi:10.1016/j.envint.2020.105807
Lynch, I., Salvati, A., and Dawson, K. A. (2009). Protein-nanoparticle interactions: what does the cell see? Nat. Nanotechnol. 4, 546–547. doi:10.1038/nnano.2009.248
Milani, S., Baldelli Bombelli, F., Pitek, A. S., Dawson, K. A., and Rädler, J. (2012). Reversible versus irreversible binding of transferrin to polystyrene nanoparticles: soft and hard corona. ACS Nano 6, 2532–2541. doi:10.1021/nn204951s
Minor, M., and van Leeuwen, H. P. (2005). “Chapter 4 Dynamics and kinetics,” in Particulate Colloids. Fundamentals of interface and colloid science. Editor J. Lyklema (Amsterdam, Netherlands: Academic Press), 4.1–4.53. doi:10.1016/S1874-5679(05)80022-4
Mitchell, M. J., Billingsley, M. M., Haley, R. M., Wechsler, M. E., Peppas, N. A., and Langer, R. (2021). Engineering precision nanoparticles for drug delivery. Nat. Rev. Drug Discov. 20, 101–124. doi:10.1038/s41573-020-0090-8
Mitrano, D. M., Wick, P., and Nowack, B. (2021). Placing nanoplastics in the context of global plastic pollution. Nat. Nanotechnol. 16, 491–500. doi:10.1038/s41565-021-00888-2
Monopoli, M. P., Åberg, C., Salvati, A., and Dawson, K. A. (2012). Biomolecular coronas provide the biological identity of nanosized materials. Nat. Nanotechnol. 7, 779–786. doi:10.1038/nnano.2012.207
Moya, C., Escudero, R., Malaspina, D. C., de la Mata, M., Hernández-Saz, J., Faraudo, J., et al. (2019). Insights into preformed human serum albumin corona on iron oxide nanoparticles: structure, effect of particle size, impact on MRI efficiency, and metabolization. ACS Appl. Bio Mat. 2, 3084–3094. doi:10.1021/acsabm.9b00386
Nel, A. E., and Miller, J. F. (2021). Nano-enabled COVID-19 vaccines: meeting the challenges of durable antibody plus cellular immunity and immune escape. ACS Nano 15, 5793–5818. doi:10.1021/acsnano.1c01845
Papafilippou, L., Nicolaou, A., Kendall, A. C., Camacho-Muñoz, D., and Hadjidemetriou, M. (2023). The lipidomic profile of the nanoparticle-biomolecule corona reflects the diversity of plasma lipids. Nanoscale 15, 11038–11051. doi:10.1039/D2NR05982G
Paris, R. B. (2010). “Chapter 8 Incomplete gamma and related functions,” in NIST handbook of mathematical functions. Editors F. W. J. Olver, D. W. Lozier, R. F. Boisvert, and C. W. Clark (Cambridge: Cambridge University Press), 173–192. Available at: https://dlmf.nist.gov/8.
Peters, R., Kramer, E., Oomen, A. G., Herrera Rivera, Z. E., Oegema, G., Tromp, P. C., et al. (2012). Presence of nano-sized silica during in vitro digestion of foods containing silica as a food additive. ACS Nano 6, 2441–2451. doi:10.1021/nn204728k
Power, D., Rouse, I., Poggio, S., Brandt, E., Lopez, H., Lyubartsev, A., et al. (2019). A multiscale model of protein adsorption on a nanoparticle surface. Model. Simul. Mat. Sci. Eng. 27, 084003. doi:10.1088/1361-651X/ab3b6e
Rönkkö, T., Kuuluvainen, H., Karjalainen, P., Keskinen, J., Hillamo, R., Niemi, J. V., et al. (2017). Traffic is a major source of atmospheric nanocluster aerosol. Proc. Natl. Acad. Sci. 114, 7549–7554. doi:10.1073/pnas.1700830114
Rouse, I., and Lobaskin, V. (2021). A hard-sphere model of protein corona formation on spherical and cylindrical nanoparticles. Biophys. J. 120, 4457–4471. doi:10.1016/j.bpj.2021.09.002
Shao, Q., and Hall, C. K. (2016). Protein adsorption on nanoparticles: model development using computer simulation. J. Phys. Condens. Matter 28, 414019. doi:10.1088/0953-8984/28/41/414019
Shoup, D., and Szabo, A. (1982). Role of diffusion in ligand binding to macromolecules and cell-bound receptors. Biophys. J. 40, 33–39. doi:10.1016/S0006-3495(82)84455-X
Soliman, M. G., Martinez-Serra, A., Antonello, G., Dobricic, M., Wilkins, T., Serchi, T., et al. (2024). Understanding the role of biomolecular coronas in human exposure to nanomaterials. Environ. Sci. Nano 11, 4421–4448. doi:10.1039/D4EN00488D
Soloviev, M., Siligardi, G., Roccatano, D., and Ferrari, E. (2022). Modelling the adsorption of proteins to nanoparticles at the solid-liquid interface. J. Colloid Interface Sci. 605, 286–295. doi:10.1016/j.jcis.2021.07.072
van der Meel, R., Sulheim, E., Shi, Y., Kiessling, F., Mulder, W. J. M., and Lammers, T. (2019). Smart cancer nanomedicine. Nat. Nanotechnol. 14, 1007–1017. doi:10.1038/s41565-019-0567-y
Vilanova, O., Mittag, J. J., Kelly, P. M., Milani, S., Dawson, K. A., Rädler, J. O., et al. (2016). Understanding the kinetics of protein–nanoparticle corona formation. ACS Nano 10, 10842–10850. doi:10.1021/acsnano.6b04858
Vilaseca, P., Dawson, K. A., and Franzese, G. (2013). Understanding and modulating the competitive surface-adsorption of proteins through coarse-grained molecular dynamics simulations. Soft Matter 9, 6978–6985. doi:10.1039/C3SM50220A
Vtyurina, N., Åberg, C., and Salvati, A. (2021). Imaging of nanoparticle uptake and kinetics of intracellular trafficking in individual cells. Nanoscale 13, 10436–10446. doi:10.1039/D1NR00901J
Walczyk, D., Baldelli Bombelli, F., Monopoli, M. P., Lynch, I., and Dawson, K. A. (2010). What the cell “sees” in bionanoscience. J. Am. Chem. Soc. 132, 5761–5768. doi:10.1021/ja910675v
Walkey, C. D., and Chan, W. C. W. (2012). Understanding and controlling the interaction of nanomaterials with proteins in a physiological environment. Chem. Soc. Rev. 41, 2780–2799. doi:10.1039/c1cs15233e
Wan, S., Kelly, P. M., Mahon, E., Stöckmann, H., Rudd, P. M., Caruso, F., et al. (2015). The “sweet” side of the protein corona: effects of glycosylation on nanoparticle–cell interactions. ACS Nano 9, 2157–2166. doi:10.1021/nn506060q
Wang, L., Li, J., Pan, J., Jiang, X., Ji, Y., Li, Y., et al. (2013). Revealing the binding structure of the protein corona on gold nanorods using synchrotron radiation-based techniques: understanding the reduced damage in cell membranes. J. Am. Chem. Soc. 135, 17359–17368. doi:10.1021/ja406924v
Westmeier, D., Chen, C., Stauber, R. H., and Docter, D. (2015). The bio-corona and its impact on nanomaterial toxicity. Eur. J. Nanomedicine 7, 153–168. doi:10.1515/ejnm-2015-0018
Yu, S., Perálvarez-Marín, A., Minelli, C., Faraudo, J., Roig, A., and Laromaine, A. (2016). Albumin-coated SPIONs: an experimental and theoretical evaluation of protein conformation, binding affinity and competition with serum proteins. Nanoscale 8, 14393–14405. doi:10.1039/C6NR01732K
Keywords: nanoparticles, biomolecular corona, modelling, kinetics, variability, co-localisation
Citation: Åberg C and Jansen A (2025) Zeroth order model for the nanoparticle biomolecular corona. Front. Nanotechnol. 7:1537076. doi: 10.3389/fnano.2025.1537076
Received: 29 November 2024; Accepted: 03 February 2025;
Published: 18 March 2025.
Edited by:
Giancarlo Franzese, University of Barcelona, SpainReviewed by:
Giorgia Brancolini, National Research Council (CNR), ItalyCopyright © 2025 Åberg and Jansen. This is an open-access article distributed under the terms of the Creative Commons Attribution License (CC BY). The use, distribution or reproduction in other forums is permitted, provided the original author(s) and the copyright owner(s) are credited and that the original publication in this journal is cited, in accordance with accepted academic practice. No use, distribution or reproduction is permitted which does not comply with these terms.
*Correspondence: Christoffer Åberg, Y2hyaXN0b2ZmZXIuYWJlcmdAcnVnLm5s
Disclaimer: All claims expressed in this article are solely those of the authors and do not necessarily represent those of their affiliated organizations, or those of the publisher, the editors and the reviewers. Any product that may be evaluated in this article or claim that may be made by its manufacturer is not guaranteed or endorsed by the publisher.
Research integrity at Frontiers
Learn more about the work of our research integrity team to safeguard the quality of each article we publish.