
94% of researchers rate our articles as excellent or good
Learn more about the work of our research integrity team to safeguard the quality of each article we publish.
Find out more
ORIGINAL RESEARCH article
Front. Nanotechnol., 04 September 2023
Sec. Nanophotonics
Volume 5 - 2023 | https://doi.org/10.3389/fnano.2023.1236810
This article is part of the Research TopicAdvances in Nanotechnology for Bioimaging and Medical Imaging ApplicationsView all 4 articles
 A. Sanna1,2,3*†A. Quarta1†N. Pieroni2B. Parodi4F. Palermo1,2I. Bukreeva2M. Fratini2,5L. Massimi2D. Simeone1X. Le Guével3A. Bravin6,7,8E. Quintiero2I. Viola2G. Gigli1N. Kerlero de Rosbo2,5†L. Sancey3†A. Cedola2†
Introduction: In the study of neurodegenerative diseases, the possibility to follow the fate of specific cells or molecules within the whole body would be a milestone to better understand the complex evolution of disease mechanisms and to monitor the effects of therapies. The techniques available today do not allow the visualization of disease-relevant cells within the whole tridimensional biological context at high spatial resolution.
Methods: Here we show the results from the first validation steps of a novel approach: by combining the conjugate nanobodies anti-glial fibrillary acidic protein (GFAP) and metal-nanoparticles (i.e. 2 nm gold NP) with X-ray phase contrast tomography (XPCT) we would be able to obtain a tridimensional visualization and identification of cells of interest together with the surrounding tissue and the vascular and neuronal networks.
Results: By exploiting the X-ray attenuation properties of metal nanoparticles and the specific targeting capabilities of nanobodies, we could give XPCT the specificity it presently lacks, making it no longer a pure morphological but a molecular and targeted imaging technique. In our case, we synthesized and characterized Gold-NP/GFAP nanobody to target the astrocytes of mouse brain.
Discussion: The results of the first tests presented in this paper have provided us with information on the feasibility of the approach, encouraging us to carry out further experiments in order to achieve the ultimate goal of setting up this new imaging technique.
Neurodegenerative diseases are disorders affecting millions of people around the word. They are characterized by the progressive loss of function and structure of the cells of the central nervous system and present symptoms related to memory, movement, language (Wilson et al., 2023). Currently there is no cure for most of the neurodegenerative diseases and the available therapies are focused on the management of the symptoms and on the improvement of the quality of life for the patients (Arya et al., 2023).
In this context, it is clear that the research and study of the pre-symptomatic states of the disease are crucial to understand its causes and intervene at an early stage. The main imaging methods used for diagnosis of neurodegenerative diseases, including Alzheimer and Parkinson diseases, are MRI and PET, and more rarely CT (Aramadaka et al., 2023).
The visualization and the monitoring (Pavese and Brooks, 2009; Mitchell et al., 2021; Khan et al., 2020; Janeiro et al., 2021) of the cells involved in the disorder is a fundamental request for this kind of studies, and both molecular and targeted imaging represent powerful tools for this aim. Antibody nanoconjugates are a valid targeted imaging probe recently used as novel approach in several diseases (Colombé et al., 2019; Zhao et al., 2022; Samykutty et al., 2023).
Antibodies are often conjugated with nanoparticles (NP) due to their unique features, such as size, high surface/volume ratio and surface chemistry, which can be conveniently manipulated to bind selected biomolecules. Colloidal NPs based on heavy elements, such as gold and gadolinium, are characterized by high X-ray-attenuation properties and have been proposed and tested as biocompatible (Sancey et al., 2015; Broekgaarden et al., 2020) and effective long-circulating contrast agents for X-ray imaging and conventional computed tomography (Schultke et al., 2014; Detappe et al., 2017; Cruje et al., 2021), K-Edge imaging (Riederer and Mistretta, 1977) and in other imaging techniques such as spectral photon counting CT (Kumar et al., 2023a; Moghiseh et al., 2023) and dual photon counting CT (Cademartiri et al., 2023), but also in radiation therapy (Deng et al., 2018) especially for cancer treatment (Kumar et al., 2023b) and for radiation shielding in the radiation protection field (Asadpour et al., 2023).
While monoclonal antibodies (Ab) that target such specific markers have generally been immune reagents of choice, their usefulness for imaging is limited by their large size (atomic mass >150 kDa), which can lead to steric hindrance but also impedes their crossing of the blood-brain barrier (BBB) when imaging the central nervous system. In contrast, nanobodies (Nb) which are single-domain antibodies (sdAbs) are ideally suited for imaging due to their small size enabling them to target antigenic epitopes at locations not easily accessible to conventional antibodies (Li et al., 2016; Belanger et al., 2019). sdAbs are composed of the single heavy chain of antibodies that are expressed uniquely in camelids and lack the light chain. The capability to bind antigen is retained by a 15 kDa molecule that is about 10 times smaller than a full Ab. In contrast to conventional Abs, sdAbs can cross the BBB, not only because of their small size, which allows extensive diffusion within cerebral tissue, but also because they can be tailored to increase their BBB-crossing propensity (adjusted surface charge) (Gao et al., 2021). Such features, together with their stability and rapid clearance from blood, make sdAbs optimal candidates for molecular imaging in brain. Additionally, such small compounds can be administered intranasally for fast and efficient brain targeting, limiting the injected dose but at the same time directing it more effectively to the targeted brain tissue (Pérez-Osorio et al., 2021).
Different techniques such as positron emission tomography (PET), single photon emission computed tomography (SPECT), magnetic resonance imaging (MRI) or computed tomography (CT) have been combined to the use of nanoconjugates, but all of them show limits regarding the spatial resolution and the sensitivity (Loftus et al., 2023). X-ray phase contrast tomography overcomes these limits, enabling a 3D visualization of the entire organ with a spatial resolution ranging from microns to nanometres, permitting the detection of the cells of interest in the physiological and pathological contest (Bukreeva et al., 2017; Cedola et al., 2017). XPCT is able to simultaneously visualize cells, vascular and neuronal systems, together with the surrounding tissue, giving complete information about the morphology and the three-dimensionality of the sample without destroying or compromising it (Topperwien et al., 2018).
However, an important limitation of this technique lies in the impossibility of uniquely identifying the cells visualised, except on a morphological/anatomical basis (Palermo et al., 2020). Combining the Nb-nanoconjugates with the XPCT could represent an incredible boost in the molecular and targeted imaging of neurodegenerative diseases.
In this work, we present the validation of the first steps of our idea: we synthesized and functionalized gold nanoparticles of 2 nm in diameter and conjugated them to a glial fibrillary acidic protein (GFAP) sdAb, creating a new complex we refer to as Nano2. Binding affinity and targeting validation tests were performed, and the efficacy of two administration methods (intravenous and intranasal) was verified in an animal model to choose the one that would lead to greater targeting in the brain. All the experiments were performed on experimental autoimmune encephalomyelitis (EAE) affected mice, to ensure the permeability of the BBB. In this work, images of L-edge subtraction (LES) radiography and K-edge subtraction (KES) tomography are presented, confirming the potential use of this approach for the targeted imaging of brain cells and tissues.
2-nm sized Au nanoparticles were prepared following the procedure reported by Porret et al. (2017). Larger gold nanoparticles were prepared and conjugated to the nanobody, and thanks to the plasmon resonance effect they were used to assay the binding affinity between the conjugated nanoparticle and the antigen. To this aim, citrate coated Au nanoparticles (size: 5.5 nm) were prepared according to the Turkevich approach with slight modifications (Turkevich et al., 1951; Arocikia Jency et al., 2018). In detail, 1.8 mL of 0.010 M HAuCl4 3H2O and 500 µL of 0.010 M sodium citrate were added to 40 mL of ultrapure H2O and stirred for few minutes. Then, 120 µL of freshly prepared 0.10 M NaBH4 were added dropwise to the solution and left under stirring for 2 h. Hereafter, the freshly prepared solution was incubated with an aqueous solution of ɑ-Mercapto-ω-carboxy PEG (5 mM) to exchange citrate with PEG molecules and stirred for additional 2 h. Then, the nanoparticles were thoroughly washed with centrifuge filters to remove excess ligands at 2,000 rcf for at least five times.
From this point on, the two types of Au nanoparticles were derivatized with the same surface chemistry. First, the nanoparticles were coated with a PEG mixture (ɑ-Amino-PEG/ɑ-Amino-ω-carboxy-PEG, molar ratio 10/1) through EDC: an aqueous solution of the PEG mixture (1 mL, 1 mM) was mixed to 1 mL 10 µM nanoparticles prior to add EDC (50 mM). The mixture was left under stirring for 3 h at room temperature. Subsequently, the nanoparticles were washed at 2,000 rcf at least five times by using centrifugal filters. Similarly, Nα,Nα-Bis(carboxymethyl)-L-lysine molecules were anchored to the surface, followed by incubation with NiCl2 100 mM overnight (O.N.).
After being thoroughly washed with ultrapure water through centrifugal filters to remove excess nickel salt, the nanoparticle solution was incubated with the nanobody (molar ratio NP:NB equal to 1:2) O.N. at 4°C. Then, the nanobody-conjugated nanoparticles were washed prior to be used for characterization and biological studies. The nanoparticles were stored at 4°C. The final nanoconjugate was henceforth referred to as Nano2.
TEM images were recorded on a Jem1011 microscope (JEOL Ltd., Tokio, Japan) operating at an accelerating voltage of 100 kVp. A drop of nanoparticle solution was casted onto the carbon-coated grid and let dry before imaging. The size of the nanoparticles as measured by the TEM was estimated by ImageJ Software (Schneider et al., 2012). Electrophoretic characterization was carried out by running the nanoparticles through 1% agarose gel immersed in TBE buffer (pH 8.0) for 1 h at 100 V.
The hydrodynamic diameter (DLS measurements) and the surface charge (Zeta potential measurements) of the nanoparticles were measured by means of a Zetasizer Nano ZS90 (Malvern Instruments, United States) equipped with a 4.0 mW He–Ne laser operating at 633 nm and with an avalanche photodiode detector.
The concentration of AuNPs was estimated via elemental analysis using an Inductively Coupled Plasma Atomic Emission Spectrometer (ICP-AES) Varian 720-ES. A calibration curve of Au was prepared, and the relative amount of metal per sample was estimated upon acidic digestion in HNO3. The Bicinchoninic Acid (BCA) Protein Assay was used to estimate quantitatively the nanobody linked to the nanoparticles. A calibration curve of the nanobody was prepared. UV-vis absorption spectra of the nanoparticles were recorded with a Varian Cary 300 UV-VIS spectrophotometer. Fourier transform infrared (FTIR) spectra were taken with a Perkin Elmer Spectrum One Fourier Transform spectrophotometer (Waltham, MA, United States); each spectrum was ac-quired with 64 scans and a resolution of 4 cm−1. To acquire the spectra, all the samples were dissolved in water and drop casting films were prepared directly on the ATR prism; spectra were collected after water evaporation.
To estimate the binding affinity between the Nano2 and the GFAP antigen, glass substrates were cut from glass microscope cover slides into 15 mm × 15 mm slides that were cleaned in an ultrasonic bath with acetone and isopropanol, followed by plasma oxygen treatment to activate OH groups. Soon after, the slides were immersed in a slightly acidic solution of tiopronin 50 mM and shaken O.N. Then, the solution was removed, the slides washed with ultrapure water prior to being incubated with the GFAP antigen (20 nM in PBS) at 4°C O.N. At the end of the incubation time, the slides were rinsed with PBS and then incubated with BSA (1 mg/mL in PBS for 1 h). Finally, they were washed several times. Control slides coated with BSA and without the antigen were prepared as well.
In the binding test two types of nanoparticles, both Nb-conjugated nanoparticles and AuNPs (without the nanobody, simply coated by PEG) were assayed on the glass slides to assess the affinity between the conjugated nanobody and the antigen as compared to the unconjugated AuNP.
The nanoparticles solutions (either Au-Nb or Au-PEG, 10 nM in PBS) were added to the slices and left under stirring for 1 h, at 4°C. Then, the solution was removed and the slides were analyzed accordingly.
Transmission spectra of the glass slides at normal incidence were measured in air with a spectrometer (Ava Spec HS TEC) before and after the functionalization. Spectra were registered in the range 400–800 nm, integration 100 ms, 10 averages, using glass as the reference.
Optical setup: the light coming from the Tungsten lamp (100 W) was collected to the optical fiber (727-733-2447, Ocean Optics) through a monochromator, then hits the sample and was sent to the spectrometer input port by another optical fiber (M38 L02 Thorlabs) with a 200-μm core diameter.
Astrocyte staining was performed on 4-8 µm brain sections using anti-Glast antibody coupled to PE (anti-GLAST Polyclonal antibody (Invitrogen #PA5-72895, 1:250, 1 h, RT) and anti-Rabbit IgG (H + L)-AF555 (Invitrogen, #P-2771MP, 5 µg/mL, 1 h, RT), to label the astrocytes. Fluorescence microscopy was performed on a Carl Zeiss LSM710 laser confocal microscope, using a plan-Apochromat 60x NA 1.4 oil-immersion objective and an APD detector (λexc.=405 nm, λem. = 736 nm long pass filter for Au detection, and λexc.=543 nm, λem. = 550–600 nm for PE detection).
To enhance the BBB crossing by the Nano2, the mice used in this study were induced to develop experimental autoimmune encephalomyelitis, a murine model of multiple sclerosis presenting an altered BBB. This alteration, in turn, increases the permeability of the barrier and allows the crossing. Female C57BL/6 J mice (n = 14), 6–8 weeks old, weighing 18.5 g ± 0.8 g purchased from Harlan Italy, were immunized by subcutaneous injection (200 mL total) at two sites in the flank with an emulsion of 200 mg myelin oligodendrocyte glycoprotein peptide 35–55 (Espikem) in incomplete Freund adjuvant (Difco) containing 600 mg Mycobacterium tuberculosis (strain H37Ra; Difco). The mice were injected (100 mL total) in the tail vein with 400 ng pertussis toxin (Sigma-Aldrich) immediately and 48 h after immunization.
Either unconjugated AuNPs or Nano2 were administered in-vivo either by i) intranasal (n = 6) or by ii) intravenous routes (n = 6) or ex-vivo locally in the cerebellum for the positive control. The mice were sacrificed by CO2 inhalation and brains were extracted at 1 (n = 2 per condition, with better accumulations) and 24 h (n = 1) after administration. Samples designated to the XPCT measurements were dehydrated through a graded ethanol series (70/95/100%, 30 min for each step), put in propylene oxide, and included in paraffin. Samples designated to the confocal microscopy and X-ray LES/KES experiments were fixed in 4% paraformaldehyde for 24 h, then stored in 70% ethanol. Samples designated to the confocal microscopy were cut in the axial plan at different levels to obtain 3 to 5 sections per hemisphere. All animals were housed in pathogen-free conditions and treated according to the Italian and European guidelines (Decreto Legislativo 4 marzo 2014, n. 26, legislative transposition of Directive 2010/63/EU of the European Parliament and of the Council of 22 September 2010 on the protection of animals used for scientific purposes), with food and water ad libitum. The research protocol was approved by the Ethical Committee for Animal Experimentation of the University of Genoa (Prot. 319).
The L-edge subtraction radiography experiment was performed at SYRMEP beamline at ELETTRA synchrotron in Trieste, Italy. The experiment was carried out with a monochromatic incident beam at two energies, above and below the L-edge of the gold (11.9 keV), respectively. The effective pixel size of the detector was 1.98 µm.
The K-edge subtraction tomography experiment was performed at the medical beamline ID17 of ESRF (European Synchrotron Radiation Facility, Grenoble, France).
A monochromatic incident X-ray beam with two different energies bracketing the K-edge of the gold (80.7 keV) was used. The effective pixel size of the detector was 3.05 µm. The total number of projections was 3500 over 180°.
The images from the X-ray experiments were co-registered/compared to confocal microscopy images acquired on the same samples. In details, confocal Z-stack microscopy (Olympus FV1000), in reflection mode, by using a 405 nm-excitation laser line, a dichroic mirror DM405/488 and with a Z-resolution up to 200 nm was used. The individuation of Nano2 clusters was obtained by performing spatially resolved photoluminescence (SR-PL) spectra during the confocal scanning.
Tetrachloroauric (III) acid trihydrate 99.5% (HAuCl4, 3 H2O), sodium borohydride 98% (NaBH4), Nα,Nα-Bis(carboxymethyl)-L-lysine hydrate, sodium citrate, reduced glutathione (GSH), 1-Ethyl-3-(3ʹ-dimethylaminopropyl)carbodiimide Hydrochloride (EDC) and Nickel Chloride (NiCl2) were purchased from Sigma-Aldrich. GFAP human was purchased from US Biological. ɑ-Mercapto-ω-carboxy PEG (MW. 3,000 Da) and ɑ-Amino-ω-carboxy PEG hydrochloride (MW. 3,000 Da) were purchased from Rapp Polymere. Anti-GFAP nanobody was kindly provided by Dr. Pierre Lafaye from Institut Pasteur, Paris.
Figures 1, 4 were made using Biorender.com and kindly provided by Dr Jean-Luc Coll from Institute for Advanced Biosciences, Grenoble.
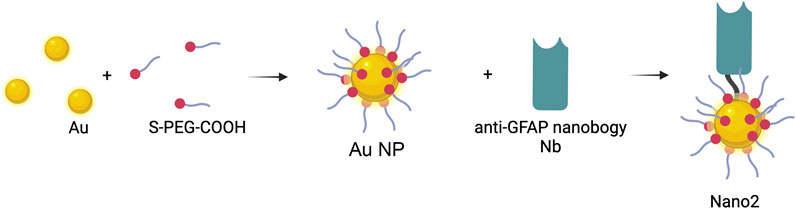
FIGURE 1. Pictorial representation of the Nano2 building blocks. Created with Biorender.com.
The surface of the ultrasmall AuNPs was first passivated with a PEG shell and then coated with Nα, Nα-Bis(carboxymethyl)-L-lysine (Figure 1). The nickel coordination chemistry was used to bind the anti-GFAP nanobodies, bearing a histidine tag (Perruchini et al., 2009). The average number of nanobodies linked per nanoparticle was kept close to 1 in order to associate each nanoparticle to a single bio-targeting unit. The final nanoconjugate was henceforth referred to as Nano2.
Table 1 reports the size (as determined by TEM and DLS measurements), the surface charge of the nanoparticles before and after conjugation of the nanobody, and the number of nanobodies linked per nanoparticle (estimated by BCA assay). Furthermore, Figure 2 shows the TEM image of the PEG-coated NPs, the size distribution curves and the gel electrophoretic migration of the nanoparticles with and without the nanobody attached. The DLS curve and the migration pattern confirm that the conjugation of the anti-GFAP nanobody led to a slight increase of the overall size of the nanoparticles (from 11.28 ± 0.56 to 13.97 ± 0.79 nm).
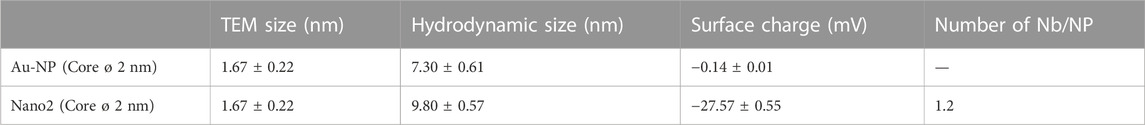
TABLE 1. Characteristics of the gold nanoparticles prior and after conjugation of the nanobody.
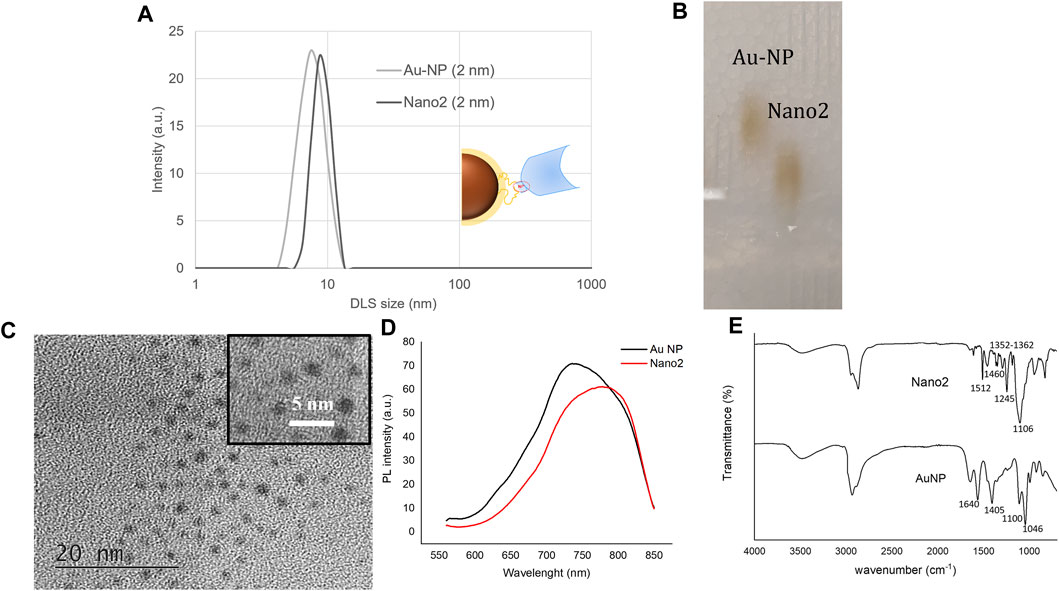
FIGURE 2. (A) Hydrodynamic diameter and (B) electrophoretic mobility of Au NP and Nano2. (C) TEM image of the 2 nm-sized Au NP; (D) Luminescence spectra of Au NP and Nano2, respectively. The Hydrodynamic measures were acquired using a Zetasizer Nano ZS90 Malvern, while a Jeol JEM 1400 and a Cary Eclipse were used for TEM and fluorescence analysis; (E) FTIR spectra of AuNP and Nano2, respectively.
FTIR measures were performed to confirm the attachment of the nanobody to the nanoparticles. Thus, the starting PEG-coated and the nanobody-conjugated nanoparticles were analyzed and compared. The spectra reported in Figure 2E show the typical peaks of the lipoic acid-PEG carboxy acid (Jin-Hwa et al., 2008) that coats the AuNP. Indeed, the signals at 1,046 and 1,100 cm−1 are due to the C-O stretching of the PEG chain, while at 1,405 the bending frequency of the O-H group of carboxylic acid can be observed. The vibrations at 1,565 and 1,640 cm−1 can be assigned to C-N stretching and N-H bending, respectively, of the amide group of the lipoic acid anchored to the gold surface. The FTIR spectrum of Nano2 shows more peaks due to the vibrations of the side groups of the aminoacids of the nanobody (Barth, 2000). The aminoacids sequence and the CDR domains of the nanobody are reported in Perruchini et al. (2009). The strong peak at 1,106 cm−1 is likely due to the C-H bending and the C-N stretching of Histidine, respectively. The signal at 1,245 cm−1 is typical of C-N stretching of Glutamine and Arginine, while the peaks at 1,352 and 1,362 cm−1 belong to the C-N stretching and C-H bending vibration (CH) of the benzene ring of Trypthophan. The signal at 1,460 cm−1 can be assigned to the C-H bending of Phenylalanine, while the sharp peak at 1,512 cm−1 can be related to the C-C stretching and C-H bending CH of the aromatic ring of Tyrosine respectively.
Furthermore, the luminescence spectra of the nanoparticles before and after the nanobody binding were recorded. As shown in Figure 2D, the luminescence peak shifts from 738 nm to 778 nm and the whole curve looks broadened upon nanobody conjugation. The photoluminescence (PL) intensity is also reduced, likely due to energy transfer processes between the Au surface and the nanobody, as already described (Huang et al., 2018).
The binding specificity of Nano2 to its biological target, the cytoplasmic protein GFAP, was extensively evaluated. To this aim, a simple optical device based on plasmonic localized surface plasmon resonance (LSPR) detection was setup (Tokel et al., 2014). The measure is based on the local change of the dielectric environment on the metal nanostructure surface (Miller and Lazarides, 2005). Since the 2 nm-sized gold nanoparticles used throughout this study do not display a plasmon peak due to their small size, larger Au nanoparticles (5.5 nm sized, Abs peak at 525 nm) functionalized with the same chemistry and conjugated to the anti-GFAP nanobody were prepared and characterized.
Supplementary Table S1; Supplementary Figure S1 report the main physicochemical characterization of the NPs. In detail, glass slides functionalized with the GFAP antigen were incubated with Nano2 (10 nM) for 1 h (sample 1). To evaluate the specific binding between the antigen and Nano2, three other interfaces were analyzed in parallel: glass slide functionalized with GFAP antigen and incubated with 5.5 nm AuNPs (sample 2), and glass slides coated with BSA and incubated with either Nano2 (sample 3) or AuNPs (sample 4), respectively. The extinction curves of the glass slides upon incubation were collected and analyzed. Figure 3 reports the plasmon peaks of the samples showing that a red-shift (around 10 nm) is detected only in sample 1, likely due to the establishment of specific interactions between Nano2 and the immobilized antigen. Finally, the signal to noise ratio was estimated to be 12 times higher in sample 1 than in sample 3.
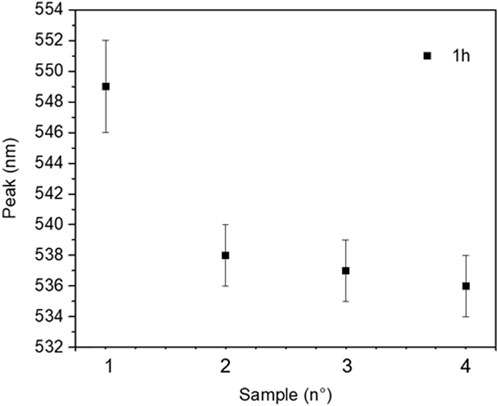
FIGURE 3. Au plasmon peak of Nano2 at glass-GFAP (sample 1), Au-NPs at glass-GFAP (sample 2), Nano2 at glass-BSA (sample 3), AuNPs at glass-BSA (sample 4) after 1 h incubation.
We tested two different administration routes of Nano2 in order to find the one leading to the best diffusion and highest retention in the brain. We also compared the NPs and the Nano2 distributions. To facilitate the crossing of Nano2 through the brain, we tested Nano2 in a mouse model of multiple sclerosis, experimental autoimmune encephalomyelitis, characterized by BBB disruption resulting from neuroinflammation. Experimentally, either unconjugated AuNPs or Nano2 were administered in-vivo either by 1) intranasal (IN) or by 2) intravenous (IV) routes or ex-vivo locally in the cerebellum for the positive control (CTRL+). For the positive control, naïve mice with intact BBB were used. Figure 4 summarizes the analyzed samples. Names of the mice groups are reported in Figure 4B.
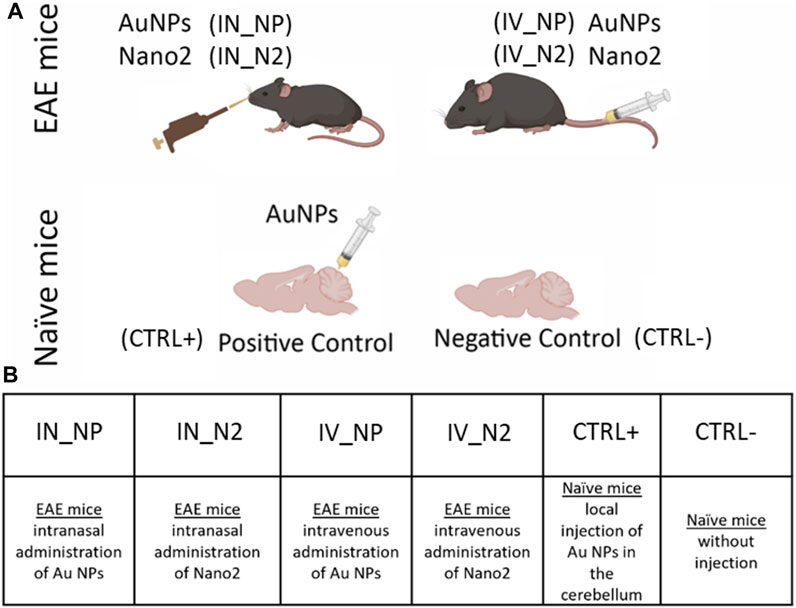
FIGURE 4. The different groups of analyzed mice: (A) The different routes of administration; (B) Details of the groups. Created with Biorender.com.
After the administration of the compounds, brains isolated from the euthanized mice were dissected into two parts: one hemisphere was imaged with LES and KES experiments, the other was analyzed by confocal microscopy. The fluorescence of the AuNPs was mapped in red on sections in which cell nuclei were marked in blue. In control conditions, only 3 sections were observed, while in presence of AuNCs (alone or coupled to the nanobody) more than 5 sections were observed. The AuNCs were mainly localized in a restricted area close to the cerebellum, the hypothalamus and first third of the lower part of the brain.
Intranasal administration of Nano2 displayed higher retention in the brain than intravenous injection of Nano2, as shown in Figures 5A, B. After intravenous administration, we managed to find AuNCs on only 1 or 2 sections at 1 specific part, while they were always presented and diffused after IN administration.
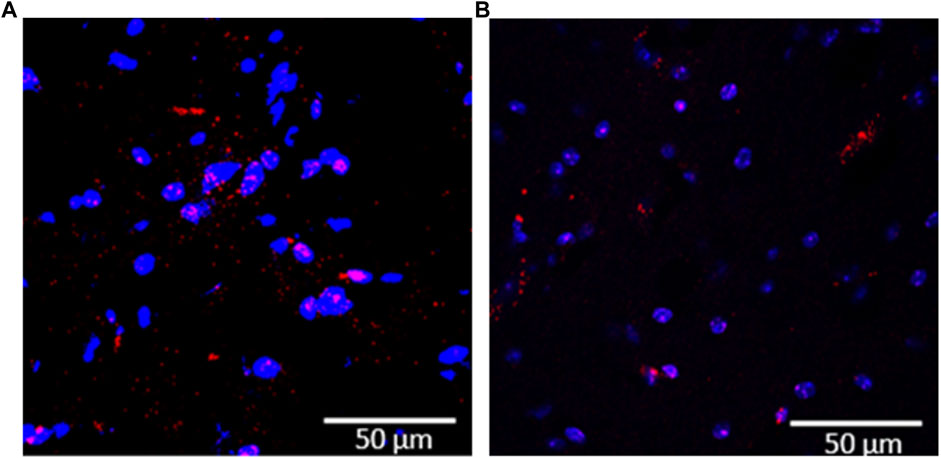
FIGURE 5. Confocal imaging of brain sections from EAE mice. Comparison between intranasal (A) and intravenous (B) administration of Nano2 in the brain. Fluorescence of the AuNPs in red, cells nuclei in blue.
Furthermore, the comparison between intranasal administration of Nano2 and unconjugated NPs (Figures 6A, B respectively) indicated a greatest retention of Nano2 in the brain sections versus unconjugated NPs. NPs alone were very rarely observed in the different sections, regardless of the intranasal or intravenous administration route (Figure 6 and data not shown).

FIGURE 6. Confocal imaging of brain sections from EAE mice. Comparison between intranasal administration of (A) unconjugated NPs and (B) Nano2. Fluorescence of the AuNPs in red, cells nuclei in blue.
The correct targeting of the astrocytes by Nano2 was validated on brain sections by confocal fluorescence microscopy. The specific AuNPs used in this study are ultra-small NP that naturally emit a tunable fluorescent signal, allowing their detection by confocal fluorescence (Porret et al., 2017). Therefore, by detecting the Au, the anti-astrocyte monoclonal antibody was detected, and thus, the astrocytes could be identified.
In order to verify the targeting capacity of the Nano2, we analyzed the brains of IN_N2 mice, i.e., mice administered with Nano2 intranasally, by confocal microscopy using anti-Glast Nb to mark the astrocytes, as reported in Figure 7. Nano2 were detected in the brain sections due to the presence of the AuNPs which are fluorescent in the near infrared optical region after blue light excitation. Colocalizations between Nano2 and Glast-expressing cells were observed after intranasal administration of Nano2, thus indicating the possibility of specifically targeting the astrocytes In the Figure 7 fluorescence of the AuNPs is shown in red, astrocytes in green and the arrows indicate the colocalization between Nano2 and Glast-expressing cells.
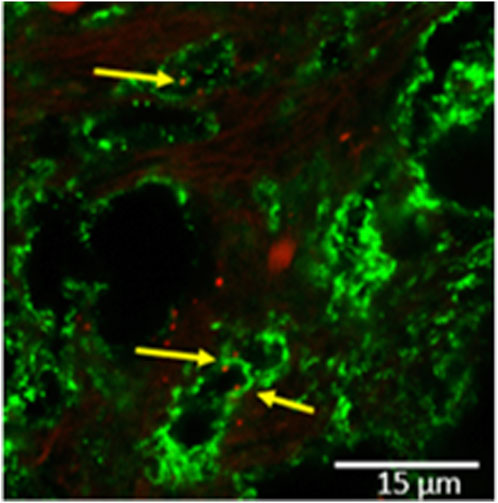
FIGURE 7. Confocal imaging of brain sections from EAE mice of a IN_N2—anti-Glast immunolabelling, the arrows indicate colocalization between Nano2 and Glast-expressing cells. Fluorescence of the AuNPs in red, astrocytes in green.
The final goal of our research is to combine the use of Nano2 and XPCT to obtain a tomographic volume in which, thanks to the detection of the metal nanoparticles, we could be able to identify cells of interest together with the surrounding tissue and the neuronal and vascular networks. In this work we show the results from a previous step of the X-ray imaging: L-edge subtraction radiography and K-edge subtraction tomography.
The two experiments were performed on IN_N2 samples (intranasal administration on Nano2).
LES radiography experiment was carried out above and below the gold (Au) L-absorption-edge (11.9 keV) to highlight the AuNPs with respect to the surrounding tissues.
By subtracting from the image acquired below the one acquired above the edge, we obtain a third image in which the signal from Au is highlighted with respect to all the other details. Figure 8A shows the result obtained after the subtraction; the yellow arrows indicate white spots of signal from Au that therefore likely represent clusters of Nano2. Figure 8B reports the result of confocal microscopy of the same area as in Figure 8A. The arrows indicate the points where the PL emission of Au is significant. The co-registration of the X-ray imaging and the Au emission, shown in Figure 8C, demonstrates the specific accumulation of Nano2 clusters, as indicated by the arrows in Figure 8C.
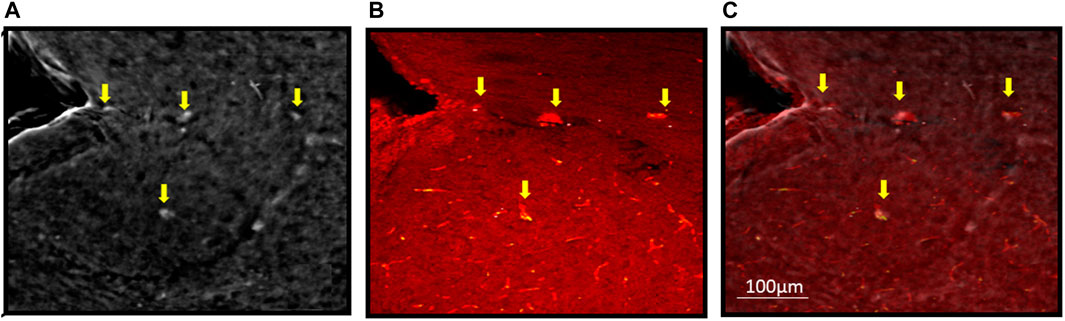
FIGURE 8. XPCT image and co-registration with confocal microscopy image of a brain from a IN_N2 mouse (A) X-ray phase contrast radiography (XPCR), the image is obtained by subtracting an image acquired just above and one just below the L-edge of Au (Supplementary Figure S2). The arrows indicate possible Nano2 accumulations; (B) Confocal microscopy image, in reflection mode of the same slice in Figure (A). The arrows indicate the points with Au significant emission signal; (C) Co-registration of (A) and (B) where the arrows indicate possible Nano2 accumulations, for the co-registration the software ImageJ was used, scale bar: 100 µm.
KES tomography experiment was performed above and below the gold K-edge (80.7 keV). Images in Figure 9A show the presence of elements compatible with Nano2 (white spots) close to the vessels (black); the comparison with the Z-stack confocal microscopy images (B) from the other hemisphere of the same sample supports this interpretation; in fact, in Figure 9B, the Au emission signal is clearly visible near the vessels. In Figure 10, a 3D rendering of a volume from a IN_N2 mouse shows the spatial distribution of the Nano2 clusters (yellow) along the blood vessels (red).
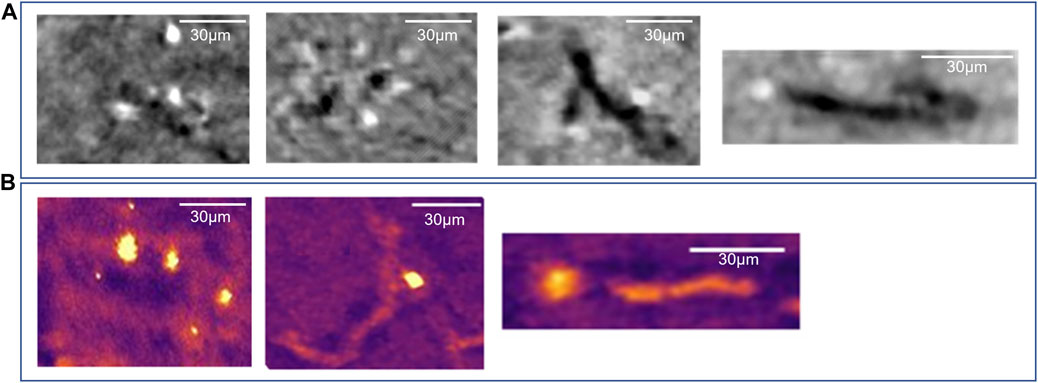
FIGURE 9. Vessels cross sections of a IN_N2 mouse. (A) Tomographic Au-K-edge Subtraction images. (B) Confocal microscopy images. In the color scale the yellow corresponds to the Au emission signal. Scale bar: 30 µm.
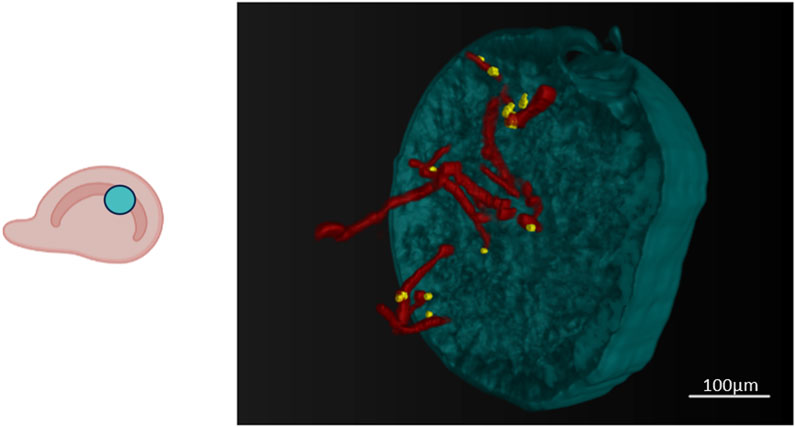
FIGURE 10. 3D rendering of a K-Edge subtraction volume from an intranasally administrated sample (IN_N2). Nano2 clusters (yellow) appear near the blood vessels (red). The experiment was performed at the ID17 beamline of the ESRF (Grenoble, France) using two different energies, bracketing the K-edge of the gold, with a voxel size of about 3 µm. Scale bar: 100 µm.
X-ray phase contrast tomography enables non-destructive multi-scale 3D biomedical imaging of neuronal and vascular networks. It can be applied on fields of view ranging from the single cell to the full brain, without the need for slicing or intense pre-processing the tissues; this so-called 3D “virtual histology” of low-absorbing biological samples is a major achievement of XPCT and it is a fundamental characteristic for the study of neurodegenerative diseases. However, a crucial challenge for this technique is the ability to univocally identify and label the specific cells of interest. The idea underlying this work, based on XPCT imaging of cells labelled with metal nanoparticles and a single-domain antibody, addresses this specific issue to enrich the otherwise merely morphological 3D tomography phase contrast imaging with tissue-specificity. In particular, what we would obtain from this innovative approach is a high-resolution imaged volume in which we are able to visualize the vascular and neuronal systems, the surrounding tissue and cells, thus being able to identify the latter with certainty thanks to the presence of the nanobody and without compromising the integrity of the sample or its physiological state. Other imaging techniques exploit the characteristics of metal nanoparticles, think, for example, of the innovative spectral photon counting CT able to improve the accuracy and the capabilities of the conventional CT distinguishing different materials with similar X-ray attenuation properties. One of the winning weapons of the XPCT, however, is its resolution, which can be as low as a few nanometers. This characteristic together with the ability to visualize soft tissues and their internal features in a non-destructive way, make XPCT a powerful technique in the biomedical imaging field.
In this work, we have functionalized gold nanoparticles and conjugated them to sdAbs (nanobodies), the as defined Nano2 complex. Transmission spectra measured in air with a spectrometer confirmed the binding affinity between Nano2 and the GFAP antigen. The conjugation parameters were adjusted in order to reach the 1:1 binding ratio between each nanoparticle and the nanobody. In addition, stability tests of the nanoparticles were performed by dissolving the samples (with and without the nanobody) in physiological saline solution (0.9% NaCl) and in 10% FBS cell culture medium. The samples were kept under incubation at 37°C up to 5 days. Then, the average hydrodynamic diameter and the migration pattern on the agarose gel were evaluated.
The results reported in Supplementary Figure S3 show that the nanoparticles are extremely stable upon visual analysis of the tubes at each incubation point (time 0, 1, and 5 days). The gel electrophoresis pattern after 5 days incubation indicates that both in saline solution and cell medium there is a slight slowering of the migration bands of the nanoparticles (both with and without the nanobody). Finally, the DLS analysis confirms the optimal stability of the samples in the tested conditions. Indeed, there is a just modest enlargement of the size of both types of particles upon incubation in culture media, likely due to the adsorption of small molecules/proteins. Two administration routes were examined (intranasal and intravenous), to establish that one enabling better brain targeting. Confocal measurement showed a higher retention of the nanoconjugate in the brain upon intranasal administration. Indeed, after intravenous administration AuNCs were found on only 1 or 2 sections at 1 specific part, while they were always presented and diffused after IN administration the test also displayed a greater retention of Nano2 than unconjugated nanoparticles. To test the targeting of the astrocytes, confocal microscopy using anti-Glast Nb was performed and some colocalizations of Nano2 and Glast-expressing cells were observed after intranasal administration of Nano2.
We performed two X-ray imaging experiments, by LES radiography and KES tomography, respectively. The co-registration and the comparison of the images from these two experiments with those from the confocal microscopy on the same samples confirmed the presence of gold in the brain, specifically near the blood vessels, where astrocytes are known to be present. The distribution of Nano2 is clearly visible also in the 3D-rendering of the KES tomography volume.
All the information and the results coming from this work gave us the confirmation that this new imaging modality could lead to significant developments in the field of transpathology and preclinical studies, prompting us to pursue and carry out more experiments. The final objective will be to implement XPCT measurements to obtain detailed tissue information in physiological and pathological conditions and molecular data with a single scan, all at a resolution of the order of microns, without mechanically altering the sample.
In this work, we presented the first results of a new imaging approach that could be of great interest in the context of preclinical studies on neurodegenerative diseases, which require to detect specific neuropathological signatures and to follow the effects of therapies at the cellular level. The combination of Nb-nanoconjugates and XPCT would enable to reliably identify the cells of interest within their morphological context, providing three-dimensional information and preserving the integrity of the sample. Using different antibodies, it will then be possible to follow several cell populations simultaneously.
The raw data supporting the conclusion of this article will be made available by the authors, without undue reservation.
The animal study was approved by the Ethical 519 Committee for Animal Experimentation of the University of Genoa (Prot. 319). The study was conducted in accordance with the local legislation and institutional requirements.
AS, AC, LS, AQ, and NR conceived and designed the experiments. AS, AQ, and LS performed the data analysis. AS, AC, LS, AQ, and AB participated to the discussion of the results and wrote the manuscript. FP, NP, AS, MF, EQ, IV, IB, LM, and AB performed the experiments. BP, XL, and DS prepared the samples. GG contributed to the data interpretation. All authors contributed to the article and approved the submitted version.
The authors are grateful to Dr. Lafaye from Institut Pasteur for supplying the anti-GFAP nanobody. Authors acknowledge ELETTRA for provision of synchrotron radiation facilities. Authors acknowledge the ESRF for provision of synchrotron radiation facilities through proposal LS-3016 performed at the ID17 beamline.
The authors declare that the research was conducted in the absence of any commercial or financial relationships that could be construed as a potential conflict of interest.
All claims expressed in this article are solely those of the authors and do not necessarily represent those of their affiliated organizations, or those of the publisher, the editors and the reviewers. Any product that may be evaluated in this article, or claim that may be made by its manufacturer, is not guaranteed or endorsed by the publisher.
The Supplementary Material for this article can be found online at: https://www.frontiersin.org/articles/10.3389/fnano.2023.1236810/full#supplementary-material
Ab, antibody; BBB, blood brain barrier; CNS, central nervous system; CT, computed tomography; EAE, experimental autoimmune encephalomyelitis; GFAP, glial fibrillary acidic protein; IH-XPCT, immunohisto-x-ray phase contrast tomography; KES, K-edge subtraction; LES, L-edge subtraction; MRI, magnetic resonance imaging; NB, nanobody; NN, neuronal network; NP, nanoparticle; ON, overnight; PL, photoluminescent; SR-PL, spatially resolved photoluminescence; VN, vascular network; XPCI, x-ray phase contrast imaging; XPCR, x-ray phase contrast radiography; XPCT, x-ray phase contrast tomography.
Aramadaka, S., Mannam, R., Sankara Narayanan, R., Bansal, A., Yanamaladoddi, V. R., Sarvepalli, S. S., et al. (2023). Neuroimaging in alzheimer's disease for early diagnosis: a comprehensive review. Cureus 15 (5), e38544. doi:10.7759/cureus.38544
Arocikia Jency, D., Parimaladevi, R., Vasant Sathe, G., and Umadevi, M. (2018). Glutathione functionalized gold nanoparticles as efficient surface enhanced Raman scattering substrate for poly chlorinated biphenyl detection. J. Clust. Sci. 29, 281–287. doi:10.1007/s10876-017-1323-9
Arya, A. D., Verma, S. S., Chakarabarti, P., Chakrabarti, T., Elngar, A. A., Kamali, A. M., et al. (2023). A systematic review on machine learning and deep learning techniques in the effective diagnosis of Alzheimer’s disease. Brain Inf. 10, 17. doi:10.1186/s40708-023-00195-7
Asadpour, N., Malekzadeh, R., Rajabpour, S., Refahi, S., Mehnati, P., and Shanei, A. (2023). Shielding performance of multi-metal nanoparticle composites for diagnostic radiology: aan MCNPX and Geant4 study. Radiol. Phys. Technol. 16, 57–68. doi:10.1007/s12194-022-00690-2
Barth, A. (2000). The infrared absorption of amino acid side chains. Prog. Biophys. Mol. Biol. 74 (3-5), 141–173. doi:10.1016/s0079-6107(00)00021-3
Belanger, K., Iqbal, U., Tanha, J., MacKenzie, R., Moreno, M., and Stanimirovic, D. (2019). Single-domain antibodies as therapeutic and imaging agents for the treatment of CNS diseases. Antibodies (Basel) 8, 27. doi:10.3390/antib8020027
Broekgaarden, M., Bulin, A. L., Porret, E., Musnier, B., Chovelon, B., Ravelet, C., et al. (2020). Surface functionalization of gold nanoclusters with arginine: aa trade-off between microtumor uptake and radiotherapy enhancement. Nanoscale 12, 6959–6963. doi:10.1039/d0nr01138j
Bukreeva, I., Campi, G., Fratini, M., Spano, R., Bucci, D., Battaglia, G., et al. (2017). Quantitative 3D investigation of Neuronal network in mouse spinal cord model. Sci. Rep. 7, 41054. doi:10.1038/srep41054
Cademartiri, F., Meloni, A., Pistoia, L., Degiorgi, G., Clemente, A., Gori, C. D., et al. (2023). Dual-source photon-counting computed tomography—Part I: cclinical overview of cardiac CT and coronary CT angiography applications. J. Clin. Med. 12, 3627. doi:10.3390/jcm12113627
Cedola, A., Bravin, A., Bukreeva, I., Fratini, M., Pacureanu, A., Mittone, A., et al. (2017). X-ray phase contrast tomography reveals early vascular alterations and neuronal loss in a multiple sclerosis model. Sci. Rep. 7, 5890. doi:10.1038/s41598-017-06251-7
Colombé, C., Le Guével, X., Martin-Serrano, A., Henry, M., Porret, E., Comby-Zerbino, C., et al. (2019). Gold nanoclusters as a contrast agent for image-guided surgery of head and neck tumors. Nanomedicine 20, 102011. doi:10.1016/j.nano.2019.04.014
Cruje, C., Dunmore-Buyze, P. J., Grolman, E., Holdsworth, D. W., Gillies, E. R., and Drangova, M. (2021). PEG-modified gadolinium nanoparticles as contrast agents for in vivo micro-CT. Sci. Rep. 11, 16603. doi:10.1038/s41598-021-95716-x
Deng, Y., Tian, X., Lu, S., Xie, M., Hu, H., Zhang, R., et al. (2018). Fabrication of multifoliate PtRu bimetallic nanocomplexes for computed tomography imaging and enhanced synergistic thermoradiotherapy. ACS Appl. Mat. Interfaces 10 (37), 31106–31113. doi:10.1021/acsami.8b11507
Detappe, A., Thomas, E., Tibbitt, M. W., Kunjachan, S., Zavidij, O., Parnandi, N., et al. (2017). Ultrasmall silica-based bismuth gadolinium nanoparticles for dual magnetic resonance-computed tomography image guided radiation therapy. Nano Lett. 17, 1733–1740. doi:10.1021/acs.nanolett.6b05055
Gao, Y., Zhu, J., and Lu, H. (2021). Single domain antibody-based vectors in the delivery of biologics across the blood-brain barrier: aa review. Drug Deliv. Transl. Res. 11, 1818–1828. doi:10.1007/s13346-020-00873-7
Huang, Y., Fuksman, L., and Zheng, J. (2018). Luminescence mechanisms of ultrasmall gold nanoparticles. Dalton Trans. 47, 6267–6273. doi:10.1039/c8dt00420j
Janeiro, M. H., Ardanaz, C. G., Sola-Sevilla, N., Dong, J., Cortés-Erice, M., Solas, M., et al. (2021). Biomarkers in alzheimer’s disease. Adv. Lab. Med. Adv. En. Med. Lab. 2, 27–37. doi:10.1515/almed-2020-0090
Jin-Hwa, K., Sim, G. S., Bae, J. T., Oh, J. Y., Lee, G. S., Lee, D. H., et al. (2008). Synthesis and anti-melanogenic effects of lipoic acid-polyethylene glycol ester. J. Pharm. Pharmacol. 60 (7), 863–870. doi:10.1211/jpp.60.7.0007
Khan, S., Barve, K. H., and Kumar, M. S. (2020). Recent advancements in pathogenesis, diagnostics and treatment of alzheimer’s disease. Curr. Neuropharmacol. 18, 1106–1125. doi:10.2174/1570159x18666200528142429
Kumar, D., Moghiseh, M., Chitcholtan, K., Mutreja, I., Lowe, I., Kaushik, A., et al. (2023a). LHRH conjugated gold nanoparticles assisted efficient ovarian cancer targeting evaluated via spectral photon-counting CT imaging: aa proof-of-concept research. J. Mater Chem. B 11, 1916–1928. doi:10.1039/d2tb02416k
Kumar, D., Mutreja, I., and Kaushik, A. (2023b). Recent advances in noble metal nanoparticles for cancer nanotheranostics. J. Nanotheranostics 4, 150–170. doi:10.3390/jnt4020008
Li, T., Vandesquille, M., Koukouli, F., Dudeffant, C., Youssef, I., Lenormand, P., et al. (2016). Camelid single-domain antibodies: aa versatile tool for in vivo imaging of extracellular and intracellular brain targets. J. Control Release 243, 1–10. doi:10.1016/j.jconrel.2016.09.019
Loftus, J. R., Puri, S., and Meyers, S. P. (2023). Multimodality imaging of neurodegenerative disorders with a focus on multiparametric magnetic resonance and molecular imaging. Insights Imaging 14, 8. doi:10.1186/s13244-022-01358-6
Miller, M. M., and Lazarides, A. A. (2005). Sensitivity of metal nanoparticle surface plasmon resonance to the dielectric environment. J. Phys. Chem. B 109, 21556–21565. doi:10.1021/jp054227y
Mitchell, T., Lehéricy, S., Chiu, S. Y., Strafella, A. P., Stoessl, A. J., and Vaillancourt, D. E. (2021). Emerging neuroimaging biomarkers across disease stage in Parkinson disease: aa review. JAMA Neurol. 78, 1262–1272. doi:10.1001/jamaneurol.2021.1312
Moghiseh, M., Clark, J. A., Amma, M. R., Chapagain, K. M., Dixit, D., Lowe, C., et al. (2023). “MARS for molecular imaging and preclinical studies,” in Photon counting computed tomography (Berlin, Germany: Springer), 63–92.
Palermo, F., Pieroni, N., Maugeri, L., Provinciali, G. B., Sanna, A., Bukreeva, I., et al. (2020). X-Ray phase contrast tomography serves preclinical investigation of neurodegenerative diseases. Front. Neurosci. 14, 584161. doi:10.3389/fnins.2020.584161
Pavese, N., and Brooks, D. J. (2009). Imaging neurodegeneration in Parkinson’s disease. Biochim. Biophys. Acta 1792, 722–729. doi:10.1016/j.bbadis.2008.10.003
Pérez-Osorio, I. N., Espinosa, A., Giraldo Velázquez, M., Padilla, P., Bárcena, B., Fragoso, G., et al. (2021). Nose-to-Brain delivery of dexamethasone: biodistribution studies in mice. J. Pharmacol. Exp. Ther. 378 (3), 244–250. doi:10.1124/jpet.121.000530
Perruchini, C., Pecorari, F., Bourgeois, J. P., Duyckaerts, C., Rougeon, F., and Lafaye, P. (2009). Llama VHH antibody fragments against GFAP: better diffusion in fixed tissues than classical monoclonal antibodies. Acta Neuropathol. 118, 685–695. doi:10.1007/s00401-009-0572-6
Porret, E., Sancey, L., Martin-Serrano, A., Montanez, M., Seeman, R., Yahia-Ammar, A., et al. (2017). Hydrophobicity of gold nanoclusters influences their interactions with biological barriers. Chem. Mat. 29, 7497–7506. doi:10.1021/acs.chemmater.7b02497
Riederer, S. J., and Mistretta, C. A. (1977). Selective iodine imaging using K-edge energies in computerized x-ray tomography. Med. Phys. 4 (6), 474–481. doi:10.1118/1.594357
Samykutty, A., Thomas, K. N., McNally, M., Hagood, J., Chiba, A., Thomas, A., et al. (2023). Simultaneous detection of multiple tumor-targeted gold nanoparticles in HER2-positive breast tumors using optoacoustic imaging. Radiol. Imaging Cancer 5 (3), e220180. doi:10.1148/rycan.220180
Sancey, L., Kotb, S., Truillet, C., Appaix, F., Marais, A., Thomas, E., et al. (2015). Long-term in vivo clearance of gadolinium-based AGuIX nanoparticles and their biocompatibility after systemic injection. ACS Nano 9, 2477–2488. doi:10.1021/acsnano.5b00552
Schneider, C., Rasband, W., and Eliceiri, K. (2012). NIH image to ImageJ: 25 years of image analysis. Nat. Methods 9, 671–675. doi:10.1038/nmeth.2089
Schultke, E., Menk, R., Pinzer, B., Astolfo, A., Stampanoni, M., Arfelli, F., et al. (2014). Single-cell resolution in high-resolution synchrotron X-ray CT imaging with gold nanoparticles. J. Synchrotron Radiat. 21, 242–250. doi:10.1107/s1600577513029007
Tokel, O., Inci, F., and Demirci, U. (2014). Advances in plasmonic technologies for point of care applications. Chem. Rev. 114, 5728–5752. doi:10.1021/cr4000623
Topperwien, M., van der Meer, F., Stadelmann, C., and Salditt, T. (2018). Three-dimensional virtual histology of human cerebellum by X-ray phase-contrast tomography. Proc. Natl. Acad. Sci. U. S. A. 115, 6940–6945. doi:10.1073/pnas.1801678115
Turkevich, J., Cooper Strevenson, P., and Hiller, J. (1951). A study of the nucleation and growth processes in the synthesis of colloidal gold. Discuss. Faraday Soc. 11, 55–75. doi:10.1039/df9511100055
Wilson, D. M., Cookson, M. R., Van Den Bosch, L., Zetterberg, H., Holtzman, D. M., and Dewachter, I. (2023). Hallmarks of neurodegenerative diseases. Cell 186 (4), 693–714. doi:10.1016/j.cell.2022.12.032
Keywords: metal nanoparticles, nanobodies, brain, imaging, neurodegenenerative diseases
Citation: Sanna A, Quarta A, Pieroni N, Parodi B, Palermo F, Bukreeva I, Fratini M, Massimi L, Simeone D, Le Guével X, Bravin A, Quintiero E, Viola I, Gigli G, Kerlero de Rosbo N, Sancey L and Cedola A (2023) Combining metal nanoparticles and nanobodies to boost the biomedical imaging in neurodegenerative diseases. Front. Nanotechnol. 5:1236810. doi: 10.3389/fnano.2023.1236810
Received: 08 June 2023; Accepted: 10 August 2023;
Published: 04 September 2023.
Edited by:
Shuwen Zeng, Centre National de la Recherche Scientifique (CNRS), FranceReviewed by:
Dhiraj Kumar, University of Minnesota Twin Cities, United StatesCopyright © 2023 Sanna, Quarta, Pieroni, Parodi, Palermo, Bukreeva, Fratini, Massimi, Simeone, Le Guével, Bravin, Quintiero, Viola, Gigli, Kerlero de Rosbo, Sancey and Cedola. This is an open-access article distributed under the terms of the Creative Commons Attribution License (CC BY). The use, distribution or reproduction in other forums is permitted, provided the original author(s) and the copyright owner(s) are credited and that the original publication in this journal is cited, in accordance with accepted academic practice. No use, distribution or reproduction is permitted which does not comply with these terms.
*Correspondence: A. Sanna, alessiasanna.cnr@gmail.com
†These authors have contributed equally to this work
Disclaimer: All claims expressed in this article are solely those of the authors and do not necessarily represent those of their affiliated organizations, or those of the publisher, the editors and the reviewers. Any product that may be evaluated in this article or claim that may be made by its manufacturer is not guaranteed or endorsed by the publisher.
Research integrity at Frontiers
Learn more about the work of our research integrity team to safeguard the quality of each article we publish.