 Xuyiling Wang
 David Cabrera
 Ying Yang
 Neil Telling
- School of Pharmacy and Bioengineering, Keele University, Staffordshire, United Kingdom
Magnetic nanoparticles (MNPs) are promising as local heat generators for magnetic hyperthermia under AC magnetic fields. The heating efficacy of MNPs is determined by the AC hysteresis loop area, which in turn is affected by the dynamic magnetic properties of the nanoparticles. Whilst inductive-based AC magnetometers can measure the average magnetic behavior of samples, the use of the magneto-optical Faraday effect with a focused laser spot allows point-probe measurements to be made, and without some of the magnetic field limitations imposed by inductive methods. In this work, the AC magnetic properties of different sized iron oxide MNPs in suspension were measured by AC magnetometry and AC susceptibility techniques. AC hysteresis loops measured by magneto-optical magnetometry were validated using a commercial inductive AC magnetometer, and compared to the magnetization relaxation behavior revealed by fitting the AC susceptibility data. The spatial sensitivity of the point-probe magneto-optical method is also demonstrated by measuring the AC hysteresis loop from large (>1 μm) MNP aggregates dried onto glass slides. These aggregated particles are found to be magnetically softer than in their suspension form, suggesting interparticle coupling mechanisms could occur when the nanoparticles form dense aggregates.
1 Introduction
Magnetic nanoparticles (MNPs), capable of responding to an external magnetic field, are showing huge potential for applications in biomedicine, such as magnetic hyperthermia (MH) for cancer therapy (Pankhurst et al., 2009; Wu et al., 2019; Farzin et al., 2020; Johannsen et al., 2005), as contrast agents for MRI (Fu et al., 2019; Grippin et al., 2019) and for targeted drug delivery (Hess et al., 2019). Hyperthermia applications utilize the fact that cancer cells show an enhanced sensitivity to heat compared to healthy cells, so that elevating the local temperature (>42°C) for sufficient time (∼30 min) can induce apoptosis in cancer cells without harming healthy tissue (Hildebrandt et al., 2002). In magnetic hyperthermia, the energy loss of MNPs under a high-frequency (50–1,000 kHz) alternating current (AC) magnetic field generates heating that is localized to the nanoparticle vicinity. Clinical trials that utilized magnetic hyperthermia in combination with chemo or radiotherapy, have already shown the potential treatment benefits of the technique (Wust et al., 2002; Maier-Hauff et al., 2011; Grauer et al., 2019), albeit using very concentrated suspensions of nanoparticles.
The heating efficacy, i.e., the heating power per unit mass of MNPs, under the applied field condition used, is defined as the specific absorption rate (SAR) or alternatively specific loss power (SLP). The conventional calorimetric approach to determine the SAR, using the initial rate of temperature increase, can lead to inaccurate results due to the difficulty of creating a complete adiabatic environment (Wildeboer et al., 2014). An alternative approach is to measure the AC hysteresis loop area (Mehdaoui et al., 2012). This approach measures the magnetic response of MNPs directly, which is more consistent and less affected by thermal environmental conditions.
To obtain AC hysteresis loops, coiled AC magnetometers using induction methods are now commercially available. However, these instruments measure bulk magnetization, typically of liquid samples, which narrows their application within the biological realm, especially when MNPs are associated with cells. Further, the inductive magnetometry approach has limitations regarding the usable field conditions possible because of the requirement to use a detection coil, leading to a frequency-dependent signal strength and the emergence of signal artefacts due to coil self-resonance. An alternative approach is therefore to use an optical detection method to probe AC magnetization. The magneto-optical Faraday effect, which describes the polarization rotation of light passing through a magnetized material, has the potential to probe the AC magnetic properties of samples at a focused spot. Cabrera et al. (2022) recently reported the use of the Faraday effect to probe the AC magnetization of MNP suspensions, where the usable field conditions were also largely extended.
We have recently developed a multifunctional microscope which includes a modality to probe the AC magnetization of samples using the Faraday effect. The full details of the microscope design will be reported elsewhere. Briefly, the AC magnetic field generated by a custom-built coil at the sample position, allows application of AC fields of up to ∼50 mT at frequencies up to 500 kHz. A linearly polarized laser beam (639 nm, 10 mW) is focused to a spot size of ∼1 μm at the sample position, after being reflected by two scanning mirrors which enable the beam spot to be positioned or scanned over the sample surface. Owing to the Faraday effect, the polarization axis of the laser beam is rotated after passing through the magnetized sample (which can be either a MNP suspension or a dry sample on a microscope slide). The degree of rotation is proportional to the magnetization of the sample, thus enabling the dynamic magnetization of the samples to be probed as a function of magnetic field intensity and frequency.
In the work presented here, a chemically synthesized MNP suspension was fractionated into two different sizes which were characterized by conventional induction-based AC magnetic susceptibility, in addition to transmission electron microscopy (TEM) and dynamic light scattering (DLS). AC hysteresis loops were measured in the multifunctional microscope using the magneto-optical approach and validated by further measurements using a commercial induction-based AC magnetometer. Finally, nanoparticle aggregation was induced by depositing MNPs into cell culture media. The MNP aggregates formed were dried onto a specialist glass slide which has a low Verdet constant to minimize the Faraday response from the glass. Using the focused laser spot as a point-probe, it was possible to measure the AC magnetization at specific positions on the slide, revealing a change in the AC hysteresis of the MNPs in dried aggregated form.
2 Materials and methods
2.1 Preparation of size-fractionated iron oxide nanoparticles
Citric acid (CA) coated magnetite nanoparticles were synthesized by one-step coprecipitation based on methodologies reported by Sun et al. (2007) and Zhou et al. (2012). In brief, 4.1 g of ferric chloride hexa-hydrate and 1.791 g of ferrous chloride tetra-hydrate were fully dissolved in 100 ml deionized water under continuous nitrogen flow. The solution was then heated to 80°C and 25 ml aqueous ammonium hydroxide (25%) was added drop by drop with vigorous stirring. Following magnetite core formation, 8.823 g of CA was added for 1 h reaction before cooling down to room temperature.
Size-fractionation of the CA coated particles was performed by collecting the sedimentation and supernatant using a strong permanent magnet placed under the sample vessel. The sedimentation part, obtained after 30 s application with the magnet, was resuspended in deionized water and labelled as S1. The supernatant part was then repositioned on the permanent magnet for 27 h, discarding the sedimentation formed. The left supernatant was concentrated after ultracentrifugation (288.2krcf for 90 min), discarding the supernatant and resuspending the sedimentation in deionized water, labelling as S9. Excess ammonium hydroxide and free CA of both samples were further removed by ultracentrifugation process performed twice (274.400krcf for 80 min, removing supernatant and resuspending the sedimentation in deionized water). Therefore, sample S1 and S9 containing magnetite nanoparticles of different sizes, coming from the same batch of synthesis, were created.
We have previously shown that the addition of fetal bovine serum (FBS) to aqueous MNP suspensions, is an effective method to induce nanoparticle aggregation (Cabrera et al., 2018). Here, a sample of aggregated nanoparticles from the S1 suspension was dried onto a borosilicate glass slide which had low Verdet constant (Goodfellow, SiO2 81%/B2O3 13%/Na2O 4%). This aggregated sample was prepared as follows: 10 µl of sample S1 was first diluted in 100 µl of normal cell culture media to induce nanoparticle aggregation. The cell culture media consisted of high glucose (4.5 g/l) DMEM with sodium pyruvate, supplemented with 10% FBS, 2 mM L-glutamine, 1x MEM Nonessential Amino Acids (Gibco), 100 U/mL penicillin, and 100 mg/mL streptomycin. The aggregated sample suspension was then pipetted onto the borosilicate glass slide and left to dry out completely.
2.2 Characterization of size-fractionated iron oxide nanoparticles
Iron concentration in the suspensions was determined by the ferrozine method: IONPs were first digested with 15% nitric acid and incubated at 70°C for 48 h. Then, freshly prepared 6.6 M hydroxylamine hydrochloride was added to reduce Fe3+ into Fe2+ for ∼3 h before adding 2 mM ferrozine solution to turn the solution color from faint yellow into magenta (chelate complex, Fe2+-ferrozine). After incubating at room temperature for ∼3 h, light absorption at 562 nm was measured. The iron concentration (in mM) was then calculated by fitting to a standard curve.
The hydrodynamic size (D) and corresponding polydispersity index (PDI) of prepared IONPs were measured using dynamic light scattering (DLS) in a Zetasizer Nano ZS (Malvern Instruments). The zeta potential of each sample was measured on the same instrument using laser doppler electrophoresis. For both DLS and electrophoresis measurements, sample suspensions were diluted ∼50 times in deionized water with measured pH of 7.8.
The distribution of MNP core diameters was determined by transmission electron microscopy (TEM). Samples were deposited onto C-coated formvar TEM grids (Agar Scientific, AGS162-Copper) and imaged using a JEOL 1230 microscope system operating at 100 kV. The diameter of over 600 MNPs in different areas for each sample, assuming spherical shape, was measured using the ImageJ software package to determine the size distribution. The mean diameter (d) and distribution width (σ) were then computed by fitting a log-normal curve to the size data using MATLAB.
2.3 Measurements of AC magnetic response
AC susceptibility (ACS) of all samples was measured using an in-house developed AC magnetic susceptometer operating at frequencies between 10 Hz and 1 MHz at 37°C, with magnetic field intensity of <∼0.4 kA/m. 200 µl of each sample was measured in a glass vial and the background signal from the empty glass vial subtracted. Measured ACS data were compared to simulations using a computational model that considers the AC response of clusters of polydisperse MNPs in free suspension. Full details of this model are given elsewhere (Céspedes et al., 2014). Briefly, the model determines the total AC susceptibility as a function of frequency from an ensemble of polydisperse MNPs contained within polydisperse clusters. The input parameters to the model are the mean and sigma value of the log-normal distribution for the particle and cluster ensembles, the saturation magnetization and effective anisotropy constant of the MNPs, and the viscosity and temperature of the suspension. The latter two parameters are the values used in the experiments, whilst the size and distribution width of the MNPs were determined from the analysis of TEM images described above.
AC hysteresis loops were measured using the Faraday magneto-optical effect with our in-house developed multifunctional microscope (full details of which will be reported elsewhere). For MNP suspensions, ∼27 µl of each sample was pipetted into vessels of a commercial cell-culture slide enclosure (ibidi GmbH, µ-Slide VI–Flat) and sealed with parafilm to avoid evaporation. The dried aggregated sample on the borosilicate glass slide was inserted directly into the sample position of the microscope. To measure the rotation of the light polarization axis after passing through the sample, a polarizing beam splitter was used to separate the two orthogonal polarization components. These beams were then positioned onto the photodiodes of a balanced amplified photodetector (Thorlabs, PDB425A). This subtracts and amplifies the signals from the two photodiodes to produce a differential output signal which was proportional to the degree of polarization rotation (and thus sample magnetization). Prior to sample measurement, calibration was performed for each frequency using standard diamagnetic glass slides as a known reference, to remove frequency-dependent phase shifts caused by the electronic components.
To validate the results of the magneto-optical measurements, induction-based AC magnetometry was also performed using a commercial instrument (Advance AC Hyster magnetometer, NanoTech Solutions). For these measurements, a volume of 300 µl sample in a glass vial was measured and averaged over three measurements. Owing to differences in the instrumental setups for magneto-optical and inductive systems, the closest frequencies that could be used for comparison were 129.2 kHz for the magneto-optical method, and 100 kHz for the inductive method. However, considering that AC magnetic properties such as AC susceptibility show variations that are discernable only on a log frequency scale, the difference in the frequencies used is not significant and measurements made at each frequency would be expected to be nearly identical.
3 Results and discussion
3.1 Size dispersion of fractionated nanoparticle suspensions
TEM images (Figure 1) show the size and polydispersity in the two samples, S1 and S9. Smaller and more uniform particles were found in S9 than in S1 and the fitted log-normal particle size distribution revealed a narrower peak shifted to the left (smaller particle size) compared to S1. From the fits to the size distributions, the different mean core diameters (d) and sigma-values were found to be d = 10.58 nm, σ = 0.37 for S1; and d = 8.57 nm, σ = 0.33 for S9. The final supernatant after several fractionation steps, S9, was found to be less polydisperse than S1 as expected. From Ferrozine assay, the Fe3O4 concentration was determined to be 12.5 mg/ml for S1 and 19.5 mg/ml for S9.
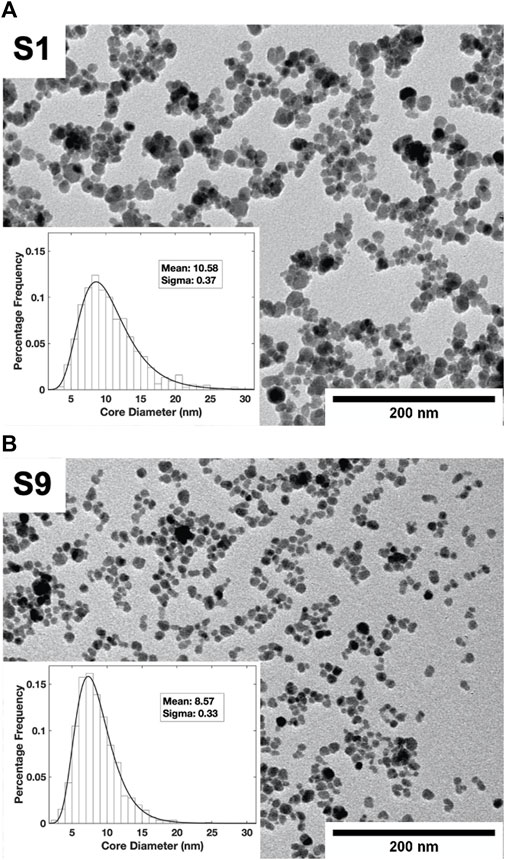
FIGURE 1. TEM images of nanoparticle fractions S1 (A) and S9 (B). The particle size distributions fitted to a log normal distribution are shown as insets.
The corresponding zeta potential measured for S1 and S9 were −50.6 ± 0.1 mV and −66.7 ± 0.1 mV, respectively, indicating both suspensions were stable (at least in the diluted sample state used for these measurement). Corresponding mean (intensity-weighted) hydrodynamic sizes and poly-dispersity indices were found to be 128.7 nm and 0.20 for S1, and 35.6 nm and 0.14 for S9.
3.2 Magnetization dynamics
The magnetic properties of nanoparticles under AC conditions determine their AC magnetic hysteresis and consequently their effectiveness for magnetic hyperthermia. To further understand the AC magnetic properties of the samples prepared here, AC magnetic susceptibility was measured across a wide frequency range from 10 Hz to 1 MHz. AC magnetic susceptibility is a complex quantity that consists of a (real) in-phase component, χ’, and an (imaginary) out-of-phase, χ’’ component. The frequency dependence of these components reveals the magnetic behavior of the nanoparticles, as well as giving information on their local environment and aggregation state (Telling, 2019).
Small magnetic nanoparticles can spontaneously change their magnetization direction if the thermal energy of the system exceeds the magnetic anisotropy energy of the particles. The time scale over which this thermally induced spontaneous demagnetization process occurs is given by the Néel relaxation time, which in turn depends upon the size of the particles and a material parameter known as the anisotropy constant. The term superparamagnetism is used to describe particles where the Néel relaxation time is shorter than the observation or measurement time of the magnetization. Conversely, particles that remain magnetized during the observation time are referred to as magnetically blocked. Under AC conditions this observation time is essentially the AC magnetic field cycle time. Hence even so-called superparamagnetic nanoparticles can become blocked if the cycle time is sufficiently short (i.e., the AC field frequency is sufficiently high). In addition, blocked nanoparticles that are free to move in a suspension can also spontaneously change their magnetization direction, due to the buffeting motion of molecules in the suspension (a process known as Brownian relaxation). However, in this case it is the hydrodynamic size of the particle (or particle cluster) as well as the viscosity of the suspension which dictate the Brownian relaxation time.
The AC susceptibility measured from the MNP suspensions S1 and S9 is shown in Figure 2. Changes in the relaxation processes that occur in each suspension as the frequency is scanned, manifest as variations in the amplitude of the in-phase and out-of-phase components. If all the particles in the suspension relax during the field cycle, only the in-phase (χ’) component will be present. This can be seen to occur at frequencies below ∼50 Hz for sample S1 and below ∼1 kHz for sample S9. However, the overall AC susceptibility behavior is complicated by polydisperse MNP core sizes and the presence of MNP clusters in the suspensions, consequently enabling both Néel and Brownian relaxation mechanisms to contribute at different frequencies. These effects were quantified by fitting the data using a computational model that assumes a log-normal distribution of MNP core and cluster sizes within the suspension (Céspedes et al., 2014). The model incorporates the effective anisotropy constant of the nanoparticles as a parameter: this is their anisotropy constant under the AC magnetic field conditions used and can depend on the aggregation state of the particles (Cabrera et al., 2018).
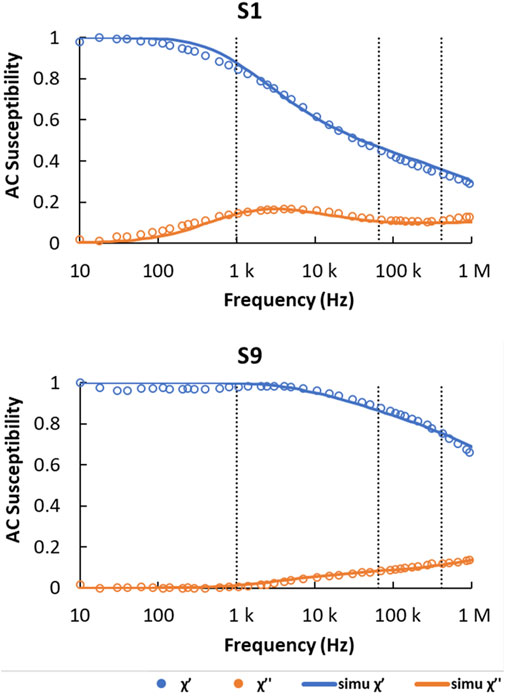
FIGURE 2. Normalized AC susceptibility measured from sample fractions S1 and S9. Measured in-phase component (χ’) is shown in blue dots and out-of-phase component (χ’’) in orange dots. The simulated χ’ and χ’’ (simu χ’, simu χ’’) are shown as solid lines in the same color. Measurements were made at physiological temperature (T = 310 K) and the viscosity of water was taken as ƞ = 0.0007 Pa·s. The dashed vertical lines indicate the AC field frequencies used for subsequent magneto-optical hysteresis loop measurements.
The MNP core size distributions used for the simulations were taken from the TEM analysis shown in Figure 1, whilst the cluster size distributions (mean diameter, D and sigma-value, σD) were free parameters determined from the fit to the data. The latter were found to be, S1: D = 25 nm, σD = 0.5; and S9: D = 15 nm, σD = 0.6, suggesting the clusters contained only a small number of nanoparticles in each case. These cluster sizes are much smaller than the hydrodynamic sizes determined from the earlier DLS measurements. However, this is consistent with our previous observations that suggest DLS measurements yield large hydrodynamic sizes in cases where corresponding AC susceptibility measurements instead indicate a large size distribution of smaller magnetic clusters (Narayanasamy et al., 2018). This discrepancy is probably caused by the increased sensitivity of DLS towards larger particulates, as well as a lack of specificity for magnetic material (in contrast to AC susceptibility which only detects particles that are magnetic).
Further, from the simulations the fitted effective anisotropy constants were found to be 20,000 J/m3 for S1 and 18,000 J/m3 for S9. This is consistent with previous measurements for magnetite nanoparticles (see for, e.g., Céspedes et al., 2014). The small difference in the values for S1 and S9 is likely to be caused by the smaller size of S9, such that the oxidized surface layer (which will have a lower anisotropy constant) represents a larger proportion of the particle volume. However, the corresponding anisotropy energy of the MNPs in each suspension, which determines their AC hysteresis response, is related to the product of the anisotropy constant and particle volume. Hence the S1 MNPs can be described as having a high anisotropy energy relative to the smaller S9 MNPs.
The AC hysteresis loops recorded using the magneto-optical probe are shown in Figure 3A. In all cases it appears that the samples were not fully saturated at the maximum field applied for these measurements (∼42 mT). An ensemble of nanoparticles with uniaxial anisotropy would saturate above their anisotropy field given by 2K/Ms where K is the anisotropy constant and Ms the saturation magnetization. For the surface oxidized magnetite nanoparticles in this study, we can assume a value of Ms similar to that measured previously for magnetite nanoparticles of ∼330 × 103 J/Tm3 (Céspedes et al., 2014). Using the derived effective anisotropy constant of ∼20 × 103 J/m3 discussed above, an estimate of the anisotropy field is ∼60 mT, which is consistent with the lack of full saturation observed for the hysteresis loops shown in Figure 3.
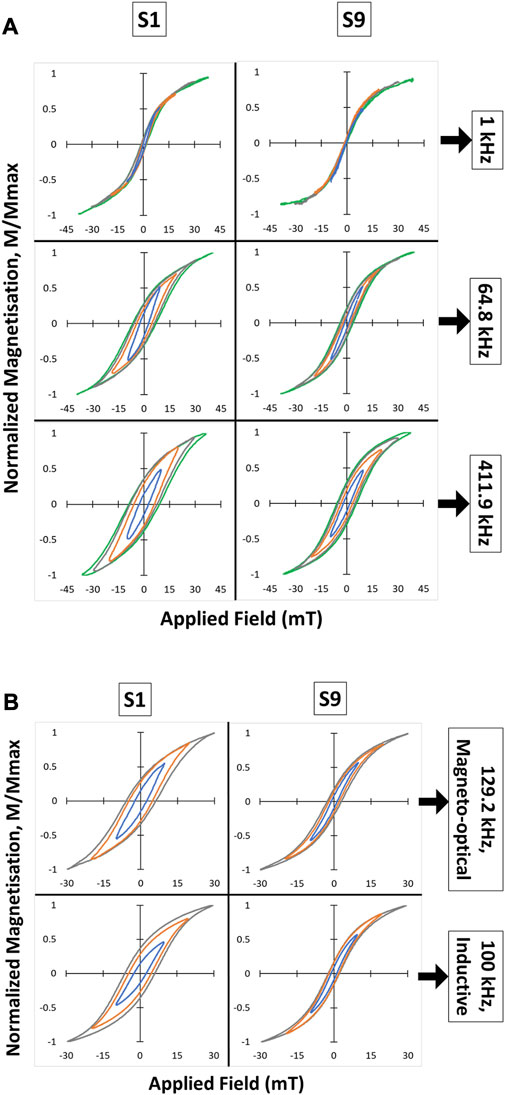
FIGURE 3. (A) Magneto-optical hysteresis loops measured from MNP suspensions S1 and S9 at three different frequencies: 1, 64.8, and 411.9 kHz. (B) Comparison between magneto-optical and conventional inductive method to measure AC hysteresis loops. Each subplot contains minor loops (in different colors) corresponding to different maximum field intensities.
Another feature of the loops that is evident for both samples in Figure 3A, is the widening of the hysteresis loops as the frequency increases from 1 to 411.9 kHz. This has been observed previously (see, for example, Cabrera et al., 2022) and can be explained by considering both the distribution of anisotropy energies in the nanoparticle ensemble, as well as their Néel relaxation times. As described earlier, superparamagnetic nanoparticles can spontaneously change their magnetization direction during the field cycle due to the thermal energy of the system. When such a sample is cooled, the energy barriers presented by the anisotropy energy of different particles come into play, and the corresponding switching field required to reverse their magnetization increases. Essentially the same process occurs as the AC field frequency is increased, as the particles have no time to spontaneously change magnetization direction, resulting in an increase in the overall hysteresis width (Chuev and Hesse, 2007).
To explain the differences between the two samples in Figure 3A it is necessary to consider the Néel relaxation of the particles in each case. At 1 kHz, the magnetization response from sample S9 shows a completely closed loop with zero coercivity and zero remanence. The low anisotropy energy determined for these MNPs, together with the observed purely in-phase AC susceptibility (χ’ = 1, Figure 2) suggest that all nanoparticles present in this suspension exhibit Néel relaxation at this frequency. In contrast, for sample S1, χ’ shows a decrease of ∼20% accompanied by an increase of the same order for χ’’ (Figure 2). This indicates that a small proportion of the nanoparticles in S1 are now blocked, explaining the small coercivity and non-zero remanence observed in the corresponding AC hysteresis loop in Figure 3A. A further indication of blocked nanoparticles in this sample can be found from the broad peak seen in the χ’’ component between ∼100 Hz and ∼100 kHz, which is caused by Brownian relaxation of clusters containing blocked nanoparticles (Céspedes et al., 2014).
As the frequency is increased to 64.8 kHz, the χ’ component from sample S1 drops below 0.5 indicating a much larger proportion of blocked nanoparticles at this frequency, reflected in the increased coercivity and remanence of the corresponding hysteresis loop. An increased proportion of blocked nanoparticles also occurs for sample S9 at this frequency, but as the reduction in χ’ is less dramatic (∼10%) the corresponding increase in coercivity and remanence observed in the hysteresis loop is also less pronounced than for sample S1. At 411.9 kHz, χ’ drops further to below 0.3 for S1 and to ∼0.75 for S9, revealing a further increase in the proportion of blocked particles. Both samples now show a similar remanence ratio (∼0.4) but significantly different coercivities (∼10 mT for S1 and ∼6 mT for S9), reflecting the lower anisotropy energy of the nanoparticles in S9 compared to S1.
In addition to the magneto-optical method, AC magnetization loops of S1 and S9 were also obtained using a commercial, inductive-based AC magnetometer. As shown in Figure 3B, the measured loops are almost identical for both methods. The fractionally larger loop observed from S1 with the inductive method compared to the magneto-optical method, might be caused by some sedimentation of the sample due to the strong applied field. The magneto-optical method records the signal at a fixed point which may exclude sedimented material, consequently affecting the overall hysteresis loop measured. These differences were eliminated in the more stable sample S9 which contains smaller particles with less size variation.
In order to demonstrate the spatial sensitivity of the point-probe magneto-optical method, hysteresis loops were recorded from aggregated MNPs taken from the S1 suspension, dried onto a borosilicate glass slide. A bright field image of the aggregates was first obtained by scanning the laser over the sample surface (Figure 4, RHS). The aggregates appear as dark blobs of ∼1–2 μm in size which appear to have agglomerated on the glass slide. Magneto-optical hysteresis loops (recorded at 64.7 kHz) were obtained by positioning the 1 μm laser spot at two points on the slide (indicated by the centers of the red circles in the figure). The loop recorded at the background position shows a residual weak diamagnetic signal from the borosilicate glass (most of the Faraday response from this glass is suppressed due to the low Verdet constant of the material). However, a clear hysteresis loop can be seen when the laser spot was positioned on the MNP aggregate region (red loop in Figure 4). Interestingly, this loop appears to show lower remanence than the loop obtained from the same MNPs in non-aggregated suspension form (green loop). This could be due to inter-particle coupling interactions which have been shown previously to affect the AC hysteresis behavior of aggregated nanoparticles (Cabrera et al., 2018).
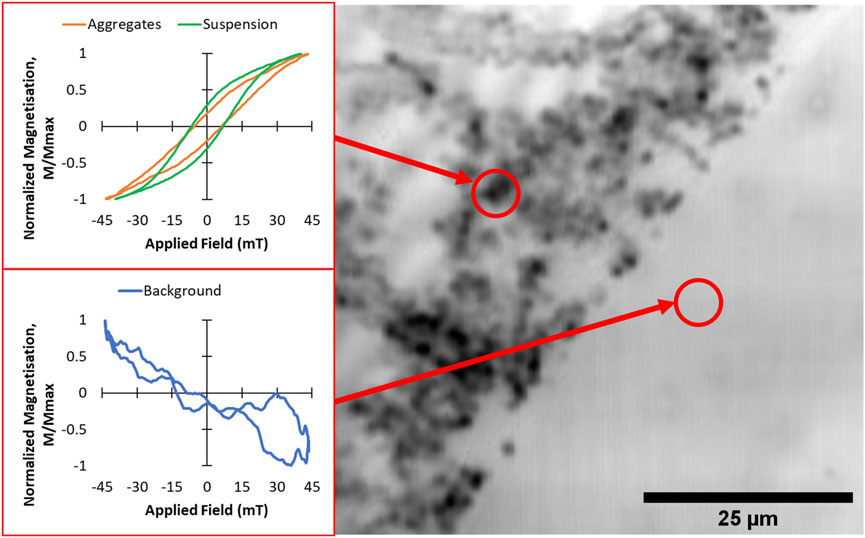
FIGURE 4. Point-probe AC magnetic hysteresis loops (LHS) and bright field microscopy image (RHS) from aggregated MNPs of sample S1 dried onto a borosilicate glass slide. The hysteresis loops (shown in orange and blue) were obtained at 64.8 kHz at the two positions indicated by the red circles. For comparison, the corresponding loop obtained at 64.8 kHz from S1 in suspension form is also shown (green loop).
More generally, differences in the hysteresis behavior of nanoparticle aggregates reflect changes to the magnetic anisotropy of the particles. These changes depend not only on the inter-particle interactions that occur, but also on the type of aggregate formed and the properties of the particles that form them. Previous studies have explored these effects in one-dimensional chains of nanoparticles (Anand, 2020), 2-dimensional arrays (Anand, 2021) and small 3-dimensional clusters (Lopez et al., 2022). In real biological systems where magnetic hyperthermia is employed, one or more of these arrangements could determine the resulting AC hysteresis and consequently heating response of the nanoparticles. The ability to probe AC magnetometry within individual micron-scale aggregates, as demonstrated here, is likely to prove invaluable for understanding how to optimize magnetic hyperthermia in real-world systems where such aggregated structures occur.
4 Summary
In this work, an in-house developed microscope utilizing the magneto-optical Faraday effect, was used to probe the AC magnetic response of MNP suspensions containing nanoparticles with different sizes, under different field conditions. The effect of particle size and frequency were clearly observed and discussed with relation to the physical properties and dynamic magnetization behavior of the nanoparticles. Results obtained using a commercial inductive AC magnetometer validated the results from the microscope. Further, the ability to measure the local AC magnetization of material confined to the region of a 1 μm focused laser spot was demonstrated, and revealed a magnetic softening effect in dried agglomerates of MNPs that has previously only been observed from aggregates in suspension form (Cabrera et al., 2018). This method therefore enables the possibility to probe MNPs within more complex biological environments such as cells and tissues.
Data availability statement
The raw data supporting the conclusion of this article will be made available by the authors, without undue reservation.
Author contributions
XW, NT, and DC contributed to the conception and design of the experimental work. XW and NT performed and analyzed the data from the experiments. XW, NT, DC, and YY wrote the first draft and the manuscript. All authors contributed to the article and approved the submitted version.
Funding
XW is grateful for studentship funding support from the Faculty of Medicine and Health Sciences at Keele University. The development of the microscope used in the experiments was funded by the EPSRC under grant number EP/P011403/1.
Conflict of interest
The authors declare that the research was conducted in the absence of any commercial or financial relationships that could be construed as a potential conflict of interest.
Publisher’s note
All claims expressed in this article are solely those of the authors and do not necessarily represent those of their affiliated organizations, or those of the publisher, the editors and the reviewers. Any product that may be evaluated in this article, or claim that may be made by its manufacturer, is not guaranteed or endorsed by the publisher.
References
Anand, M. (2020). Hysteresis in a linear chain of magnetic nanoparticles. J. Appl. Phys. 128, 023903. doi:10.1063/5.0010217
Anand, M. (2021). Hysteresis in two dimensional arrays of magnetic nanoparticles. J. Magn. Magn. Mat. 540, 168461. doi:10.1016/j.jmmm.2021.168461
Cabrera, D., Yoshida, T., Rincón-Domínguez, T., Cuñado, J. L. F., Salas, G., Bollero, A., et al. (2022). Superparamagnetic-blocked state transition under alternating magnetic fields: towards determining the magnetic anisotropy in magnetic suspensions. Nanoscale 14 (24), 8789–8796. doi:10.1039/d2nr00808d
Cabrera, D., Coene, A., Leliaert, J., Artés-Ibáñez, E. J., Dupré, L., Telling, N. D., et al. (2018). Dynamical Magnetic Response of Iron Oxide Nanoparticles Inside Live Cells. ACS Nano 12 (3), 2741–2752. doi:10.1021/acsnano.7b08995
Céspedes, E., Byrne, J. M., Farrow, N., Moise, S., Coker, V. S., Bencsik, M., et al. (2014). Bacterially synthesized ferrite nanoparticles for magnetic hyperthermia applications. Nanoscale 6 (21), 12958–12970. doi:10.1039/c4nr03004d
Chuev, M. A., and Hesse, J. (2007). Nanomagnetism: extension of the stoner–wohlfarth model within néel's ideas and useful plots. J. Phys. Condens. Matter 19, 506201. doi:10.1088/0953-8984/19/50/506201
Farzin, A., Etesami, S. A., Quint, J., Memic, A., and Tamayol, A. (2020). Magnetic nanoparticles in cancer therapy and diagnosis. Adv. Healthc. Mat. 9, 1901058. doi:10.1002/adhm.201901058
Fu, C., Duan, X., Cao, M., Jiang, S., Ban, X., Guo, N., et al. (2019). Targeted magnetic resonance imaging and modulation of hypoxia with multifunctional hyaluronic acid-MnO2 nanoparticles in glioma. Adv. Healthc. Mat. 8, 1900047. doi:10.1002/adhm.201900047
Grauer, O., Jaber, M., Hess, K., Weckesser, M., Schwindt, W., Maring, S., et al. (2019). Combined intracavitary thermotherapy with iron oxide nanoparticles and radiotherapy as local treatment modality in recurrent glioblastoma patients. J. Neurooncol 141, 83–94. doi:10.1007/s11060-018-03005-x
Grippin, A. J., Wummer, B., Wildes, T., Dyson, K., Trivedi, V., Yang, C., et al. (2019). Dendritic cell-activating magnetic nanoparticles enable early prediction of antitumor response with magnetic resonance imaging. ACS Nano 13, 13884–13898. doi:10.1021/acsnano.9b05037
Hess, K. L., Medintz, I. L., and Jewell, C. M. (2019). Designing inorganic nanomaterials for vaccines and immunotherapies. Nano Today 27, 73–98. doi:10.1016/j.nantod.2019.04.005
Hildebrandt, B., Wust, P., Ahlers, O., Dieing, A., Sreenivasa, G., Kerner, T., et al. (2002). The cellular and molecular basis of hyperthermia. Crit. Rev. oncology/hematology 43 (1), 33–56. doi:10.1016/s1040-8428(01)00179-2
Johannsen, M., Gneveckow, U., Eckelt, L., Feussner, A., Waldöfner, N., Scholz, R., et al. (2005). Clinical hyperthermia of prostate cancer using magnetic nanoparticles: presentation of a new interstitial technique. Int. J. Hyperth. 21 (7), 637–647. doi:10.1080/02656730500158360
Lopez, S., Hallali, N., Lalatonne, Y., Hillion, A., Antunes, J. C., Serhan, N., et al. (2022). Magneto-mechanical destruction of cancer-associated fibroblasts using ultra-small iron oxide nanoparticles and low frequency rotating magnetic fields. Nanoscale Adv. 4, 421–436. doi:10.1039/d1na00474c
Maier-Hauff, K., Ulrich, F., Nestler, D., Niehoff, H., Wust, P., Thiesen, B., et al. (2011). Efficacy and safety of intratumoral thermotherapy using magnetic iron-oxide nanoparticles combined with external beam radiotherapy on patients with recurrent glioblastoma multiforme. J. Neurooncol 103, 317–324. doi:10.1007/s11060-010-0389-0
Mehdaoui, B., Carrey, J., Stadler, M., Cornejo, A., Nayral, C., Delpech, F., et al. (2012). Influence of a transverse static magnetic field on the magnetic hyperthermia properties and high-frequency hysteresis loops of ferromagnetic FeCo nanoparticles. Appl. Phys. Lett. 100 (5), 052403. doi:10.1063/1.3681361
Narayanasamy, K. K., Cruz-Acuña, M., Rinaldi, C., Everett, J., Dobson, J., and Telling, N. D. (2018). Alternating current (AC) susceptibility as a particle-focused probe of coating and clustering behaviour in magnetic nanoparticle suspensions. J. Colloid Interface Sci. 532, 536–545. doi:10.1016/j.jcis.2018.08.014
Pankhurst, Q. A., Thanh, N. T. K., Jones, S. K., and Dobson, J. (2009). Progress in applications of magnetic nanoparticles in biomedicine. J. Phys. D Appl. Phys. 42 (22), 224001. doi:10.1088/0022-3727/42/22/224001
Sun, J., Zhou, S., Hou, P., Yang, Y., Weng, J., Li, X., et al. (2007). Synthesis and characterization of biocompatible Fe3O4 nanoparticles. J. Biomed. Mater. Res. Part A 80 (2), 333–341. doi:10.1002/jbm.a.30909
Telling, N. (2019). “High-frequency magnetic response and hyperthermia from nanoparticles in cellular environments,” in Nanomaterials for magnetic and optical hyperthermia applications (Elsevier), 173–197.
Wildeboer, R. R., Southern, P., and Pankhurst, Q. A. (2014). On the reliable measurement of specific absorption rates and intrinsic loss parameters in magnetic hyperthermia materials. J. Phys. D Appl. Phys. 47 (49), 495003. doi:10.1088/0022-3727/47/49/495003
Wu, K., Su, D., Liu, J., Saha, R., and Wang, J. P. (2019). Magnetic nanoparticles in nanomedicine: a review of recent advances. Nanotechnology 30, 502003. doi:10.1088/1361-6528/ab4241
Wust, P., Hildebrandt, B., Sreenivasa, G., Rau, B., Gellermann, J., Riess, H., et al. (2002). Hyperthermia in combined treatment of cancer. lancet Oncol. 3 (8), 487–497. doi:10.1016/s1470-2045(02)00818-5
Keywords: magnetic hyperthermia, Faraday effect, magnetic nanoparticles, AC magnetometry, AC susceptibility
Citation: Wang X, Cabrera D, Yang Y and Telling N (2023) Probing magnetization dynamics of iron oxide nanoparticles using a point-probe magneto-optical method. Front. Nanotechnol. 5:1214313. doi: 10.3389/fnano.2023.1214313
Received: 29 April 2023; Accepted: 02 August 2023;
Published: 10 August 2023.
Edited by:
Ayyappan Sathya, SASTRA University, IndiaReviewed by:
V. Mahendran, Institut Jožef Stefan (IJS), SloveniaManish Anand, University of Naples Federico II, Italy
Copyright © 2023 Wang, Cabrera, Yang and Telling. This is an open-access article distributed under the terms of the Creative Commons Attribution License (CC BY). The use, distribution or reproduction in other forums is permitted, provided the original author(s) and the copyright owner(s) are credited and that the original publication in this journal is cited, in accordance with accepted academic practice. No use, distribution or reproduction is permitted which does not comply with these terms.
*Correspondence: Neil Telling, bi5kLnRlbGxpbmdAa2VlbGUuYWMudWs=