 Elena della Valle1,2*
 Beomseo Koo1,2
 Paras R. Patel1,2Quentin Whitsitt3
 Erin K. Purcell3
 Cynthia A. Chestek1,2,4,5,6James D. Weiland1,7,2
- 1Biomedical Engineering Department, University of Michigan, Ann Arbor, MI, United States
- 2Biointerfaces Institute, University of Michigan, Ann Arbor, MI, United States
- 3College of Engineering, Michigan State University, East Lansing, IN, United States
- 4Department of Electrical Engineering and Computer Science, University of Michigan, Ann Arbor, MI, United States
- 5Robotics Graduate Program, University of Michigan, Ann Arbor, MI, United States
- 6Neuroscience Graduate Program, University of Michigan, Ann Arbor, MI, United States
- 7Department of Ophthalmology and Visual Sciences, Kellogg Eye Center, University of Michigan, Ann Arbor, MI, United States
Ultrasmall microelectrode arrays have the potential to improve the spatial resolution of microstimulation. Carbon fiber (CF) microelectrodes with cross-sections of less than 8 μm have been demonstrated to penetrate cortical tissue and evoke minimal scarring in chronic implant tests. In this study, we investigate the stability and performance of neural stimulation electrodes comprised of electrodeposited platinum-iridium (PtIr) on carbon fibers. We conducted pulse testing and characterized charge injection in vitro and recorded voltage transients in vitro and in vivo. Standard electrochemical measurements (impedance spectroscopy and cyclic voltammetry) and visual inspection (scanning electron microscopy) were used to assess changes due to pulsing. Similar to other studies, the application of pulses caused a decrease in impedance and a reduction in voltage transients, but analysis of the impedance data suggests that these changes are due to surface modification and not permanent changes to the electrode. Comparison of scanning electron microscope images before and after pulse testing confirmed electrode stability.
1 Introduction
Ultramicroelectrodes are a class of neural interfaces distinguished by cross-sectional dimensions of less than 15 microns. Ultramicroelectrodes include carbon fiber arrays (Patel et al., 2015; Welle et al., 2020), the Neurolace and NET probes (Xie et al., 2015), silicon carbide microelectrodes (SiC) (Deku et al., 2018), high density microwires (Kollo et al., 2020), and 3D printed arrays (Ali et al., 2021). These devices drastically reduce the foreign body reaction compared to penetrating arrays with larger features (Polikov et al., 2005). The small size of ultramicroelectrodes makes them challenging to utilize since they either lack the stiffness to penetrate the brain (and require a temporary stiffener) or are brittle and thus difficult to handle. Polyimide is an example of an electrode substrate that requires a stiffener while silicon is an example of an electrode that is stiff but brittle at dimensions below 15 microns. Carbon fiber (CF) ultramicroelectrodes have proven to be strong enough to penetrate the cortex (Patel et al., 2015; Patel et al., 2016; Massey et al., 2019) and peripheral nerve (Gillis et al., 2018; Dehdashtian et al., 2020) yet small enough to evoke minimal foreign body reaction (Deku et al., 2018; Kozai et al., 2012; Patel et al., 2016; Welle et al., 2020, 2021). Since carbon is also conductive, it can serve as both a mechanical substrate and electrical conductor for an ultramicroelectrode (Kozai et al., 2012; Patel et al., 2016; Jiman et al., 2020). However, carbon is not efficient for neural stimulation. This limitation, along with the small dimensions of ultramicroelectrodes, requires enhancement of carbon by coating with an additional material suitable for neural stimulation.
Platinum and platinum-iridium are widely used for neural stimulation (Cogan, 2008). Due to their proven efficiency and stability, these materials are used in clinical devices such as deep brain stimulators, which use macroelectrodes (millimeter dimensions), and therefore can stay within charge density limits (30 μC/cm2 (Cogan et al., 2016)), and still provide therapeutic levels of stimulation. However, the smaller electrodes site sizes used by ultramicroelectrodes may require a charge density above this limit to evoke responses from cortical cells. Motivated by this need, several alternative materials with improved charge injection capability have been developed. Porous titanium nitride (TiN) has shown biocompatibility and stability along with large charge-injection capacities due to surface roughness. However, accessing the full charge storage capacity under the high current density of neural stimulation is limited by the pore resistance (Posey and Morozumi, 1966; Goldberg et al., 1972; Norlin et al., 2004). The porous platinum known as “Pt gray” can inject a charge density of 1.4 mC/cm2 (Zhou, 2005; Zhou, 2011; Fan et al., 2020) without causing material damage or irreversible reactions. Nanostructered platinum (nanoPt) has been recently investigated (Boehler et al., 2020; Wang et al., 2021) through in vitro and in vivo testing as a potential electrochemical coating both for neural recording and stimulation. Reproducibility of the coating process and stimulation performance for small microelectrodes (cross-section
Here we evaluate CF microelectrode arrays coated with electrodeposited PtIr (PtIr-CF) under conditions of in vitro pulse testing at rates of 300 Hz (Chen et al., 2020) and 10 kHz (Kapural et al., 2015), which are of interest in neural engineering, specifically for visual cortex stimulation and high frequency spinal cord stimulation respectively. We characterized PtIr-CF electrodes with electrochemical impedance spectroscopy (EIS), cyclic voltammetry (CV), voltage transients (VT), and scanning electron microscopy (SEM) before and after the coating as well as before and after in vitro pulsing tests. Voltage transients were stable during the pulsing process and no delamination was apparent in pulsed electrodes. We also report data from two pilot studies: in vitro pulse testing of cellular scale PtIr-CF electrode and in vivo pulsing conducted in the visual cortex of a single animal.
2 Materials and Methods
2.1 Carbon Fibers Microelectrode Arrays Fabrication
The carbon fiber electrode arrays (CFEA) consist of eight sharpened CFs coated with a Parylene C insulation layer (800 nm) and are attached to a small printed circuit board [ZIF Probe, ZIF, (Patel et al., 2016)]. Insulation is removed at the tip using a blowtorching process (Welle et al., 2021) to expose 100–150 μm of carbon with sharpened tips. The final tip diameter tapers from 8.4 to ∼2 μm diameter at the tip.
One ZIF with 8 CFs with a small tip exposure was used for the pilot study of in vitro pulsing tests of cellular scale PtIr-CF. For the tip preparation of these CFs, instead of the blowtorching method, a scissor was used to expose the CF at the tip. Once cut, the CFs were coated with PtIr (area of ∼108 μm2, see inset of Figure 7A).
For in vivo pulsing tests, one high density carbon fiber (HDCF) array was used. The HDCF fabrication is described elsewhere (Huan et al., 2021). Briefly, the array consisted of 16 silicon shanks of 6 mm length with approximately 250 μm of CF protruding from the end of each shank. Parylene-C was used as an insulation layer and the CF tips were blowtorched to expose and sharpen the CF tips, exposing ∼100–150 μm.
2.2 Electrochemical Impedance Spectroscopy and Cyclic Voltammetry
EIS was collected by applying a 10 mV (peak) sine wave in a frequency range of 1 MHz–10 Hz. All EIS and CV measurements were performed in 1x PBS (0.01 M phosphate buffered saline) solution in a three electrode configuration at open circuit potential using a PtIr wire electrode (∼70 μm) as counter and an Ag/AgCl as reference electrode (3M NaCl, BASi, West Lafayette, IN, United States). A Gamry 600+ potentiostat (Gamry Inc., Warminster, PA, United States) was used for measurement collection.
Cyclic voltammetry (CV) measurements were obtained by sweeping three times between −0.6 and 0.8 V versus Ag/AgCl at a scan rate of 500 mV/s. CVs were measured to establish the cathodal charge storage capacity (CSCC) (Cogan, 2008). We calculated CSCC from the time integral of the cathodic current.
2.3 Pt–Ir Electrochemical Deposition
PtIr coatings were electrodeposited using a potential cycling technique in a solution of 0.2 g/L of Na3IrCl6H2O and 0.186 g/L of Na2PtCl6H2O in 0.1 M of nitric acid (HNO3) (Della Valle et al., 2021). A constant temperature of 56°C and a pulsed sonication at a power of 2 W (
2.4 SEM Images Acquisition
Images of CFs were acquired with scanning electron microscopy (SEM) before coating, after coating, and after pulse testing, using a Tescan Rise SEM (Tescan Orsay Holding, Brno—Kohoutovice, Czech Republic) in low vacuum mode (LVSTD, low vacuum secondary electron Tescan detector). Low vacuum mode allows imaging without deposition of a conductive film (i.e., gold). Samples were mounted on SEM stubs with the conductive carbon tape without the CF touching the tape. An excitation voltage between 5 and 20 kV was used.
2.5 In-vitro Pulse Testing
2.5.1 300 Hz and 10 kHz in Vitro Pulsing Test
A PlexStim Electrical Stimulator System (Plexon, Dallas, TX, United States, software version 2.3) was used to deliver cathodic first biphasic electric pulses with a charge density of 1 mC/cm2. A bipolar stimulation was done choosing as ground one PtIr-CF on the pulsed CFEA. Two different current amplitude and pulse duration were applied on the sharp carbon fibers:
1) Electric pulses with a duration of 170 μs, interphase of 60 μs at a frequency of 300 Hz. Pulsing tests were conducted for 12 h (∼13 million pulses);
2) Electric pulses with 30 μs of duration at a frequency of 10 kHz for 3 h (∼108 million pulses).
EIS measurements were taken before and after electric pulsing tests. All the experiments were conducted at room temperature. SEM images were collected before and at the end of pulsing tests to determine surface modifications due to the electric stimulation. The PlexStim provides single ended outputs of the current waveform (presented as a voltage across a resistor) and the VT across the test and counter electrodes. The current and the VT were monitored both for in vitro and in vivo pulsing tests, using a digital oscilloscope (Tektronix TBS 1032B, Beaverton, OR, United States). The electrochemical cell used consisted of a petri dish (Millipore Sigma, diameter of 80 mm and a volume of ∼75 ml) containing 1x of a PBS solution; the leads of the stimulator were connected to the pulsed carbon fiber, and the ground connected to one of the CFs of the pulsed ZIF board.
2.5.2 Electrode Polarization
A three electrode configuration method was used to measure the maximum cathodic polarization,
2.5.3 In vitro Cellular Scale PtIr-CF Pulsing Test
One ZIF board with eight small PtIr-CFs (section 2.1 for fabrication details) was characterized by means of pulsing tests. A PlexStim Electrical Stimulator System (Plexon, Dallas, TX, United States, software version 2.3) was used to deliver cathodic first biphasic electric pulses with a duration and interphase gap of 100 μs at 100 Hz. Current amplitudes ranged from 5 to 20 μA. The pulse was applied for the duration of 1 min per CF. A 70 μm PtIr wire was used as the counter electrode.
2.6 In vivo Pulsing Tests
2.6.1 High Density Carbon Fiber Array Fabrication
One HDCF (section 2.1 for details) array was used for in vivo visual cortex stimulation. The HDCF used for this experiment consisted of four CF electrodes, one coated CF for pulse testing and three for stab controls, with the remaining 12 fibers removed for easier insertion.
2.6.2 Rat Surgery
The surgical procedure used was approved by the Michigan State University Animal Care and Use Committee. One Sprague-Dawley rat was anesthetized with 3% isoflurane and maintained at 1–3%. Once hind-limb pinch response was muted, the rat’s head was shaven and placed on a stereotaxic with an anesthesia nosecone, and the head was fixed with ear bars. A longitudinal incision was made at the dorsal surface of the animal’s head, the fascia was removed, and the exposed skull was cleaned and dried. Excessive bleeding of the skull or surrounding skin was stopped with either absorbent spear or cauterization. A 3 × 3 mm craniotomy at the primary visual cortex (V1) was made using this coordinate: (Anterior-Posterior, Medial-Lateral) (−6.5, −3.5) mm from Bregma.
2.6.3 In vivo Stimulation Protocol
For in vivo stimulation, the dura was removed and the PtIr-HDCF was driven into the cortex until a depth of 300 μm was reached. An 8 cm stainless steel wire (A-M Systems) was used as a stimulation return electrode. One minute after insertion, the PtIr-HDCF was connected to the Plexon PlexStim system, and the stimulation return electrode was sutured under the loose skin at the incision site using vicryl sutures. Cathodic-first, symmetric-biphasic pulses with 200 μs duration per phase, 100 μs interphase gap, and 50 Hz pulse frequency were used with four amplitudes: 10, 15, 20, 25 μA (from 0.1 to 0.3 mC/cm2). 6,000 pulses were applied for each current amplitude. After collection of VT, the electrode was driven further into the tissue until 600 μm, and the tissue was stimulated for a total of 1 h (∼180k pulses) at 25 μA (0.3 mC/cm2) and 5 μs interphase gap. VTs were collected every 10 minutes.
The summary image shown in Figure 1A explains the in vivo setup, with the HDCF array penetrating the visual cortex and the stainless steel wire as the counter electrode.
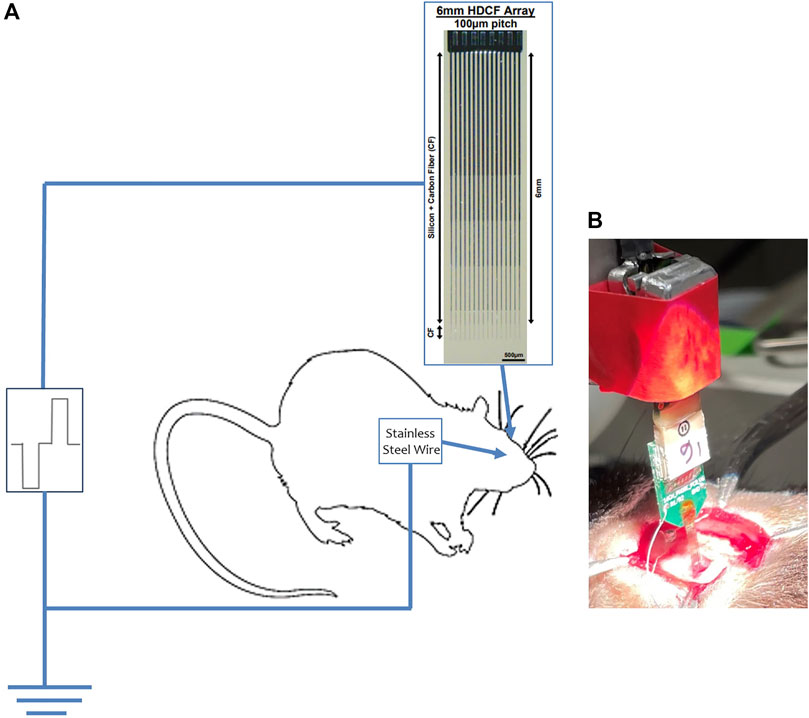
FIGURE 1. In vivo stimulation setup. (A) Explaining the in vivo setup with the HDCF array penetrating the visual cortex and the stainless steel wire as ground, both connected to the Plexim stimulator. (B) Image of the HDCF array penetrating the visual cortex.
2.7 Statistical Analysis and Electric Circuit Model
A paired t-test was used to compare impedance data for CF and PtIr-CF as well as to compare CSCC prior to and after the coating. A paired t-test was also applied to impedance data before and after pulsing both at 300 and 10 kHz. One paired t-test was done for comparing the VTpeak of the VT at the beginning and at the end of each pulse test.
Impedance before and after pulsing at both 300 Hz and 10 kHz were fitted to a circuit model (see inset of Figure 5A). The circuit model consisted of a reference electrode (r.e.), the electrolyte resistance (Ru), the admittance (Y0), and the exponent (α) of the constant phase element (CPE), the parasitic capacitance (C), and the working electrode (w.e.). The extracted parameters were statistically analyzed using a paired t-test. For all the statistical tests, Matlab R2021a was used.
3 Results
3.1 PtIr Coating Protocol Assessment
A total of 39 blowtorched CFs (distributed across five ZIF Boards) were coated with PtIr. The surface area was estimated by SEM inspection and ranged from 1900 to 3,600 μm2. The impedance data were normalized by the electrode area (Ω × cm2). An average 1 kHz normalized impedance and standard deviation of 1.74 ± 0.98 Ω × cm2 was measured for PtIr-CF. Figure 2A shows a representative impedance spectrum from before and after PtIr coating and average data at 1 kHz, normalized to surface area. A significant decrease (p-value of 1.02 × 10⁻¹⁸) in 1 kHz impedance is noted, while impedance above 100 kHz state is unchanged, indicating no change in geometric surface area.
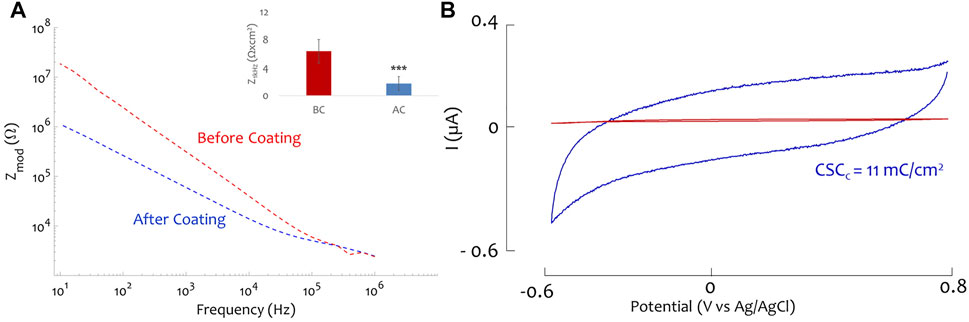
FIGURE 2. PtIr coated carbon fiber. (A) Electrochemical impedance spectroscopy (EIS) measurement of one sharpened carbon fiber before and after the plating process; as inset the mean and standard deviation of the normalized impedance is reported before (red) and after (blue) the coating, *** indicate a p-value = 1.02 × 10⁻¹⁸. (B) Cyclic voltammetry (CV) of a sharpened carbon fiber before (red) and after (blue) the PtIr plating process, the cathodic charge storage capacity of the electrode increases to 11 mC/cm2 after the coating (0.2 mC/cm2 before the coating).
In Figure 2B, the cyclic voltammetry (CV) is reported for one CF prior (red) and after the PtIr coating. From the CV, the CSCC (Cogan, 2008) can be quantified. In the example reported in Figure 2B the PtIr enhanced the CSCC from 0.2 to 11 mC/cm2. CV was done for 21 CFs and the mean and standard deviation of the CSCC was of 0.25 ± 0.13 mC/cm2 and 13.1 ± 8.74 mC/cm2 for the CF and PtIr-CF respectively. A paired t-test revealed a statistically significant difference with a p-value of 1.62 × 10⁻⁶.
To determine the
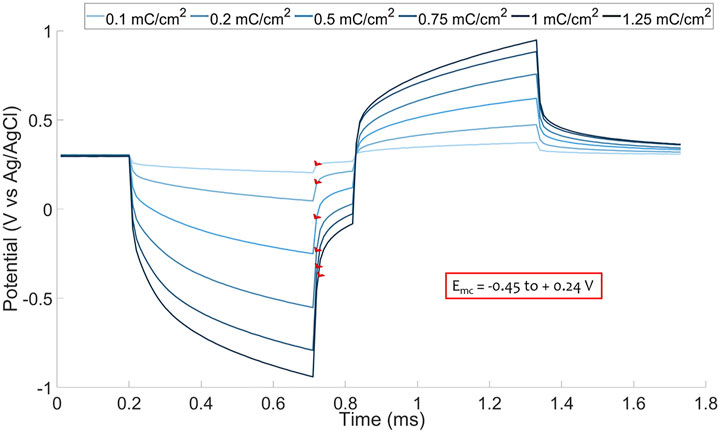
FIGURE 3.
SEM images were collected before and after the coating process. One example of a CF and a PtIr-CF is reported in Figures 4A,B respectively. The PtIr-CF surface appears homogeneously coated. Detailed SEM of three PtIr-CFs are shown in Figure 4C highlighting a rough, continuous coating. Some surface irregularities are also noted (see yellow arrow of Figure 4C). Adjacent CFs can become temporarily in contact during the plating process, which results in a ridge of PtIr along one side.
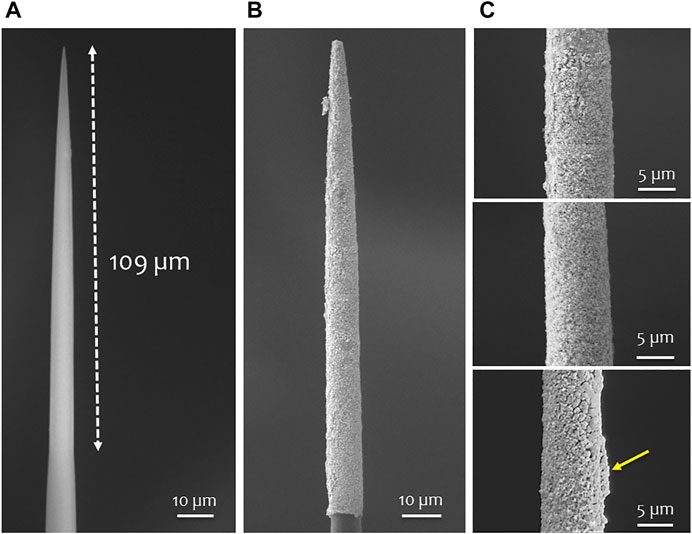
FIGURE 4. SEM of PtIr-CF. SEM of a carbon fiber with an exposed surface of 109 μm before (A) and after the PtIr coating (B); (C) SEM images of three different PtIr-CF.
EDS was done to evaluate the Pt and Ir percentage of the PtIr-CF surface. A percentage of 66% for Pt and 34% was measured on one PtIr-CF, consistent with results obtained in a previous set of coated electrodes (Della Valle et al., 2021).
3.2 Electric Pulsing Tests
3.2.1 300 Hz Electric Pulsing Tests
PtIr-CFs (N = 10, area ranging from 1900 to 2,100 μm2) were tested by applying biphasic cathodic first electric pulses of 170 μs duration at a frequency of 300 Hz (Chen et al., 2020) with a charge density of 1 mC/cm2 for 12 h on two consecutive days (6 h each day). In Figure 5A the impedance for one PtIr-CF is reported before (red solid line) and after (blue solid line) pulsing test on Day 1. An impedance decrease after the pulsing test was obtained for all pulsed PtIr-CFs on both days. Similar decreases in impedance after pulsing have been attributed to the modification of the electrode surface (Fomani and Mansour, 2011; Vomero et al., 2017). In Table 1 the mean, the standard deviation, and the p-value of the normalized impedance at 1 kHz is reported before and after pulsing on both days. The 1 kHz impedance variation before and after pulsing was statistically significant on both Day 1 and Day 2. To further analyze the impedance variation before and after pulsing, a circuit model (see inset in Figure 5A) was fitted and a paired t-test was applied to the extracted parameters. In Table 1 the mean and standard deviation for the extracted parameters is reported with the associated p-value both for Day 1 and Day 2 of pulsing tests. The CPE components values changed, but Ru was not significantly different before and after pulsing. This further supports the finding that pulsing modified the surface of the electrode (Y0 changed), but did not change the geometric shape (Ru unchanged). No geometric modification was further confirmed by the SEM images shown in Figures 5C–E. NaCl aggregation was noticed (Figure 5D) on the coated surface and confirmed by EDS (data not shown).
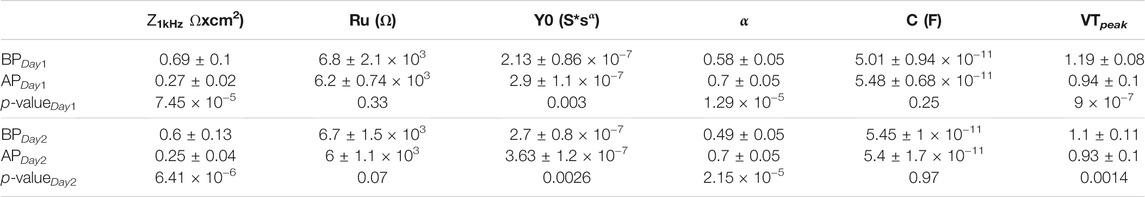
TABLE 1. Mean and standard deviation of the normalized impedance at 1 kHz, list of all components extracted from the equivalent circuit model (see inset of Figure 5A), VTpeak for Day 1 and Day 2 before and after pulsing. The p-value from the paired t-test are reported with a significance difference for the constant phase element components as well as for normalized impedance at 1 kHz and the VTpeak before and after pulsing on Day 1 and Day 2.
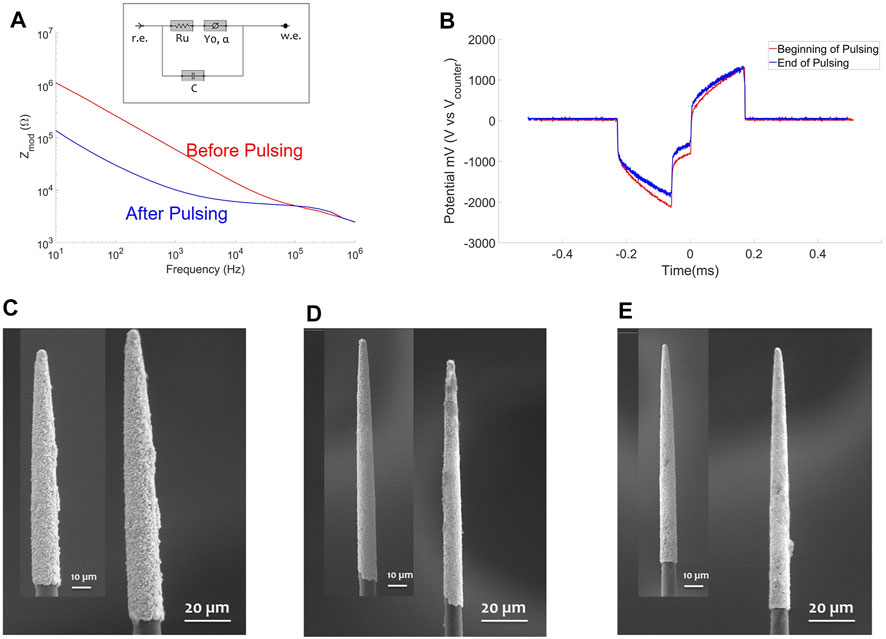
FIGURE 5. 300 Hz Electric pulse test. (A) EIS of one PtIr-CF before (red solid line) and after (blue solid line) pulsing on Day1; as inset the circuit model used for fitting impedance data is shown. (B) Voltage transient for one PtIr-CF in the beginning (red) and at the end of pulsing test (blue); a biphasic pulse of 170 μs duration and amplitude of 105 μA (1 mC/cm2) was applied. (C–E) SEM of three PtIr-CF before as inset and after 12 h of pulsing test.
VT were monitored during the pulsing test. One example is shown in Figure 5B, in red and blue are reported VT for Day 1 at the beginning and end of the pulsing tests (6 h) respectively. In Table 1 the mean and standard deviation of the VTpeak are reported for Day 1 and Day 2 of pulsing tests. The p-values from the paired t-test were statistically significant for both days (Table 1).
3.2.2 10 kHz Electric Pulse Tests
PtIr-CFs (N = 10, area ranging from 1,700 to 2,100 μm2) were tested at a frequency of 10 kHz (Kapural et al., 2015) by applying biphasic cathodic first electric pulses of 30 μs duration and a charge density of 1 mC/cm2 for 3 h.
In Figure 6A the EIS of one PtIr-CF before (red solid line) and after (blue solid line) pulsing is reported. As in the 300 Hz pulsing test, a significant reduction of the 1 kHz impedance was found after pulsing (see Table 2). A circuit model (see inset of Figure 5A) was fitted to the impedance data prior to and after pulsing tests. In Table 2 the mean and the standard deviation of the extracted parameters are reported, with a statistically significant difference for the α component of the CPE, which suggests increased capacitive behavior for the electrode surface. The increase in Y0 was not statistically significant.
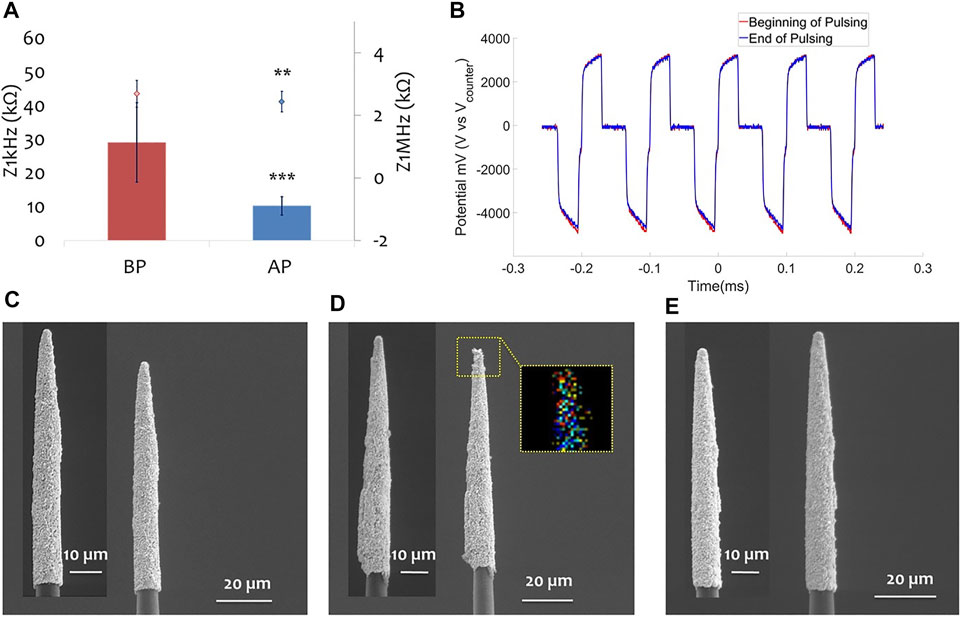
FIGURE 6. 10 kHz Electric pulse test. (A) EIS of one PtIr-CF before (red solid line) and after (blue solid line) the pulsing test. (B) Voltage transient for one PtIr-CF at the beginning (red) and at the end (blue) of pulsing test; a biphasic pulse of 30 μs duration and amplitude of 710 μA (1 mC/cm2) was applied. (C–E) SEM of three PtIr-CFs before (as inset) and after 3 h of electric pulsing, in (D) one EDS is reported as inset with highlighted (yellow box) on the tip the presence of Na (red) and Cl (yellow) molecules, in blue and cyan the Ir and Pt molecules are shown as well.
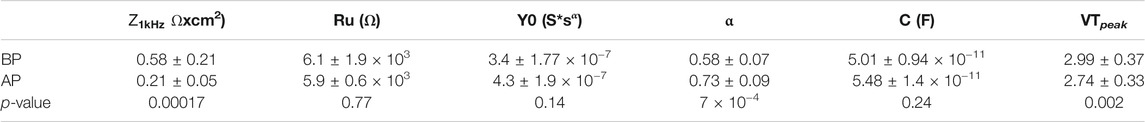
TABLE 2. Mean and standard deviation of the normalized impedance at 1 kHz, list of all components extracted from the equivalent circuit model reported as inset in Figure 5A, VTpeak before and after pulsing. The p-values from the paired t-test are reported with a significance difference for the α value of the CPE and for both normalized impedance and VTpeak.
VT were monitored for the whole pulsing test and the mean of the VTpeak at the beginning and end of pulsing is reported in Table 2. The VTpeak variation before and after the pulsing test was statistically significant. SEM inspection showed no surface modifications (Figures 6C–E), an accumulation of salt was detected on the tip of one fiber, as shown in the yellow box in Figure 6D with the corresponding EDS, showing Na and Cl molecules in red and yellow as well as in blue and cyan Ir and Pt molecules.
3.2.3 In vitro Cellular Scale PtIr-CF Pulsing Test
In vitro pulsing characterization was done using one ZIF with eight small PtIr-CFs (section 2.5.3) to show how electric pulses can be applied using a cellular scale electrode size (less than 15 μm diameter, electrode area of ∼108 μm2). In Figure 7A the impedance before and after pulsing is shown. In Figure 7B the voltage transients are reported for each current amplitude applied with a max of 784 mV applied across the electrode surface. No structure modifications occurred as confirmed by the SEM (see inset of Figure 7A).
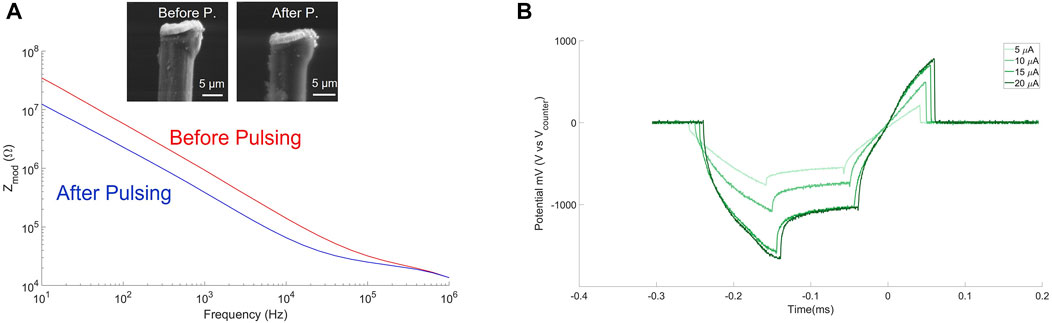
FIGURE 7. Pulsing test of cellular scale PtIr-CF. (A) Impedance before (red solid line) and after (blue solid line) pulsing for one PtIr-CF; as inset SEM image of the CF before and after pulsing test. (B) Voltage transients when applying a cathodic first biphasic pulse of 100 μs duration and gap interphase, with current amplitudes from 5 to 20 μA.
3.3 In vivo Electric Pulsing Test
One HDCF board with one coated CF (PtIr-HDCF, area–2000 μm2) was used to perform pilot tests of in vivo electric pulsing test in rat visual cortex. As explained in the method section 2.6.3, VT were first collected at 300 μm depth at four different current amplitudes as shown in Figure 8A.
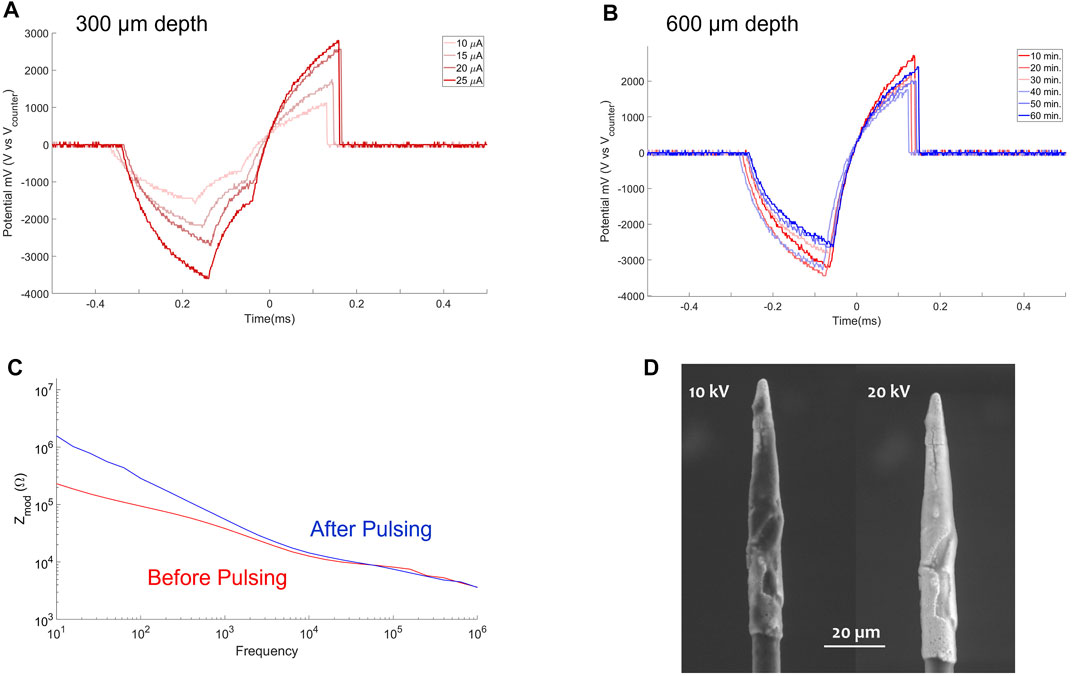
FIGURE 8. In vivo pulsing tests. (A) VT recorded in rat visual cortex at depth of 300 μm, 6,000 cathodic first biphasic pulses of 200 μs duration, 100 μs gap interphase at 50 Hz were delivered at four different current amplitudes (10, 15, 20 and 25 μA). (B) VT in vivo pulsing test (1 h) at 600 μm depth recorded every 10 min (C) PtIr-HDCF impedance before (red solid line) and after (blue solid line) the in vivo pulsing test. (D) SEM of the PtIr-HDCF after the in vivo pulsing test acquired at 10 kV (left) and 20 kV (right).
Then the PtIr-HDCF was driven at 600 μm of depth into the visual cortex. The tissue was stimulated for a total of 1 h at 25 μA (0.3 mC/cm2) and 5 μs interphase gap. VTs were collected each 10 min as shown in Figure 8B. The mean of the VTpeak was of 2.19 ± 0.3 V and a lower VT was recorded at the end of the pulsing test.
In Figure 8C the PtIr-HDCF impedance before (red solid line) and after (blue solid line) the in vivo pulsing test are reported. After the in vivo pulsing test, the impedance magnitude of the Pt-IrHDCF was slightly increased possibly due to biological tissue adhering on the electrode surface.
SEM were acquired after the in vivo pulsing test. In Figure 8D, left panel the SEM at 10 kV is reported showing in black, low conductive material adhering on the surface (e.g., biological material). On the right panel of Figure 8D the SEM at 20 kV is reported and the PtIr is visible with a crack in the PtIr film near the tip. No SEM was acquired prior to stimulation, so it is unclear when the crack formed. Since the VTs during the in vivo experiments were stable, it is more likely that the crack was due to a defect during PtIr deposition or as a result of handling during insertion or SEM preparation.
4 Discussion
The development of small microelectrodes for localized neural stimulation is the key challenge facing neural interfaces. CFEA have proven to effectively provide neural recording from the motor cortex (Patel et al., 2015, 2016; Massey et al., 2019) as well as from the peripheral nerve (Gillis et al., 2018; Dehdashtian et al., 2020; Welle et al., 2021). We recently (Della Valle et al., 2021) demonstrated how electroplated PtIr can decrease CF impedance with a good coating adherence. However, the stability of PtIr-CFs under electric pulsing test has not been investigated. In the studies presented here, we found PtIr-CFs can inject 1.25 mC/cm2 (0.5 ms pulses in PBS) while staying within the water window for PtIr. The corresponding current amplitude of 40 μA was well above published activation thresholds for cortical microstimulation (Schmidt et al., 1996). Pulse testing at 300 Hz and 10 kHz resulted in decreases in impedance and voltage transients, consistent with other studies of chronic stimulation (Fomani and Mansour, 2011). This phenomenon does not indicate electrode instability, rather a modification of the surface or cleaning of the exposed electrode area (Fomani and Mansour, 2011; Vomero et al., 2017). Two pilot experiments demonstrated stimulation, with a cellular scale electrode in vitro and a sharpened CF in the visual cortex, which also suggests relatively stable electrochemical properties. In all stimulation experiments, visual inspection with SEM found no coating loss or delamination. In general, PtIr-CF appears to be stable for the conditions tested. Our findings are comparable to other recent work on ultra microelectrodes and materials for microstimulation. Deku et al. (2018) recently developed ultrasmall silicon carbide electrodes (electrode site area from 20 to 200 μm2) coated either with titanium nitrite (TiN) and sputtered iridium oxide films (SIROF) that provided more than 1 nC/ph of charge injection within water electrolysis limits with a 200 μs pulse. Boehler et al. (Boehler et al., 2020) presented nano-structured platinum (nano-Pt) coatings that were able to provide low impedance microelectrodes (ø 35 μm) with good electric stability in response to pulsing test both in vitro (1.5 billion pulses of 1.5 mC/cm2) and in vivo over 5 weeks of implantation for recording and stimulation of mice medial septal nucleus using a 125 μm nano-Pt coated wire. Zheng et al. (2017), characterized 200 μm IrOx nano-Pt microelectrodes in vitro as potential stimulating microelectrodes providing a charge density of 1.2 mC/cm2.
Finally, voltage transient data measured in vivo includes the voltage across both the PtIr-CF electrode and the return electrode. Thus, we did not measure electrode polarization across PtIr-CF in vivo. However, it is known that electrode polarization is generally greater in vivo (Leung et al., 2014) or in model cerebrospinal fluid (Cogan et al., 2007), versus PBS solution, which we used for electrode polarization measurements (Figure 3). Our VT data showing higher voltage in vivo is consistent with these earlier studies. For the same current and pulse width, we found VTs to be two to three times greater in vivo vs. in vitro. The VT waveforms in vivo tend to be rounded, making accurate estimates of polarization difficult. Leung et al. (Leung et al., 2014), determined charge injection limits in vivo for retinal, cochlear, and subdural locations, using the same methods for determining charge injection limits in vitro. The in vivo charge injection limits they found were well below charge density limits found by post-mortem tissue assessment. The authors concluded that in vivo charge injection limits cannot be measured in the same manner as in vitro tests. EIS taken before and after in vivo pulse testing suggested no coating loss on the electrode surface, which was confirmed by SEM. We noted a crack in the coating after in vivo stimulation, but this PtIr-CF had no SEM performed prior to pulse testing. Our in vivo experiments should be considered preliminary and the next experiments will be augmented with chronic implantation and stimulation, tissue analysis, and imaging data pre and post test implant to determine the safety of stimulation with PtIr-CFs.
Data Availability Statement
The raw data supporting the conclusion of this article will be made available by the authors, without undue reservation.
Ethics Statement
The animal study was reviewed and approved by the Michigan State University Institutional Animal Care and Use Committee (IACUC).
Author Contributions
JW contributed to the conception of the study. EDV and JW contributed to the design of the study. EDV performed in vitro experiments and data curation. PRP fabricated CF and HDCF arrays. BK and QW performed in vivo experiments. All authors contributed to manuscript revision, read, and approved the submitted version.
Funding
This work was financially supported by the National Science Foundation (DMR-1625671, NSF award CBET 2129817), by the National Institutes of Health National Institute of Neurological Disorders and Stroke (UF1NS107659), the Office of the Director National Institutes of Health (OT2OD024907), the NSF-funded NeuroNex MINT hub (Multimodal Integrated Neural Technologies) at the University of Michigan under NSF 1707316, the Kellogg Vision Research Core funded by P30 EY007003 from the National Eye Institute, The University of Michigan College of Engineering, the School of Medicine, and Research to Prevent Blindness.
Conflict of Interest
The author JW has a financial interest in PtIr coating.
The remaining authors declare that the research was conducted in the absence of any commercial or financial relationships that could be construed as a potential conflict of interest.
Publisher’s Note
All claims expressed in this article are solely those of the authors and do not necessarily represent those of their affiliated organizations, or those of the publisher, the editors, and the reviewers. Any product that may be evaluated in this article, or claim that may be made by its manufacturer, is not guaranteed or endorsed by the publisher.
Acknowledgments
The authors acknowledge the Michigan Center for Materials Characterization and the Lurie Nanofabrication Facility for use of their instruments and staff assistance. The authors acknowledge technical support from Julianna Richie from the Cortical Neural Prosthetics Lab at University of Michigan.
References
A. Fomani, A., and Mansour, R. R. (2011). Fabrication and Characterization of the Flexible Neural Microprobes with Improved Structural Design. Sensors Actuators A: Phys. 168, 233–241. doi:10.1016/j.sna.2011.04.024
Ali, M. A., Hu, C., Jahan, S., Yuan, B., Saleh, M. S., Ju, E., et al. (2021). Sensing of COVID‐19 Antibodies in Seconds via Aerosol Jet Nanoprinted Reduced‐Graphene‐Oxide‐Coated 3D Electrodes. Adv. Mater. 33, 2006647. doi:10.1002/adma.202006647
Beebe, X., and Rose, T. L. (1988). Charge Injection Limits of Activated Iridium Oxide Electrodes with 0.2 Ms Pulses in Bicarbonate Buffered saline (Neurological Stimulation Application). IEEE Trans. Biomed. Eng. 35, 494–495. doi:10.1109/10.2122
Boehler, C., Vieira, D. M., Egert, U., and Asplund, M. (2020). NanoPt-A Nanostructured Electrode Coating for Neural Recording and Microstimulation. ACS Appl. Mater. Inter. 12, 14855–14865. doi:10.1021/acsami.9b22798
Cassar, I. R., Yu, C., Sambangi, J., Lee, C. D., Whalen, J. J., Petrossians, A., et al. (2019). Electrodeposited Platinum-Iridium Coating Improves In Vivo Recording Performance of Chronically Implanted Microelectrode Arrays. Biomaterials 205, 120–132. doi:10.1016/j.biomaterials.2019.03.017
Chen, X., Wang, F., Fernandez, E., and Roelfsema, P. R. (2020). Shape Perception via a High-Channel-Count Neuroprosthesis in Monkey Visual Cortex. Science 370, 1191–1196. doi:10.1126/science.abd7435
Cogan, S. F., Ludwig, K. A., Welle, C. G., and Takmakov, P. (2016). Tissue Damage Thresholds during Therapeutic Electrical Stimulation. J. Neural Eng. 13, 021001. doi:10.1088/1741-2560/13/2/021001
Cogan, S. F. (2008). Neural Stimulation and Recording Electrodes. Annu. Rev. Biomed. Eng. 10, 275–309. doi:10.1146/annurev.bioeng.10.061807.160518
Cogan, S., Peramunage, D., Smirnov, A., Ehrlich, J., Mccreery, D., and Manoonkitiwongsa, P. (2007). Polyethylenedioxythiophene (Pedot) Coatings for Neural Stimulation and Recording Electrodes. Mater. Res. Soc. Meet. Abstr. QQ2. 7.
Dalrymple, A. N., Huynh, M., Robles, U. A., Marroquin, J. B., Lee, C. D., Petrossians, A., et al. (2019). Electrochemical and Mechanical Performance of Reduced Graphene Oxide, Conductive Hydrogel, and Electrodeposited Pt-Ir Coated Electrodes: an Activein Vitrostudy. J. Neural Eng. 17, 016015. doi:10.1088/1741-2552/ab5163
Dehdashtian, A., Ursu, D., Patel, P. G., Welle, E., Chestek, C. A., Cederna, P. S., et al. (2020). Abstract 193. Plast. Reconstr. Surg. - Glob. Open 8, 131–132. doi:10.1097/01.gox.0000667828.04397.6c
Deku, F., Cohen, Y., Joshi-Imre, A., Kanneganti, A., Gardner, T. J., and Cogan, S. F. (2018). Amorphous Silicon Carbide Ultramicroelectrode Arrays for Neural Stimulation and Recording. J. Neural Eng. 15, 016007. doi:10.1088/1741-2552/aa8f8b
Della Valle, E., Welle, E. J., Chestek, C. A., and Weiland, J. D. (2021). Compositional and Morphological Properties of Platinum-Iridium Electrodeposited on Carbon Fiber Microelectrodes. J. Neural Eng. 8 (5). doi:10.1088/1741-2552/ac20bb
Dupont, S. R., Novoa, F., Voroshazi, E., and Dauskardt, R. H. (2014). Decohesion Kinetics of PEDOT:PSS Conducting Polymer Films. Adv. Funct. Mater. 24, 1325–1332. doi:10.1002/adfm.201302174
Fan, B., Rodriguez, A. V., Vercosa, D. G., Kemere, C., and Robinson, J. T. (2020). Sputtered Porous Pt for Wafer-Scale Manufacture of Low-Impedance Flexible Microelectrodes. J. Neural Eng. 17, 036029. doi:10.1088/1741-2552/ab965c
Gillis, W. F., Lissandrello, C. A., Shen, J., Pearre, B. W., Mertiri, A., Deku, F., et al. (2018). Carbon Fiber on Polyimide Ultra-microelectrodes. J. Neural Eng. 15, 016010. doi:10.1088/1741-2552/aa8c88
Goldberg, I. B., Bard, A. J., and Feldberg, S. W. (1972). Resistive Effects in Thin Electrochemical Cells. Digital Simulations of Electrochemistry in Electron Spin Resonance Cells. J. Phys. Chem. 76, 2550–2559. doi:10.1021/j100662a013
Huan, Y., Gill, J. P., Fritzinger, J. B., Patel, P. R., Richie, J. M., della Valle, E., et al. (2021). Carbon Fiber Electrodes for Intracellular Recording and Stimulation. bioRxiv.
Jiman, A. A., Ratze, D. C., Welle, E. J., Patel, P. R., Richie, J. M., Bottorff, E. C., et al. (2020). Multi-channel Intraneural Vagus Nerve Recordings with a Novel High-Density Carbon Fiber Microelectrode Array. BioRxiv 10 (1). doi:10.1038/s41598-020-72512-7
Kapural, L., Yu, C., Doust, M. W., Gliner, B. E., Vallejo, R., Sitzman, B. T., et al. (2015). Novel 10-kHz High-Frequency Therapy (HF10 Therapy) Is Superior to Traditional Low-Frequency Spinal Cord Stimulation for the Treatment of Chronic Back and Leg Pain. Anesthesiology 123, 851–860. doi:10.1097/aln.0000000000000774
Klein, J. D., Clauson, S. L., and Cogan, S. F. (1989). Morphology and Charge Capacity of Sputtered Iridium Oxide Films. J. Vacuum Sci. Tech. A: Vacuum, Surf. Films 7, 3043–3047. doi:10.1116/1.576313
Kollo, M., Racz, R., Hanna, M.-E., Obaid, A., Angle, M. R., Wray, W., et al. (2020). Chime: Cmos-Hosted In Vivo Microelectrodes for Massively Scalable Neuronal Recordings. Front. Neurosci. 14, 834. doi:10.3389/fnins.2020.00834
Kozai, T. D. Y., Langhals, N. B., Patel, P. R., Deng, X., Zhang, H., Smith, K. L., et al. (2012). Ultrasmall Implantable Composite Microelectrodes with Bioactive Surfaces for Chronic Neural Interfaces. Nat. Mater 11, 1065–1073. doi:10.1038/nmat3468
Lee, C. D., Hudak, E. M., Whalen, J. J., Petrossians, A., and Weiland, J. D. (2018). Low-impedance, High Surface Area Pt-Ir Electrodeposited on Cochlear Implant Electrodes. J. Electrochem. Soc. 165, G3015–G3017. doi:10.1149/2.0031812jes
Leung, R. T., Shivdasani, M. N., Nayagam, D. A., and Shepherd, R. K. (2014). In Vivo and In Vitro Comparison of the Charge Injection Capacity of Platinum Macroelectrodes. IEEE Trans. Biomed. Eng. 62, 849–857. doi:10.1109/TBME.2014.2366514
Massey, T. L., Santacruz, S. R., Hou, J. F., Pister, K. S. J., Carmena, J. M., and Maharbiz, M. M. (2019). A High-Density Carbon Fiber Neural Recording Array Technology. J. Neural Eng. 16, 016024. doi:10.1088/1741-2552/aae8d9
Norlin, A., Pan, J., and Leygraf, C. (2004). Investigation of Electrochemical Behavior of Stimulation/sensing Materials for Pacemaker Electrode Applications: I. Pt, Ti, and Tin Coated Electrodes. J. Electrochem. Soc. 152, J7. doi:10.1149/1.1842092
Patel, P. R., Na, K., Zhang, H., Kozai, T. D. Y., Kotov, N. A., Yoon, E., et al. (2015). Insertion of Linear 8.4μm Diameter 16 Channel Carbon Fiber Electrode Arrays for Single Unit Recordings. J. Neural Eng. 12, 046009. doi:10.1088/1741-2560/12/4/046009
Patel, P. R., Zhang, H., Robbins, M. T., Nofar, J. B., Marshall, S. P., Kobylarek, M. J., et al. (2016). Chronicin Vivostability Assessment of Carbon Fiber Microelectrode Arrays. J. Neural Eng. 13, 066002. doi:10.1088/1741-2560/13/6/066002
Polikov, V. S., Tresco, P. A., and Reichert, W. M. (2005). Response of Brain Tissue to Chronically Implanted Neural Electrodes. J. Neurosci. Methods 148, 1–18. doi:10.1016/j.jneumeth.2005.08.015
Posey, F. A., and Morozumi, T. (1966). Theory of Potentiostatic and Galvanostatic Charging of the Double Layer in Porous Electrodes. J. Electrochem. Soc. 113, 176. doi:10.1149/1.2423897
Rose, T. L., and Robblee, L. S. (1990). Electrical Stimulation with Pt Electrodes. Viii. Electrochemically Safe Charge Injection Limits with 0.2 Ms Pulses (Neuronal Application). IEEE Trans. Biomed. Eng. 37, 1118–1120. doi:10.1109/10.61038
Schmidt, E. M., Bak, M. J., Hambrecht, F. T., Kufta, C. V., O'Rourke, D. K., and Vallabhanath, P. (1996). Feasibility of a Visual Prosthesis for the Blind Based on Intracortical Micro Stimulation of the Visual Cortex. Brain 119, 507–522. doi:10.1093/brain/119.2.507
Vomero, M., Castagnola, E., Ciarpella, F., Maggiolini, E., Goshi, N., Zucchini, E., et al. (2017). Highly Stable Glassy Carbon Interfaces for Long-Term Neural Stimulation and Low-Noise Recording of Brain Activity. Sci. Rep. 7, 1–14. doi:10.1038/srep40332
Wang, Y., Graham, S., and Unsworth, C. P. (2021). Superior Galvanostatic Electrochemical Deposition of Platinum Nanograss Provides High Performance Planar Microelectrodes for In Vitro Neural Recording. J. Neural Eng. doi:10.1088/1741-2552/ac1bc1
Welle, E. J., Patel, P. R., Woods, J. E., Petrossians, A., Della Valle, E., Vega-Medina, A., et al. (2020). Ultra-small Carbon Fiber Electrode Recording Site Optimization and Improved In Vivo Chronic Recording Yield. J. Neural Eng. 17, 026037. doi:10.1088/1741-2552/ab8343
Welle, E. J., Woods, J. E., Jiman, A. A., Richie, J. M., Bottorff, E. C., Ouyang, Z., et al. (2021). Sharpened and Mechanically Durable Carbon Fiber Electrode Arrays for Neural Recording. IEEE Trans. Neural Syst. Rehabil. Eng. 29, 993–1003. doi:10.1109/tnsre.2021.3082056
Xie, C., Liu, J., Fu, T.-M., Dai, X., Zhou, W., and Lieber, C. M. (2015). Three-dimensional Macroporous Nanoelectronic Networks as Minimally Invasive Brain Probes. Nat. Mater 14, 1286–1292. doi:10.1038/nmat4427
Zeng, Q., Xia, K., Sun, B., Yin, Y., Wu, T., and Humayun, M. S. (2017). Electrodeposited Iridium Oxide on Platinum Nanocones for Improving Neural Stimulation Microelectrodes. Electrochimica Acta 237, 152–159. doi:10.1016/j.electacta.2017.03.213
Zhou, D. M. (2005). Platinum Electrode and Method for Manufacturing the Same. US Patent 6 (974), 533. [Dataset].
Keywords: carbon fiber microelectrode (CFME), PtIr coating, microstimulation, in vivo stimulation, in vitro stimulation
Citation: della Valle E, Koo B, Patel PR, Whitsitt Q, Purcell EK, Chestek CA and Weiland JD (2021) Electrodeposited Platinum Iridium Enables Microstimulation With Carbon Fiber Electrodes. Front. Nanotechnol. 3:782883. doi: 10.3389/fnano.2021.782883
Received: 24 September 2021; Accepted: 10 November 2021;
Published: 02 December 2021.
Edited by:
Hui Fang, Dartmouth College, United StatesReviewed by:
Hyowon Lee, Purdue University, United StatesWonryung Lee, Korea Institute of Science and Technology, South Korea
Yongli Qi, Dartmouth College, United States
Copyright © 2021 della Valle, Koo, Patel, Whitsitt, Purcell, Chestek and Weiland. This is an open-access article distributed under the terms of the Creative Commons Attribution License (CC BY). The use, distribution or reproduction in other forums is permitted, provided the original author(s) and the copyright owner(s) are credited and that the original publication in this journal is cited, in accordance with accepted academic practice. No use, distribution or reproduction is permitted which does not comply with these terms.
*Correspondence: Elena della Valle, ZWxkZWxsYXZAdW1pY2guZWR1