 Yang Xin
 Shi Yun
 Lu Yuhe1†
 Qin Kunming
 Li Weidong
94% of researchers rate our articles as excellent or good
Learn more about the work of our research integrity team to safeguard the quality of each article we publish.
Find out more
ORIGINAL RESEARCH article
Front. Nanotechnol., 18 November 2021
Sec. Biomedical Nanotechnology
Volume 3 - 2021 | https://doi.org/10.3389/fnano.2021.748791
In this research, we sought to surmount the poor dissolvability and transdermal absorption rate of licorice flavonoids (LFs) by fabricating a LFs microemulsion. LFs content was determined using high performance liquid chromatography. Initial studies such as dissolution testing, emulsification testing, and pseudo ternary phase diagram generation were implemented for screening components and optimized adopting the central composite design. While the tested responses were solubility, droplet size and PDI, thirteen trials were performed using two different variables, oil percentage and optimized emulsifier and co-emulsifier ratio. Microemulsions were then characterized for droplet size, PDI, transmission electron microscopy, viscosity, electrical conductivity, pH, entrapment efficiency, drug content and stability. Additionally, skin release profile, percutaneous absorption and retention were investigated adopting Franz diffusion cell. The optimal formulation was found to compose of laureth-9 (emulsifier, 6.72 g), propylene glycol (co-emulsifier, 1.80 g), isopropyl myristate (IPM, oil, 1.48 g), LFs (1.50 g) and at least more than 85% deionized water. The optimized and storage for 3 months of microemulsion was found to clear, light yellow color without phase separation or precipitation indicated the stability of the preparation to long-term placement. The mean droplet size, PDI, entrapment efficiency and drug content were discovered as 12.68 ± 0.12 nm, 0.049 ± 0.005, 97.28 ± 0.13% and 122.67 ± 0.40 mg·g−1, respectively. Furthermore, the optimal formulation sustained release LFs, remarkably deliver more LFs through the skin layer (644.95 ± 6.73 μg cm−2) and significantly retained LFs in the skin layer (9.98 μg cm−2). The study concluded that optimized microemulsion has potential and enhanced the dissolvability and cumulative penetration amount of LFs.
Skin pigmentation is a result of melanin produced by melanocytes in the epidermis (Zhang et al., 2020). When the skin is over-exposed to factors such as ultraviolet rays and intense visible light, melanin will be overproduced and accumulated, leading to hyperpigmentation, freckles, melasma and other diseases (Lakhan and Lynch, 2021). Pigmented disorders are frequently related to severe psychological and social impacts on patients. Some disorders can be difficult and resistant to treatment (Rachmin et al., 2020). Many agents for treatment of skin hyperpigmentation have been developed. Arbutin, a tyrosinase inhibitor, etc. is widely marketed. (Migas and Krauze-Baranowska, 2015). However, arbutin derivatives are generally cytotoxic, limiting their application to some range (Rainforest et al., 2019). Other agents, such as kouji acid, hydroquinone and its derivatives, etc. have the same problem (Agrawal and Sharma, 2017; Saeedi et al., 2019; Hasil et al., 2020). Therefore, it is pressing to search a secure and healthy skin topical drug. The medical and cosmetic field is increasingly attracting attention to products of natural origin, especially those of herbs with pharmacological effects including flavonoids (Faccio, 2020).
Licorice is one of the most abroad used herbal remedies worldwide. It is a highly trophic and therapeutic botanical medicine widely used as food and remedy (Zhang and Ye, 2009). In recent years, licorice flavonoids (LFs) abstracted from licorice roots have received wide attention due to their significant bioactivity (Jiang et al., 2020). The major components of LFs were licochalcone A, glabridin, licoflavone, and licoflavone B (Fu et al., 2013). LFs is one of the three active elements of Licorice, which has the functions of anti-inflammation, anti-oxidation, whitening, anti-aging, enhancing cardiovascular function, enhancing immunity and hypoglycemic, etc (Dal Bosco et al., 2019; Luo et al., 2019; Ruan et al., 2020; Sun et al., 2020; Yang et al., 2020; Reda et al., 2021) Besides, LFs have many applications in food, medicine, cosmetics and other industries (Castangia et al., 2015; Kazemi et al., 2020). The whitening active ingredients of licorice are mainly flavonoids, which have many pharmacological activities, but the water dissolvability and slow dissolution speed of LFs are poor, which restricts the development and utilization of LFs in antioxidant function and transdermal absorption (Wang et al., 2019). It is the inevitable trend of future development to adopt new preparation technology to overcome the above-mentioned problems, so as to treat diseases such as pigmentation and to better exert the whitening effect.
A different to conquer these limitations is the use of nanotechnology-based products such as microemulsions (Ephrem et al., 2017). The microemulsion is a dispersion setup composed of oil phase, aqueous phase, and surfactants/co-surfactants. The droplet size ranges from 10 to 100 nm. It has optical isotropy and thermodynamic stability (Callender et al., 2017). The profits of microemulsions involve improved dissolvability, especially for poorly soluble and unstable medicines, and increased bioavailability of the active compounds (Kuchlyan et al., 2016). Besides, the microemulsion constituent can assist as a penetration enhancer, thereby increasing the rate of drug penetration through the skin (Shukla et al., 2018). Moreover, microemulsion safeguards dissolved drugs from needless degradation during long-term storage (Alves et al., 2020). In the past few years, thermodynamic stability, enhanced medicine dissolvability, and increased permeability are some of the key reasons that prompted researchers to vigorously study microemulsions. It is becoming more and more important due to its remarkable efficiency in enhancing drug penetration through the transdermal route (Laothaweerungsawat et al., 2020).
The research and development of a pharmaceutical microemulsion system is intricate and requires validation through robust experimental design (Agrawal et al., 2021). The current study was concentrated on developing a transdermal microemulsion of LFs by applying appropriate combinations and ratios of oil, emulsifiers and co-emulsifiers, to increase medicine penetration through the skin with enhanced safety. Initially, supersaturated dissolvability study of drug was performed to choose a favorable range of oils, emulsifiers and co-emulsifiers. Secondly, Pseudo-ternary phase diagrams were created to search the optimal consistencies range of chosen components. The optimization was carried out by using central composite design (CCD) for the best formulation combination in terms of droplet size, PDI and viscosity. In addition, we also carried out ex vivo studies such as skin penetration via the Franz diffusion cell. The permeability of the drug through mice skin in vitro study and stability of formulations were all evaluated for their clinical usability of LFs microemulsion.
Licorice Flavonoids was purchased from Xi’an Xilong Biological Technology Co., Ltd (China). Glabridin standard (purity≥ 98%) was provided by Chengdu Pusi Biotechnology Co., Ltd (China). Olive oil, Polysorbate 20 (tween 20), Polysorbate 80 (tween 80) was purchased from Guangzhou Yulu Chemical Co., Ltd (China). laureth-9, PEG-40 Hydrogenated castor oil (PEG-40), butylene glycol, dimethicone were bought from Shandong Yousuo Chemical Technology Co., Ltd (China). Glycerin was bought from Sumi Asih (Malaysia). Isopropyl myristate (IPM) was purchased from Croda (Britain). Propylene glycol was obtained from SKC (Korea). Other reagents and solvents such as acetonitrile and methanol used in this research were of chromatographic and analytical grade, all the reagents and solvents were obtained from Sinopharm Chemical Reagent Co., Ltd (China).
The ICR mice (18–22 g) used in this research, SPF grade, were provided by the Pizhou Dongfang Breeding Co., Ltd. (China) (License number: RB0972-212340). The animals were maintained at standard ambient temperature with 12 h day/night cycle and fed standard pellets and water. The experimental protocol was prepared in accordance with the World Medical Association Code of Ethics.
Through reversed phase column based HPLC (RP-HPLC), the quantities of Glabridin from samples prepared were quantified with Shimadzu an LC-20AD HPLC system (USA). The HPLC mensurable system contained an LC-20AD pump, an ODS-A column (5μm, 4.6 × 250 mm, YMC-Pack, Japan), a CTO-20AC column oven and an SPD-20A UV detector. Acetonitrile and 0.1% formic acid water solution (60:40, v/v) were used as the mobile phase at a flowing stream of 1.0 mlmin−1 with 20 μl infusion bulk. Meanwhile, the temperature detection wavelengths of the column oven were chosen at 30 C and 293 nm, respectively. A standard curve for the quantification of Glabridin according to the preparation and HPLC analysis of a series of standard solutions of Glabridin at different concentrations was constructed as follows.
where A represents the peak area and C indicates Glabridin concentration.
The R2 value of the standard curve equation was 0.9999 and 0.9995 for samples prepared, respectively. Both equations were linear ranging from 5.0 μg mL−1 to 150 μg mL−1 (1) and 0.54 μg mL−1 to 16.2 μg mL−1 (2), respectively.
To aid in the initial screening of many excipients for further formulation exploitation, the dissolvability of LFs in different excipients was evaluated according to the beforehand reported instrument (Goindi et al., 2015). Dissolvability study for LFs were done separately using different oils, surfactants, and cosurfactants. The oils used for the study were dimethicone, olive oil, and Isopropyl myristate. The emulsifiers tested were tween 80, tween 20, laureth-9 and PEG-40. The co-emulsifiers were Glycerin, propylene glycol, and butylene glycol. All the excipients inspected are listed in the cosmetic raw materials list. Briefly, excess LFs were placed in 2 ml test tubes containing 1 g of its vehicle and kept in a thermostated water bath shaker for 48 h at 37 ± 1 °C to dissolve LFs in situ on the vehicle. After 48 h, the mix was centrifuged (Scilogex, United States) at 10,000 rpm for 15 min. Supernatants were taken and displayed with sufficient methanol. Afterward, A portion (20 µl) of the dilution was directed to HPLC to assess vehicle loading capacity. Means that provided LFs maximum solubility were selected for experiments.
In order to test the compatibility between the distinct emulsifiers and oils, different weight ratios of oil and emulsifiers, namely 1:9, 2:8, 3:7, 4:6, 5:5, 6:4, 7:3, gently stir with a magnetic stirrer for 10 min. After that, the mixing aliquot (1 ml)and 50 ml of water (37 C) were gently stirred with a magnetic stirrer (Liu et al., 2020). Properties such as self-emulsification time and appearance were visually assessed and evaluated in light of the grading system, while emulsification tendency and progression of emulsion droplets were observed. (shown in Table 1).

TABLE 1. Visual test grading system used to evaluate self-emulsification performance.
In this research, PTPD was exploited using Origin 9.0 software (OriginLab, USA) to determine the emulsifying region of LFs microemulsion formulations and shrink the coverage of emulsifier, co-emulsifier and oil in the following step. Pseudo-ternary phase diagrams of LFs microemulsion including various proportions of oils, emulsifier/co-emulsifier were generated using water titration method with little modification as described in previous studies (Franklyne et al., 2021). The weight ratio of oil to the system is shown in W (oil) and the weight ratio of emulsifier to co-emulsifier in Km. To choose the optimal co-emulsifier, the weight ratio of emulsifier and co-emulsifier mixture (Km = 2) to oil was 1: 9, 2: 8, 3: 7, 4: 6, 5: 5, 6: 4. 7: 3, 8: 2 and 9: 1. In order to select the optimum ratio of Km and oil dosage range, the ratios of emulsifier to co-emulsifier mixtures (Km) were as follows 6:1,5:1,4:1,3:1,2:1,1:1,1:2 and 1:3 while the different weights of oil W (oil) to Km were mixed at ratios of 1:9, 2:8, 3:7, 4:6, 5:5, 6:4, 7:3, 8:2 and 9:1. The general weight (1.0 g) of the mixture of emulsifiers with each oil and co-emulsifier was titrated with distilled water while gently stirring with a magnetic stirrer at room temperature until the solution became clear, transparent and fluid. Then, Pseudo ternary state plots were plotted by recording the mass fractions of each of the oils, the mixture of emulsifiers with emulsifiers, and distilled water.
Statistically, a central composite design (CCD) was applied for the optimization process of formulation (Design expert software, version 12, Stat-Ease, Inc. Minneapolis-United States) (Mandpe et al., 2021). In this experiment, CCD was used to investigate two variables: the weight percentage of the W (oil) and the range of the Km. Five test levels (−α; −1; 0; +1; +α) where α = 2n/4; and n is the number of parameters corresponding to a central point. The specific factor level settings are shown in Table 2. The selected responses were dissolvability (Y1), droplet size (Y2) and polydispersity index (PDI) (Y3). With these properties, the CCD recommended 13 formulation runs and the corresponding values of the dependent variables were entered into the CCD software through experiments. Finally, limits were applied to the responses to obtain an optimized formula.
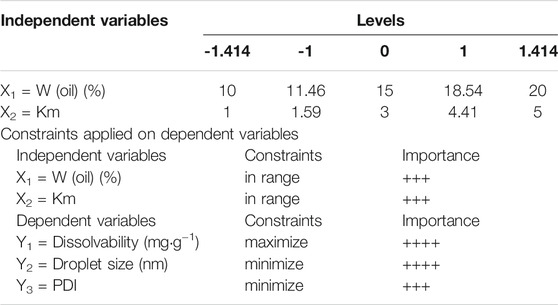
TABLE 2. Selected independent variables and their levels.
According to the results of the above experiment, IPM, laureth-9, and propylene glycol were used as vehicles to prepare LFs microemulsion. Briefly, LFs (1.50 g) were dissolved in self-microemulsion, containing IPM (1.48 g), laureth-9 (6.72 g) and propylene glycol (1.80 g). After the mixture was mixed with a magnetic stirrer, a homogeneous and steady system was obtained. afterward, disperse the LFs self-microemulsion (1 g) formulation in 50 ml deionized water with gentle mixing to obtain an LFs microemulsion.
The droplets size and PDI of LFs microemulsion pellets were evaluated by dynamic light Malvern Zetasizer (Malvern Instruments Ltd., Malvern, UK) at 25°C. All measurements were performed in triplicates (Wan et al., 2017).
The viscosity of the developed formulation was determined by the NDJ-8S viscometer (Shanghai JiTai Electronics Technology Co., Ltd, China). Preparations were cup in a container and temperature was kept at 35 ± 1°C in a water bath. Spindle no. 64 was used to apply a cutting speed of 60 rpm to the prepared formulations (Akilu et al., 2019).
The pH of optimized LFs microemulsion was examined by using an already calibrated pH-meter (PHS-3E pH Tutor, Shanghai Rex Xinjing Instrument Co., Ltd., China) (Poh et al., 2019).
The morphological feature of TAC-TPGS-ME was defined by electron transfer of a microscope (TEM, JEM1400, Tokyo, Japan). Briefly, the LFs microemulsion was immersed in the Formvar coated grid for 30 s retention. More ME was wiped off with a filter paper, then 100 µl of 2% aqueous phosphatic acid solution was dripped onto the grid and reserved for 1–2 min for negative staining, then continued with a thorough flush. grid with a filter paper. The copper grid was pre-dried with indoor air.
The electrical conductivity was surveyed by a digital conductivity meter (model DDS-307, Shanghai Rex Xinjing Instrument Co., Ltd., China). Measurements were made on microemulsion samples that were successively diluted with water to 90 wt%. After immersing the electrode until it reached equilibrium and the reading was stable (Fanun, 2008). The temperature was maintained at 25 ± 0.1°C and kept by the bath temperature.
For the determination of DC 10 g of LFs self-microemulsion was prepared. In this formulation, 1.50 g of LFs was ensured. A known amount (0.1 g) of this preparation was removed, diluted appropriately with methanol and filtered through a 0.22 Pm nylon filter. Analysis of a sample of the diluted preparation (20 µl) was performed by HPLC. DC was determined according to the formula:
The EE of the formulated LFs microemulsion was ascertained based on earlier work which employed centrifugal ultrafiltration technique (Ghadiri et al., 2012). The diluted LFs self-microemulsion aqueous solution (3.0 mg·ml−1) was placed in centrifuge tubes before centrifugation at 10,000 rpm for 30 min to guarantee complete removal of the unencapsulated LFs microemulsion. The dilution of encapsulated and unencapsulated LFs microemulsions was performed with acetonitrile (HPLC grade), respectively, to a final volume of 10 ml. Finally, a sample of the diluted formulation (20 µl) was analyzed by HPLC. The following equations were used to calculate EE:
The stability study of the optimized LFs microemulsion was conducted at 5 ± 2°C, 25 ± 2°C and 40 ± 2°C for 6 months. It was filled in collapsible painted aluminum tubes and stored for a certain period of time. Samples were taken and analyzed for droplet size, drug content, and pH. Other transforms in parameters such as transparency and color change were inspected visually. The physical stability of the LFs microemulsion was evaluated by centrifuging the optimized formulation at 10,000 rpm for 25 min (Amuti et al., 2021).
Female ICR mice weighing 18–22 g were selected and killed using anesthetic ether. The abdominal hair was carefully trimmed with an electric razor and the rat abdominal skin was exfoliated. Any fat and residues were eliminated from the rat skin. Experiment with fresh mice skin. All procedures were authorized by the Committee of Animal Ethicals in the Faculty of Pharmacy, Jiangsu Ocean University.
Franz diffusion cells (model TK-12D, Shanghai Yuyan Instrument Co., Ltd., China) were used in the in vitro percutaneous absorption researches. Treated skin samples were placed on a vertical glass diffusion cell with the stratum corneum facing up. The chamber provides a 1.767 cm2 diffusion surface with a receptor chamber capacity of 7 ml. To ensure sink conditions, 50% (v/v) ethanol in phosphate buffered saline (pH 7.4) and 50% (v/v) ethanol in normal saline was used as the receptor fluid. The ethanol receptor was used to provide sink conditions in skin permeation researches with lipophilic drugs including LFs (Mishra et al., 2018). In addition, due to the more complex ingredients in traditional Chinese medicine, studies have used higher concentrations of ethanol to ensure that the effective ingredients can be absorbed through the skin (El Khayat et al., 2018; Zhou G et al., 2020). The high-purity LFs used in the experiment are extremely difficult to dissolve in water, and have low transdermal solubility when the concentration of phosphate buffered saline or normal saline is high. Therefore, 50% (v/v) ethanol in phosphate buffered saline (pH 7.4) and 50% (v/v) ethanol in normal saline were used as the receiving fluid in this experiment. Diffusion cells were placed in a thermostatic water bath. The receptor fluid was stirred at 100 rpm and kept at 37 C ± 0.5°C. A test formulation (1.5 ml) was encased into the donor chamber before sealing it with aluminum foil. Samples (2 ml) were taken at the indicated times (0.5, 1, 2, 3, 4, 5, 6, 8 and 10 h) and immediately replenished with an equal volume of the latest receptor fluid after each specimen. All determinations were made in triplicate and results are presented as mean ± SD. The drug content of each specimen was evaluated by HPLC.
Cumulative amount of drug (Qn, μg·cm−2) released to the receptor from LFs microemulsions for time (t, h) was calculated using the following equation (Zewail et al., 2021).
Where
The skin sample after the percutaneous absorption study of 10 h was removed and cut off the effective surface area of the skin, and rinsed thoroughly with acquiring fluid until all residues of the preparation were removed. The skin was then completely cut into pieces and placed in a bottle having 2 ml of methanol. The bottle was kept in an ultrasonic bath for 15 min. The resulting methanol was pipetted into a microcentrifuge tube and centrifuged for 15 min at 10,000 rpm and 25 °C. The amount of LFs in the supernatant was determined by HPLC. All formulations were tested in triplicate. The amount of LFs in skin retention (D, μg·cm−2) was calculated by the following equation.
Qs = LFs amount in stratum corneum,
P = skin penetration area.
As higher drug solubility typically contributes to higher drug loading efficiency, it is imperative to test the solubility of LFs in various oils, emulsifiers and co-emulsifiers, which may increase oral bioavailability (Shewaiter et al., 2021). The dissolvability of LFs in various vehicles was presented in Table 3. According to the measurement results, in order to increase the loading of LFs in the microemulsion, the experiment preliminarily determined that olive oil (5.63 ± 0.12 mg·g−1) and Isopropyl myristate (6.21 ± 0.20 mg·g−1) were used as the oil phase; laureth-9 (124.34 ± 1.18 mg·g−1) and tween 20 (119.42 ± 0.94 mg·g−1) were used as emulsifiers; propylene glycol and butylene glycol acts as co-emulsifiers.
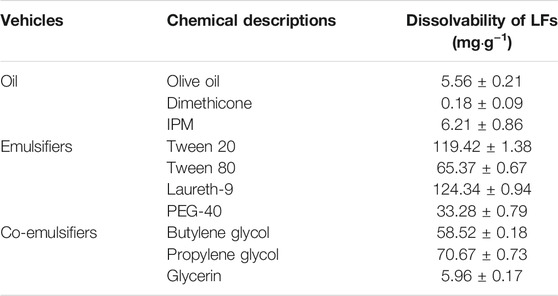
TABLE 3. Dissolvability of LFs in different vehicles. Data are mean ± SD (n = 3).
The compatibility effect between oil and emulsifier is one of the important factors affecting the quality of microemulsion. When the oil and emulsifier have a good compatibility effect, the stability and emulsifying effect of the microemulsion can be improved; on the contrary, the microemulsion may not achieve the ideal emulsifying effect, it is easy to flocculate during the placement process and the stability is poor (Villanueva-Martínez et al., 2020). The experimental results are shown in Table 4. It can be seen from the table that the emulsification effect of IPM is better than Olive oil in the compatibility of different oils and emulsifiers. Among the emulsifiers, laureth-9 has the best emulsification ability. The highest A rating is obtained when IPM is compatible with laureth-9. Therefore, IPM and laureth-9 were identified as the oil and emulsifier in the formulation, respectively.
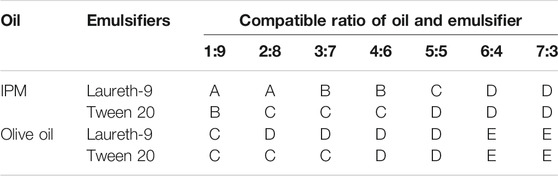
TABLE 4. Compatibility test between emulsifiers and oils.
The creation of phase diagrams facilitates the determination of the concentration scope of the components for the range of presence of the microemulsion (Park et al., 2021). pseudo-ternary phase diagrams were created by water titration means at room temperature (Buyuktimkin, 2020). The pseudo-ternary phase diagrams of ME, composed of IPM as oil, laureth-9 as emulsifiers, propylene glycol and butylene glycol as co-emulsifiers, were investigated at Km of 2. The effect of different co-emulsifiers on the micro emulsifying efficiency was shown in Figure 1. Compared to butylene glycol, larger microemulsion region was inspected when propylene glycol was used as the co-emulsifiers. This reveals that compared with butylene glycol, propylene glycol has better self-emulsification efficiency. Hence, propylene glycol was chosen as an excellent co-emulsifier for microemulsion.
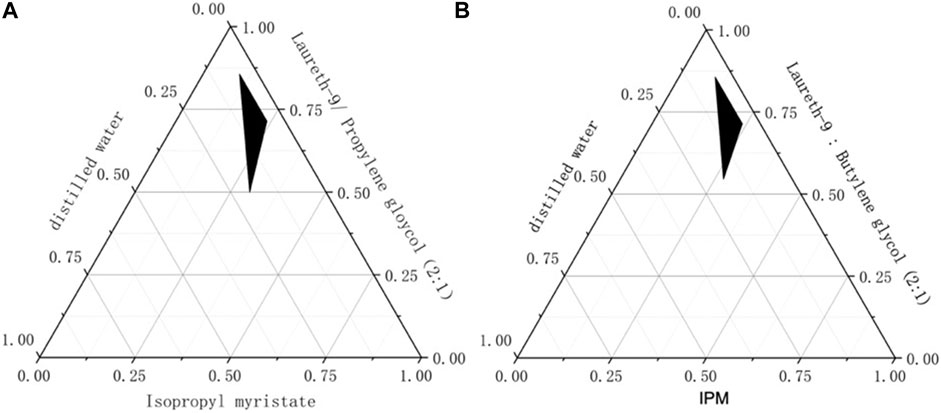
FIGURE 1. The pseudo-ternary phase diagrams for co-emulsifier (A): Propylene glycol as the co-emulsifier (B): Butylene glycol as the co-emulsifier.
Km is an important factor in the preparation of the microemulsion. The pseudo-ternary phase diagrams are shown in Figure 2, IPM as oil phase and various Km (mixture of laureth-9 and propylene glycol at a ratio of 6:1, 5:1, 4:1, 3:1, 2:1, 1:1, 1:2 and 1:3), and distilled water as the water phase. It can be seen from these phase diagrams that Km = 4 has the biggest microemulsion area (shaded area). The microe mulsifying zone tended to expand with increases Km; when Km
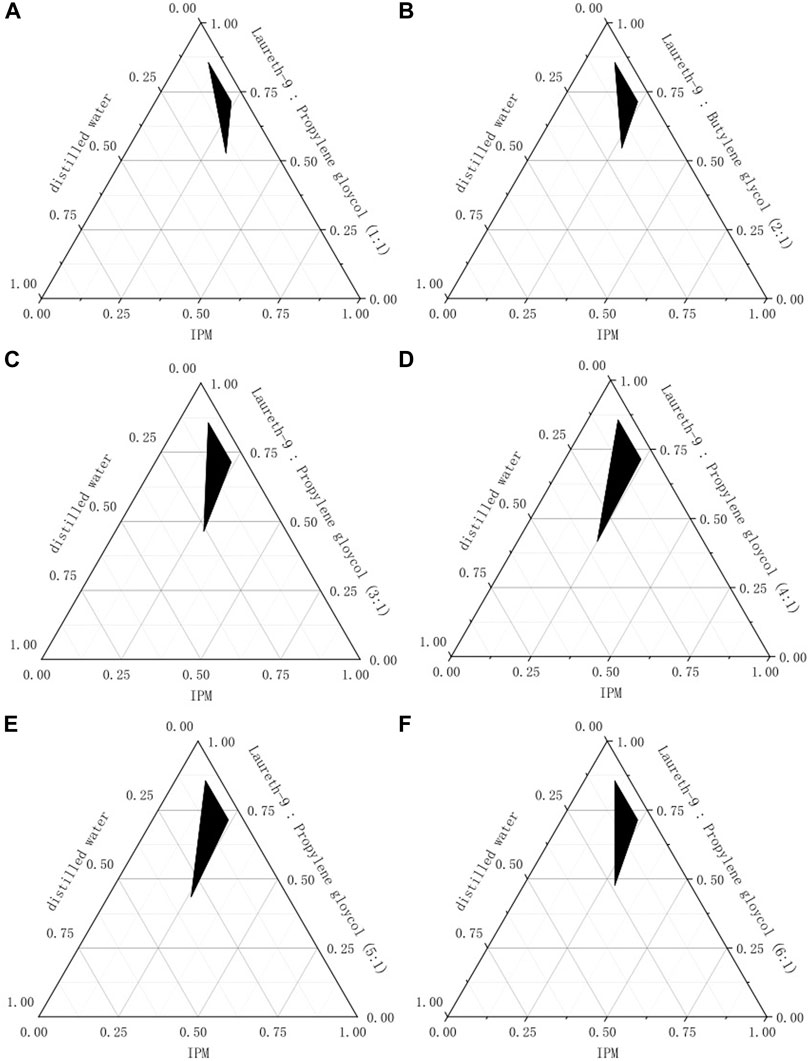
FIGURE 2. The pseudo-ternary phase diagrams for Km (A): Km = 1 (B): Km = 2 (C): Km = 3 (D): Km = 4 (E): Km = 5 (E): Km = 6.
The dosage range of IPM can also be drawn in this process. The pseudo-ternary phase diagrams are described in Figure 3. As can be seen from the figure, when W (oil) is lower than 0.1, it is a coarse emulsion; when W (oil) is higher than 0.2, microemulsion cannot be formed; when the content of W (oil) is within the range of 0.1–0.2, uniform and transparent microemulsions can be emulsified in this area. Therefore, this oil weight ratio ranging from 10 to 20% was chosen for the next test.
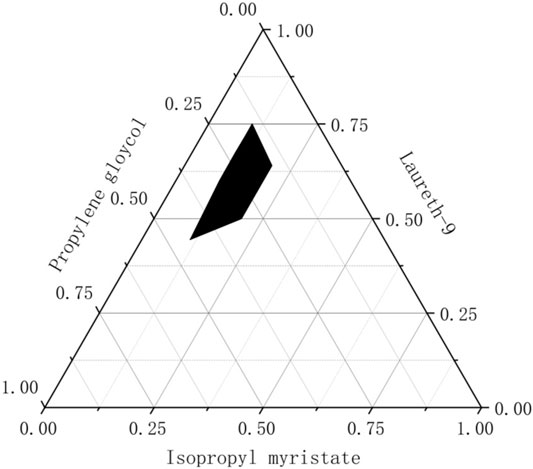
FIGURE 3. The pseudo-ternary phase diagrams for W (oil).
Optimization of the formulations was accomplished by using design expert with two distinct variables (X1-W (oil) and X2-Km) and three responses (Y1-Dissolvability, Y2-Globule size and Y3-PDI) for diverse formulations. The model has 13 trial runs as described in Table 5. The minimum and maximum Dissolvability of developed formulations ranged from 82.47 (mg·g−1) to 126.49 (mg·g−1). The experimental upper and lower values for droplet size and PDI were found to be 13.85–29.75nm and 0.038 to 0.214 respectively. Regression calculations generated by the software helped determine the type of fit of the polynomial model to the chosen responses. The most suitable polynomial model for Dissolvability (Y1), droplet size (Y2) and PDI (Y3) were found to be quadratic (p-value < 0.005).
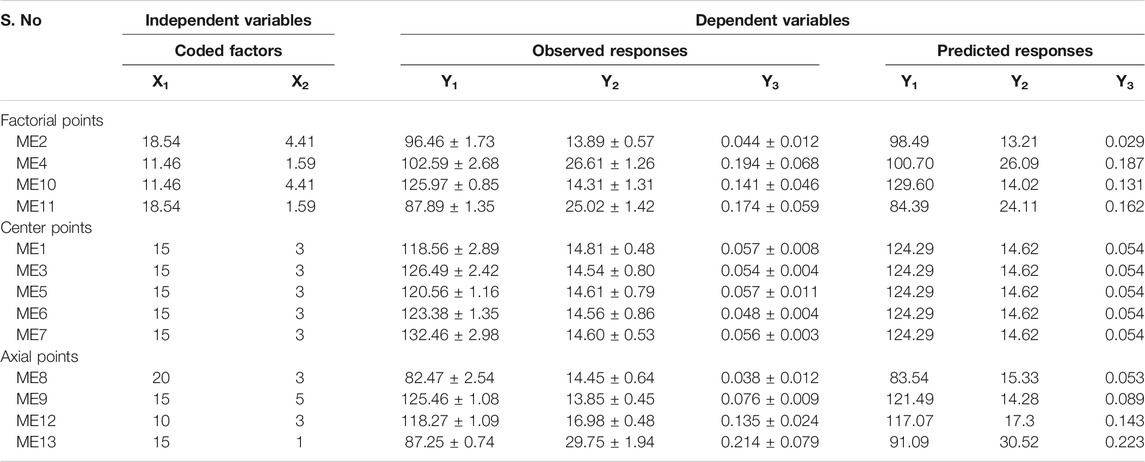
TABLE 5. Effect of independent variables on dependent variables.
As shown in Table 6, the high R2 of 0.9496 (Dissolvability),0.9911 (Droplet size) and 0.9764 (PDI) deduced that the model fitted well. The diversity among Predicted R2 (0.8216-Dissolvability, 0.9376-Droplet size and 0.9595-PDI) and the Adjusted R2 (0.9137-Dissolvability, 0.9848-Droplet size and 0.8386-PDI) was <0.2, which indicated that the predicted R2 is compatible with the reasonably adjusted R2. Usually, the sensitivity of the Adeq is used to measure the signal-to-noise ratio at >4, while the ratio of 13.1774 (Dissolvability), 36.8464 (Droplet size) and 22.4309 (PDI) indicated an adequate signal and excellent model competence. Overall, these results verify the adequacy of the model terms to stand for the trial data and forecast the three parameters analysed (Ge et al., 2014). The following sets of formulas provide polynomial model fitting equations for all three responses.

TABLE 6. Model fit summary and analysis of variance (ANOVA) for dependent variables.
Usually, Response surface and contour maps can intuitively reflect the factors and response values as well as the interaction between each factor (Gull et al., 2020). Figure 4 Shows a 3D graph of the response surface and contour based on change (W-oil and Km) and the response (Dissolvability, Droplet size and PDI). It can be obtained from Figure 4, when Km is constant, the solubilization effect of microemulsion on LFs increases slowly at first and then decreases slowly with the increase of W (oil). The Droplet size decreases first and then increases with the increase of W (oil). PDI decreases first and then increases slowly with the increase of W (oil); When W (oil) is constant, the solubilization effect of microemulsion on LFs increases first and then decreases slowly with the increase of Km. PDI decreases first and then increases with the increase of Km. The Droplet size always decreases with the increase of Km.
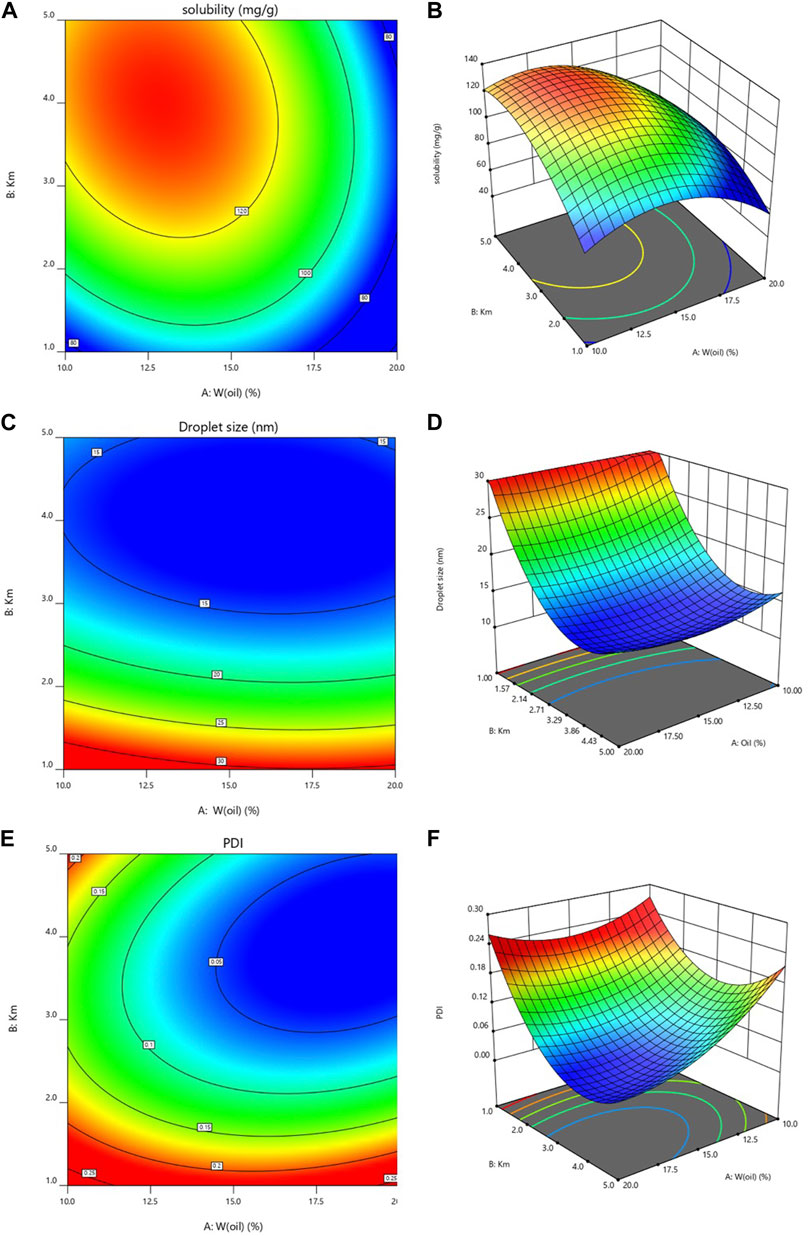
FIGURE 4. Three-dimensional (3D) response surface (A): dissolvability; (C): Droplet size; (E): PDI) and contour plot (B): dissolvability; (D): Droplet size; (F): PDI.
The optimal conditions for the preparation of LFs microemulsion were Km = 3.73 and W (oil) = 14.76% under the conditions of minimum droplet size, PDI and maximum dissolvability. The optimal formulation of LFs microemulsion was composed of 14.76% IPM and 67.22% laureth-9 and 18.02% propylene-glycol.
The predicted formulation was the oil phase taking the percentage of 14.76% and the Km at a ratio of 3.73. The predicted dissolvability, particle size and PDI were 128.29 ± 0.00 mg·g−1, 12.74 ± 0.00 nm and 0.046 ± 0.00, respectively. In order to validate the predicted results, the predicted and observed responses for the optimized incorporation of the LFs microemulsion were compared and the result is presented in Table 7. The observed dissolvability, particle size and PDI are 126.76 ± 1.74 mg·g−1, 12.76 ± 0.48 nm and 0.047 ± 0.03, respectively. More importantly, there is no significant diversity among the predicted value of each indicator and the measured value, indicating that the experimental design of the study is appropriate.
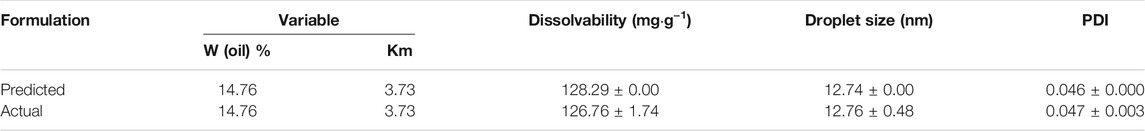
TABLE 7. Predicted and observed response for optimized LFs microemulsion composition.
According to the results of the laboratory, the dissolvability of the optimal microemulsion formulation for LFs was 126.76 mg·g−1. It was found in experiments that when the dosage of the drug was more than 150 mg·g−1, the microemulsion diluted with water would precipitate out after 24 h. The reason might be that when the dissolvability was too large, the microemulsion system could not form a stable interface film and LFs crystals precipitated out. Therefore, the dosage of LFs in the prescription was determined to be 150 mg·g−1.
The droplet size and PDI of the LFs microemulsion estimated from the software were 12.80 nm and 0.050, respectively. Experimental mean droplet size and PDI values were found to be 12.68 ± 0.12 nm and 0.049 ± 0.005, respectively. A representative droplet size distribution plot is shown in Figure 5. The viscosity and pH of the optimized formulation were recorded as 3.05 ± 0.35 cPs and 7.8 ± 0.25, respectively. pH was close to normal skin, implying its relative compatibility with the skin.
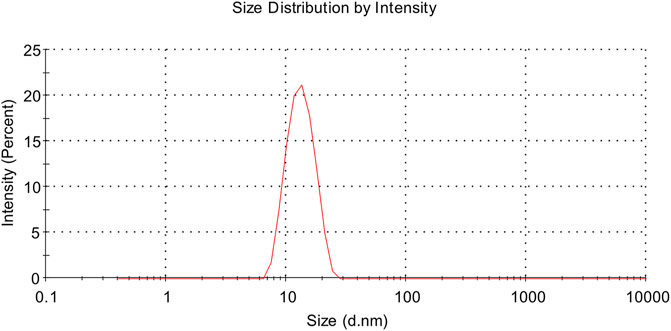
FIGURE 5. Representative droplet size distribution graph of LFs microemulsion.
TEM micrograph of the optimized preparations was obtained. The granule morphology of the LFs microemulsion is shown in Figure 6. The TEM image showed that the nanoparticles were nearly spherical and had homogeneous droplet size. The homogeneous spherical droplets presented in the photomicrograph show a nanosized in the recommended range for ME systems and a homogeneous distribution without agglomeration.
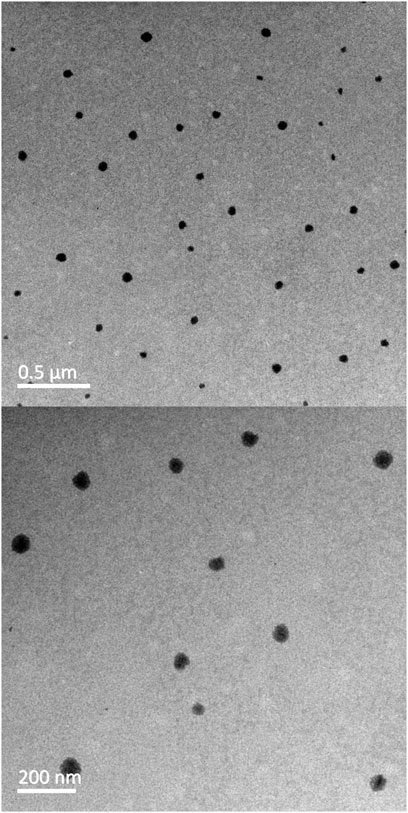
FIGURE 6. Transmission electron micrographs of LFs microemulsion.
Conductivity measurement can supply a useful message of microstructural transitions occurring in microemulsion systems (Bharatiya et al., 2016). Figure 5 shows the change curve of microemulsion conductivity with the aqueous phase. After the aqueous phase dilution reaches 30 wt% aqueous phase, a precipitous and linear raise of conductivity is noticed, which is due to the emergence of percolation behavior (Guo et al., 2019). This phenomenon means that the addition of the aqueous phase causes swelling of the W/O micelles. The viscous collision between water droplets leads to droplet melting, in which conductive channels are well developed. However, when aqueous phase increases up to 60 wt%, conductivity causes the individual droplets to develop into a network of conductive channels and B.C. the structure emerges (Hathout and Nasr, 2013). After that, with the addition of the aqueous phase, the conductivity gradually decreased and the structure changed to an O/W microemulsion. Thus, the conductivity measurement results (as shown in Figure 7) describe the continuous microstructural transitions in LFs microemulsions from W/O micelles to B.C. type (between 60 wt% ∼ 75 wt% aqueous phases) after dilution of the aqueous phase. finally, to O/W structure (more than 75 wt% aqueous phases).
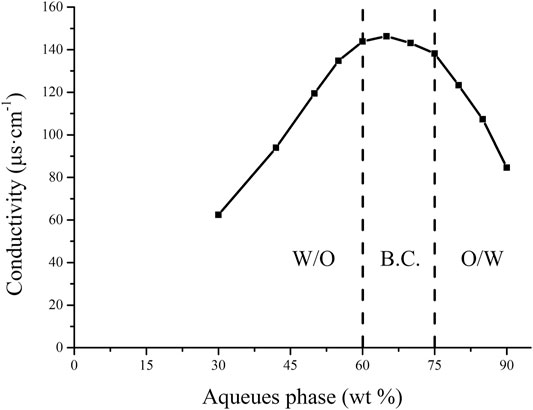
FIGURE 7. The change curve of the electrical conductivity of the microemulsion with the aqueues phase.
In fact, the determination of EE and DC is an important factor in evaluating the physical properties of liposomes, solid lipid nanoparticles and micro emulsification of nanoemulsions (Shewaiter et al., 2021). Therefore, EE and DC are frequently used as formulation screening indicators, as a satisfactory, clear and stable formulation is usually characterized by high EE and DC.
Herein, the calculated EE and DC of LFs microemulsion were 97.28 ± 0.13% and 122.67 ± 0.40 mg·g−1, respectively. As the water content increases, the drug content will decrease. In comparison with other microemulsions (Kaur et al., 2017), The EE and DC predicted in this research was higher, indicating that LFs are mostly incorporated into the microemulsion. Thus, the LFs microemulsion prepared in this research met the target of obtaining a satisfactory drug delivery system with higher EE and DC.
The stability study of the optimized LFs microemulsion showed that after 6 months of storage at different temperatures, the microemulsion was transparent without discoloration (Figure 8). The drug content in stored formulations of the optimized LFs microemulsion changed slightly after testing. Organoleptic features such as droplet size and physical appearance were also noticed and no significant transforms were found. Centrifuge examinations showed excellent physical stability of all preparations. The O/W structure of the optimized LFs microemulsion with an observed pH range of 7.5–8.5 provided a favorable condition to prevent drug hydrolysis.
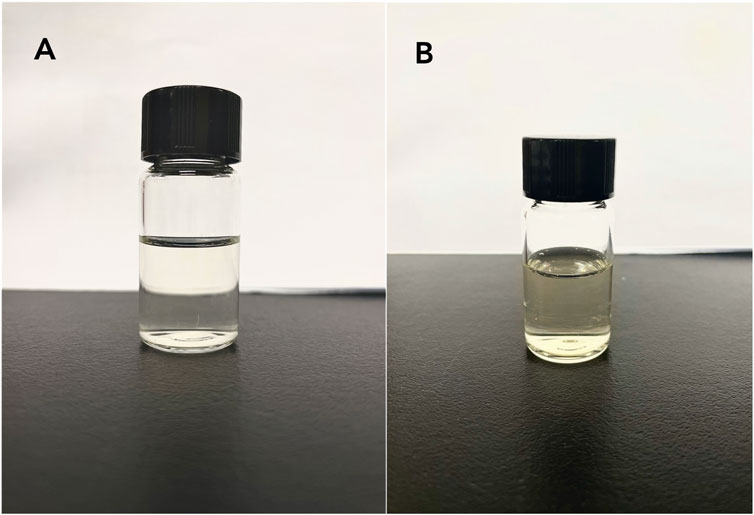
FIGURE 8. Long-term stability of LFs microemulsion (A): freshly prepared (B): stored for 6 months.
Evaluation of transdermal absorption is one of the main experimental steps in evaluating transdermal drug delivery systems (Patel et al., 2020). The permeation data is expressed as a cumulative amount of drug permeated as a function of time. After the drug penetration reaches a steady state, the slope of the straight line portion is the penetration rate of the drug (
Where
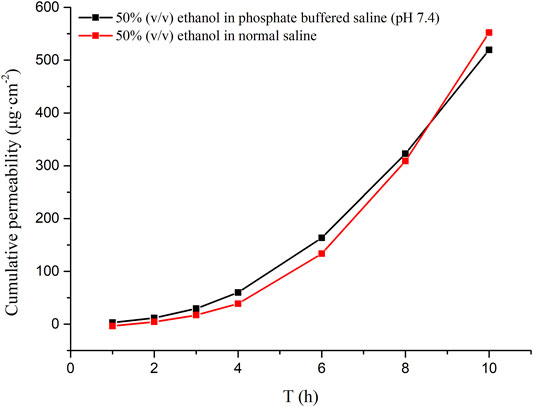
FIGURE 9. Cumulative penetration rate-time curve of LFs microemulsion.

TABLE 8. Comparison of in vitro transdermal performance of two different receptor fluids.
The skin retention of LFs microemulsion was 4.25 and 9.98 μg for different receptor fluids (Figure 10). After 10 h of in vitro administration, the skin retention of LFs microemulsion in phosphate buffer saline with 50% (v/v) ethanol was twice of normal saline with 50% (v/v) ethanol. The reason for this may be that the normal saline increases the permeability rate of the drug, which reduces the drug retention in the skin (Goindi et al., 2015). There were residues of LFs microemulsion in the two different medium conditions, which further indicated that LFs microemulsion could stay in the skin, and could prolong the time of active ingredients in the skin, and had a better effect.
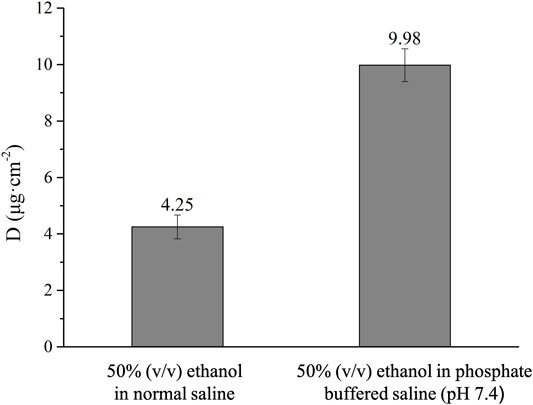
FIGURE 10. The retention of LFs microemulsion in the skin of ICR mice after 10 h transdermal.
The whitening active ingredients of licorice are mainly flavonoids, which have many pharmacological activities, but the water dissolvability and slow dissolution rate of LFs are poor, which restricts the development and utilization of LFs in antioxidant function and In the transdermal absorption (Liu et al., 2013). In this study, O/W microemulsion system of LFs was formulated and evaluated by the water titration method. firstly, the pseudo ternary phase diagram was prepared for distinct ratios and different types of emulsifiers and co-emulsifier and the best ratio range of W (oil) % and Km was deemed to be appropriate for further study. Optimization of the formulation was done by the CCD-optimal design using two variables (percent of weight of oil phase and Km) and three response variables (dissolvability, droplet size and PDI). We formulated an optimal LFs microemulsion system comprising the cosmetically acceptable components laureth-9/IPM/propylene glycol/water. The characteristics of optimized LFs microemulsion viz., TEM, droplet size, PDI, viscosity, pH, EE and DC were within acceptable ranges. More importantly, the initial stability study showed that the LFs microemulsion was satisfactorily stable over the test period under a convention storage environment. The cumulative release rate of LFs microemulsion in-vitro was great, suggesting that LFs dissolvability was substantially improved.
The original contributions presented in the study are included in the article/supplementary material, Further inquiries can be directed to the corresponding authors.
The animal study was reviewed and approved by Pizhou Dongfang Breeding Co., Ltd.(China) (License number: RB0972-212340).
All authors listed have made a substantial, direct, and intellectual contribution to the work and approved it for publication.
This work was supported by the Scientific Research and Practice Innovation Project of Jiangsu Province, China (the program number is SJCX20_1214), and the Chinese Medicine Administration Bureau of Jiangsu Province (YB2020109).
The authors declare that the research was conducted in the absence of any commercial or financial relationships that could be construed as a potential conflict of interest.
All claims expressed in this article are solely those of the authors and do not necessarily represent those of their affiliated organizations, or those of the publisher, the editors and the reviewers. Any product that may be evaluated in this article, or claim that may be made by its manufacturer, is not guaranteed or endorsed by the publisher.
Agrawal, S. S., and Sharma, P. (2017). Current Status of Mercury Level in Skin Whitening Creams. Curr. Med. Res. Pract. 7, 47–50. doi:10.1016/j.cmrp.2017.02.001
Agrawal, V., Patel, R., Patel, M., Thanki, K., and Mishra, S. (2021). Design and Evaluation of Microemulsion-Based Efinaconazole Formulations for Targeted Treatment of Onychomycosis Through Transungual Route: Ex Vivo and Nail Clipping Studies. Colloids Surf. B: Biointerf. 201, 111652. doi:10.1016/j.colsurfb.2021.111652
Akilu, S., Baheta, A. T., Kadirgama, K., Padmanabhan, E., and Sharma, K. V. (2019). Viscosity, Electrical and thermal Conductivities of Ethylene and Propylene Glycol-Based β-SiC Nanofluids. J. Mol. Liquids 284, 780–792. doi:10.1016/j.molliq.2019.03.159
Alves, L. P., da Silva Oliveira, K., da Paixão Santos, J. A., da Silva Leite, J. M., Rocha, B. P., de Lucena Nogueira, P., et al. (2020). A Review on Developments and Prospects of Anti-Inflammatory in Microemulsions. J. Drug Deliv. Sci. Technol. 60, 102008. doi:10.1016/j.jddst.2020.102008
Amuti, A., Wang, X., Zan, M., Lv, S., and Wang, Z. (2021). Formulation and Characterization of Curcumin-Loaded Microemulsions: Evaluation of Antioxidant Stability and In Vitro Release. J. Mol. Liquids 336, 116881. doi:10.1016/j.molliq.2021.116881
Bharatiya, B., Hassan, P. A., and Sastry, N. V. (2016). Formulation of Pyridinium Based RTIL-In-Cyclohexane Microemulsions: Investigations on Size, Conductivity and Molecular Interactions. J. Mol. Liquids 218, 586–594. doi:10.1016/j.molliq.2016.03.013
Buyuktimkin, T. (2020). Water Titration Studies on Microemulsions with a Nonionic Surfactant Derived from castor Oil and a Series of Polar Oils. J. Drug Deliv. Sci. Technol. 56, 101521. doi:10.1016/j.jddst.2020.101521
Callender, S. P., Mathews, J. A., Kobernyk, K., and Wettig, S. D. (2017). Microemulsion Utility in Pharmaceuticals: Implications for Multi-Drug Delivery. Int. J. Pharm. 526, 425–442. doi:10.1016/j.ijpharm.2017.05.005
Castangia, I., Caddeo, C., Manca, M. L., Casu, L., Latorre, A. C., Díez-Sales, O., et al. (2015). Delivery of Liquorice Extract by Liposomes and Hyalurosomes to Protect the Skin against Oxidative Stress Injuries. Carbohydr. Polym. 134, 657–663. doi:10.1016/j.carbpol.2015.08.037
Dal Bosco, A., Mattioli, S., Matics, Z., Szendrő, Z., Gerencsér, Z., Mancinelli, A. C., et al. (2019). The Antioxidant Effectiveness of Liquorice (Glycyrrhiza Glabra L.) Extract Administered as Dietary Supplementation And/or as a Burger Additive in Rabbit Meat. Meat Sci. 158, 107921. doi:10.1016/j.meatsci.2019.107921
El Khayat, N. W., Donia, A. A., Mady, O. Y., and El Maghraby, G. M. (2018). Optimization of Eugenol Microemulsion for Transdermal Delivery of Indomethacin. J. Drug Deliv. Sci. Technol. 48, 311–318. doi:10.1016/j.jddst.2018.10.006
Ephrem, E., Elaissari, H., and Greige-Gerges, H. (2017). Improvement of Skin Whitening Agents Efficiency through Encapsulation: Current State of Knowledge. Int. J. Pharm. 526, 50–68. doi:10.1016/j.ijpharm.2017.04.020
Faccio, G. (2020). Plant Complexity and Cosmetic Innovation. iScience 23, 101358. doi:10.1016/j.isci.2020.101358
Fanun, M. (2008). A Study of the Properties of Mixed Nonionic Surfactants Microemulsions by NMR, SAXS, Viscosity and Conductivity. J. Mol. Liquids 142, 103–110. doi:10.1016/j.molliq.2008.05.006
Franklyne, J. S., Ebenazer L, A. A., Mukherjee, A., and Chandrasekaran, N. (2021). Role of Triclosan Microemulsion against Triclosan Resistant Clones of Bacterial Pathogens. J. Drug Deliv. Sci. Technol. 61, 102158. doi:10.1016/j.jddst.2020.102158
Fu, Y., Chen, J., Li, Y.-J., Zheng, Y.-F., and Li, P. (2013). Antioxidant and Anti-inflammatory Activities of Six Flavonoids Separated from Licorice. Food Chem. 141, 1063–1071. doi:10.1016/j.foodchem.2013.03.089
Ge, S., Lin, Y., Lu, H., Li, Q., He, J., Chen, B., et al. (2014). Percutaneous Delivery of Econazole Using Microemulsion as Vehicle: Formulation, Evaluation and Vesicle-Skin Interaction. Int. J. Pharm. 465, 120–131. doi:10.1016/j.ijpharm.2014.02.012
Ghadiri, M., Fatemi, S., Vatanara, A., Doroud, D., Najafabadi, A. R., Darabi, M., et al. (2012). Loading Hydrophilic Drug in Solid Lipid media as Nanoparticles: Statistical Modeling of Entrapment Efficiency and Particle Size. Int. J. Pharm. 424, 128–137. doi:10.1016/j.ijpharm.2011.12.037
Goindi, S., Kaur, R., and Kaur, R. (2015). An Ionic Liquid-In-Water Microemulsion as a Potential Carrier for Topical Delivery of Poorly Water Soluble Drug: Development, Ex-Vivo and In-Vivo Evaluation. Int. J. Pharm. 495, 913–923. doi:10.1016/j.ijpharm.2015.09.066
Gull, A., Ahmed, S., Ahmad, F. J., Nagaich, U., and Chandra, A. (2020). Effect of Polyherbal Microemulsion on Staphylococcus Epidermidis: Formulation Development, CCD Based Optimization, Characterization, and Antibacterial Activity by Scanning Electron Microscopy. J. Drug Deliv. Sci. Technol. 57, 101641. doi:10.1016/j.jddst.2020.101641
Guo, J., Zhang, L., Wang, Y., Liu, T., and Gu, X. (2019). Microstructural Transitions in β-carotene Loaded Nonionic Microemulsions upon Aqueous Phase Dilution. Colloids Surf. A: Physicochem. Eng. Aspects 567, 288–296. doi:10.1016/j.colsurfa.2019.01.041
Hasil, A., Mehmood, A., Noureen, S., and Ahmed, M. (2020). Experimental and Theoretical Charge Density Analysis of Skin Whitening Agent Kojic Acid. J. Mol. Struct. 1216, 128295. doi:10.1016/j.molstruc.2020.128295
Hathout, R. M., and Nasr, M. (2013). Transdermal Delivery of Betahistine Hydrochloride Using Microemulsions: Physical Characterization, Biophysical Assessment, Confocal Imaging and Permeation Studies. Colloids Surf. B: Biointerf. 110, 254–260. doi:10.1016/j.colsurfb.2013.05.007
Jiang, M., Zhao, S., Yang, S., Lin, X., He, X., Wei, X., et al. (2020). An "essential Herbal Medicine"-Licorice: A Review of Phytochemicals and its Effects in Combination Preparations. J. Ethnopharmacol. 249, 112439. doi:10.1016/j.jep.2019.112439
Kaur, A., KamalpreetSharma, G., Sharma, G., Verma, S., Goindi, S., and Katare, O. P. (2017). Oral Microemulsion of Phytoconstituent Found in Licorice as Chemopreventive against Benzo( a )pyrene Induced Forestomach Tumors in Experimental Mice Model. J. Drug Deliv. Sci. Technol. 39, 523–530. doi:10.1016/j.jddst.2017.05.006
Kazemi, M., Mohammadifar, M., Aghadavoud, E., Vakili, Z., Aarabi, M. H., and Talaei, S. A. (2020). Deep Skin Wound Healing Potential of Lavender Essential Oil and Licorice Extract in a Nanoemulsion Form: Biochemical, Histopathological and Gene Expression Evidences. J. Tissue Viability 29, 116–124. doi:10.1016/j.jtv.2020.03.004
Kuchlyan, J., Kundu, N., and sarkar, N. (2016). Ionic Liquids in Microemulsions: Formulation and Characterization. Curr. Opin. Colloid Interf. Sci. 25, 27–38. doi:10.1016/j.cocis.2016.05.011
Lakhan, M. K., and Lynch, M. (2021). Skin Pigmentation. Medicine 49, 447–452. doi:10.1016/j.mpmed.2021.04.010
Laothaweerungsawat, N., Neimkhum, W., Anuchapreeda, S., Sirithunyalug, J., and Chaiyana, W. (2020). Transdermal Delivery Enhancement of Carvacrol from Origanum Vulgare L. Essential Oil by Microemulsion. Int. J. Pharm. 579, 119052. doi:10.1016/j.ijpharm.2020.119052
Liu, H., Wang, J., Zhou, W., Wang, Y., and Yang, L. (2013). Systems Approaches and Polypharmacology for Drug Discovery from Herbal Medicines: An Example Using Licorice. J. Ethnopharmacol. 146, 773–793. doi:10.1016/j.jep.2013.02.004
Liu, J., Wang, Q., Omari-Siaw, E., Adu-Frimpong, M., Liu, J., Xu, X., et al. (2020). Enhanced Oral Bioavailability of Bisdemethoxycurcumin-Loaded Self-Microemulsifying Drug Delivery System: Formulation Design, In Vitro and In Vivo Evaluation. Int. J. Pharm. 590, 119887. doi:10.1016/j.ijpharm.2020.119887
Luo, Z., Guo, Z., Xiao, T., Liu, H., Su, G., and Zhao, Y. (2019). Enrichment of Total Flavones and Licochalcone A from Licorice Residues and its Hypoglycemic Activity. J. Chromatogr. B. 1114-1115, 134–145. doi:10.1016/j.jchromb.2019.01.026
Mandpe, S. R., Parate, V. R., and Naik, J. B. (2021). Method Optimization and Analysis of Flurbiprofen Loaded Eudragit L100 Nanoparticles Using RP-HPLC Technique: A central Composite Design Approach. Mater. Today Proc. 45, 4777–4786. doi:10.1016/j.matpr.2021.01.210
Migas, P., and Krauze-Baranowska, M. (2015). The Significance of Arbutin and its Derivatives in Therapy and Cosmetics. Phytochem. Lett. 13, 35–40. doi:10.1016/j.phytol.2015.05.015
Mishra, B., Sahoo, S. K., and Sahoo, S. (2018). Liranaftate Loaded Xanthan Gum Based Hydrogel for Topical Delivery: Physical Properties and Ex-Vivo Permeability. Int. J. Biol. Macromol. 107, 1717–1723. doi:10.1016/j.ijbiomac.2017.10.039
Park, C., Zuo, J., Somayaji, V., Lee, B.-J., and Löbenberg, R. (2021). Development of a Novel Cannabinoid-Loaded Microemulsion towards an Improved Stability and Transdermal Delivery. Int. J. Pharm. 604, 120766. doi:10.1016/j.ijpharm.2021.120766
Patel, D. K., Kesharwani, R., and Kumar, V. (2020). Etodolac Loaded Solid Lipid Nanoparticle Based Topical Gel for Enhanced Skin Delivery. Biocatal. Agric. Biotechnol. 29, 101810. doi:10.1016/j.bcab.2020.101810
Poh, Y., Ng, S., and Ho, K. (2019). Formulation and Characterisation of 1-Ethyl-3-Methylimidazolium Acetate-In-Oil Microemulsions as the Potential Vehicle for Drug Delivery across the Skin Barrier. J. Mol. Liquids 273, 339–345. doi:10.1016/j.molliq.2018.10.034
Rachmin, I., Ostrowski, S. M., Weng, Q. Y., and Fisher, D. E. (2020). Topical Treatment Strategies to Manipulate Human Skin Pigmentation. Adv. Drug Deliv. Rev. 153, 65–71. doi:10.1016/j.addr.2020.02.002
Rainforest, J., Casteleijn, D., Bowman, D., Breakspear, I., and Pinder, T.-A. (2019). Natural Products Regulation - Getting the Balance Right. The Case of Arbutin. Adv. Integr. Med. 6, 95–96. doi:10.1016/j.aimed.2019.01.006
Reda, F. M., El-Saadony, M. T., El-Rayes, T. K., Farahat, M., Attia, G., and Alagawany, M. (2021). Dietary Effect of Licorice (Glycyrrhiza Glabra) on Quail Performance, Carcass, Blood Metabolites and Intestinal Microbiota. Poult. Sci. 100, 101266. doi:10.1016/j.psj.2021.101266
Ruan, S., Xiang, S., Wu, W., Cao, S., Du, Q., Wang, Z., et al. (2020). Potential Role of mTORC1 and the PI3K-Akt Pathway in Anti-acne Properties of Licorice Flavonoids. J. Funct. Foods 70, 103968. doi:10.1016/j.jff.2020.103968
Saeedi, M., Eslamifar, M., and Khezri, K. (2019). Kojic Acid Applications in Cosmetic and Pharmaceutical Preparations. Biomed. Pharmacother. 110, 582–593. doi:10.1016/j.biopha.2018.12.006
Shewaiter, M. A., Hammady, T. M., El-Gindy, A., Hammadi, S. H., and Gad, S. (2021). Formulation and Characterization of Leflunomide/diclofenac Sodium Microemulsion Base-Gel for the Transdermal Treatment of Inflammatory Joint Diseases. J. Drug Deliv. Sci. Technol. 61, 102110. doi:10.1016/j.jddst.2020.102110
Shukla, T., Upmanyu, N., Agrawal, M., Saraf, S., Saraf, S., and Alexander, A. (2018). Biomedical Applications of Microemulsion through Dermal and Transdermal Route. Biomed. Pharmacother. 108, 1477–1494. doi:10.1016/j.biopha.2018.10.021
Sun, P., Liu, X., Pan, Q., Zhang, X., and He, S. (2020). Comparison of Chinese Licorice (Glycyrrhiza Uralensis) Granules and Water Extracts and Investigation of Their Antibacterial Activities for Veterinary Application. Eur. J. Integr. Med. 36, 101115. doi:10.1016/j.eujim.2020.101115
Villanueva-Martínez, A., Hernández-Rizo, L., and Ganem-Rondero, A. (2020). Evaluating Two Nanocarrier Systems for the Transdermal Delivery of Sodium Alendronate. Int. J. Pharm. 582, 119312. doi:10.1016/j.ijpharm.2020.119312
Wan, T., Pan, J., Long, Y., Yu, K., Wang, Y., Pan, W., et al. (2017). Dual Roles of TPGS Based Microemulsion for Tacrolimus: Enhancing the Percutaneous Delivery and Anti-psoriatic Efficacy. Int. J. Pharm. 528, 511–523. doi:10.1016/j.ijpharm.2017.06.050
Wang, Z., Zhao, X., Zu, Y., Wu, W., Li, Y., Guo, Z., et al. (2019). Licorice Flavonoids Nanoparticles Prepared by Liquid Antisolvent Re-crystallization Exhibit Higher Oral Bioavailability and Antioxidant Activity in Rat. J. Funct. Foods 57, 190–201. doi:10.1016/j.jff.2019.04.010
Yang, L., Jiang, Y., Zhang, Z., Hou, J., Tian, S., and Liu, Y. (2020). The Anti-diabetic Activity of Licorice, a Widely Used Chinese Herb. J. Ethnopharmacol. 263, 113216. doi:10.1016/j.jep.2020.113216
You, J., Meng, S., Ning, Y.-K., Yang, L.-Q., Zhang, X.-W., Wang, H.-N., et al. (2019). Development and Application of an Osthole Microemulsion Hydrogel for External Drug Evaluation. J. Drug Deliv. Sci. Technol. 54, 101331. doi:10.1016/j.jddst.2019.101331
Zewail, M. B., El-Gizawy, S. A., Osman, M. A., and Haggag, Y. A. (2021). Preparation and In Vitro Characterization of a Novel Self-Nano Emulsifying Drug Delivery System for a Fixed-Dose Combination of Candesartan Cilexetil and Hydrochlorothiazide. J. Drug Deliv. Sci. Technol. 61, 102320. doi:10.1016/j.jddst.2021.102320
Zhang, Q., and Ye, M. (2009). Chemical Analysis of the Chinese Herbal Medicine Gan-Cao (Licorice). J. Chromatogr. A 1216, 1954–1969. doi:10.1016/j.chroma.2008.07.072
Zhang, L. Q., Zhang, X. P., Hao, Y. Y., Zhang, B. L., and Guo, X. D. (2020). Codelivery of Hydrophilic and Hydrophobic Drugs in a Microneedle Patch for the Treatment of Skin Pigmentation. J. Ind. Eng. Chem. 88, 241–250. doi:10.1016/j.jiec.2020.04.019
Keywords: licorice flavonoids, microemulsion, central composite design, pseudo ternary phase diagram, formulation evaluation, transdermal delivery
Citation: Xin Y, Yun S, Yuhe L, Yinxue M, Shurui N, Yue Z, Kunming Q and Weidong L (2021) Development of Licorice Flavonoids Loaded Microemulsion for Transdermal Delivery Using CCD-Optimal Experimental Approach: Formulation Development and Characterization. Front. Nanotechnol. 3:748791. doi: 10.3389/fnano.2021.748791
Received: 13 September 2021; Accepted: 22 October 2021;
Published: 18 November 2021.
Edited by:
Zhiqing Pang, Fudan University, ChinaReviewed by:
Bo Zhang, Huazhong University of Science and Technology, ChinaCopyright © 2021 Xin, Yun, Yuhe, Yinxue, Shurui, Yue, Kunming and Weidong. This is an open-access article distributed under the terms of the Creative Commons Attribution License (CC BY). The use, distribution or reproduction in other forums is permitted, provided the original author(s) and the copyright owner(s) are credited and that the original publication in this journal is cited, in accordance with accepted academic practice. No use, distribution or reproduction is permitted which does not comply with these terms.
*Correspondence: Qin Kunming, cWlua20xMjNAMTI2LmNvbQ==; Li Weidong, bGl3ZWlkb25nMDgwMUAxNjMuY29t
†These authors have contributed equally to this work
Disclaimer: All claims expressed in this article are solely those of the authors and do not necessarily represent those of their affiliated organizations, or those of the publisher, the editors and the reviewers. Any product that may be evaluated in this article or claim that may be made by its manufacturer is not guaranteed or endorsed by the publisher.
Research integrity at Frontiers
Learn more about the work of our research integrity team to safeguard the quality of each article we publish.