 Tentu Nageswara Rao1
 Y. Prashanthi2
 Faheem Ahmed3*
 Shalendra Kumar3,4
 Nishat Arshi3
 G. Rajasekhar Reddy5Tentu Manohra Naidu6
- 1Department of Chemistry, Krishna University, Machilipatnam, India
- 2Department of Chemistry, Mahatma Gandhi University, Nalgonda, India
- 3Department of Physics, College of Science, King Faisal University, Al Hofuf, Saudi Arabia
- 4University of Petroleum and Energy Studies, Dehradun, India
- 5Department of Chemical Engineering, A.C Tech Campus, Anna University, Chennai, India
- 6Department of Nuclear Physics, Andhra University, Visakhapatnam, India
Fe–Ag co-doped TiO2 nanoparticles (NPs) were prepared as a photocatalyst using a precipitation method for the removal of flumioxazin pesticide residues in water. The analytical method was validated with specificity, linearity, recovery, precision, the limit of quantification, and detection limit. Linearity was determined by different known concentrations of standard solutions. Detection limit was identified as the lowest concentration resulting in a 3-fold response to baseline noise. Photolytic and photocatalytic studies were conducted in borosil glass bottles under sunlight at a single fortification level (1.0 μg/mL) in Milli-Q water with various pH values (pH 4.0, 7.0, and 9.0). The optimum catalyst concentration recommended for complete degradation was found to be 50 mg/L under sunlight. The HPLC-UV method was used to determine flumioxazin residues in water, and the rate constant, DT50, and DT90 values were calculated from the data obtained. The photolytic results do not indicate a significant residue loss due to adsorption. Fe–Ag co-doped TiO2 NPs are an outstanding decontaminating catalyst in various water samples.
Introduction
Herbicides are chemicals that interrupt the normal growth and development of plants (Castro et al., 2008). They are widely used for weed management in agricultural, industrial, and noncrop areas. Herbicides can provide cost-effective control of weeds while reducing labor costs. Improper use of herbicides, however, can lead to crop injury, poor weed control, weeds’ resistance to herbicides, environmental contamination, or health hazards. Flumioxazin is a well-known herbicide used for the control of weeds in soybean and peanut crops and orchards. However, flumioxazin accumulation in soil and crops will cause severe side effects, such as irreversible destruction of the internal structure of crops (Lu et al., 2014). Therefore, sensitive methods for the determination of the concentration of flumioxazin need to be established (Guo and William, 2004; Chen et al., 2013).
The environment has been polluted with waste, both natural and synthetic, since the beginning of life on earth (man-made). However, in the case of natural waste, the environment alone controls the impact of contamination. But in the case of synthetic materials, even in trace concentrations, pollution is higher and this accumulates further, leading to disastrous environmental and ecological effects. This category comprises industrial waste containing heavy metals, dyes, and pesticide residues. Wastewater from agricultural industries, pesticide manufacturing, and plant formulation is the major source of pesticide pollution. Therefore, the waste from these sources must be disposed of or destroyed before being discharged into the environment. There are several methods in place for the treatment of wastewater. However, most of them are not in a position to achieve a hundred percent result.
Photocatalysis is defined as the acceleration of photoreactions in the presence of a catalyst called photochemistry and catalysis (Kalyanasundaram, 1983; Matthews, 1993; Lindner et al., 1995; Zeltner and Anderson, 1996). Chemicals that are discovered to be pollutants from industrial or domestic sources in wastewater must be removed or destroyed before being released into the environment. It is also possible to find such pollutants in surface water and groundwater, which also require treatment to achieve an acceptable quality of drinking water (Zhang et al., 1994; Hoffmann et al., 1995; Ahmed et al., 2011). In the field of pollutant degradation, photocatalysis is gaining considerable attention (Anandan et al., 2007; Burbano et al., 2008; Blinova et al., 2010). In the last two decades, to encourage specific redox processes on semiconductor surfaces, the use of colloidal semiconductors and the introduction of catalysts have been adopted (Daneshvar et al., 2006).
Photocatalysis has been extensively studied to convert light energy efficiently into reliable and efficient chemical energy. Laboratory studies have confirmed that this solar-driven purification process could be improved by using natural semiconductors (Elisa et al., 2007).
Wastewater photocatalytic detoxification is a process combining heterogeneous catalysts and solar energy (Zhang et al., 1994). Photocatalysis, with a primary focus on TiO2, has been applied to several environmental problems in addition to water purification. The use of photocatalysts is well documented and successful for a wide range of compounds for degrading toxic organics dissolved in air or water (Hall et al., 1997; Hariharan, 2006).
The process of photocatalytic degradation is gaining importance in the treatment of wastewater. Carbon dioxide, water, and simple mineral acids can be mineralized into hazardous organic chemicals. The key benefit of the photocatalytic process over current technologies is that secondary disposal approaches do not have any additional criteria. Another advantage of this process is that expensive oxidizing chemicals are not required when compared to other advanced oxidation technologies, particularly those using oxidants such as hydrogen peroxide and ozone, as ambient oxygen is the oxidant. Photocatalysts can be reused or recycled and are also self-regenerated.
The mechanism of the photocatalytic process is that ultraviolet (UV) radiation activates a semiconductor photocatalyst and establishes a redox environment in the aqueous solution. Semiconductors act as sensitizers for light-induced redox processes due to the electronic structure, which is characterized by a filled valence band and an empty conduction band (Hoffmann et al., 1995). The energy difference between the valence and conduction bands is called the bandgap. The semiconductor photocatalyst absorbs photons with energies equal to or greater than its bandgap or threshold energy Eg and excites the electrons in the occupied valence band to the unoccupied conduction band, leading to excited state conduction band electrons and positive holes in the valence band. The recombination of these charge carriers is to be effectively prevented to utilize for redox reactions involving adsorbed species. The charge carriers may take different paths as they can get trapped either in shallow traps (ST) or in deep traps (DT) or they can recombine nonradiatively or radiatively, dissipating the input energy as heat. Finally, they can react with electron donors or acceptors adsorbed on the surface of the photocatalyst. It has been shown that any photoredox reaction occurring at the particle surface emanates from trapped electrons and holes (Kite et al., 2020).
Semiconductors absorb light of energy greater than or equal to the bandgap energy (Eg) and promote an electron from the valence band to the conduction band, thus creating an electronic vacancy or hole (h+) at the valence band edge. This hole can also be identified as a chemical entity. This hole can initiate further interfacial electron transfer or other chemical reactions to an adsorbate, or it can diffuse into the bulk solvent with surface-bound OH− ions. The photogenerated electron is usually in the conduction band edge, and the hole is in the valence band edge. The catalyst deactivation by electron–hole recombination may be difficult if the energies of the electron and hole do not match. Unlike metals, semiconductors lack a continuum of interband states to assist the recombination of an electron–hole pair. This ensures an electron–hole pair lifetime is sufficiently long enough to allow these species to participate in interfacial electron transfer. Thus, the act of photoexcitation usually generates an electron–hole pair poised, respectively, at the conduction band and valence band edges (Eq. 1.1):
In the aerated suspension of the semiconductor in contact with organic substances, the photogenerated electron–hole pairs initiate a series of redox reactions as detailed below:
(i) Oxidation of adsorbed water molecules and hydroxyl ions by the photogenerated holes to produce hydroxyl radicals (Eqs. 1.2 and 1.3):
(ii) Reduction of dissolved oxygen by photogenerated electrons to produce superoxide anion radicals (Eq. 1.4), which in turn leads to the generation of H2O2 through a series of redox reactions (Eqs. 1.5–1.9):
(iii) Further decomposition of the photogenerated H2O2 to yield hydroxyl radicals (Eqs. 1.10–1.12):
(iv) Direct participation of the holes in the oxidation reactions.
(v) Formation and participation of singlet oxygen species in the oxidation.
These hydroxyl radicals OH and superoxide radicals O2 are the critical species for the decomposition of the pollutants.
Residues are quantified using a high-performance liquid chromatography UV (HPLC-UV) method for understanding the pH effect of different pH water samples (4.0, 7.0, and 9.0). The optimum catalytic concentration required for complete decontamination of residues was also determined by varying the catalytic value from 2 to 100 mg/L. The catalytic activity was measured under direct sunlight at two different concentrations of the test item (Ren et al., 1999; Pare et al., 2008; Umar et al., 2009; Hazra et al., 2015).
Materials and Methods
Analytical reference standards of flumioxazin (purity 97.46%) and tetrabutyl orthotitanate were obtained from Sigma Aldrich. The test item flumioxazin 51% WDG was purchased from the local market. Acetonitrile, high-grade water, LR grade sodium hydroxide, GR grade potassium chloride, boric acid, potassium phthalate, hydrochloric acid, and potassium phosphate were obtained from Merck India Limited.
Preparation of Fe–Ag Co-Doped TiO2 NPs
0.02 mol tetrabutyl orthotitanate was added to 50 ml of absolute ethanol to produce a solution. Then, the solution was vigorously stirred at room temperature for 20 min, and 3 drops of conc. HNO3 were added into the solution. The desired amounts of 1.0 mmol of ferric nitrate and 1.0 mmol of silver nitrate (the molar ratio of Fe to Ag was 1:1) were then added to the reaction mixture, which was stirred continuously for 60 min until Fe and Ag were dissolved. 2.0 mL of deionized water was then dissipated into the prepared solution. Afterward, the resulting solution mixture was maintained at room temperature and stirred continuously for 2 h to form a gel, which was then aged for 12 h at room temperature. After drying at 80°C for 24 h, the product was then dried at 400°C for 3 h. A nondoped TiO2 (anatase) sample was also prepared by adopting the above procedure without the addition of pure TiO2 ferric nitrate and silver nitrate. The concentration of doping is expressed as mmol of titanium atoms.
Characterization of Nanocatalysts
X-Ray Diffraction Study
The low-angle X-ray diffraction patterns of the materials were recorded on a Bruker D8 advanced powder X-ray diffractometer using CuK (λ = 1.5418 Å) as the radiation source in the 2θ range of 0.5°–6° with a step size of 0.01° and a step time of 5 s. The XRD patterns of mesoporous TiO2, mixed metal oxide TiO2, and metal-doped TiO2 were recorded in an X-ray diffractometer (PAN analytical X’Pert Pro) using CuK (λ = 0.154 nm) as the radiation source. The diffractograms were recorded in the 2θ range between 15° and 85° with a step size of 0.02° and a count time of 20 s at each point.
Fourier Transform Infrared Spectroscopy
A Shimadzu FT-IR spectrometer (Spectrum One Software) was used to record and monitor the infrared spectra of the samples at a resolution of 2 cm−1. The infrared spectra of samples were monitored in the range of 4,000–400 cm−1.
Transmission Electron Microscopy
The nanoparticle size was measured by transmission electron microscopy (JEOL TEM-3010).
Scanning Electron Microscopy
The surface morphology of Fe–Ag co-doped TiO2 NPs was examined by using a scanning electron microscope (SEM). Before SEM examination, a conductive gold layer was used for sputter-coating of the char residue surface. 15 kV accelerating voltage was applied for the examination.
Energy-Dispersive X-ray Analysis
An EDX (JEOL Model JED-2300) instrument was used for the elemental composition analysis of the nanoparticles.
Adsorption Isotherm Measurements
For the Fe–Ag co-doped TiO2 NPs, the adsorption equilibrium isotherms of CO2 were measured using a volumetric apparatus (BELSORP-mini, MicrotracBEL, Japan) at 0–1 bar pressure (298 K). All temperatures were controlled using a Dewar with a water-circulating jacket connected to a thermostatic bath with ±0.01°C accuracy.CO2 and He gases of ultrahigh purity grade (>99.995%) were used. The free space of the sample holder was determined by dosing with helium. The specific area of the surface (BET) was calculated using BET theory multipoint adsorption data from the linear segment of the CO2 adsorption isotherms. Before each measurement, the sample was evacuated at 150°C for 12 h to remove impurities present in the sample. The specific area of these samples was calculated by the Brunauer−Emmett−Teller (BET; Quantachrome Instrument AutosorbiQ Station 1) method at a P/P0 close to 0.999. The total volume of the pore was estimated at a relative pressure from the adsorbed capacity of N2. The Barrett–Joyner–Halenda (BJH) method derived the distribution of pore size.
Preparation of Linearity Standard Solutions
Exactly 5.13 mg of flumioxazin standard (97.46%) was transferred to a 50 mL standard volumetric flask and dissolved in 20 mL acetonitrile, and the volume was made up to the same diluent up to the mark. The concentration of the solution was 100 µg/mL. From this stock solution, six different standard solutions were prepared for linearity.
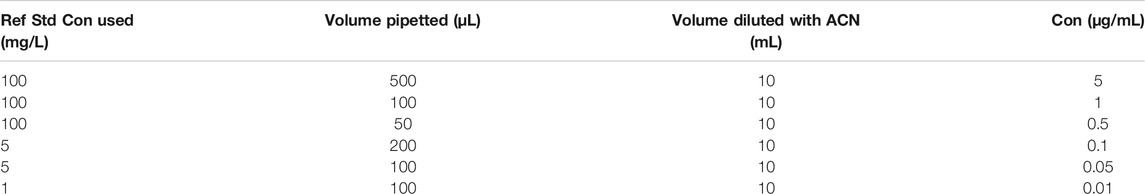
Preparation of solutions for linearity is mentioned below:
Sample Stock Solution
Accurately 39.16 mg of the test item (purity 51.07%) of flumioxazin was taken into a 20 mL volumetric flask. The content was dissolved, sonicated, and made up to the acetonitrile mark in 5 mL of acetonitrile. Consequently, the final concentration was 1,000 mg/L. The stock sample solution was used in various aqueous solutions for the preparation of dose samples.
Acidic Buffer
The acidic buffer solution was prepared by dissolving 4.02 g of KH2PO4 in 1,000 mL distilled water and adjusting the pH to 4.0 with 1.0 mol/L hydrochloric acid solution.
Neutral Buffer
The pH 7.0 buffer solution was prepared by dissolving 4.07 g of KH2PO4 in 1,000 mL distilled water and adjusting the pH to 7.0 using 1.0 mol/L sodium hydroxide solution.
Basic Buffer
The buffer solution of pH 9.0 was prepared by dissolving 1.25 g of H3BO3 in 1.0 L distilled water and adjusting the pH to 7.0 using 1.0 mol/L sodium hydroxide solution.
Adsorption Study of the Catalyst
Recovery studies in water and different pH waters were conducted with a 50 mg L−1 level of the catalyst, and they reported % of recoveries in distilled water and different pH waters.
Method Validation
Validation of the method ensures the credibility of the analysis. The specificity, accuracy, precision, linearity, and detection limit (LOD) and quantification (LOQ) parameters were considered in this study. The recovery tests used samples spiked at concentration levels of 0.01 and 0.1 μg/mL to determine the accuracy. By diluting the stock solution, different known concentrations were prepared. Using various known concentrations of solutions, the linearity was determined. The detection limit (LOD, μg/mL) was identified as the lowest concentration resulting in a 3-fold response to the baseline noise defined by the control sample analysis. The limit of quantification (LOQ, μg/mL) was established as the lowest concentration ratio of flumioxazin with a 10-fold response to the baseline noise.
Photolytic and Photocatalytic Studies
The photolytic and photocatalytic studies were carried out in a borosil glass bottle under sunlight at Changwon National University. Each one liter of Milli-Q water buffer solution with pH 4.0, 7.0, and 9.0 was doped with 1 mL of 1,000 mg/L stock solution of pesticide formulation to get 1 µg/mL of active pesticide concentration. We prepared 2 sets; one set was used for the photolytic study, and the other set was used for the photocatalytic study. Before exposure to sunlight, the resultant suspension was sonicated in the dark for 10 min to get an even dispersion of Fe–Ag co-doped TiO2 NPs and attain adsorption equilibrium. Then, the samples were exposed to direct sunlight. Aliquots of the samples were collected at predetermined intervals, and the lux meter was used to measure the light intensity for the month of February 2020. The average intensity was determined to be 80,000 lux. The temperature of water samples during this period was 25–32°C. The samples collected on different sampling occasions were filtered using a 0.2 µm PTFE membrane filter, and filtrates were collected into amber-colored vials. All the samples were stored in the dark at <5°C before being subjected to HPLC-UV analysis. The samples fortified with Zn NPs particles were centrifuged using a Beckman cooling centrifuge at 5,000 rpm for 5 min at 10°C. The supernate was transferred into the amber-colored bottles and stored in the dark at <5°C until analysis to avoid further degradation of residues.
Sampling
Test samples were collected from the bottle at different depths at different time intervals after exposure to sunlight (0, 4, 8, 12, and 24 h for the photocatalytic experiment). The collected samples were centrifuged and filtered through a 0.2 µ filter and analyzed in HPLC.
Chromatographic Separation
The HPLC-UV system consisting of a Shimadzu high-performance liquid chromatograph equipped with a reversed-phase Column Phenomenex C18 (25 cm length × 0.46 cm id × 5 µm) was used in this study. The oven temperature was maintained at 30°C. The volume of the sample injected was 1 0 μL. Acetonitrile and HPLC water were mobile phases A and B [70:30 (v/v)]. The flow rate with a detector wavelength of 220 nm was kept at 1.0 mL/min. For this analysis, the external standard calibration method was used.
Results and Discussion
The synthesized Fe2O3–Ag2O–TiO2 NPs were characterized by XRD, FT-IR, FESEM, EDS, and TEM, presented in Figures 1–5, respectively. Figure 1 shows the XRD patterns of undoped TiO2 (curve a) and 1 mmol of ferric nitrate and 1 mmol of silver nitrate in TiO2 (curve b) powders. It was found that all the crystal phases are anatase for all the samples (Daneshvar et al., 2006). No diffraction peak corresponding to Fe and Ag was detected. The reason could be that the content of Fe and Ag might be too low to detect. The shape of the diffraction peaks of all the photocatalysts was consistent with that of undoped TiO2. At about 25°, 38°, 48°, 54°, 54°, 62°, 68°, 74°, and 82°, the well-defined diffraction peaks of 2θ were assigned to the (101), (004), (200), (105), (211), (116), (220), (215), and (224) crystal planes, respectively. This XRD characteristic pattern was consistent with the TiO2 (JCPDS Card No. 21-1272) (Elisa et al., 2007; Hall et al., 1997) anatase standard JCPDS values with a tetragonal structure and did not appear in a rutile or brookite form. The FTIR spectrum of all the samples in the 500–4,000 cm−1 frequency range is shown in Figure 2. All the samples show peaks corresponding to adsorbed water molecules’ stretching vibration of O–H and bending vibrations around 3,200–3,400 and 1,600 cm−1, respectively (Hoffmann et al., 1995; Daneshvar et al., 2006; Hariharan, 2006). Also, the expansion of ∼3,400 cm−1 O–H stretching vibration forms a distinct −OH group, most likely as a surface group of Ti–OH. Due to the Ti–O stretching and Ti–O–Ti stretching modes, there is a wide, intense band in the range of 450–700 cm−1 (Hall et al., 1997; Elisa et al., 2007). The intensity of TiO2 co-doped with iron and silver has decreased compared with undoped TiO2. On Fe and Ag deposition, no additional peaks are present, supporting the efficient dispersion of iron and silver and indicating the absence of iron and silver clusters. Field emission scanning electron microscopy was used to investigate the morphology and structure of the samples as prepared (FE-SEM). According to the FE-SEM, the morphology of the Fe2O3–Ag2O–TiO2 nanocomposite was approximately spherical, in which the Fe and Ag deposited with titanium dioxide nanoparticles, which were found to be in an aggregated form. This reveals that the powder particles are slightly agglomerated, and the closed view of spherical nanoparticles is shown in Figure 3. The Fe2O3–Ag2O–TiO2 nanocomposite energy-dispersive X-ray (EDX) spectrum is shown in Figure 4. The peaks corresponding to titanium, oxygen, and the respective deposited metals of iron and silver can be confirmed by Figure 4. The results of the elementary study demonstrated the homogeneous distribution of metal nanoparticles in the TiO2 lattice. The nanoparticles’ average size was found to be about 50 nm. The size of the nanoparticles was calculated using the TEM (Figure 5).

FIGURE 1. XRD patterns of undoped TiO2(A) and 1 mmol of Fe–Ag co-doped TiO2 NPs (B).
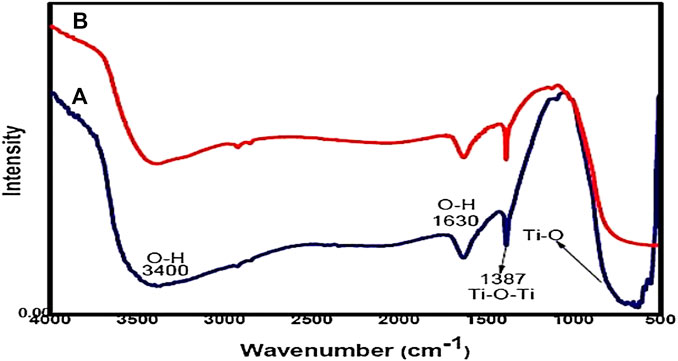
FIGURE 2. FT-IR spectra of (A) undoped TiO2 and (B) Fe–Ag co-doped TiO2 NPs.
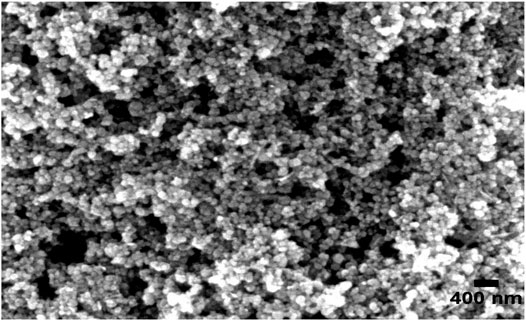
FIGURE 3. Scanning electron microscope image of Fe–Ag co-doped TiO2 NPs.
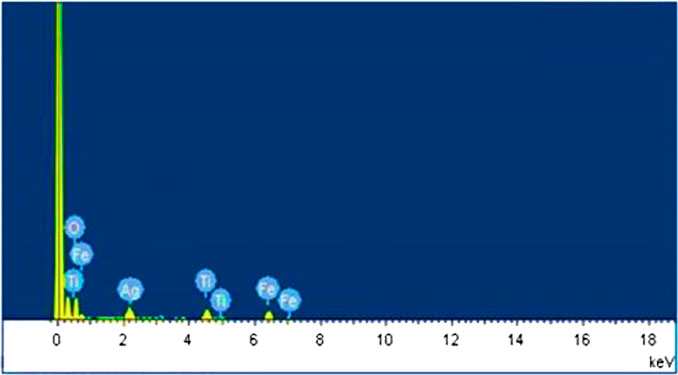
FIGURE 4. EDS spectra of 1 mmol of Fe–Ag co-doped TiO2 NPs.
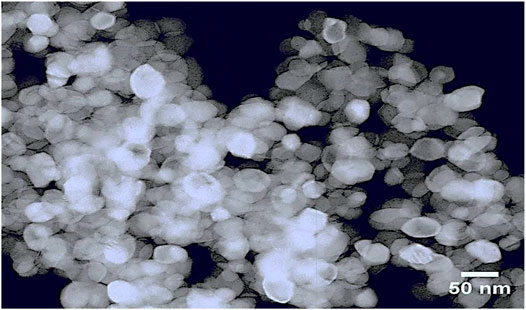
FIGURE 5. Transmission electron microscope image of Fe–Ag co-doped TiO2 NPs.
CO2 Adsorption, Surface Area, and Pore Size Measurement of Fe–Ag Co-Doped TiO2 NPs
The CO2 adsorption performance of Fe–Ag co-doped TiO2 NPs was examined at a temperature of 298 K under a pressure range of 0–1 bar using a volumetric method. The corresponding adsorption isotherm is plotted in Figure 5. The CO2 adsorption capacity of Fe–Ag co-doped TiO2 NPs was 23.32 cm3/g. The pore size distribution of Fe–Ag co-doped TiO2 NPs is illustrated in Figure 6. The Fe–Ag co-doped TiO2 NPs exhibited a pore size of 2.69 nm of mesoporous material (Figure 7), which was consistent with the result of the BET specific surface area measurement of 398.25 (m2/g).

FIGURE 6. Carbon dioxide adsorption of Fe–Ag co-doped TiO2 NPs.
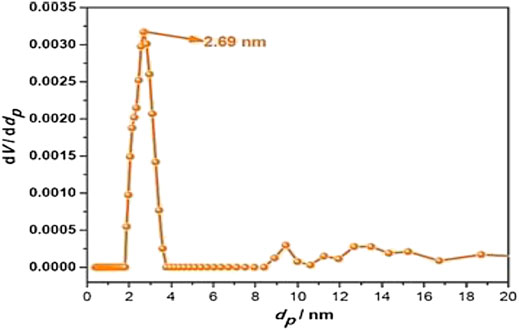
FIGURE 7. Pore size distribution curve of Fe–Ag co-doped TiO2 NPs.
Specificity
Specificity was confirmed by injecting the mobile phase solvents, that is, acetonitrile and HPLC water, sample solution, standard solution, and buffer controls (acidic, neutral, and basic). The chromatograms did not have matrix peaks to interfere with the flumioxazin residue analysis shown in Figures 8–11. Furthermore, the retention time of flumioxazin was constant at 4.3 ± 0.2 min.
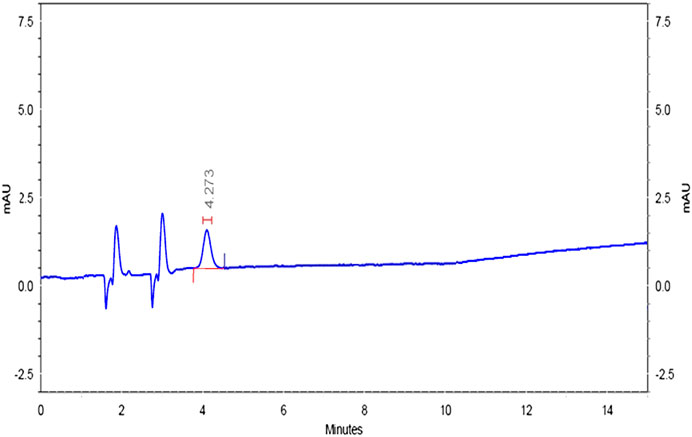
FIGURE 8. Representative chromatogram of the flumioxazin test item in Milli-Q water.
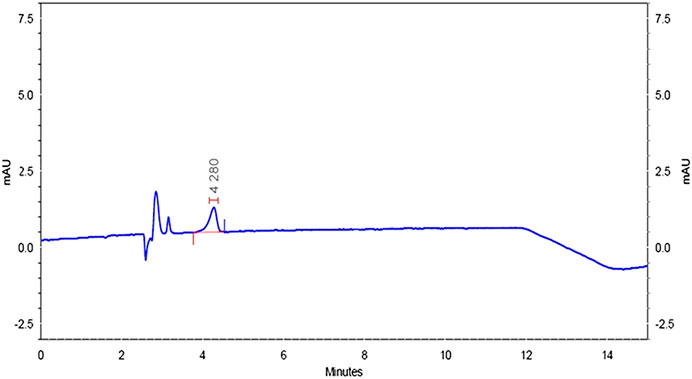
FIGURE 9. Representative chromatogram of the flumioxazin test item in acidic water.
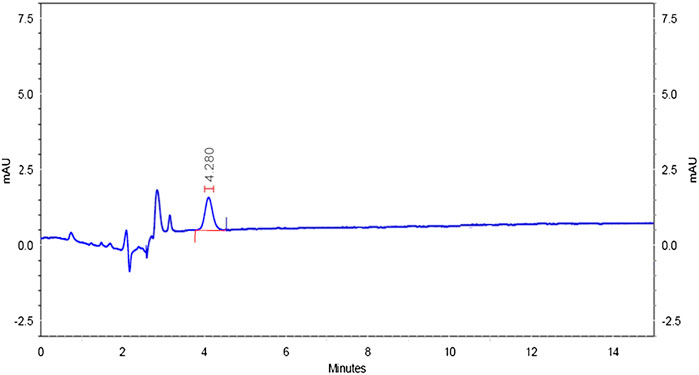
FIGURE 10. Representative chromatogram of the flumioxazin test item in neutral water.
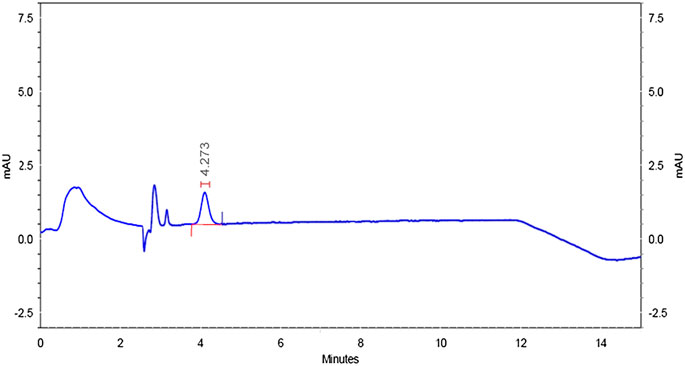
FIGURE 11. Representative chromatogram of the flumioxazin test item in basic water.
Linearity
Different known concentrations of flumioxazin (0.01, 0.05, 0.1, 0.5, 1.0, and 5.0 µg/mL) were prepared in different 10 mL volumetric flasks by diluting the stock solution. These standard solutions were directly injected into the HPLC. The details are presented in Table 1. To calculate the linear regression equation, the peak areas obtained from various concentrations of standards were used. This was Y = 15,060X + 64.90 with a correlation coefficient of 0.9998, respectively. A calibration curve is shown in Figure 12.
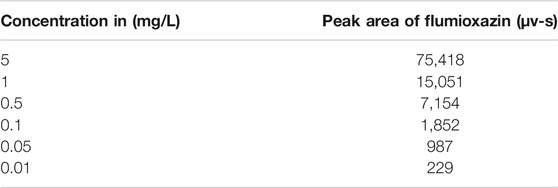
TABLE 1. Calibration details of flumioxazin.
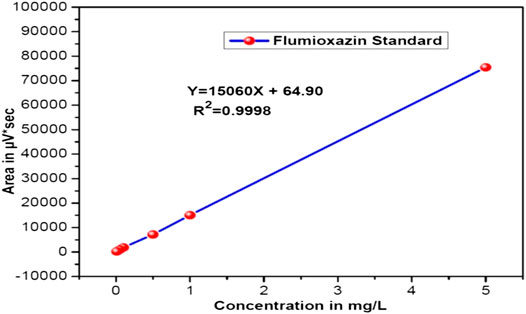
FIGURE 12. Representative calibration curve of flumioxazin standard.
Recovery
The method had an acceptable recovery range (80–110%) for pesticides in four different waters. The LOQ was determined as 0.01 mg/L, based on the S/N ratio, mean recovery percentage, standard deviation (STDEV), % of relative standard deviation (% RSD), and Horwitz Limit, which are presented in Table 2. The formulas for calculation of residues and statistical parameters are presented below:
where A is the peak area of the active content in the sample (µV*s); C is the concentration of the standard solution (µg/mL); and D is the peak area of the active content in the standard solution (µV*s).
where C is the concentration.
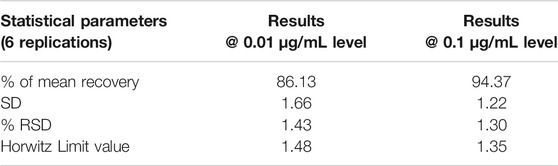
TABLE 2. Statistical parameter details of flumioxazin at 0.01 and 0.1 µg/mL fortification levels in Milli-Q water.
Adsorption Study of the Catalyst
The amount of catalyst required for the decontamination was optimized as 50 mg/L for flumioxazin, and any further increase in the catalyst had no significant effect on degradation. The adsorption study of the catalyst was conducted by quantifying the concentration of flumioxazin in water for a period of 3 h. In Milli-Q water, acidic water, neutral water, and basic water, the recovery was found to be 92–9, 91–95, 90–95, and 90–94%. The findings show no significant residue loss due to adsorption. In the presence of the catalyst though, the dissipation was rapid under sunlight.
Photolytic and Photocatalytic Studies
The results of photolytic degradation of flumioxazin in water showed that the residues were highly stable, stability decreased, and pH decreased. The results are shown in Table 3 and Figure 13. Comparatively lower values of flumioxazin in the presence of a catalyst (photocatalytic) in different pH were recorded. The results are shown in Table 4 and Figure 14.
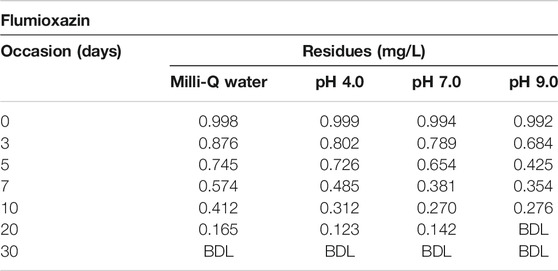
TABLE 3. Dissipation data for photolytic decontamination of flumioxazin in water under direct sunlight.
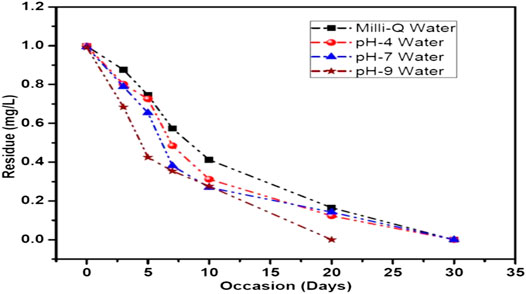
FIGURE 13. Graph representing the dissipation curve of photolytic decontamination of flumioxazin in water under direct sunlight.
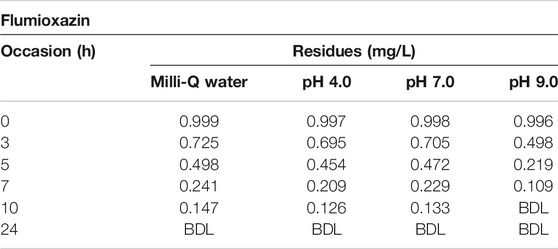
TABLE 4. Dissipation data for photocatalytic decontamination of flumioxazin in water under direct sunlight.
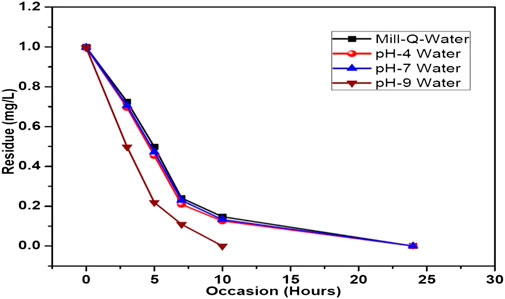
FIGURE 14. Graph representing the dissipation curve of photocatalytic decontamination of flumioxazin in water under direct sunlight.
The data demonstrate that the decontamination of flumioxazin follows pseudo-first-order kinetics in Fe–Ag co-doped TiO2–loaded water. DT50 and DT90 values were calculated using the following formulas:
where k is the slope of the curve obtained from the dissipation data.
For photolytic and photocatalytic studies, the calculated DT50 and DT90 values are shown in Tables 5,6. The constant value of the rate was calculated from the first-order rate equation by using the linear regression equation:
where dt is the time interval between t1 and t2 and a, and x are the flumioxazin concentration at times t1 and t2, respectively. A plot of residue and rate concentration with R2 shows first-order kinetics in flumioxazin dissipation. Flumioxazin DT90 was calculated from the dissipation data by regression analysis.
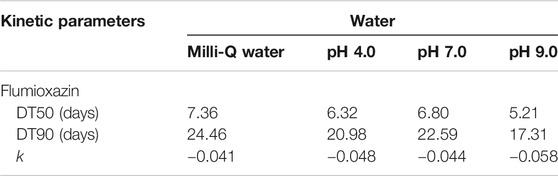
TABLE 5. Kinetic parameters for photolytic decontamination of flumioxazin in water under direct sunlight.
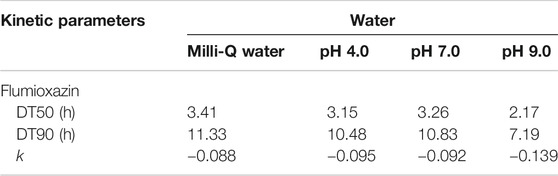
TABLE 6. Kinetic parameters for photocatalytic decontamination of flumioxazin in water under direct sunlight
The decontamination was fast when studied under sunlight in presence of TiO2. Due to the formation of electrons (e−) and positive holes (h+) in TiO2 by absorbing energy from sunlight and the availability of electron (e−) and positive hole (h+) pairs contributing the simultaneous oxidation and reduction of flumioxazin, the decontamination rate is enhanced.
Conclusion
In different water samples, the Fe–Ag co-doped TiO2 NPs were found to be an excellent decontaminating catalyst for flumioxazin. The compound persists for several days in the absence of a catalyst. The mobile phase, acetonitrile, and HPLC water have shown good separation and resolution, and the time required to analyze three different types of buffers for chromatographic determination is a very short run time. Photocatalytic studies of flumioxazin at various conditions such as acidic, basic, and neutral revealed that the activity was enormously increased with Fe–Ag co-doped TiO2 NPs as the time frame is fixed for a stipulated number of hours, whereas the activity was not found without addition of Fe–Ag co-doped TiO2 NPs, even though experiments were carried out over several days.
Data Availability Statement
The original contributions presented in the study are included in the article/Supplementary Material; further inquiries can be directed to the corresponding author.
Author Contributions
FA planned, supervised the research work, and provided the study materials; TR carried out the experiments and the investigation process and wrote the paper; TN was responsible specifically for visualization; SK measured the characteristics; RR wrote the initial daft; and NA and YP developed the methodology. All authors have read and agreed to the published version of the manuscript.
Conflict of Interest
The authors declare no conflict of interest.
References
Ahmed, S., Rasul, M. G., Martens, W. N., Brown, R., and Hashib, M. A. (2011). Advances in heterogeneous photocatalytic degradation of phenols and dyes in wastewater: a review. Water Air Soil Pollut. 215, 3–29. doi:10.1007/s11270-010-0456-3
Anandan, S., Vinu, A., Sheeja Lovely, K. L. P., Gokulakrishnan, N., Srinivasu, P., Mori, T., et al. (2007). Photocatalytic activity of La-doped ZnO for the degradation of monocrotophos in aqueous suspension. J. Mol. Catal. A: Chem. 266, 149–157. doi:10.1016/j.molcata.2006.11.008
Blinova, I., Ivask, A., Heinlaan, M., Mortimer, M., and Kahru, A. (2010). Ecotoxicity of nanoparticles of CuO and ZnO in natural water. Environ. Pollut. 158, 41–47. doi:10.1016/j.envpol.2009.08.017
Burbano, J., Cruz, I., Márquez, J. C., López, V. A., and Machuca, F. (2008). Evaluation of zinc oxide-based photocatalytic degradation of a commercial pesticide. J. Adv. Oxid. Technol. 11, 49–55. doi:10.1515/jaots-2008-0106
Castro, A. J., Saladin, G., Bézier, A., Mazeyrat-Gourbeyre, F., Baillieul, F., and Clément, C. (2008). The herbicide flumioxazin stimulates pathogenesis-related gene expression and enzyme activities in Vitis vinifera. PhysiologiaPlantarum 134, 453–463. doi:10.1111/j.1399-3054.2008.01151.x
Chen, L., Zheng, H., Ye, W., Qiu, S., Lin, Z.L, et al. (2013). Novel colorimetric molecular switch based on copper(i)-catalyzed azide-alkyne cycloaddition reaction and its application for flumioxazin detection. Analyst 138, 688–692. doi:10.1039/c2an36023c
Daneshvar, N., Salari, D., Niaei, A., and Khataee, A. R. (2006). Photocatalytic degradation of the herbicide erioglaucine in the presence of nanosized titanium dioxide: comparison and modeling of reaction kinetics. J. Environ. Sci. Health B 41, 1273–1290. doi:10.1080/03601230600962302
Elisa, G. L., Giuseppe, M., Nick, S., and Hisao, H. (2007). Photo assisted oxidation of the recalcitrant cyanuric acid substrate in aqueous ZnO suspensions. J. Phys. Chem. C. 111, 18025–18032. doi:10.1021/jp075359p
Guo, A., and William, K. (2004). Chromatographic/Mass spectrometric 201 determination of flumioxazin extracted from soil and water. J. AOAC Int. 87, 56–59. doi:10.1093/jaoac/87.1.56
Hall, L. M., Moss, S. R., and Powles, S. B. (1997). Mechanisms of resistance to aryloxyphenoxypropionate herbicides in two resistant biotypes of Alopecurus myosuroides (blackgrass): herbicide metabolism as a cross-resistance mechanism. Pestic. Biochem. Physiol. 57, 87–98. doi:10.1006/pest.1997.2259
Hariharan, C. (2006). Photocatalytic degradation of organic contaminants in water by ZnO nanoparticles: Revisited. Appl. Catal. A: Gen. 304, 55–61. doi:10.1016/j.apcata.2006.02.020
Hazra, D. K., Karmakar, R., and Durgesh, S. (2015). Effect of pH on dissipation of flumioxazin in water. Int. J. Bioresour. Sci. 1, 33–36. doi:10.20902/ijctr.2018.110329
Hoffmann, M. R., Martin, S. T., Choi, W., and Bahnemann, D. W. (1995). Environmental applications of semiconductor photocatalysis). Chem. Rev. 95, 69–96. doi:10.1021/cr00033a004
Hoffmann, M. R., Martin, S. T., Choi, W., and Bahnemann, D. W. (1995). Environmental applications of semiconductor photocatalysis. Chem. Rev. 95, 69–96. doi:10.1021/cr00033a004
Kalyanasundaram, K. (1983). Energy resources through photochemistry and catalysis. London: Academic Press, 217–260.
Kite, S. V., Sathe, D. J., Kadam, A. N., Chavan, S. S., and Garadkar, K. M. (2020). Highly efficient photodegradation of 4-nitrophenol over the nano-TiO2 obtained from chemical bath deposition technique. Res. Chem. Intermed 46, 1255–1282. doi:10.1007/s11164-019-04032-7
Lindner, M., Bahnemann, D., Hirthe, B., and Griebtor, W. (1995). Solar water detoxification: novel TiO2 powders as highly active photocatalysts Solar Eng. 1, 339–408.
Lu, L., Yang, L., Cai, H., Zhang, L., Lin, Z., Guo, L., et al. (2014). Determination of flumioxazin residue in food samples through a sensitive fluorescent sensor based on click chemistry. Food Chem. 162, 242–246. doi:10.1016/j.foodchem.2014.04.061
Pare, B., Jonnalagadda, S. B., Tomar, H., Singh, P., and Bhagwat, V. W. (2008). ZnO assisted photocatalytic degradation of acridine orange in aqueous solution using visible irradiation. Desalination 232, 80–90. doi:10.1016/j.desal.2008.01.007
Ren, K. T., Li, Y. H., and Yang, H. Z. (1999). The mechanisms of action of APP and CHD herbicides. Chin. J. Pestic. 38, 1–4.
Umar, I. G., Abdul, H. A., Zulkarnain, Z., and Mohd, Z. H. (2009). Photocatalytic treatment of 4-chlorophenol in aqueous ZnO suspensions: intermediates, the influence of dosage and inorganic anions. J. Hazard. Mater. 168, 57–63. doi:10.1016/j.jhazmat.2009.01.130
Zeltner, W. A., and Anderson, M. A. (1996). Fine particles science and technology. London: Kluwer Academic Publishers, 643–656.
Keywords: Fe2O3–Ag2O–TiO2 NPs, flumioxazin, XRD, SEM, HPLC-UV, DT50
Citation: Nageswara Rao T, Prashanthi Y, Ahmed F, Kumar S, Arshi N, Rajasekhar Reddy G and Manohra Naidu T (2021) Photocatalytic Applications of Fe–Ag Co-Doped TiO2 Nanoparticles in Removal of Flumioxazin Pesticide Residues in Water. Front. Nanotechnol. 3:652364. doi: 10.3389/fnano.2021.652364
Received: 12 January 2021; Accepted: 12 February 2021;
Published: 15 April 2021.
Edited by:
Ruchi Agrawal, TERI Gram, IndiaReviewed by:
Ramacharyulu P V R K, Pukyong National University, South KoreaBehzad Shahmoradi,K. M. Garadkar, Shivaji University, India
Copyright © 2021 Nageswara Rao, Prashanthi, Ahmed, Kumar, Arshi, Rajasekhar Reddy and Manohra Naidu. This is an open-access article distributed under the terms of the Creative Commons Attribution License (CC BY). The use, distribution or reproduction in other forums is permitted, provided the original author(s) and the copyright owner(s) are credited and that the original publication in this journal is cited, in accordance with accepted academic practice. No use, distribution or reproduction is permitted which does not comply with these terms.
*Correspondence: Faheem Ahmed, ZmFobWVkQGtmdS5lZHUuc2E=