 Avinash Kumar Singh
 G. B. V. S. Lakshmi
 Tarun Kumar Dhiman
 Ajeet Kaushik
 Pratima R. Solanki1*
- 1Special Centre for Nanoscience, JNU, New Delhi, India
- 2School of Physical Sciences, JNU, New Delhi, India
- 3NanoBioTech Laboratory, Department of Natural Sciences, Division of Scientist, Art, and Sciences, Florida Polytechnic University, Lakeland, FL, United States
Aflatoxins-B1 (AFB1) and Ochratoxin-A (OchA) are the two types of major mycotoxin produced by Aspergillus flavus, Aspergillus parasiticus fungi, Aspergillus carbonarius, Aspergillus niger, and Penicillium verrocusumv. These toxins are mainly found in metabolite cereals, corn, coffee beans, and other oil-containing food items. Excessive consumption of these toxins can be carcinogenic and lead to cancer. Thus, their rapid testing became essential for food quality control. Herein, manganese oxide nanoparticles (MnO2 nps) have been proposed to explore the interaction with AFB1 and OchA using UV-visible spectroscopy. MnO2 nps were synthesized using the co-precipitation method. They were pure and crystalline with an average crystallite size of 5–6 nm. In the UV-vis study, the maximum absorbance for MnO2 nps was observed around 260 nm. The maximum absorbance for AFB1 and OchA was observed at 365 and 380 nm, respectively, and its intensity enhanced with the addition of MnO2 nps. Sequential changes were observed with varying the concentration of AFB1 and OchA with a fixed concentration of MnO2 nps, resulting in proper interaction. The binding constant (kb) and Gibbs free energy for MnO2 nps-AFB1 and OchA were observed as 1.62 × 10⁴ L g−1 and 2.67 × 10⁴ L g−1, and −24.002 and −25.256 kJ/mol, respectively. The limit of detection for AFB1 and OchA was measured as 4.08 and 10.84 ng/ml, respectively. This bio‐active free direct sensing approach of AFB1 and OchA sensing can be promoted as a potential analytical tool to estimate food quality rapidly and affordable manner at the point of use.
1 Introduction
Aflatoxins-B1 (AFB1) has been identified as a significant contaminant in food materials like maize, corn, cottonseed, peanuts, cereals, etc. Fungal infection is a primary source of toxin production, mainly originated from Aspergillus flavus and parasiticus fungi. (Battacone et al., 2005) (Borneman and Becker, 2007) (Payne and Brown, 1998) (Ronchi et al., 2005) (Sarma et al., 2017) (Zheng et al., 2017) This toxin had an adverse effect on human health and animals, causing acute diseases like jaundice, lethargy, nausea, etc. According to the international agency for cancer research, AFB1 is the most toxic among other mycotoxins and is classified as a group 1 carcinogen. (Cancer, 1982) (Roberts et al., 2014) The United States department of agriculture (USDA) and food and drug administration (FDA) have set a scale of 20ppb AFB1 consumption in food as a tolerable limit. (Altug, 2002) (van Egmond and Dekker, 1996) (van Egmond and Jonker, 2004). According to the WHO report, large doses of AFB1 are carcinogenic and cause liver cancer. Similarly, for animals like chickens, AFB1 is unfriendly, and its effect reduces egg production, impairs reproductive efficiency, and damages the liver. (Administration (FAD), 1988) (Henry et al., 1999) (Smith et al., 1995). It has been categorized into more than 10 different isomers, including B1, B2, G1, G2, M1, M2, etc. (Crook, 2003) Among these, AFB1 is more precarious and can be lethal. (Jaimez et al., 2000).
Ochratoxin-A (OchA) is also a developed class of mycotoxin, a secondary metabolite of Aspergillus ochraceous, Aspergillus carbonarius, Aspergillus niger, and Penicillium verrocusumv. (Abarca et al., 1994) (Van der Merwe et al., 1965) (Heenan et al., 1998) The primary sources of these toxins are food commodities such as cereal grains like corn, coffee beans, dairy products, wine, raisins, vegetables (yam, garlic, onions, potatoes, and tomatoes), fruits, and spices. (Duarte et al., 2010) (Lim et al., 2015) (Kaushik et al., 2009b) (Kaushik et al., 2009a) (Solanki et al., 2010) (Marin and Taranu, 2015) (Pfohl-Leszkowicz and Manderville, 2007) OchA is more potent and toxic compared to ochratoxin B and C. (Kőszegi and Poór, 2016) (Gallo et al., 2017) The OchA is cancerous in humans; the International Agency for Research on Cancer has therefore categorized this toxin as belonging to the 2B group. (Pflaum et al., 2016) The World Health Organization (WHO) set the tolerable parameter for ochratoxin A as 5 ng/kg body weight per day. (Pitt, 2000).
Detection of these toxins has always remained challenging due to the lack of complete information. For quantitative detection, an electrochemical-biosensor has been used to check the sensitivity of toxins. Also, analytical techniques like enzyme-linked immunosorbent assays (ELISA) are used for the determination of AFB1. (Azri et al., 2018) These toxins' optical properties open up a new detection approach because they consist of spectral shift, change in fluorescence intensity, lifetime and quantum yield, etc. Few toxins like ochratoxin and citrinin have been employed to detect absorption and fluorescence through a shift in intensity and environmental change. (Keller et al., 2018).
The conventional techniques to detect the toxins mentioned above, including HPLC-tandem mass spectrometry (HPLC-MS/MS) (Abramson et al., 1995), are costly, elaborate, and require a trained candidate for the operation. (Sarkar et al., 2020) These techniques are also limited to analytes' mass scale determination, which is one of the major drawbacks. Considering comparison to these techniques, UV-visible spectroscopy is a well-known and absorbance-based technique that is relatively cost effective, easy to handle, and requires a tiny sample from an experimental point of view. (Dhiman et al., 2019) One such approach is exploring nano-systems for direct and label-free detection of foodborne toxins. There is an urgent need to design and develop an electro-optical metal oxide-based nano-system for sensing applications to achieve this task. Among many, manganese oxide nanoparticles (MnO2 nps) are emerging as promising sensing nano-systems. The MnO2 nps are semiconducting in nature owing to multiple properties like smaller in size, a large surface-to-volume ratio, and having magnetic, electrochemical, and optical properties. (Wei et al., 2011) MnO2 nps have applied in various fields, including sensors, biosensors, biomedical devices, catalysis, drug delivery, rechargeable batteries, and other commercial purposes. (Ragupathy et al., 2007) (Ganeshan et al., 2017) (Liu et al., 2013) Despite having a tremendous application of MnO2 nps, it is optically less explored, and it is expected that, similar to other properties, its optical nature can provide a new approach in the detection of analytes. Several nanoparticle systems have been reported regarding the adsorption of mycotoxins. Few graphene-based adsorptive techniques have been studied for bacteria detection in food samples. (Bajpai et al., 2019) (Shukla et al., 2019) Jouni et al. have reported the complex of aptamer-based Fe2O3 nps detoxification of aflatoxin M1 in the milk sample. (Jouni et al., 2018) Puzyr et al. have demonstrated sorption properties of nanodiamonds (NDs) to study the adsorption of AFB1. (Purtov et al., 2007) Liu at el. have reported the adsorption of OchA on the surface of gold nanoparticles (Au nps) and have located the effects of Au nps using localized surface plasmon resonance. (Liu et al., 2018) Velu at el. has reported the adsorption–desorption approach for OchA based on lateral flow assays using gold (Au) or silver (Ag) nanoparticles. (Velu and DeRosa, 2018).
Here, we have used the UV‐visible absorption technique for the detection of AFB1 and OchA using MnO2 nps, synthesized using the co-precipitation method. Many papers exist on the sensing of AFB1 and OchA in literature. However, the present study involves the interaction through UV-titration of AFB1 and OchA with MnO2 nps based on the UV-visible absorbance change. MnO2 nps are directly interacting with AFB1 and OchA, resulting in enhanced absorption and variation of absorption observed in the presence of a different concentration of AFB1 and OchA. It has been found that a strong interaction occurred between AFB1 and OchA with MnO2 nps, and this can be used in the development of a detection platform for AFB1 and OchA. The UV-visible absorption intensity of AFB1 and OchA is enhanced with MnO2 nps, indicating the interaction between themselves, which suggests the effect of MnO2 nps on AFB1 and OchA. Following this methodology, an experiment was performed, which produced a significant result for developing an optical sensing platform. This optical method is cost-effective and easy to perform without any complications. This can be further treated as the primary platform for the development of optical sensors in the future.
2 Materials and Methods
2.1 Reagents
Manganese acetate tetrahydrate (99.99%) and sodium hydroxide (98%) were purchased from Sigma-Aldrich and Fisher Scientific, respectively. Aflatoxin B1 was purchased from LKT laboratories inc and Ochratoxin A and Fumonisin B1 were bought from Cayman chemical company. Cellulose and starch were procured from Sigma-Aldrich, and d-fructose from CDH Chemicals Ltd. Phosphate buffer saline was prepared in the laboratory at different pH.
2.2 Synthesis of MnO2 nps
MnO2 nps were synthesized by the co-precipitation method described in our previous paper with a different calcination temperature (Singh et al., 2020) (Dhiman et al., 2020). After completing the synthesis process, the obtained dried powder was first ground to a fine powder and calcined at 350°C to get the MnO2 phase.
2.3 Characterization Techniques
The phase and structure of synthesized nanomaterials were examined by the X-ray diffraction (XRD) method using XRD, Rigaku MiniFlex 600 X-Ray Diffractometer with CuKα radiation at λ = 1.54Å; operating at 40 kV and 15 mA of the samples from 20 to 80° at a scan rate of 3° per min with a step size of 0.02°. Raman spectra were recorded using Enspectr R 532 in the range of 250–1,250 cm−1 with a 532 nm excitation wavelength. The morphology, shape, and structure of the materials were explored by the MIRA II KMH-TESCAN field emission scanning electron microscope (FE-SEM) operated at 25 keV. For this study, MnO2 nps were ultrasonically dispersed in deionized water. Interaction of MnO2 nps with mycotoxins was determined using a Perkin-Elmer spectrum two Fourier transform infrared (FTIR) spectroscopy. The UV-visible absorption technique was used for the detection study through the titration process using T90 + UV/VIS Spectrometer PG Instruments Ltd.
2.4 Sensing Procedure
Absorption spectra of AFB1 and OchA were recorded in the wavelength range of 230–460 nm. The binding constant (kb) between MnO2 nps and AFB1/OchA was measured by UV-visible spectrophotometric titration method by changing the concentration of analytes (AFB1 and OchA). The sensing medium was phosphate buffer silane (PBS) maintained at pH 7. MnO2 nps were dispersed in PBS, and the UV-Visible absorbance was measured. Different concentrations (400 ng ml−1–15 μg ml−1) of the analyte solutions prepared in PBS were mixed with the MnO2 nps dispersions, and the UV-Vis absorbance was carried out in the same wavelength range under similar conditions. The concentration of MnO2 nps dispersion was fixed at 5 μg ml−1.
3 Results and Discussion
3.1 Structural and Morphological Studies
The XRD spectrum pattern of MnO2 nps was recorded at room temperature to determine the phase‐crystal structure and purity. Figure 1A shows the XRD spectrum of MnO2 nps. MnO2 nps were obtained by calcining the synthesized MnO2 at 350°C. The diffraction peaks were observed at 2θ = 37.02°, 42.02°, and 56.81° and indexed as (100), (101), and (102). The observed peaks were matched with JCPDS file no. 895171 and ascribed to the hexagonal structure of Ɛ-MnO2. The average crystallite size was calculated using Debye-Scherrer formulae as given below: (Kujur and Singh, 2020)
where K∼ 0.9; wavelength (λ) = 1.5406 Å; full width at half maximum (FWHM) of the diffraction peaks is β, and the Bragg’s diffraction angle is θ. The size calculated from Debye-Scherrer formulae was found to be 5.18 nm. Since the peaks are broad, having high FWHM indicates that the size of the MnO2 is very small.
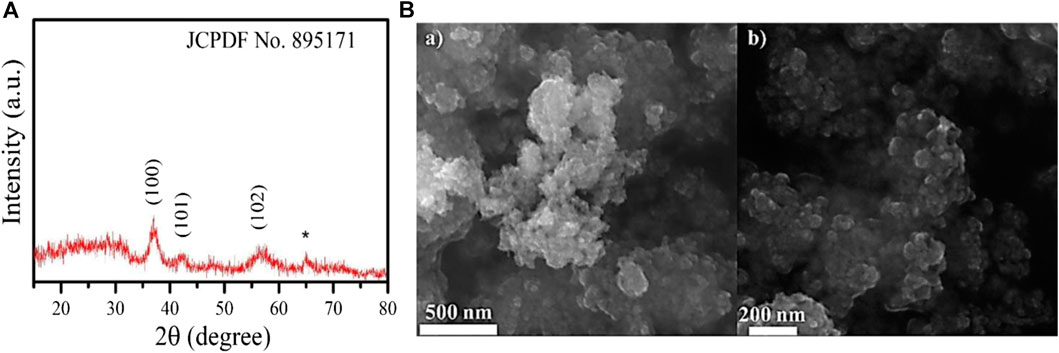
FIGURE 1. (A) XRD pattern of MnO2 nps calcined at 350°C; (B) Scanning electron microscopic image of MnO2 nps recorded (a) lower magnification and (b) at higher magnification showing spherically shaped MnO2 nps calcined at 350 °C.
To further study morphology and nano crystallinity of the material, field-emission scanning electron microscopy (FE-SEM) was studied. Figure 1B shows the FE-SEM image of MnO2 nps. The nanoparticles were found mostly in an aggregated form, which is due to the magnetic behavior. Even after the agglomeration, the structure of the MnO2 nps was observed to be a spherical shape with a size ranging from 40 to 100 nm. These two studies confirm the hexagonal phase structure of MnO2 with spherically shaped MnO2 nps.
The FTIR spectra of MnO2 nps in the presence and absence of OchA and AFB1 is shown in Figure 2. The FTIR spectra were carried out to determine the interaction among MnO2 nps with AFB1 and OchA and were recorded in the wavenumber range between 400 and 2000 cm−1. The major peaks of Mn-O could be assigned in the range of 400–800 cm−1. (Kang et al., 2007) (Feng et al., 1992). In the present study, several peaks for MnO2 nps appeared at 408, 415, 422, 570, 625, and 780 cm−1, representing the presence of Mn-O bond. During the interaction of AFB1 with the MnO2 nps, the peaks of MnO2 nps for Mn-O bond appeared slightly shifted or changed in their position between 400 and 440 cm−1, indicating the interaction among these two molecules. Similar behavior obsereved for the OchA in presence of MnO2 nps, and peak positions of Mn-O bond changed between 400 and 440 cm−1 as shown in Figure 2.
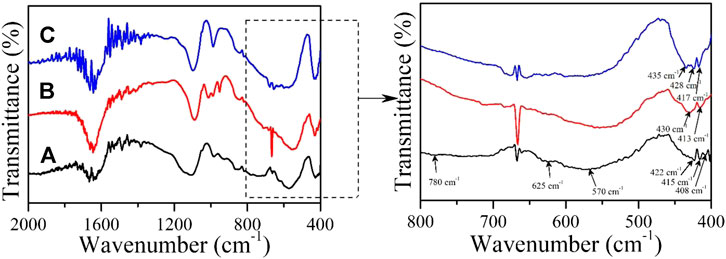
FIGURE 2. Fourier transform infrared spectra of (A) MnO2 nps, (B) AFB1-MnO2, and (C) OchA-MnO2 were recorded at room temperature.
Raman spectroscopy was performed to see the crystal defects and phase composition of the material. The spectrum of MnO2nps is shown in Figure 3 recorded at 532 nm excitation source. The range shows three peaks at 276, 335, and 637 cm−1. Theoretically, MnO2 with a hexagonal structure has a significant peak centered at 637 cm−1. Here the peaks at 276 and 335 cm−1 are due to the bending vibration of Mn-O bond, and another peak at 637 cm−1 shows stretching vibration in MnO2 bond. (Barai et al., 2016) (Gao et al., 2008). The indexing of the three peaks confirms the phase purity of MnO2 without any defects.
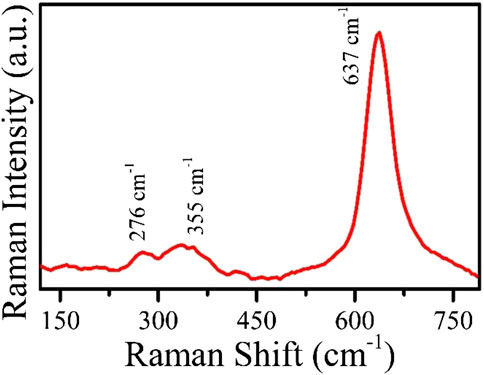
FIGURE 3. Raman spectrum of MnO2 nps recorded at room temperature (25°C).
3.2 UV-Visible Spectroscopic Studies of AFB1 and OchA With MnO2 nps
UV-visible spectroscopy is a reliable and straightforward technique to study nanoparticles’ optical activity, and it has also been used to monitor the interaction between nanomaterials and biomolecules. Increase or decrease of absorption and shifting of wavelength toward red/blue shift represents the interaction between the involved components. This technique has been proposed for the interaction study of the aromatic chromophore with nucleic acids like DNA, RNA, etc. In the study of interactions between nanoparticles and the analytes, the medium's pH plays an important role. Therefore, the pH-dependent study has been carried out at five different pHs. The pH-dependent analysis of AFB1 and OchA is shown in Figure 4A and Figure 4B. The absorption spectra were measured at different pH from five to nine between 230 and 460 nm of the wavelength range. In the case of AFB1, a significantly less pH effect was measured in the given range. While OchA shows increased absorption spectra with increasing the pH. However, the study was performed at neutral pH 7 for both the toxins as it is neutral.
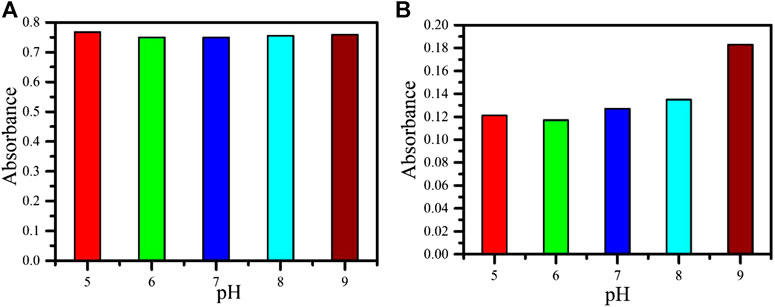
FIGURE 4. (A) The effect of different pH for AFB1. (B) The effect of different pH for OchA.
3.3 UV-Visible Spectroscopic Studies to Explore Interactions of AFB1 and OchA With MnO2 nps
The absorption spectrum of MnO2 nps was recorded in the absence and presence of AFB1 and OchA mycotoxins in the range between 230 and 460 nm in PBS at pH 7. The MnO2 nps absorption peak was obtained at 260 nm, as shown in the inset of Figure 5 (a) and (b). Absorption spectra were recorded for both AFB1 and OchA under similar conditions in the presence of MnO2nps. Two peaks were observed for AFB1 at 265 and 365 nm wavelength in which the broad peak at 365 nm of AFB1 shows a significant peak, as shown in Figure 5A. Similarly, two peaks were observed for OchA at 340 and 380 nm, where the 380 nm wavelength broad peak shows the major one, as shown in Figure 5B. The absorption intensities of both AFB1 and OchA were increased, with the addition of MnO2nps. This increase in the absorption peak of both toxins in the presence of MnO2 nps indicates the interaction with MnO2 nps.
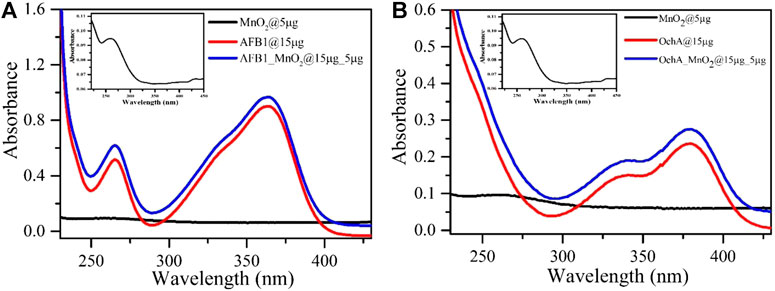
FIGURE 5. (A) UV-visible absorption plot of MnO2nps (zoomed image in both insets), AFB1, and AFB1 in the presence of MnO2nps. (B) UV-visible absorption plot of OchA and OchA in the presence of MnO2nps.
The interaction study was performed using different concentrations of AFB1 and OchA (400 ng ml−1–15 μg ml−1) at fixed MnO2 nps concentrations. The molecular interaction between the chromophore and nucleic acid was observed based on the absorption spectra changes and shifting of the wavelength toward the red/blue side (Hajian and Guan Huat, 2013).
The interaction between AFB1 (Figure 6A) and OchA (Figure 6B) with MnO2 nps was measured using the principle of UV titration method. In this phenomenon, the absorption peak of AFB1 for the highest concentration (15 μg ml−1) at 365 nm wavelength was observed to be highest because of maximum interaction and energy exchange from MnO2 nps to AFB1. With decreasing the concentration of AFB1, the sequential decreased in absorption peaks was observed due to fewer AFB1 molecules in the solution. On the other hand, OchA also performed similarly to that of AFB1. In the case of OchA, the absorption peak for the highest concentration (15 μg ml−1) was observed at 380 nm wavelength, and by decreasing the concentration, the absorption decreased. Thus, using the same MnO2 nps, the two different mycotoxins AFB1 and OchA, were detected at the different absorption wavelengths.
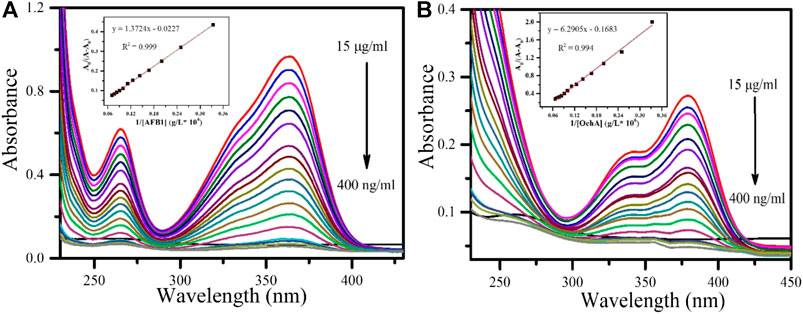
FIGURE 6. UV-visible response study of (A) AFB1 at different concentrations (inset) calibration curve of AFB1 (B) OchA at different concentrations (inset) calibration curve of OchA.
The continuous decrease in the concentration from 15 μg ml−1–400 ng ml−1 of AFB1 and OchA led to a change in absorption spectra intensity, which was slowly saturated. The peak intensity at 365 nm corresponding to AFB1 decreases with the decrease in the concentration of AFB1. Similarly, for OchA, the decreasing pattern corresponded to 380 nm and decreased the concentrations. This approach was followed by calculating the binding constant between MnO2 nps and AFB1, determined using the Wolfe–Shimer equation. (Hajian et al., 2017) (Hajian and Guan Huat, 2013) The Wolfe–Shimer equation is given below:
Here, A0 and A represent the absorbance of MnO2nps in the absence and presence of AFB1 and OchA, respectively, εG, εH-G are their respective absorption coefficient, kb represents the binding constant, and [AFB1] and [OchA] shows the concentration of [AFB1] and [OchA].
A linear plot was observed between
3.4 Spiked Sample Study
The response of AFB1 and OchA was also monitored in the spiked real corn sample with varying concentrations of 15 μg ml−1 to 1 μg ml−1 under similar conditions shown in Figure 7 (A) and (B), respectively. During the measurement, the above‐mentioned concentrations of each AFB1 and OchA were spiked in the corn sample. In the case of AFB1 Figure 7A, the magnitude of the spiked sample's absorbance was increased slightly compared to AFB1. The recovery percentage of the spiked sample was obtained between 78.26 and 109.42%. On the other hand, the spiked OchA sample's absorbance was much decreased compared to OchA (Figure 7B), and the recovery percentage was recorded between 17.5 and 89.13%.
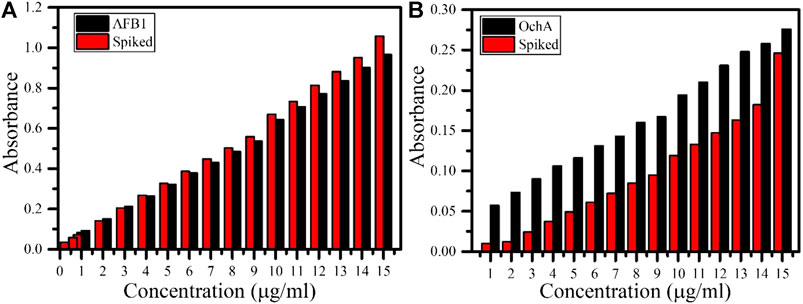
FIGURE 7. Spiked corn sample study in comparison of (A) AFB1 and (B) OchA.
3.5 Interferent Study
The interference study was carried out to prove the proposed system's applicability in real corn samples, as shown in Figure 8 for AFB1(A) and OchA (B) separately. This study was carried out in the presence of fumonisin (FuB1) mycotoxin and naturally occurring chemicals in corn, such as d-fructose, cellulose, and starch. To test the selectivity, 10 ug ml−1 of interferents (FuB1, d-fructose, cellulose, and starch) were introduced inside the solution MnO2 nps, and absorption spectra were recorded. Results have shown the higher selectivities for AFB1 and OchA with MnO2 nps compared to various interferents.
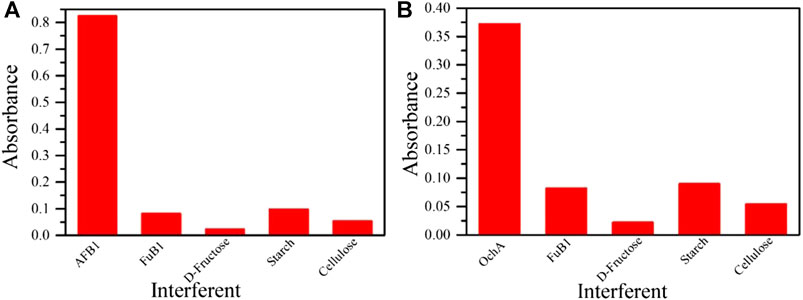
FIGURE 8. Selectivity studies of (A) AFB1 and (B) OchA.
3.6 Thermodynamic Analysis
To understand the mechanism involved in the titration interactions, the thermodynamic parameters help. The Gibbs free energy of the system was therefore calculated. The Gibbs free energy is the thermodynamic system that measures the thermodynamic parameter at constant temperature and pressure. Study of Gibbs free energy for AFB1 led to the driving forces that govern the binding of AFB1 to MnO2 nps. The driving forces dictate the association between AFB1 and MnO2 nps, which results from interaction and energy exchange among them. In this respect, the thermodynamic analysis was carried out to investigate the standard Gibbs free energy (ΔG0) change for the binding of AFB1 and OchA with MnO2 nps. (Hajian and Guan Huat, 2013). The expression of a standard Gibbs relation is given below:
where R is gas constant, and T is the temperature (25°C) in Kelvin.
The calculated Gibbs free energy for the interaction between AFB1 and OchA with MnO2 nps are −24.002 and −25.256 kJ/mol, respectively. The interaction between the AFB1 and OchA with MnO2 nps took place through electrostatic interaction because of the positive nature of MnO2 nps as it interacts with AFB1 and OchA. As is shown in Figures 5A,B, the UV-visible absorption spectra of AFB1 and OchA have maximum absorption peaks at 365 and 380 nm, respectively. The intensity enhancement of the absorption peaks of MnO2 nps after toxins is the preliminary identification of interaction. The increase of the absorption spectra was associated with the AFB1, and OchA molecules adsorbed at the interface of the MnO2 nps. The schematic illustration to propose electrostatic interaction between MnO2 nps with AFB1 and OchA is shown in Figure 9. The outcomes of the sensing performance achieved in this research and comparison of reported systems are summarized in Table 1. In all the reported literature, the photoluminescence property of SPR was mainly used, whereas, in the present study, the sensing parameter was absorbance change through the UV-titration method. Also, in the present study, two toxins AFB1 and OchA were studied simultaneously with different absorbance wavelengths.
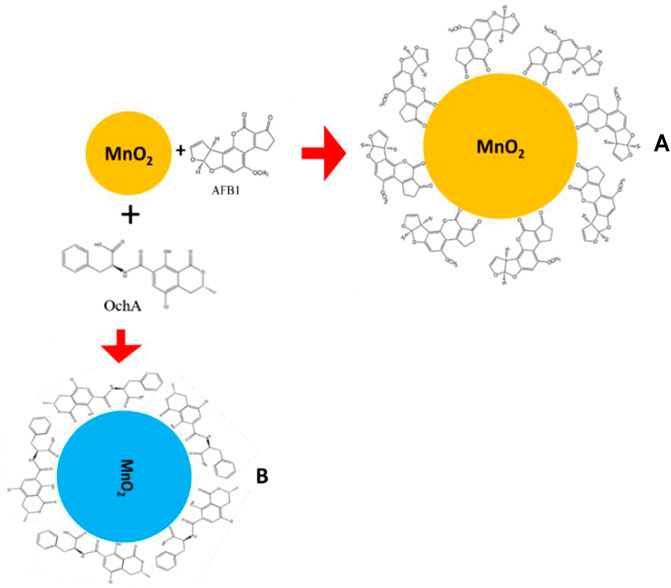
FIGURE 9. Schematic of interaction between MnO2 nps and AFB1 (A) and OchA (B) explaining a sequential decrease in the absorbance of OchA.
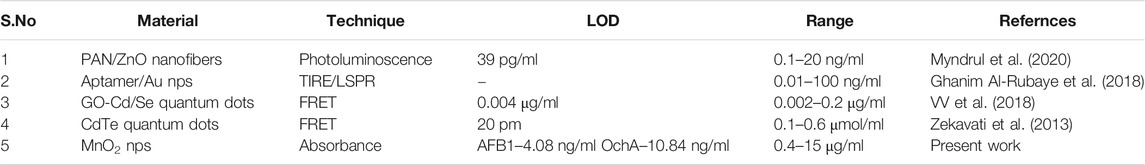
TABLE 1. Summary of sensing performance in comparison to reported sensors.
4 Conclusion
This research, for the first time, presented MnO2 nps for bio‐active, mediator, and labeled free detection of AFB1 and OchA rapidly and at a very low level. In this optical sensing approach, it is observed that the UV-visible spectroscopic technique exhibited a well-defined distinguished absorption peak for AFB 1 and OchA at wavelengths of 365 and 380 nm, respectively, binding with MnO2 nps. Such a distinguished absorption band, specific to the targeted toxin, varied as a function of AFB 1 and OchA concentration. Such MnO2 nps-toxin (AFB1/OchA) exhibited detection range as 15 μg ml−1–400 ng ml−1 and LOD as 4.08 (AFB1)/10.84 (OchA) ng/ml. We believe that such of highly sensitive MnO2 nps based AFB1 and OchA optical sensing can be developed as an analytical system of reduced form factor with potential application in food safety management.
Data Availability Statement
The original contributions presented in the study are included in the article/Supplementary Material, further inquiries can be directed to the corresponding authors.
Author Contributions
All the authors discussed and visualized scientific aspects of the research. AKS, TKD and GBVSL conducted experiments. AK and PRS guided well throughout the research.
Conflict of Interest
The authors declare that the research was conducted in the absence of any commercial or financial relationships that could be construed as a potential conflict of interest.
Acknowledgments
The authors are thankful to AIRF (JNU) and SCNS for providing instrumentation facilities. AKS thanks UGC for financial support. GBVSL thanks DST for the Women Scientist project. Financial support was obtained from the department of biotechnology through the Indo-Russia project.
References
Abarca, M. L., Bragulat, M. R., Castella, G., and Cabanes, F. J. (1994). Ochratoxin A production by strains of Aspergillus niger var. niger. Appl. Environ. Microbiol. 60, 2650–2652. doi:10.1128/AEM.60.7.2650-2652.1994
Abramson, D., Usleber, E., and Märtlbauer, E. (1995). An indirect enzyme immunoassay for the mycotoxin citrinin. Appl. Environ. Microbiol. 61, 2007–2009. doi:10.1128/AEM.61.5.2007-2009.1995
Administration (FAD) (1988). Action levels for added poisonous or deleterious substances in food. Not. Fed. Regist. 53, 5043–5044.
Azri, F. A., Sukor, R., Selamat, J., Abu Bakar, F., Yusof, N. A., and Hajian, R. (2018). Electrochemical immunosensor for detection of aflatoxin B1 based on indirect competitive ELISA. Toxins 10, 196. doi:10.3390/toxins10050196
Bajpai, V. K., Shukla, S., Khan, I., Kang, S.-M., Haldorai, Y., Tripathi, K. M., et al. (2019). A sustainable graphene aerogel capable of the adsorptive elimination of biogenic amines and bacteria from soy sauce and highly efficient cell proliferation. ACS Appl. Mater. Interf. 11, 43949–43963. doi:10.1021/acsami.9b16989
Barai, H. R., Banerjee, A. N., Hamnabard, N., and Joo, S. W. (2016). Synthesis of amorphous manganese oxide nanoparticles–to–crystalline nanorods through a simple wet-chemical technique using K+ ions as a ‘growth director’and their morphology-controlled high performance supercapacitor applications. RSC Adv. 6, 78887–78908. doi:10.1039/c6ra18811g
Battacone, G., Nudda, A., Palomba, M., Pascale, M., Nicolussi, P., and Pulina, G. (2005). Transfer of aflatoxin B1 from feed to milk and from milk to curd and whey in dairy sheep fed artificially contaminated concentrates. J. Dairy Sci. 88, 3063–3069. doi:10.3168/jds.S0022-0302(05)72987-8
Borneman, J., and Becker, J. O. (2007). Identifying microorganisms involved in specific pathogen suppression in soil. Annu. Rev. Phytopathol. 45, 153. doi:10.1146/annurev.phyto.45.062806.094354
Cancer (1982). Chemicals, industrial processes and industries associated with cancer in humans. IARC Monogr. Eval. Carcinog. Risk Chem. Hum. Suppl. 1982, 7–24.
Crook, M. (2003). Handbook of toxicologic pathology. J. Clin. Pathol. 56, 160. doi:10.1136/jcp.56.2.160-b
Dhiman, T. K., Lakshmi, G., Kumar, R., Asokan, K., and Solanki, P. R. (2020). Non-enzymatic detection of Glucose using a capacitive nanobiosensor based on PVA capped CuO synthesized via co-precipitation route. IEEE Sensor. J. 20, 10415–10423. doi:10.1109/JSEN.2020.2994356
Dhiman, T. K., Lakshmi, G., Roychoudhury, A., Jha, S. K., and Solanki, P. R. (2019). Ceria‐nanoparticles‐based microfluidic nanobiochip electrochemical sensor for the detection of ochratoxin‐A. Chemistry 4, 4867–4873. doi:10.1002/slct.201803752
Duarte, S. C., Pena, A., and Lino, C. M. (2010). A review on ochratoxin A occurrence and effects of processing of cereal and cereal derived food products. Food Microbiol. 27, 187–198. doi:10.1016/j.fm.2009.11.016
Feng, Q., Miyai, Y., Kanoh, H., and Ooi, K. (1992). Lithium (1+) extraction/insertion with spinel-type lithium manganese oxides. Characterization of redox-type and ion-exchange-type sites. Langmuir 8, 1861–1867. doi:10.1021/la00043a029
Gallo, A., Ferrara, M., and Perrone, G. (2017). Recent advances on the molecular aspects of ochratoxin A biosynthesis. Curr. Opin. Food Sci. 17, 49–56. doi:10.1016/j.cofs.2017.09.011
Ganeshan, S., Ramasundari, P., Elangovan, A., Arivazhagan, G., and Vijayalakshmi, R. (2017). Synthesis and characterization of MnO2 nanoparticles: study of structural and optical properties. Int. J. Sci. Res. Phys. Appl. Sci. 5, 5–8. doi:10.26438/ijsrpas/v5i6.58
Gao, T., Glerup, M., Krumeich, F., Nesper, R., Fjellvåg, H., and Norby, P. (2008). Microstructures and spectroscopic properties of cryptomelane-type manganese dioxide nanofibers. J. Phys. Chem. C 112, 13134–13140. doi:10.1021/jp804924f
Ghanim Al-Rubaye, A., Nabok, A., Catanante, G., Marty, J.-L., Takács, E., and Székács, A. (2018). Label-free optical detection of mycotoxins using specific aptamers immobilized on gold nanostructures. Toxins 10, 291. doi:10.3390/toxins10070291
Hajian, R., and Guan Huat, T. (2013). Spectrophotometric studies on the thermodynamics of the ds-DNA interaction with irinotecan for a better understanding of anticancer drug-DNA interactions. J. Spectrosc. 2013, 1–8. doi:10.1155/2013/380352
Hajian, R., Hossaini, P., Mehrayin, Z., Woi, P. M., and Shams, N. (2017). DNA-binding studies of valrubicin as a chemotherapy drug using spectroscopy and electrochemical techniques. J. Pharm. Anal. 7, 176–180. doi:10.1016/j.jpha.2017.01.003
Heenan, C. N., Shaw, K. J., and Pitt, J. I. (1998). Ochratoxin A production by Aspergillus carbonarius and A. niger isolates and detection using coconut cream agar. J. Food Mycol. 1 (2), 67–72.
Henry, S. H., Bosch, F. X., Troxell, T. C., and Bolger, P. M. (1999). Reducing liver cancer–global control of aflatoxin. Science 286 (80), 2453–2454. doi:10.1126/science.286.5449.2453
Jaimez, J., Fente, C. A., Vazquez, B. I., Franco, C. M., Cepeda, A., Mahuzier, G., et al. (2000). Application of the assay of aflatoxins by liquid chromatography with fluorescence detection in food analysis. J. Chromatogr. A 882, 1–10. doi:10.1016/s0021-9673(00)00212-0
Jouni, F. J., Zafari, J., Abdolmaleki, P., Vazini, H., Ghandi, L., and Satari, M. (2018). Aflatoxin M1 detoxification from infected milk using Fe3O4 nanoparticles attached to specific aptamer. J. Nanostruct. Chem. 8, 13–22. doi:10.1007/s40097-017-0250-5
Kang, L., Zhang, M., Liu, Z.-H., and Ooi, K. (2007). IR spectra of manganese oxides with either layered or tunnel structures. Spectrochim. Acta Mol. Biomol. Spectrosc. 67, 864–869. doi:10.1016/j.saa.2006.09.001
Kaushik, A., Solanki, P. R., Pandey, M. K., Ahmad, S., and Malhotra, B. D. (2009a). Cerium oxide-chitosan based nanobiocomposite for food borne mycotoxin detection. Appl. Phys. Lett. 95, 173703. doi:10.1063/1.3249586
Kaushik, A., Solanki, P. R., Sood, K. N., Ahmad, S., and Malhotra, B. D. (2009b). Fumed silica nanoparticles–chitosan nanobiocomposite for ochratoxin-A detection. Electrochem. Commun. 11, 1919–1923. doi:10.1016/j.elecom.2009.08.016
Keller, J., Moldenhauer, D., Byrne, L., Haase, H., Resch-Genger, U., and Koch, M. (2018). Complexes of the mycotoxins citrinin and ochratoxin A with aluminum ions and their spectroscopic properties. Toxins 10, 538. doi:10.3390/toxins10120538
Kujur, V. S., and Singh, S. (2020). Structural, magnetic, optical and photocatalytic properties of GaFeO3 nanoparticles synthesized via non-aqueous solvent-based sol–gel route. J. Mater. Sci. Mater. Electron., 1–14. doi:10.1007/s10854-020-04318-2
Kőszegi, T., and Poór, M. (2016). Ochratoxin A: molecular interactions, mechanisms of toxicity and prevention at the molecular level. Toxins 8, 111. doi:10.3390/toxins8040111
Lim, C. W., Yoshinari, T., Layne, J., and Chan, S. H. (2015). Multi-mycotoxin screening reveals separate occurrence of aflatoxins and ochratoxin a in Asian rice. J. Agric. Food Chem. 63, 3104–3113. doi:10.1021/acs.jafc.5b00471
Liu, B., Huang, R., Yu, Y., Su, R., Qi, W., and He, Z. (2018). Gold nanoparticle-aptamer-based lspr sensing of ochratoxin a at a widened detection range by double calibration curve method. Front. Chem. 6, 94. doi:10.3389/fchem.2018.00094
Liu, X., Chen, C., Zhao, Y., and Jia, B. (2013). A review on the synthesis of manganese oxide nanomaterials and their applications on lithium-ion batteries. J. Nanomater. 2013, 7. doi:10.1155/2013/736375
Marin, D. E., and Taranu, I. (2015). Ochratoxin A and its effects on immunity. Toxin Rev. 34, 11–20. doi:10.3109/15569543.2014.958757
Myndrul, V., Coy, E., Bechelany, M., and Iatsunskyi, I. (2020). Photoluminescence label-free immunosensor for the detection of Aflatoxin B1 using polyacrylonitrile/zinc oxide nanofibers. Mater. Sci. Eng. C 118, 111401. doi:10.1016/j.msec.2020.111401
Payne, G. A., and Brown, M. P. (1998). Genetics and physiology of aflatoxin biosynthesis. Annu. Rev. Phytopathol. 36, 329–362. doi:10.1146/annurev.phyto.36.1.329
Pflaum, T., Hausler, T., Baumung, C., Ackermann, S., Kuballa, T., Rehm, J., et al. (2016). Carcinogenic compounds in alcoholic beverages: an update. Arch. Toxicol. 90, 2349–2367. doi:10.1007/s00204-016-1770-3
Pfohl‐Leszkowicz, A., and Manderville, R. A. (2007). Ochratoxin A: an overview on toxicity and carcinogenicity in animals and humans. Mol. Nutr. Food Res. 51, 61–99. doi:10.1002/mnfr.200600137
Pitt, J. I. (2000). Toxigenic fungi and mycotoxins. Br. Med. Bull. 56, 184–192. doi:10.1258/0007142001902888
Purtov, K. V., Shenderova, O. A., Luo, M., Brenner, D. W., and Bondar, V. S. (2007). The adsorption of aflatoxin B1 by detonation-synthesis nanodiamonds. Dokl. Biochem. Biophys. 417, 299–301. doi:10.1134/s1607672907060026
Ragupathy, P., Vasan, H. N., and Munichandraiah, N. (2007). Synthesis and characterization of nano-MnO2 for electrochemical supercapacitor studies. J. Electrochem. Soc. 155, A34. doi:10.1149/1.2800163
Roberts, S. M., James, R. C., and Williams, P. L. (2014). Principles of toxicology: environmental and industrial applications. Gainesville, Florida: John Wiley and Sons, 496.
Ronchi, B., Danieli, P. P., Vitali, A., Sabatini, A., Bernabucci, U., and Nardone, A. (2005). “Evaluation of AFB1/AFM1 carry-over in lactating goats exposed to different levels of AFB1 contamination,” in Book of abstracts of the 56th annual meeting of the european association for animal production. Uppsala, Sweden: EAAP, 1–10.
Sarkar, T., Dhiman, T., Sajwan, R., Sri, S., and Solanki, P. R. (2020). Studies on carbon quantum dots embedded iron oxide nanoparticles and their electrochemical response. Nanotechnology 31 (35), 355502. doi:10.1088/1361-6528/ab925e
Sarma, U. P., Bhetaria, P. J., Devi, P., and Varma, A. (2017). Aflatoxins: implications on health. Indian J. Clin. Biochem. 32, 124–133. doi:10.1007/s12291-017-0649-2
Shukla, S., Khan, I., Bajpai, V. K., Lee, H., Kim, T., Upadhyay, A., et al. (2019). Sustainable graphene aerogel as an ecofriendly cell growth promoter and highly efficient adsorbent for histamine from red wine. ACS Appl. Mater. Interfaces. 11, 18165–18177. doi:10.1021/acsami.9b02857
Singh, A. K., Dhiman, T. K., Lakshmi, G., and Solanki, P. R. (2020). Dimanganese trioxide (Mn2O3) based label-free electrochemical biosensor for detection of Aflatoxin-B1. Bioelectrochemistry 137, 107684. doi:10.1016/j.bioelechem.2020.107684
Smith, J. E., Solomons, G., Lewis, C., and Anderson, J. G. (1995). Role of mycotoxins in human and animal nutrition and health. Nat. Toxins. 3, 187–192. doi:10.1002/nt.2620030404
Solanki, P. R., Kaushik, A., Manaka, T., Pandey, M. K., Iwamoto, M., Agrawal, V. V., et al. (2010). Self-assembled monolayer based impedimetric platform for food borne mycotoxin detection. Nanoscale 2, 2811–2817. doi:10.1039/c0nr00289e
Van der Merwe, K. J., Steyn, P. S., Fourie, L., Scott, D. B., and Theron, J. J. (1965). Ochratoxin A, a toxic metabolite produced by Aspergillus ochraceus Wilh. Nature 205, 1112–1113. doi:10.1038/2051112a0
van Egmond, H. P., and Dekker, W. H. (1996). Worldwide regulations for mycotoxins—a compendium. FAO Food Nutr. Pap. 64, 1–43.
van Egmond, H. P., and Jonker, M. A. (2004). Worldwide regulations for mycotoxins in food and feed in 2003. Bilthoven, Netherlands: Food and Agriculture Organization of the United Nations, 188.
Velu, R., and DeRosa, M. C. (2018). Lateral flow assays for Ochratoxin A using metal nanoparticles: comparison of “adsorption–desorption” approach to linkage inversion assembled nano-aptasensors (LIANA). Analyst 143, 4566–4574. doi:10.1039/c8an00963e
VV, A. K. Y., Renuka, R. M., Achuth, J., Mudili, V., and Poda, S. (2018). Development of a FRET-based fluorescence aptasensor for the detection of aflatoxin B1 in contaminated food grain samples. RSC Adv. 8, 10465–10473. doi:10.1039/C8RA00317C
Wei, W., Cui, X., Chen, W., and Ivey, D. G. (2011). Manganese oxide-based materials as electrochemical supercapacitor electrodes. Chem. Soc. Rev. 40, 1697–1721. doi:10.1039/c0cs00127a
Zekavati, R., Safi, S., Hashemi, S. J., Rahmani-Cherati, T., Tabatabaei, M., Mohsenifar, A., et al. (2013). Highly sensitive FRET-based fluorescence immunoassay for aflatoxin B1 using cadmium telluride quantum dots. Microchim. Acta. 180, 1217–1223. doi:10.1007/s00604-013-1047-y
Keywords: direct sensing, nano-system, manganese oxide, UV-visible spectroscopy, aflatoxin-B1, Ochratoxin-A
Citation: Singh AK, Lakshmi GBVS, Dhiman TK, Kaushik A and Solanki PR (2021) Bio-Active Free Direct Optical Sensing of Aflatoxin B1 and Ochratoxin A Using a Manganese Oxide Nano-System. Front. Nanotechnol. 2:621681. doi: 10.3389/fnano.2020.621681
Received: 26 October 2020; Accepted: 29 December 2020;
Published: 05 March 2021.
Edited by:
Kumud Malika Tripathi, Indian Institute of Petroleum and Energy (IIPE), IndiaReviewed by:
Sridhar Reddy Bezawada, Indian Institute of Petroleum and Energy (IIPE), IndiaShiv Singh, Advanced Materials and Processes Research Institute (CSIR), India
Anshul Sharma, Gachon University, South Korea
Copyright © 2021 Singh, Lakshmi, Dhiman, Kaushik and Solanki. This is an open-access article distributed under the terms of the Creative Commons Attribution License (CC BY). The use, distribution or reproduction in other forums is permitted, provided the original author(s) and the copyright owner(s) are credited and that the original publication in this journal is cited, in accordance with accepted academic practice. No use, distribution or reproduction is permitted which does not comply with these terms.
*Correspondence: Ajeet Kaushik, YWplZXQubnBsQGdtYWlsLmNvbQ==; Pratima R. Solanki, cGFydGltYUBtYWlsLmpudS5hYy5pbg==