- Biomedical Technology Wing, Sree Chitra Tirunal Institute for Medical Sciences and Technology, Trivandrum, Kerala, India
Although ZnSe/ZnS quantum dots (QDs) have emerged as apparently less hazardous substitute to cadmium-based QDs, their toxicity has not been fully understood. Huge levels of ROS production and associated difficulties comprise the underlying reason for nanomaterial toxicity in cells. This will cause both immunotoxicity and genotoxicity. In the current work, Zinc Selenium/Zinc Sulphide (ZnSe/ZnS) QDs was synthesized, characterized and analyzed for its role in oxidative stress induction in two cell lines (HepG2 and HEK) and Swiss Albino mice. ROS production and influence of catalase activity in ROS production measured by DCFHDA assay in both HepG2 and HEK cells after exposure to ZnSe/ZnS QDs. Assessment of nitrile radical formation carried out by griess reagent. Level of GSH is assessed as a marker for oxidative stress induced by QDs. Cell death induced after exposure to ZnSe/ZnS QDs investigated by Calcein AM-PI live dead assay. Apoptotic DNA ladder assay carried out for studying the potential of ZnSe/ZnS QDs to induce DNA fragmentation. In vivo bio-nano interaction was studied by exposing Swiss Albino mice to ZnSe/ZnS QDs via i.v. and i.p. injection. Antioxidant assays were carried out in brain and liver homogenates to study the oxidative stress. LPO, GSH, GPx, GR and SOD are considered as biomarkers for the stress analysis. Blood brain barrier (BBB) integrity also studied. Spleenocytes proliferation assay was carried out to study the immunotoxicity response. ZnSe/ZnS QDs do not induce visible oxidative stress upto a concentration of 50 μg/ml. Cell death occurs at higher concentration (100 μg/ml) caused by ROS production. Overall study apparently provide attentive information that ZnSe/ZnS QDs is not capable of eliciting any serious damages to liver and brain tissues which in turn substantiates its applicability in biomedical applications.
Introduction
Quantum Dots (QDs) have attracted enough attention among researchers because of their wide ranging biomedical application potentials. This wide range application is due to the size-tunable, discrete fluorescence emission, tunable surfaceproperties, efficient luminescence along with their unique photostability behavior (Medintz et al., 2005; Michalet et al., 2005; Xing and Rao, 2008). They are used in the development of solar cells (Milliron et al., 2004; Pal et al., 2012) and light-emitting diodes (Mocatta et al., 2011) in the electrical field as well as in therapeutic delivery (Diagaradjane et al., 2008; Hu et al., 2010; Walker et al., 2012) and cellular imaging (Bagalkot et al., 2007; Hu et al., 2010.; Muthu et al., 2012). However, controversy on their safety concern exists. The mechanism behind the cytotoxicity induced by heavy metals containing QDs is well studied. The primary mechanism of cellular toxicity is widely been accepted as ionization of QDs and subsequent discharge of free Cd ions (Cd2+) (Kirchner et al., 2005a; Kirchner et al., 2005b; Su et al., 2010). These ions will induce ROS formation (Zhao et al., 2010; Tang et al., 2013; Katsumiti et al., 2014) and following oxidative stress (Lovri et al., 2005; Lee et al., 2009; Li et al., 2009).
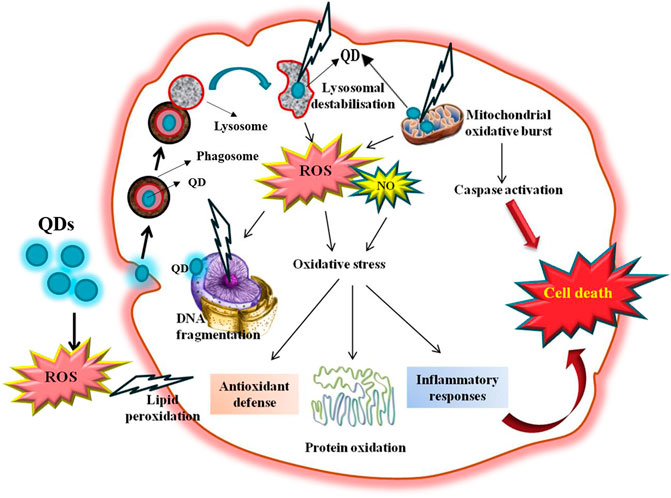
ROS is generally produced as a byproduct of cellular metabolic reactions. Upto a moderate level, they perform several obligatory roles in physiological processes. However, higher level exposure of ROS leads to oxidative stress, which further results in irreparable harm in cells and tissues. The imbalance in oxidative and antioxidative pool of molecules in body is termed as oxidative stress. The most sensitive biological targets for ROS are proteins, membrane lipids and DNA. ROS possess an inclination to give off or accept electrons as an attempt to reach stability; which generally exhibits shorter half-life than other reactive molecules. Two major categories of ROS are: free radicals and nonradicals. Free radicals contain one or more unpaired electrons which make the molecule reactive. When two free radicals share their unpaired electrons, it is termed as non-radicals. Physiologically significant three major ROS are superoxide anion (⋅O2−), hydroxyl radical (⋅OH) and hydrogen peroxide (H2O2). An endogenous antioxidant system is present inside the body to neutralize the upshot of oxidative molecules in ROS induced oxidative stress. There are two categories of scavengers of antioxidant defense system, enzymatic and nonenzymatic. Superoxide dismutase (SOD), Catalase (CAT), Glutathione peroxidase (GPx) etc., are the enzymatic and Vitamin A, C, E, β-Carotene, Glutathione are the nonenzymatic antioxidants. Such antioxidants selectively combine with free radicals and cease their reactivity prior to the destruction of essential biomolecules. Oxidative stress-mediated by ROS formation is one of the dominant mechanisms of QDs induced cytotoxicity. Elucidation of the free radical mechanism is very difficult because of the direct detection is impossible as a result of their high reactivity and short-life period. The antioxidant-ROS equilibrium gets perturbed during oxidative stress due to either diminishing of antioxidants or buildup of ROS. Elevated levels of ROS leads to structural instability to DNA strand and further results in modification of biomolecules including proteins and lipids, onset of stress induced transcriptional pathways, immunomodulation as well as apoptosis (Birben et al., 2012). There are many reports on the impact of heavy metals containing QDs on ROS production and oxidative stress analyzed in vitro as well as in vivo senario. As many of the literature explains the impact of heavy metals containing QDs on ROS production and oxidative stress analyzed in vitro as well as in vivo. However, very fewer studies were carried out on the effect of heavy metal-free ZnSe/ZnS QDs on ROS production and oxidative stress induction. In the present study, oxidative stress induced by ZnSe/ZnS QDs studied in HepG2 and HEK cell lines and also the effect in apoptosis by DNA laddering. In view of higher levels of antioxidative substances in liver and brain, present study addresses an investigation of oxidative stress markers in liver and brain of mice. QDs are widely exploited as theranostics of the brain because of their ability to cross the BBB. Here, the impact of ZnSe/ZnS QDs on BBB integrity is also studied. Effect of ZnSe/ZnS QDs on immunomodulation by splenocyte proliferation also carried out.
Materials and Methods
Chemicals
High glucose (HG)-Dulbecco’s Modified Eagles Medium (DMEM), fetal bovine serum (FBS), phosphate buffered saline (Ca2+, Mg2+free PBS), trypsin EDTA, antibiotic and antimycotic solution were purchased from Gibco, Grand Island, NY, United States. Histopaque, griess reagent, sodium hydroxide, L-glutathione (GSH) sodium dodecyl sulphate (SDS), thiobarbituric acid and tris base were obtained from Sigma Chemicals Co. Ltd. (St. Louis, MO, United States). 2,7-dichlorofluoresceindiacetate (DCFH-DA) was purchased from Molecular probes, Invitrogen, Carlsbad, CA, United States. Diluent for DNA extractionwas purchased from Hi-media Pvt. Ltd. India. Calcien AMand apoptotic DNA ladder kit was purchased from Thermo Fisher Scientific, United States. Folin’s reagent was obtained from Merck, India. 3H-tritiated thymidine was obtained from American Radiolabelled Chemicals Inc, United States.
Assessment of Reactive Oxygen Species Formation by DCFHDA
Intracellular ROS can be detected using DCFH-DA (Dichloro dihydro fluorescein diacetate); the fluorimetric probe that enters the cell submissively. When this DCFH-DA reacts with ROS inside cells, it forms dichlorofluorescein (DCF); a highly fluorescent compound. 1 × 10⁴ cells were seeded into each well of a 96 well plate and allowed to grow for 24 h. Various concentrations of ZnSe/ZnS QDs (12.5, 25, 50, and 100 μg/ml) were prepared in DMEM and exposed to incubated cells for 6 and 24 h. 0.09% hydrogen peroxide (H2O2) was used as a positive control. After media removal and PBS wash, cells were incubated with 100 µl of DCFH-DA (1 µM) for 45 min in the dark. 200 µl PBS was added to all wells followed by removal of DCFH-DA. Fluorescence was measured using a microplate reader (Plate Chameleon TMV, Hidex, Finland) using 450/535 nm excitation/emission respectively.
Influence of Catalase Activity on ROS Production
Impact of ZnSe/ZnS QDs on catalase activity of HepG2 cells on ZnSe/ZnS QDs induced ROS was assessed using a catalase inhibitor sodium azide (NaN3). 1 × 10⁴ cells/well were seeded into a 96 well plate and allowed to attach overnight. The cells were pre-incubated with 0.1 µM NaN3 for 1 h. Cells were exposed with 12.5, 25, 50 and 100 μg/ml ZnSe/ZnS QDs. ROS production was estimated in the presence of DCFH-DA as described in section 3.13.15.1. The results were compared with that of cells exposed to QDs in the absence of catalase inhibitor.
Assessment of Nitrile Radical Formation by Griess Reagent
Griess reagent is used for the analysis of nitric oxide production in HepG2 cells. In brief, 1 × 10⁴ cells were seeded per well of a 96 well plate and incubated overnight. Cells were then exposed to 12.5, 25, 50, and 100 μg/ml of ZnSe/ZnS QDs for 6 and 24 h. Half the volume of supernatant (50 µl/well) was taken out and allowed to react with 50 µl of Griess reagent for 10 min in dark at room temperature. The absorbance was read at 540 nm using a multiwell plate reader (Bio-Tek, Winooski, United States). A standard graph was prepared using sodium nitrate (0.5, 2.5, 5 and 7.5 μg/ml) and concentration of nitric oxide was calculated.
Assessment of Oxidative Stress Induced by QDs
Various concentrations of ZnSe/ZnS QDs were exposed to cells (6 × 10⁶) in a 25 cm2 culture flask for 24 h. After QD treatment, the cells were scraped off and washed with pre-cooled 1X phosphate buffered solution (1X PBS). Cell pellet thus obtained was lyzed using lysis buffer (20 mM Tris-HCl with pH 7.5, 150 mM NaCl and 1 mM Na2EDTA, 1% Triton, 2.5 mM sodium pyrophosphate). The cells were centrifuged at 15,000 g for 10 min at 4°C. The cell extract (supernatant) was preserved on ice until the evaluation of oxidative stress biomarkers. Protein content was measured using Lowry’s method (Lowry et al., 1951) with bovine serum albumin (BSA) as standard.
Protein Estimation
Cell lysis was carried out as mentioned in section 3.13.16.1. The total protein in the lysate was assessed by Lowry’s method. This method has a sensitivity between 0.01–1 mg/ml and it relies on the reaction between Cu2+ ions generated from oxidative cleavage of peptide bonds and the Folin-Ciocalteu reagent. The experimental procedure is carried out as described in Table 1 (a). Reading was taken at 660 nm using Lambda 25, UV/Vis spectrophotometer, Perkin Elmer, United States. The protein concentration is calculated from the standard graph (BSA as standard).
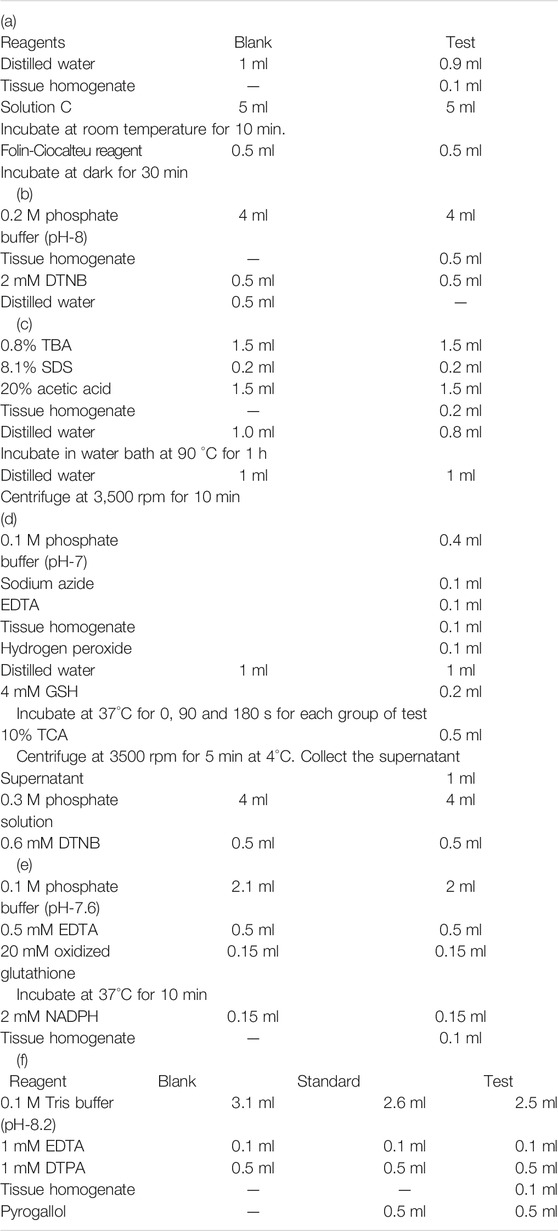
TABLE 1. (a) Protein estimation by Lowry’s method; Reaction mixture for (b) LPO assay(c) GSH level (d) GPx (e) GR (f) SOD activity estimation.
Glutathione Levels
Quantification of glutathione levels was done by the method proposed by Moron et al., 1979 using Ellman’s reagent. The assay mixture contained 4 ml of 0.2 M phosphate buffer and 0.5 ml of cell extract (Table 1 (c)) and 0.5 ml of 2 mM DTNB (5,5-dithio-bis-(2-nitrobenzoic acid). Measurement was obtained using Lambda 25, UV/Vis spectrophotometer, Perkin Elmer, United States at 412 nm. The amount of glutathione was expressed in terms of nmol glutathione/mg protein.
DNA Ladder Assay
Inter-nucleosomal DNA fragmentation is one of the characteristics of apoptosis and was carried out by activated nuclease. 3 × 10⁶ cells were cultured in T25 flasks at 37°C for overnight. The cells were subsequently treated with 12.5, 25, 50 and 100 μg/ml of ZnSe/ZnS QDs for 24 h. DNA ladder assay was performed as per the manufacturer’s instructions using Quick Apoptotic DNA ladder detection kit. After exposure, cell pellets were obtained and washed well with PBS. 35 μl of TE lysis buffer and 5 μl Enzyme A were used to lyse cells and incubated for 10 min in water bath at 37°C. Enzyme B solution was added andincubated for 30 min at 50°C. DNA was then precipitated using Ammonium acetate solution and absolute ethanol at −20°C. This mixture was centrifuged at 12,000 rpm for 10 min and the cell pellet was obtained. The pellet was air dried for 10 min and resuspended in 30 μl DNA suspension buffer. DNA was loaded on to 1.2% agarose gel provided with 0.5 μg/ml ethidium bromide in 1X TBE (Tris/Borate/EDTA) running buffer and run at 5 V/cm for 1–2 h. DNA bands were visualized using a transilluminator (Bio Imaging system, Syngene, United Kingdom).
Live Dead Assay by Calcien AM-PI
1 × 10⁶ cells were seeded into each well of a 96 well plate and allowed to attach overnight.
Different concentrations of ZnSe/ZnS QDs (12.5, 25, 50 and 100 μg/ml) were added to cells and incubated for 6 and 24 h. Harvested cells were then washed with PBS and treated with calcein AM (1 μg/ml) for 45 min in dark. After centrifugation, these cells were resuspended in 500 µl PBScontaining 0.25 µl of PI and kept for 5 min in dark. These cells were subjected to flow cytometric analysis a using flow cytometer (DAKO GALAXY, Germany) with 630 nm long pass filter.
Effects of ZnSe/ZnS QDs on Antioxidant Capacities of the Liver and Brain
A portion of liver and brain collected from the treated and untreated mice after euthanization and were subjected to estimate the antioxidant levels as mentioned below.
Sample Preparation
Liver and brain were collected at the end of 3, 7 and 14 days after exposure of ZnSe/ZnS QDs in mice. The isolated organs were washed in saline and transferred to a container kept on ice. Tissue homogenate (10%) was prepared in 0.1 M phosphate buffer (pH 7.4) by keeping the samples on ice. The tissue was homogenized at 1,000 rpm using tissue homogeniser, Polytron P 3100 (Switzerland). The supernatant of the homogenate was collected after centrifugation at 3,500 rpm for 10 min at 4°C. The supernatant was maintained on ice for further use.
Total Protein Estimation
Amount of total protein in tissue homogenate was assessed by Lowry’s method. This method based on the reaction between Folin-Ciocalteu reagent and copper ions released from protein linkages. This method is sensitive down to a range of 10 μg/ml. Incubation time and pH is very crucial for getting the reproducible data. The experimental procedure is as described in Table 1 (a). Solution C described in the table was prepared by mixing 50 ml solution of sodium carbonate (1 g in 50 ml distilled water) and 1 ml solution of sodium potassium tartarate (10 mg) and 5 mg copper sulphate. Reading was taken at 660 nm using Lambda 25, UV/Vis spectrophotometer, Perkin Elmer, United States. The protein concentration is calculated from the bovine serum albumin (BSA) standard graph.
Lipid Peroxidation
Oxidative damage occurring in lipids was assessed based on malonedialdehyde (MDA) level; released as a byproduct of lipid peroxidation (LPO). The method was adopted from the protocol proposed by Ohkawa et al., 1979. Detailed experimental procedure given in the Table 1 (b). Final pink colored solution formed from the reaction between thiobarbituric acid and MDA was subjected to spectrophotometer analysis (Lambda 25, UV/Vis spectrophotometer, Perkin Elmer, United States) at 532 nm.
Reduced Glutathione (GSH)
Moron et al., 1979 developed a method for detecting the GSH level in the cells. Yellow colored product formed from reaction between GSH and DTNB [5, 5′-dithiobis-(2-nitrobenzoic acid)) was detected spectrophotometrically at 412 nm using Lambda 25, UV/Vis spectrophotometer, Perkin Elmer, United States. Detailed experimental procedure given in the Table 1 (c).
Glutathione Peroxidase
Rotruck et al., 1973 developed a method for the detection of GPx. GPx is an enzyme family that induces the oxidation of GSH to form GSSG in the presence of H2O2 with water as the by-product i.e. 2GSH + H2O2 → GS-SG + 2H2O. Spectrophotometer (Lambda 25, UV/Vis spectrophotometer, Perkin Elmer, United States) was used to obtain reading at 412 nm. Each step of the procedure is given in Table 1 (d).
Glutathione Reductase
GR converts GSSH back to GSH in the presence of NADPH. The method was developed by Mize and Langdon., 1962. The reaction contents are given in Table 1 (e). The reading was taken at 0, 1, 2 and 3 min at a wavelength of 340 nm (Lambda 25, UV/Vis spectrophotometer, Perkin Elmer, United States).
Superoxide Dismutase
SOD assay was carried out in liver and brain homogenate using modified pyrogallol auto oxidation method developed by Marklund and Marklund., 1974. Reading was taken at 420 nm (Lambda 25, UV/Vis spectrophotometer, Perkin Elmer, United States) immediately after the addition of pyrogallol at 0, 1, 2 and 3 min. Detailed procedure is given in Table 1 (f).
Blood Brain Barrier Integrity
Break down of blood brain barrier leads to water influx and concomitant increase in water content. The protocol was proposed by Yang et al., 2015 was followed to estimate the brain water content. Mice were exposed to ZnSe/ZnS QDs at a dosage of 10 mg/kg body weight. At the end of 3, 7 and 14 days, brain was collected carefully and wet weight was noted. Brain samples were dried at 110°C for 24 h prior to take dry weight. The brain water content was calculated as: Percentage water content = (wet weight-dry weight)/wet weight × 100%.
Immunotoxicity by Splenocyte Proliferation Assay
Immunotoxicity of ZnSe/ZnS QDs assessed by the splenocyte proliferation assay. The splenocytes of animals isolated after each observation period. Spleen was transferred to cold PBS containing antibiotic/antimicotics and was placed on a metallic cell strainer kept over 10 mm petridish under sterile condition. Spleen was mashed by softly teasing it over the metallic cell strainer. The single cell suspension was kept carefully over histopaque and centrifuged at 1,500 rpm for a time period of 40 min. The cells present in the resulting buffy coat were isolated and washed three times with PBS. 2 × 10⁵ cells/well in DMEM medium supplemented with 10% FBS were cultured for the experiment. After 48 h, 0.5 μCi of tritiated thymidine was added to each well and incubated for 24 h. Later, Trichloroacetic acid (5% solution) was used for cell fixation and SDS/NaOH lysis buffer was used to cell lysis. Then, scintillation fluid was added and Scintillation counter (Hidex, Finland) was used to find the radioactivity. The values were expressed as mean ± SD of counts per minute (CPM).
Results
Assessment of ROS Formation by DCFHDA
Intracellular ROS production is one among the very primary responses happening in account of nanoparticle toxicity and DCFHDA was used for its measurement. The results are expressed in relative fluorescence intensity (RFU) (Figure 1A). None of the ZnSe/ZnS QDs treated group exhibited statistically significant increase in ROS formation in HepG2 cells (12.5 μg/ml: 102.15 ± 28.01, 25 μg/ml: 102.54 ± 16.7, 50 μg/ml: 105.44 ± 23, 100 μg/ml: 106.81 ± 30.2) at 6 h. The ROS formation after 24 h exposure was (12.5 μg/ml: 99.32 ± 24.24, 25 μg/ml: 106.15 ± 28.2, 50 μg/ml: 118.23 ± 13.19, 100 μg/ml: 129.09 ± 42.93). In case of HEK cells, significant increase (25%) in DCF fluorescence can be seen only at 100 μg/ml concentrations at 6 h. ROS production was comparable with the control cells in all other groups (Figure 1B). Cells exposed to H2O2 were kept as positive control. The values are stated in fluorescence (%) in comparison with control. The data denote mean ± SD from three independent tests.
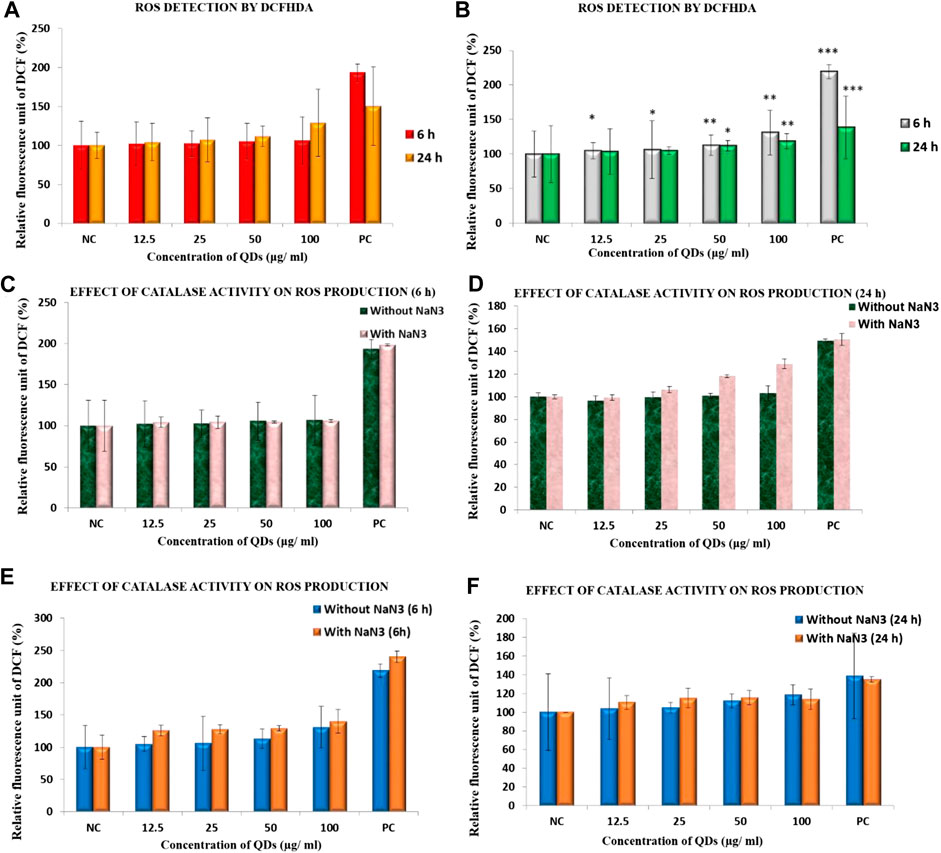
FIGURE 1. ROS production in (A) HepG2 cells (B) HEK cells exposed to ZnSe/ZnS QDs at6 and 24 h using DCFH-DA. Effect of catalase activity on ROS production in HepG2 cells at (C) 6 h (D) 24 h and in HEK cells at (E) 6 h (F) 24 h exposure to ZnSe/ZnS QDs(*p < 0.05, **p < 0.01).
Influence of Catalase Activity on ROS Production
Catalase enzyme is an important enzyme in protecting the cells from oxidative damage by ROS. It is present inside the cells which convert hydrogen peroxides into water and oxygen. The activity of catalase neutralize H2O2 generated in hepatocytes. Figure 1C shows effect of catalase activity on ROS production in HepG2 cells exposed to ZnSe/ZnS QDs at 6 h and Figure 2D shows the effect of 24 h exposure. HepG2 cells exhibited high ROS production compared to control cells only at two concentrations (50 μg/ml and 100 μg/ml for 24 h exposure) (Figure 1D) when pre-treated with catalase inhibitor (NaN3). In all other case, ROS production is almost same in both conditions (with and without NaN3). HEK cells exhibited more or less same level of ROS production compared to control cellswhen pre-treated with catalase inhibitor (NaN3) at 6 (Figure 1E) and 24 h (Figure 1F).
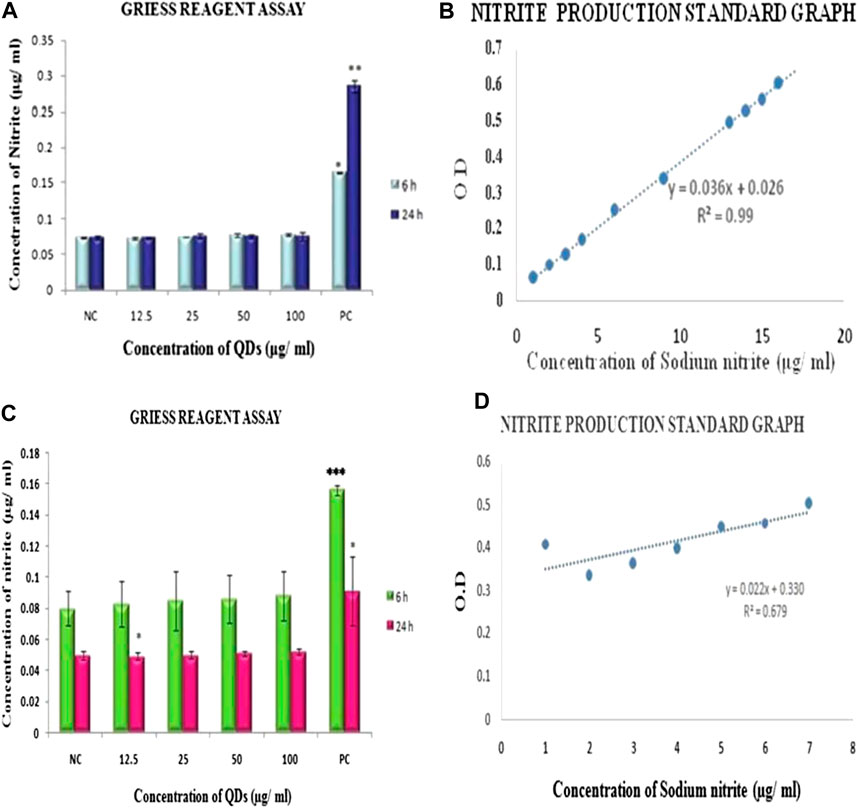
FIGURE 2. Evaluation of RNS generation by Griess reagent assay showing nitrite production in (A). HepG2 cells (C) HEK exposed to ZnSe/ZnS QDs for 6 and 24 h. Samples exposed with LPS served as positive control.Nitrite production standard graph (B) HepG2 (D) HEK. Reading of three independent experiments are represented as mean ± SD. Asterisk indicates statistically significant difference (*p < 0.05, **p < 001).
Assessment of Nitrile Radical Formation by Griess Reagent
RNS production in HepG2 and HEK cells onexposure to ZnSe/ZnS QDs was estimated with the help of Griess reagent assay. Only positive control cells which were treated with LPS showed a statistically significant rise in amount of RNS generated. The comparison was done with the negative control (cells alone). However, ZnSe/ZnS QDs did not induce RNS production in both the cells. The values obtained were almost comparable in case of negative and treated groups (Figures 2B,D represents nitrite production standard graph).
Assessment of Oxidative Stress Induced by QDs
Protein Estimation
Protein in HepG2 cells estimated by Lowry’s method. Control cells containing 0.951 ± 0.001 mg protein. Compared to control cells, ZnSe/ZnS QDs treated HepG2 cells contains 0.896 ± 0.002 (12.5 μg/ml), 0.871 ± 0.01 (25 μg/ml), 0.823 ± 0.02 (50 μg/ml) and 0.710 ± 0.001 (100 μg/ml). Protein concentration in HEK cells upon treatment with QDs of various concentrations was estimated and found to be 0.586 ± 0.015, 0.551 ± 0.008, 0.535 ± 0.006, 0.523 ± 0.011 respectively when compared to control (0.620 ± 0.002) (Figures 3A,B).
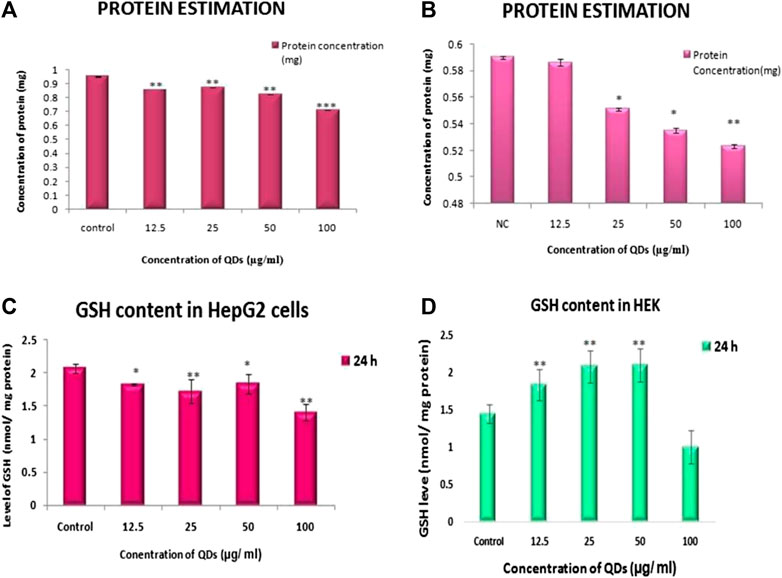
FIGURE 3. Protein level in (A) HepG2 (B) HEK cells and GSH level in (C) HepG2 cells (D) HEK cells after ZnSe/ZnS QDs exposure at 24 h.
Glutathione Levels
GSH level in HepG2 cells significantly increased with increased concentration of QDs when compared to control at 24 h. Figure 3C showed that GSH level in cells with QDs concentrations of 12.5, 25, 50 and 100 µg/ml were 1.826 ± 0.017, 1.722 ± 0.183, 1.844 ± 0.147, 1.403 ± 0.123 respectively. In HEK cells also GSH level was significantly increased as concentration of QDs increased upto 50 μg/ml. Upon 100 μg/ml of QDs concentration, GSH level decreased compared to that of control. The level of GSH was 1.847 ± 0.20, 2.09 ± 0.21, 2.113 ± 0.218, 1.014 ± 0.225 at 12.5, 25, 50, 100 μg/ml correspondingly (Figure 3D).
DNA Ladder Assay
DNA ladder or smear patterns formation was not evident in any of the treated groups of both HepG2 and HEK cells. Both control and treatment samples exhibited a thick band of unfragmented DNA of more than 10,000 bp size with no laddering (Figures 4A,B).
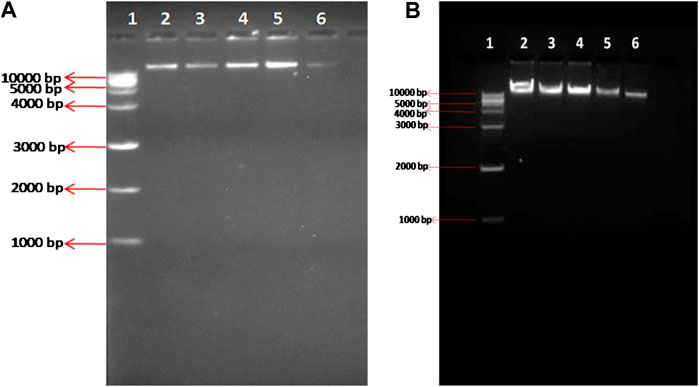
FIGURE 4. DNA ladder assay of (A) HepG2 cells (B) HEK cells- Lane 1: Marker DNA, lane 2: Control, Lane 3: 12.5 μg/ml ZnSe/ZnS QDs, Lane 4: 25 μg/ml ZnSe/ZnS QDs, Lane 5: 50 μg/ml ZnSe/ZnS QDs, Lane 6: 100 μg/ml ZnSe/ZnS QDs. Markings shown in left side of the figure represent corresponding base pairs (bp) of DNA markers.
Live Dead Assay by Calcien AM-PI
Live dead assay of HepG2 cells upon QDs treatment was carried out by flow cytometry study using Calcein AM-PI staining. However, the cells treated with 12.5, 25, 50 and 100 μg/ml of ZnSe/ZnS QDs at 24 h showed 91.21, 88.96, 84.30 and 50.80% viable cells (Figures 5A–D). Figure 5E shows graphical representation of flow cytometric analysis. Results of the HEK cells live dead assay were shown in Figure 6. The results suggest that 0.28, 3.27, 3.90, 13.66% live cells and 9.08, 24.93, 28.57, 41.32% dead cells were found after treatment at various concentrations (12.5, 25, 50 and 100 μg/ml) of ZnSe/ZnS QDs on HEK cells. Figure 6F shows graphical representation of flow cytometric analysis data.
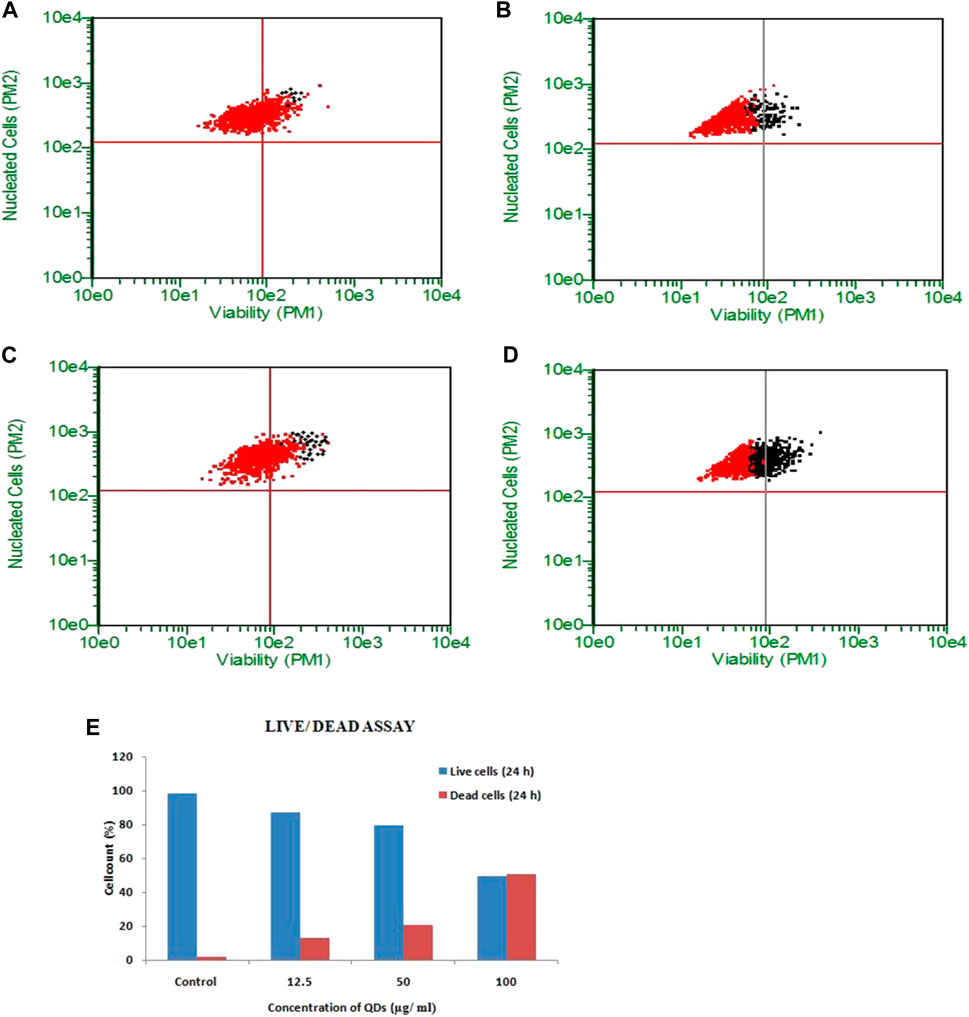
FIGURE 5. ZnSe/ZnS QDs induced death in HepG2 cells: a-c Flow cytometric evaluation of Calcein AM stained cells. Black dots represent cells undergoing apoptosis and red dots represent live cells. (A) untreated cells, (B) 12.5 μg/ml, (C) 50 μg/ml, (D) 100 μg/ml ZnSe/ZnS QDs treated cells after 24 h. (E) Graph showing percentage of viable and dead cells at different concentrations of ZnSe/ZnS QDs (12.5, 50 and 100 μg/ml) after 24 h.
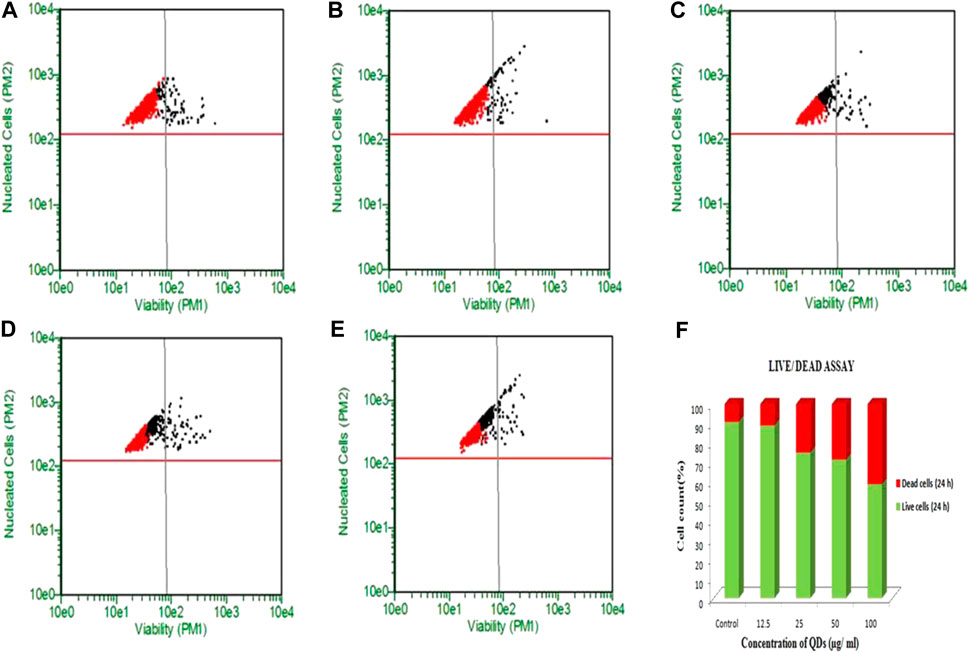
FIGURE 6. ZnSe/ZnS QDs induced death in HEK cells: A-C Flow cytometric analysis of Calcein AM stained cells. Black dots represent apoptotic cells and red dots represent viable cells. (A) untreated cells, (B) 12.5 µg/ml (C) 25 µg/ml (D) 50 μg/ml (E) 100 μg/ml ZnSe/ZnS QDs treated cells. (F) Graph representing percentage of viable and dead cells at different concentrations of ZnSe/ZnS QDs (5, 25, 50 and 100 μg/ml) after 6 h (I) and 24 h (II).
Effects of ZnSe/ZnS QDs on the Antioxidant Capacities of the Liver and Brain
Liver and brain tissues were collected from mice injected (both i.v and i.p) with ZnSe/ZnS QDs. All the assays were carried out in 10% liver and brain homogenate. The lipid peroxidation, GSH, GR, GPx and SODs were analyzed for antioxidant assays.
Lipid Peroxidation
Lipid peroxidation is predicted by the amount of malondialdehyde formed. Statistically significant increase in malondialdehyde (MDA) was found in the liver of ZnSe/ZnS QDs exposed mice. The results are demonstrated in Figure 7A. Similarly MDA production in brain was increased significantly on 3rd and 7th day of treatment and normalized on 14th day. The results are demonstrated in Figure 7B.
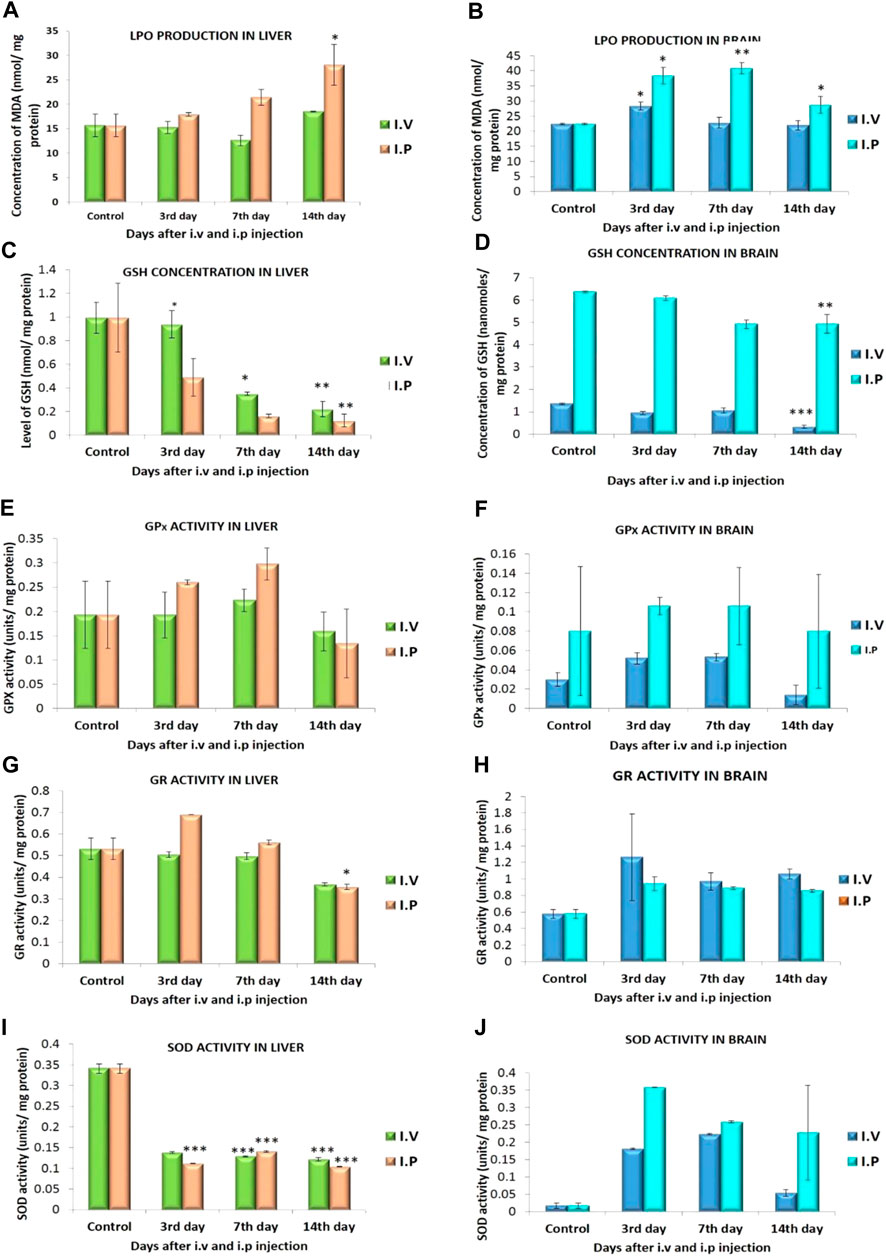
FIGURE 7. LPO production in (A) liver (B) brain; GSH level in (C) liver, (D) brain; GPx activity in (E) liver, (F) brain; GR activity in (G) liver, (H) brain; SOD activity in (I) liver, (J) brain of mice exposed to ZnSe/ZnS QDs. n = 3. The data represent mean ± SD. Asterisk denotes statistically significant difference (*p < 0.05, **p < 0.01).
Reduced Glutathione
The amount of GSH was altered in QD exposed animals when related to control animals. A statistically significant reduction in GSH levels of liver was observed at 3rd, 7th and 14th day of observation period (Figure 7C). In brain the GSH level was found to decrease on 3rd, 7th and 14th day when compared to control in both i.v and i.p treated mice (Figure 7D).
Glutathione Peroxidase
Figure 7E shows a statistically significant increase in GPx activity in liver on 7th day post exposure. This increase in activity was normalized on 14th day of observation period. It was observed that an increase in GPx level in brain was found at the end of 3rd day (i.v:0.052 ± 0.006, i.p: 0.106 ± 0.009) and 7th Day (i.v: 0.014 ± 0.004, i.p: 0.106 ± 0.04). The increased level of GPx was found to be normal at the end of 14 days (i.v: 0.053 ± 0.01, i.p: 0.08 ± 0.059). The increase was not statistically significant (Figure 7F).
Glutathione Reductase
GR activity in the liver (i.v) was lowered when correlated to the QD unexposed animals. A statistically significant increase in GR activity was found in the liver of treated animals on 3rd day and gradually decreased on the 7th and 14th days of observation of i.p treated mice (Figure 7G). A statistically significant rise in the GR activity was observed in the brain of ZnSe/ZnS QDs exposed mice on 3rd (i.v: 1.263 ± 0.522, i.p: 0.941 ± 0.0821), 7th (i.v: 0.971 ± 0.103, i.p: 0.89 ± 0.016) and 14th day (i.v: 1.062 ± 0.061, i.p: 0.857 ± 0.015) of observation (Figure 7H).
Superoxide Dismutase
A statistically significant drop in SOD activity was observed in liver of both i.v and i.p treated animals when compared to control (Figure 7I). An increased SOD activity was observed in the brain of ZnSe/ZnS QDs exposed mice on 3rdday (i.v: 0.181 ± 0.002, i.p: 0.259 ± 0.001) and 7th day (i.v: 0.224 ± 0.002, i.p: 0.228 ± 0.003). SOD level decreasedon 14th day (i.v: 0.053 ± 0.01, i.p: 0.358 ± 0.136) when compared with control mice (0.0172 ± 0.007). The decrease in SOD level was not statistically significant (Figure 7J).
Blood-Brain BarrierIntegrity
Figure 8 displays the change in brain volume of mice injected with ZnSe/ZnS QDs in i.v. and i.p. administration. There was no evidence of brain volume change in i.v or i.p injected animals.
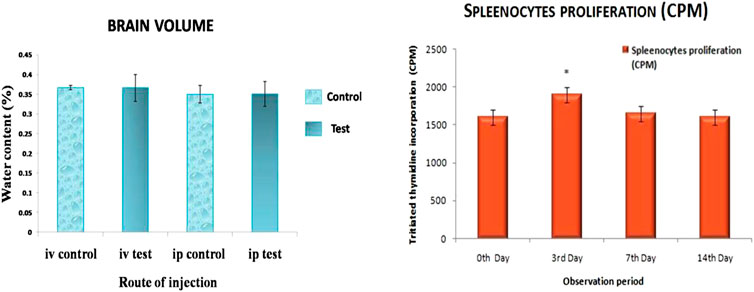
FIGURE 8. Brain volume change and Splenocytes proliferation in mice exposed to ZnSe/ZnS QDs. n = 3. Data represents mean ± SD. Asterisk denotes statistically significant difference (*p < 0.05).
Immunotoxicity by Splenocyte Proliferation Assay
Splenocytes proliferation assay was carried out in spleen isolated from the treated mice using tritiated thymidine. It measures lymphocyte activation and cell-mediated immune responses. The result of the study suggests that splenocytes proliferation rate is increased on 3rd day and decreased on subsequent days and become normal at the end of 14 days (Figure 8).
Discussion
Activation of immune cells like macrophages and neutrophils occurs as a result of cellular internalization of NPs, and oxidative stress persists over longer time periods contributing to ROS/RNS production (Risom et al., 2005; Huang et al., 2010). Macrophages plays responsible role in providing innate and adaptive immunity. M1 macrophages metabolize arginine to produce a “killer” molecule, nitric oxide (NO). This requires the activation of NADPH oxidase enzymes. Reactive oxygen species (ROS) such as superoxide, hydroxyl radical, hydrogen peroxide and reactive nitrogen species (RNS) like nitric oxide and peroxynitrite can result in cell death (Soenen et al., 2014). In vivo silica exposures activate inflammatory phagocytes in the lung resulting in oxidative outbreak (Coccini et al., 2013). The ability of ZnSe/ZnS QDs to induce ROS and RNS in HepG2 cells was investigated since oxidative stress is a prominent cause of nanomaterial toxicity. They can react with macromolecules such as lipids, proteins, DNA, etc., which affects the structure and function of macromolecules, and then causes oxidative cellular damage (Cho et al., 2007; Juzenas et al., 2008; Lu et al., 2019). The result of the current study showed an increase in ROS production as evident from DCFHDA assay only at 24 h exposure of QDs. A clear generation of reactive oxygen species (ROS) is established by the Soenen et al., 2014 and reaching significant levels at 30 nM for ZnSe QDs. The higher level of oxidative stress for the ZnSe QDs suggests the critical role of ROS in QD cytotoxicity. ZnSe/ZnS QDs were incubated with HEK for 6 h and 24 h. As observed in HepG2 cells, QDs were unable to evoke ROS generation at 24 h. This effect may be either because of aggregation of QDs or because of ROS scavenging property of glutathione. The quantitative estimation of ROS can be identified by the presence of elevated amount of thiol or sulfhydryl radicals formed by glutathione along with other agents that can cause of ROS scavenging (Cossarizza et al., 2009). However, 6 h exposure to a high concentration of ZnSe/ZnS QDs led to an increased ROS generation in HEK.
Catalase plays a central role in ROS detoxification and known as scavengers of ROS. It is an antioxidant enzyme that converts hydrogen peroxide into water and oxygen. Cytosolic-enzyme catalase (CAT) protects the cells from the destructive effects of reactive oxygen species (ROS). Catalase activity is very high in liver cells (Sani et al., 2006). Catalase inhibitor sodium azide (0.2 μM) was used to study the influence of catalase on the production of ROS in both HepG2 and HEK cells. Sodium azide treated samples showed high ROS production in both the cells. It was noted that catalase activity in the cells could resist the ROS production induced by ZnSe/ZnS QDs in a time and dose-dependent manner.
Nitric oxide (NO) is a gaseous free radical that has been recognized as an essential signaling molecule in virtually every tissue in the body. As in the case of other organs, NO has many actions and cellular sources in both the liver (Clemens, 1999) and kidney (Mount and Power, 2006). Under inflammatory and stress conditions, hepatocytes are able to convey repeated inducible NO synthase (iNOS) expression. This iNOS expression controls cell viability as well as cellular functions. Hepatocytes contain mainly two pools of iNOS: a soluble pool composed of both active dimer/monomer and a peroxisomal pool of monomeric iNOS. In cells such as hepatocytes, iNOS is localized in peroxisomes as a defensive means to eliminate incompetent enzymes. Nitric oxide (NO) has significant signaling role in cells but can also cause cell dysfunction or toxicity (Loughran et al., 2005). In the present study, cellular levels of NO produced in HepG2 cells triggered by ZnSe/ZnS QDs or lipopolysaccharide (LPS) (i.e., a pro-inflammatory marker) was examined. It was found that a significantly higher amount of NO was generated when cells were exposed to LPS. However, the treatment of ZnSe/ZnS QDs at the concentrations up to 100 μg/ml did not cause any difference in NO production. Endothelium-derived NO is produced in the kidney and it does decisive role in the regulation of renal hemodynamics and excretory function (Bachmann and Mundel, 1994). In the present study, a negligible increase in NOS generation was seen in HEK cells when compared to control.
Proteins are vital biochemical constituents that is present in all biological systems. It is essential for the synthesis of various enzymes crucial for maintaining stable metabolic pathways. No significant changes were observed in protein concentrations of the ZnSe/ZnS QDs treated HepG2 cells except 100 μg/ml when compared with control. Protein estimation in HEK cells treated with ZnSe/ZnS QDs confirmed that a substantial decline of protein concentration was observed in a dose-dependent manner. Protein synthesis is one of the fundamental functions of cells that control all the metabolic activities that take place inside the cells. Variation in protein synthesis is not ideally related to a single biochemical system. Changes can also occur due to interactions of QDs with subcellular organelles such as the nucleus, ribosomes, endoplasmic reticulum, cytoplasm and cytoskeleton.
GSH is an abundant non-enzymatic antioxidant tripeptide and is sensitive to NP treatment (Akhtar et al., 2012). The liver is the organ that contains the highest levels of GSH because it involves in GSH synthesis and metabolism. GSH helps in metabolism of fat, sugar and protein, and keep natural cell metabolism and cell membrane integrity. It can bind toxic substances, such as electrophilic radicals and oxygen free radicals, and has broad antioxidative effects (Chen et al., 2008). Under physiological conditions, oxidative stress in the liver can resist through GSH synthesis in hepatocytes. GSH can avoid oxidative stress by serving as a substrate for antioxidative enzymes including GSH-Px which converts hydroperoxide into less damaging fatty acids, GSH disulfide and water (Day, 2009). Therefore, GSH can resist ZnSe/ZnS QDs induced oxidative stress. Glutathione plays a significant role at cellular level. In mitochondria, it is involved in regulating apoptosis vs. necrosis. GSH is used as a indicator of oxidative stress as it is one of the major scavengers of ROS. Results obtained for the particular study points out that, GSH level declined at higher concentrations of NPs. This finding could be a sign of oxidative stress as the primary toxicity mechanism. It is known that GSH is an essential component for the protection of thiolgroups which guards mitochondria against permeability transition or opening of MPT pores and oxidative stress. The inverse linear relationship between the ROS level and the GSH level indicated that free radical species were generated by exposure to the ZnSe/ZnS QDs with decreased mitochondrial and cellular antioxidant levels.
DNA ladder assay is very useful for quick screening of apoptotic changes in cell populations. The DNA laddering technique is used to visualize the endonuclease cleavage products of apoptosis. One of the most peculiar features exhibited by cells go through apoptosis is the fragmentation of DNA into oligonucleosomal fragments. It can be observed as DNA laddering when genomic DNA is subjected to agarose gel electrophoresis (Barry et al., 2000). DNA ladder assay makes the apparent hallmark of apoptosis–mono and oligonucleosomal DNA fragments (Saadat et al., 2015). In the present work, the ladder pattern of DNA cleavage was not exhibited in any of the treated DNA samples. This may be due to the size that prevents them from entering the nucleus or because of the surface charge carried by QDs. The negative charge of the QDs repelled with negatively charged DNA. Negatively charged NPs have no effect on the cell cycle (Liu et al., 2015). An intact plasma membrane and ubiquitous intracellular esterase activity are distinguishing characteristics of live cells. Calcein AM is capable of penetrating live cell membranes, making an strong uniform green fluorescence in viable cells. PI is only capable of entering damaged membranes and gives red fluorescence upon binding to nucleic acids, thereby producing a bright red fluorescence in dead cells. Flow cytometric data showed a dose and time-dependent effect on cell viability.
Induction of oxidative stress is one of the main mechanisms involved in QD toxicity. Oxidative stress status of the liver and brain of mice treated with QDs was analyzed by stress markers like LPO, GSH, GR, GPx and GR activity. In living organisms, lipid peroxidation is one of the vital reasons of cellular injury causing the formation of lipid peroxides and this pheneomenon is used as an evidence of oxidative stress. These unstable lipid peroxides decomposes to form a complex series of compounds including reactive carbonyl compounds. MDA is one of the by-products of LPO. Quantitative assessment of MDA has been used as an indicator of lipid peroxidation. The present study demonstrated a significant dose-dependent hike in MDA level in the liver. This indicates the lowest values of the free radical clearance rate of the liver. Also, the time-course study showed that the levels of MDA reached their highest values at 7 days (i.p.) in the case of brain tissue. These results are in accordance with the report by Wang et al. (2006) that ⋅OH generation reached a peak value on the 7th day (Wang et al., 2006). GSH plays an important role in the endogenous antioxidant system. A high concentration of GSH is found in the liver and brain; hence it is known to have a crucial function in the protection process. ZnSe/ZnS QDs decreased the hepatic and brain GSH contents. It implies that the reduction in ZnSe/ZnS QD-induced antioxidant capacity of the liver and brain are associated with GSH depletion. It was believed that the activity of GR might be the major determinant that regulates GSH/GSSG (Hazelton and Lang, 1985). Glutathione peroxidase and SOD are the major antioxidative enzymes that can protect polyunsaturated fatty acid (PUFA) from lipid peroxidation by reducing H2O2 and superoxide radical (Wang et al., 2017). Dismutation of ROS is by SOD is of prime importance in cells since superoxide is the primary ROS formed. SOD quenches the free radical superoxide by converting it to peroxide, which can then be inactivated by reactions catalyzed by GPx. It is the most critical H2O2 scavenging enzyme, closely associated with the maintenance of reduced glutathione (Brunetti et al., 2013).
Diverse engineered nanoparticles have many positive aspects over conventional contrast agents like the ability to overcome the blood-brain barrier (BBB) for drug delivery. Fundamental, as well as clinical research, explored QD applications in the brain (Thorne and Nicholson, 2006; Minami et al., 2012; Marshall and Schnitzer, 2013; Xu and Mahajan, 2013; Zhang, 2013; Walters et al., 2015; Dawson, 2016; Dante et al., 2017). Reports promote scope of functionalized QDs as drug-delivery vehicles or targeted-imaging biomarkers for central nervous system (CNS) diseases. Effect of ZnSe/ZnS QDs in mice brain is studied on the basis of their volume change. The volume of brain changes in response to injuries, inflammation and disruption of BBB. However, in the present study, there were no ZnSe/ZnS QDs mediated volume changes in treated mice demonstrating that ZnSe/ZnS QDs exposure at the given concentration does not cause mechanical damage and oedema. Ou et al. reported that positively charged nanoparticles alter the BBB integrity and permeability when compared to negatively charged or neutral nanoparticles (2018) (Ou et al., 2018). ZnSe/ZnS QDs and external membrane of the endothelial cell have negative charge repel with each other.
Immunotoxicity of ZnSe/ZnS QDs was studied by splenocyte proliferation assay. Splenocytes are one kind of white blood cells positioned in the spleen or purified from splenic tissue (Mebius and Kraal, 2005). Splenocytes compromises of cells such as T and B lymphocytes, macrophages and dendritic cells, which have different immune functions. The function of T and B cells is to recognize non self-antigen. T cells undergo proliferation as a result of activation by antigen-presentingcells and cytokines. Proliferations of both the cells result in clonal expansion and initiate specific immune response (Bao-An et al., 2010). In proliferating cells, rate of DNA and protein synthesis trend to increase. Radioisotope labeled nucleotides liketritiated thymidine ([3H] thymidine) can be used to estimate the increase in DNA synthesis. The rate of proliferation is considered propotional to total tritium taken up by the dividing cells (Ghoneum, 1998). This technique is used widely for evaluating the immuno-toxicological response of nanoparticles by [3H] thymidine incorporation (Seur and Doucras, 1997; Guity et al., 2001; Li et al., 2012). The systemic immuneresponse induced upon exposure to ZnSe/ZnS QDs was analyzedon the basis of the proliferation rate of splenocytes. In the current study slight change in splenocytes proliferationwas observed only on 3rd day, whereas no changes were seen on subsequent days. These results suggest that single exposure of ZnSe/ZnS QDs at a concentration (10 mg/kg) induce inflammatory responses in mice only on 3rd day and eliminate by means of phagocytosis, without such effects in subsequent days.
Conclusion
In summary, Oxidative stress exerted by the ZnSe/ZnS QDs in both HepG2 and HEK cells studied, and the results clearly demonstrate that 100 μg/ml concentration caused ROS production. Catalase has an active part in the regulation of ROS production in both the cell lines. Significant amount of RNS production is not found in any of the treatment groups. GSH content also analyzed for the oxidative stress analysis. QDs do not cause DNA fragmentation. The degree of cell death was found to be raised with an increase in the concentration of QDs and a significant concentration resulted in cellular death in both cell lines. The results of our study demonstrate that ZnSe/ZnS QDs induce oxidative stress and cell death in HepG2 and HEK cells, and this effect is likely mediated through ROS generation. ZnSe/ZnS QDs do not cause nuclear damage. ZnSe/ZnS QDs caused fluctuations of oxidative stress markers in mice but not severe. Immunotoxicity evaluation showed slight alteration and the same was recovered to the normal range. Declaration about safety of ZnSe/ZnS QDs in clinical application scenarios requires long term toxicity studies.
Data Availability Statement
The original contributions presented in the study are included in the article/Supplementary Material, further inquiries can be directed to the corresponding author.
Ethics Statement
The animal study was reviewed and approved by the Institutional Animal Ethics Committee (SCT/IAEC-261/February/2018/95), Sree Chitra Tirunal Institute for Medical Sciences and Technology.
Author Contributions
PM: Design, literature survey, drafting, discussion, submission VR: analysis, data collection, literature survey, drafting, discussion.
Conflict of Interest
The authors declare that the research was conducted in the absence of any commercial or financial relationships that could be construed as a potential conflict of interest.
Acknowledgments
The authors wish to express their thanks to the Director and Head, Biomedical Technology Wing, SreeChitraTirunal Institute for Medical Sciences and Technology, Trivandrum, Kerala, India for their support and for providing the infrastructure to carry out this work. VR thanks DST –INSPIRE, New Delhi for JRF and SRF Fellowship.
References
Akhtar, M. J., Ahamed, M., Kumar, S., Khan, M. M., Ahmad, J., and Alrokayan, S. A. (2012). Zinc oxide nanoparticles selectively induce apoptosis in human cancer cells through reactive oxygen species. Int. J. Nanomed. 7, 845. doi:10.2147/IJN.S29129
Bachmann, S., and Mundel, P. (1994). Nitric oxide in the kidney: synthesis, localization, and function. Am. J. Kidney Dis. 24 (1), 112–129. doi:10.1016/s0272-6386(12)80170-3 |
Bagalkot, V., Zhang, L., Levy-Nissenbaum, E., Jon, S., Kantoff, P. W., Langer, R., et al. (2007). Quantum dot-aptamer conjugates for synchronous cancer imaging, therapy, and sensing of drug delivery based on bi-fluorescence resonance energy transfer. Nano Lett. 7, 3065–3070. doi:10.1021/nl071546n |
Bao-An, C., Nan, J., Jun, W., Jiahua, D., Chong, G., Jian, C., et al. (2010). The effect of magnetic nanoparticles of Fe3O4 on immunefunction in normal ICR mice. Int. J. Nanomed. 5, 593–599. doi:10.2147/ijn.s12162
Barry, M., Heibein, J., Pinkoski, M., and Bleackley, R. C. (2000). Quantitative measurement of apoptosis induced by cytotoxic T lymphocytes. Methods Enzymol. 322, 40–46. doi:10.1016/s0076-6879(00)22006-5 |
Birben, E., Sahiner, U. M., Sackesen, C., Erzurum, S., and Kalayci, O. (2012). Oxidative stress and antioxidant defense. World Allergy Organ J. 5 (1), 9–19. doi:10.1097/WOX.0b013e3182439613 |
Brunetti, V., Chibli, H., Fiammengo, R., Galeone, A., Malvindi, M. A., Vecchio, G., et al. (2013). InP/ZnS as a safer alternative to CdSe/ZnS core/shell quantum dots: in vitro and in vivo toxicity assessment. Nanoscale 5 (1), 307–317. doi:10.1039/c2nr33024e |
Chen, Z., Li, G., Zhang, L., Jiang, J., Li, Z., Peng, Z., et al. (2008). A new method for the detection of ATP using a quantum-dot-tagged aptamer. Anal. Bioanal. Chem. 392 (6), 1185–1188. doi:10.1007/s00216-008-2342-z |
Cho, S. J., Maysinger, D., Jain, M., Roder, B., Hackbarth, S., and Winnik, F. M. (2007). Long-term exposure to CdTe quantum dots causes functional impairments in live cells. Langmuir 23, 1974–1980. doi:10.1021/la060093j |
Clemens, M. G. (1999). Nitric oxide in liver injury. Hepatology 30 (1), 1–5. doi:10.1002/hep.510300148 |
Coccini, T., Barni, S., Vaccarone, R., Mustarelli, P., Manzo, L., and Roda, E. (2013). Pulmonary toxicity of instilled cadmium-doped silica nanoparticles during acute and subacute stages in rats. Histol. Histopathol. 28 (2), 195–209. doi:10.14670/HH-28.195 |
Cossarizza, A., Ferraresi, R., Troiano, L., Roat, E., Gibellini, L., Bertoncelli, L., et al. (2009). Simultaneous analysis of reactive oxygen species and reduced glutathione content in living cells by polychromatic flow cytometry. Nat. Protoc. 4 (12), 1790. doi:10.1038/nprot.2009.189 |
Dante, S., Petrelli, A., Petrini, E. M., Marotta, R., Maccione, A., Alabastri, A., et al. (2017). Selective targeting of neurons with inorganic nanoparticles: revealing the crucial role of nanoparticle surface charge. ACS Nano 11 (7), 6630–6640. doi:10.1021/acsnano.7b00397 |
Dawson, G. (2016). Quantum dots and potential therapy for Krabbe's disease. J. Neurosci. Res. 94 (11), 1293–1303. doi:10.1002/jnr.23805 |
Day, B. J. (2009). Catalase and glutathione peroxidase mimics. Biochem. Pharmacol. 77 (3), 285–296. doi:10.1016/j.bcp.2008.09.029 |
Diagaradjane, P., Orenstein-Cardona, J. M., Colón-Casasnovas, N. E., Deorukhkar, A., Shentu, S., Kuno, N., et al. (2008). Imaging epidermal growth factor receptor expression in vivo: pharmacokinetic and biodistribution characterization of a bioconjugated quantum dot nanoprobe. Clin. Canc. Res. 14, 731–741. doi:10.1158/1078-0432.CCR-07-1958
Ghoneum, M. (1998). Anti-HIV activity in vitro of MGN-3, an activated arabinoxylane from rice bran. Biochem. Biophys. Res. Commun. 243, 25–29. doi:10.1006/bbrc.1997.8047 |
Guity, G., Dominick, J., Bradley, S. B., Debora, J. B., Maureen, M. G., and John, W. S. (2001). Human lymphocyte proliferation responsesfollowing primary immunization with rabies vaccine as neoantigen. Clin. Diagn. Lab. Immunol. 8, 880–883. doi:10.1128/CDLI.8.5.880-883.2001 |
Hazelton, G. A., and Lang, C. A. (1985). Glutathione peroxidase and reductase activities in the aging mouse. Mech. Ageing Dev. 29 (1), 71–81. doi:10.1016/0047-6374(85)90048-x |
Hu, M., Yan, J., He, Y., Lu, H., Weng, L., Song, S., et al. (2010). Ultrasensitive, multiplexed detection of cancer biomarkers directly in serum by using a quantum dot-based microfluidic protein chip. ACS Nano 4, 488–494. doi:10.1021/nn901404h |
Huang, C. C., Aronstam, R. S., Chen, D. R., and Huang, Y. W. (2010). Oxidative stress, calcium homeostasis, and altered gene expression in human lung epithelial cells exposed to ZnO nanoparticles. Toxicol. Vitro 24 (1), 45–55. doi:10.1016/j.tiv.2009.09.007
Juzenas, P., Generalov, R., Juzeniene, A., and Moan, J. (2008). Generation of nitrogen oxide and oxygen radicals by quantum dots. J. Biomed. Nanotechnol. 4, 450–456. doi:10.1166/jbn.2008.008
Katsumiti, A., Gilliland, D., Arostegui, I., and Cajaraville, M. P. (2014). Cytotoxicity and cellular mechanisms involved in the toxicity of CdS quantum dots in hemocytes and gill cells of the mussel Mytilus galloprovincialis. Aquat. Toxicol. 153, 39–52. doi:10.1016/j.aquatox.2014.02.003 |
Kirchner, C., Javier, A. M., Susha, A. S., Rogach, A. L., Kreft, O., Sukhorukov, G. B., et al. (2005a). Cytotoxicity of nanoparticle-loaded polymer capsules. Talanta 67 (3), 486–491. doi:10.1016/j.talanta.2005.06.042
Kirchner, C., Liedl, T., Kudera, S., Pellegrino, T., Muñoz Javier, A., Gaub, H. E., et al. (2005b). Cytotoxicity of colloidal CdSe and CdSe/ZnS nanoparticles. Nano Lett. 5 (2), 331–338. doi:10.1021/nl047996m |
Lee, H. M., Shin, D. M., Song, H. M., Yuk, J. M., Lee, Z. W., Lee, S. H., et al. (2009). Nanoparticles up-regulate tumor necrosis factor-alpha and CXCL8 via reactive oxygen species and mitogen-activated protein kinase activation. Toxicol. Appl. Pharmacol. 238, 160. doi:10.1016/j.taap.2009.05.010 |
Li, K. G., Chen, J. T., Bai, S. S., Wen, X., Song, S. Y., Yu, Q., et al. (2009). Intracellular oxidative stress and cadmium ions release induce cytotoxicity of unmodified cadmium sulfide quantum dots. Toxicol. Vitro 23, 1007–1013. doi:10.1016/j.tiv.2009.06.020 |
Li, T., Jamil, A., Mincheol, K., Marwan, M., Rong, T., Qian, Y., et al. (2012). Immunosuppressive activity of size-controlled PEG-PLGA nanoparticles containing encapsulated cyclosporine. Am. J. Transplant. 2012, 1–9. doi:10.1155/2012/896141
Liu, L., Tao, R., Huang, J., He, X., Qu, L., Jin, Y., et al. (2015). Hepatic oxidative stress and inflammatory responses with cadmium exposure in male mice. Environ. Toxicol. Pharmacol. 39 (1), 229–236. doi:10.1016/j.etap.2014.11.029 |
Loughran, P. A., Stolz, D. B., Vodovotz, Y., Watkins, S. C., Simmons, R. L., and Billiar, T. R. (2005). Monomeric inducible nitric oxide synthase localizes to peroxisomes in hepatocytes. Proc. Natl. Acad. Sci. U.S.A. 102 (39), 13837–13842. doi:10.1073/pnas.0503926102 |
Lovrić, J., Cho, S. J., Winnik, F. M., and Maysinger, D. (2005). Unmodified cadmium telluride quantum dots induce reactive oxygen species formation leading to multiple organelle damage and cell death. Chem. Biol. 12, 1227. doi:10.1016/j.chembiol.2005.09.008 |
Lowry, O. H., Rosebrough, N. J., Farr, A. L., and Randall, R. J. (1951). Protein measurement with the Folin phenol reagent. J. Biol. Chem. 193, 265–275. doi:10.1016/s0021-9258(19)52451-6 |
Lu, J., Tang, M., and Zhang, T. (2019). Review of toxicological effect of quantum dots on the liver. J. Appl. Toxicol. 39 (1), 72–86. doi:10.1002/jat.3660 |
Marklund, S., and Marklund, G. (1974). Involvement of the superoxide anion radical in the autoxidation of pyrogallol and a convenient assay for superoxide dismutase. Eur. J. Biochem. 47, 469–474. doi:10.1111/j.1432-1033.1974.tb03714.x |
Marshall, J. D., and Schnitzer, M. J. (2013). Optical strategies for sensing neuronal voltage using quantum dots and other semiconductor nanocrystals. ACS Nano 7 (5), 4601–4609. doi:10.1021/nn401410k |
Mebius, R. E., and Kraal, G. (2005). Structure and function of the spleen. Nat. Rev. Immunol. 5, 606–616. doi:10.1038/nri1669 |
Medintz, I. L., Uyeda, H. T., Goldman, E. R., and Mattoussi, H. (2005). Quantum dot bioconjugates for imaging, labelling and sensing. Nat. Mater. 4 (6), 435–446. doi:10.1038/nmat1390 |
Michalet, X., Pinaud, F. F., Bentolila, L. A., Tsay, J. M., Doose, S., Li, J. J., et al. (2005). Quantum dots for live cells, in vivo imaging, and diagnostics. Science 307, 538–544. doi:10.1126/science.1104274 |
Milliron, D. J., Hughes, S. M., Cui, Y., Manna, L., Li, J., Wang, L. W., et al. (2004). Colloidal nanocrystal heterostructures with linear and branched topology. Nature 430, 190–195. doi:10.1038/nature02695 |
Minami, S. S., Sun, B., Popat, K., Kauppinen, T., Pleiss, M., Zhou, Y., et al. (2012). Selective targeting of microglia by quantum dots. J. Neuroinflammation 9, 22. doi:10.1186/1742-2094-9-22 |
Mize, C. E., and Langdon, R. G. (1962). Hepatic glutathione reductase. I. Purification and general kinetic properties. J. Biol. Chem. 237, 1589–1595. doi:10.1016/s0021-9258(19)83745-6 |
Mocatta, D., Cohen, G., Schattner, J., Millo, O., Rabani, E., and Banin, U. (2011). Heavily doped semiconductor nanocrystal quantum dots. Science 332, 77–81. doi:10.1126/science.1196321 |
Moron, M. S., Depierre, J. W., and Mannervik, B. (1979). Levels of glutathione, glutathione reductase and glutathione S-transferase activities in rat lung and liver. Biochim. Biophys. Acta 582, 67–78. doi:10.1016/0304-4165(79)90289-7 |
Mount, P. F., and Power, D. A. (2006). Nitric oxide in the kidney: functions and regulation of synthesis. Acta Physiol. 187 (4), 433–446. doi:10.1111/j.1748-1716.2006.01582.x |
Muthu, M. S., Kulkarni, S. A., Raju, A., and Feng, S. S. (2012). Theranostic liposomes of TPGS coating for targeted co-delivery of docetaxel and quantum dots. Biomaterials 33, 3494–3501. doi:10.1016/j.biomaterials.2012.01.036 |
Ohkawa, H., Ohishi, N., and Yagi, K. (1979). Assay for lipid peroxides in animal tissues by thiobarbituric acid reaction. Anal. Biochem. 95, 351–358. doi:10.1016/0003-2697(79)90738-3 |
Ou, H., Cheng, T., Zhang, Y., Liu, J., Ding, Y., Zhen, J., et al. (2018). Surface-adaptive zwitterionic nanoparticles for prolonged blood circulation time and enhanced cellular uptake in tumor cells. Acta Biomater. 65, 339–348. doi:10.1016/j.actbio.2017.10.034 |
Pal, B. N., Ghosh, Y., Brovelli, S., Laocharoensuk, R., Klimov, V. I., Hollingsworth, J. A., et al. (2012). “Giant” CdSe/CdS core/shell nanocrystal quantum dots as efficient electroluminescent materials: strong influence of shell thickness on light-emitting diode performance. Nano Lett. 12, 331–336. doi:10.1021/nl203620f |
Risom, L., Moller, P., and Loft, S. (2005). Oxidative stress-induced DNA damage by particulate air pollution. Mutat. Res. 592, 119–137. doi:10.1016/j.mrfmmm.2005.06.012 |
Rotruck, J. T., Pope, A. L., Ganther, H. E., Swanson, A. B., Hafeman, D. G., and Hoekstra, W. G. (1973). Selenium: biochemical role as a component of glutathione peroxidase. Science 179, 588–590. doi:10.1126/science.179.4073.588 |
Saadat, Y. R., Saeidi, N., Vahed, S. Z., Barzegari, A., and Barar, J. (2015). An update to DNA ladder assay for apoptosis detection. BI 5 (1), 25. doi:10.15171/bi.2015.01 |
Sani, M., Sebaï, H., Gadacha, W., Boughattas, N. A., Reinberg, A., and Mossadok, B. A. (2006). Catalase activity and rhythmic patterns in mouse brain, kidney and liver. Comp. Biochem. Physiol. B Biochem. Mol. Biol. 145 (3-4), 331–337. doi:10.1016/j.cbpb.2006.08.005 |
Seur, J. S., and Doucras, M. (1997). TritiatedThymidine incorporation and cell-mediated lympholysis as correlates of acute graft-versus-host reaction. Exp. Hematol. 5, 443–455.
Soenen, S. J., Manshian, B. B., Aubert, T., Himmelreich, U., Demeester, J., De Smedt, S. C., et al. (2014). Cytotoxicity of cadmium-free quantum dots and their use in cell bioimaging. Chem. Res. Toxicol. 27 (6), 1050–1059. doi:10.1021/tx5000975 |
Su, Y., Hu, M., Fan, C., He, Y., Li, Q., Li, W., et al. (2010). The cytotoxicity of CdTe quantum dots and the relative contributions from released cadmium ions and nanoparticle properties. Biomaterials 31 (18), 4829–4834. doi:10.1016/j.biomaterials.2010.02.074 |
Tang, S., Cai, Q., Chibli, H., Allagadda, V., Nadeau, J. L., and Mayer, G. D. (2013). Cadmium sulfate and CdTe-quantum dots alter DNA repair in zebrafish (Danio rerio) liver cells. Toxicol. Appl. Pharmacol. 272 (2), 443–452. doi:10.1016/j.taap.2013.06.004 |
Thorne, R. G., and Nicholson, C. (2006). In vivo diffusion analysis with quantum dots and dextrans predicts the width of brain extracellular space. Proc. Natl. Acad. Sci. U.S.A. 103 (14), 5567–5572. doi:10.1073/pnas.0509425103 |
Walker, K. A., Morgan, C., Doak, S. H., and Dunstan, P. R. (2012). Quantum dots for multiplexed detection and characterisation of prostate cancer cells using a scanning near-field optical microscope. PloS One 7, e31592. doi:10.1371/journal.pone.0031592 |
Walters, R., Medintz, I. L., Delehanty, J. B., Stewart, M. H., Susumu, K., Huston, A. L., et al. (2015). The role of negative charge in the delivery of quantum dots to neurons. ASN Neuro 7 (4), 1759091415592389. doi:10.1177/175909141559238910.1177/1759091415592389 |
Wang, J., Chen, C., Li, B., Yu, H., Zhao, Y., Sun, J., et al. (2006). Antioxidative function and biodistribution of [Gd@C82(OH)22]n nanoparticles in tumor-bearing mice. Biochem. Pharmacol. 71 (6), 872–881. doi:10.1016/j.bcp.2005.12.001 |
Wang, J., Sun, H., Meng, P., Wang, M., Tian, M., Xiong, Y., et al. (2017). Dose and time effect of CdTe quantum dots on antioxidant capacities of the liver and kidneys in mice. Int. J. Nanomed. 12, 6425. doi:10.2147/IJN.S142008 |
Xing, Y., and Rao, J. (2008). Quantum dot bioconjugates for in vitro diagnostics and in vivo imaging. Canc. Biomarkers 4 (6), 307–319. doi:10.3233/cbm-2008-4603
Xu, G., and Mahajan, S. I. (2013). Theranostic quantum dots for crossing blood-brain barrier in vitro and providing therapy of HIV-associated encephalopathy. Front. Pharmacol. 4, 140. doi:10.3389/fphar.2013.00140 |
Yang, L., Wang, F., Han, H., Yang, L., Zhang, G., and Fan, Z. (2015). Functionalized graphene oxide as a drug carrier for loading pirfenidone in treatment of subarachnoid hemorrhage. Colloids Surf. B Biointerfaces 129, 21–29. doi:10.1016/j.colsurfb.2015.03.022 |
Zhang, Q. (2013). Imaging single synaptic vesicles in mammalian central synapses with quantum dots. Methods Mol. Biol. 1026, 57–69. doi:10.1007/978-1-62703-468-5_5 |
Keywords: oxidative stress, ROS production, genotoxicity, immunological responses, cadmium free QDs
Citation: Reshma VG and Mohanan PV (2021) Assessment of Immunotoxicity and Oxidative Stress Induced by Zinc Selenium/Zinc Sulphide Quantum Dots. Front. Nanotechnol. 2:597382. doi: 10.3389/fnano.2020.597382
Received: 21 August 2020; Accepted: 30 December 2020;
Published: 19 February 2021.
Edited by:
Pratima R. Solanki, Jawaharlal Nehru University, IndiaReviewed by:
Chetna Dhand, Advanced Materials and Processes Research Institute (CSIR), IndiaVinoth Kumar Lakshmanan, Sri Ramachandra Institute of Higher Education and Research, India
Copyright © 2021 Reshma and Mohanan. This is an open-access article distributed under the terms of the Creative Commons Attribution License (CC BY). The use, distribution or reproduction in other forums is permitted, provided the original author(s) and the copyright owner(s) are credited and that the original publication in this journal is cited, in accordance with accepted academic practice. No use, distribution or reproduction is permitted which does not comply with these terms.
*Correspondence: P. V. Mohanan, bW9oYW5wdjEwQGdtYWlsLmNvbQ==
 V. G. Reshma
 P. V. Mohanan