
94% of researchers rate our articles as excellent or good
Learn more about the work of our research integrity team to safeguard the quality of each article we publish.
Find out more
ORIGINAL RESEARCH article
Front. Mol. Neurosci., 04 September 2024
Sec. Molecular Signalling and Pathways
Volume 17 - 2024 | https://doi.org/10.3389/fnmol.2024.1431549
This article is part of the Research TopicPhysiopathology of alpha-synuclein: a bench-to-bedside overviewView all 4 articles
 Ofir Sade1
 Daphna Fischel1,2
 Noa Barak-Broner1Shir Halevi1,2Irit Gottfried1Dana Bar-On1,2
 Stefan Sachs3
 Anat Mirelman2,4,5
 Avner Thaler4,5
 Aviv Gour5,6
 Meir Kestenbaum5,6Mali Gana Weisz4
 Saar Anis5,7
 Claudio Soto8
 Melanie Shanie Roitman7Shimon Shahar9
 Kathrin Doppler10
 Markus Sauer3
 Nir Giladi2,4,5
 Nirit Lev2,5,6Roy N. Alcalay4,5
 Sharon Hassin-Baer5,7
 Uri Ashery1,2*
Alpha-synuclein (aSyn) aggregates in the central nervous system are the main pathological hallmark of Parkinson’s disease (PD). ASyn aggregates have also been detected in many peripheral tissues, including the skin, thus providing a novel and accessible target tissue for the detection of PD pathology. Still, a well-established validated quantitative biomarker for early diagnosis of PD that also allows for tracking of disease progression remains lacking. The main goal of this research was to characterize aSyn aggregates in skin biopsies as a comparative and quantitative measure for PD pathology. Using direct stochastic optical reconstruction microscopy (dSTORM) and computational tools, we imaged total and phosphorylated-aSyn at the single molecule level in sweat glands and nerve bundles of skin biopsies from healthy controls (HCs) and PD patients. We developed a user-friendly analysis platform that offers a comprehensive toolkit for researchers that combines analysis algorithms and applies a series of cluster analysis algorithms (i.e., DBSCAN and FOCAL) onto dSTORM images. Using this platform, we found a significant decrease in the ratio of the numbers of neuronal marker molecules to phosphorylated-aSyn molecules, suggesting the existence of damaged nerve cells in fibers highly enriched with phosphorylated-aSyn molecules. Furthermore, our analysis found a higher number of aSyn aggregates in PD subjects than in HC subjects, with differences in aggregate size, density, and number of molecules per aggregate. On average, aSyn aggregate radii ranged between 40 and 200 nm and presented an average density of 0.001–0.1 molecules/nm2. Our dSTORM analysis thus highlights the potential of our platform for identifying quantitative characteristics of aSyn distribution in skin biopsies not previously described for PD patients while offering valuable insight into PD pathology by elucidating patient aSyn aggregation status.
Parkinson’s Disease (PD) is the second most prevalent neurodegenerative disease after Alzheimer’s disease (AD). PD affects 0.1–0.2% of the general population and 1% of individuals over the age of 60 worldwide (Tysnes and Storstein, 2017). PD is diagnosed clinically based on the presence of bradykinesia and either resting tremor or rigidity (Massano and Bhatia, 2012; Poewe et al., 2017; Berg et al., 2018). Most of the tests, however, fail to provide a quantitative, non-biased assessment of patient status. Although PD starts to develop years before its clinical diagnosis, early diagnosis before and during the prodromal state of the overt clinical symptoms remains an unmet need. Yet, with tests such as DaT SPECT, F-dopa PET, seeding amplification assays, sleep studies, and smell identification tests, preclinical diagnosis may become feasible in the near future. Recently, a new biologic diagnostic strategy based on neuronal alpha-Synuclein (aSyn) pathology has been proposed for the biological staging of PD (Simuni et al., 2024).
aSyn is a synaptic protein enriched in nerve terminals that regulates synaptic transmission (Burré et al., 2014), and is found physiologically both as a monomer and a tetramer (Nuber et al., 2024). Under pathological conditions, natively unfolded aSyn molecules can self-aggregate into pathological oligomers. These structures can then extend into -sheet-rich amyloid protofibrils and fibrils and more complex formations, such as soluble fibrils or ribbons, which deposit into Lewy bodies (LBs) and Lewy neurites that accumulate in the brain neurons (Stefanis, 2012; Brás and Outeiro, 2021). Although the particular aSyn conformation responsible for the neurotoxicity of pathogenic aSyn has yet to be determined, it is presumed that small soluble oligomers lead to toxicity (Conway et al., 2000; Goldberg and Lansbury, 2000; Lashuel et al., 2013; Santos et al., 2023; Chen et al., 2024). While brain aSyn aggregation and the presence of LBs are hallmarks of PD, aSyn aggregates in peripheral tissues outside the central nervous system have also been demonstrated. These include the enteric nervous system of the gastrointestinal tract, which might be associated with gut-first PD (Videlock et al., 2023), sub-mandibular glands, skin, and other peripheral organs (Almikhlafi, 2024). This led to the notion that aSyn aggregates can be detected in peripheral tissues, even years before the appearance of PD motor symptoms. Accordingly, biosamples from the skin, the gastrointestinal tract, sub-mandibular glands, cerebrospinal fluid (CSF), and saliva have been extensively examined (Shannon et al., 2012; Mollenhauer et al., 2013; Donadio et al., 2014; Doppler et al., 2014; Adler et al., 2016; Goldman et al., 2018; Vivacqua et al., 2019). However, these studies reported diverging findings regarding the sensitivity and specificity of aSyn as a biomarker for PD (Lebouvier et al., 2008; Shannon et al., 2012; Tsukita et al., 2019).
Biopsies from more accessible tissues, such as the skin, which contains sensory and autonomic nerves that intricately innervate sweat glands, blood vessels, and pilomotor muscles, have been addressed (Adler et al., 2016). In most such studies, immunohistochemical assays were performed to assess the levels of native aSyn and phosphorylated (p)-aSyn deposits, corresponding to the pathological form of aSyn (Okochi et al., 2000), in dermal autonomic nerve fibers to distinguish between PD patients and Healthy control (HC) subjects (Wang et al., 2013; Donadio et al., 2014, 2019; Gibbons et al., 2016, 2021; Antelmi et al., 2017; Doppler et al., 2017; Beach et al., 2018; Tsukita et al., 2019; Giannoccaro et al., 2020; Doppler, 2021). p-aSyn deposits were observed in the dermal autonomic innervation of blood vessels, erector pili muscles, and sweat glands and were suggested to be associated with autonomic neurodegeneration in PD patients (Donadio et al., 2014, 2019, 2024; Doppler et al., 2014; Antelmi et al., 2017; Gibbons et al., 2024). Recently, novel seeding assays, such as real-time quaking-induced conversion (RT-QuIC) and protein misfolding cyclic amplification (PMCA), now referred to as the aSyn seeding amplification assay (SAA), were used to detect aSyn aggregation in skin tissue homogenates (Manne et al., 2020). These studies showed promising results regarding the ability to differentiate between PD patients and HC samples but have yet to meet the requirements needed to become clinically adopted.
One of the main limitations of conventional immunoassays is their inability to resolve small aggregates that are below the resolution of conventional light microscopy (200–250 nm) (Huang et al., 2009; Sigrist and Sabatini, 2012; Sauer and Heilemann, 2017; Sahl and Hell, 2019; Dankovich and Rizzoli, 2021), and, thus, studies based on such approaches mostly overlooked the composition, dispersion, density, and size of aSyn aggregates. Similarly, aSyn-SAAs do not provide information on the initial aggregate seed status. In recent years, the application of super-resolution microscopy (SRM) to detect protein aggregates in neurodegenerative diseases has provided novel information about the sizes, shapes, and densities of the presumably toxic small-to medium-sized aggregates implicated in the pathology of such conditions. Using an SRM method, namely, dSTORM, allowed for the quantification and characterization of aSyn aggregates in brain slices of a transgenic PD mouse model (Wegrzynowicz et al., 2019). The aggregates detected were classified into different patient populations that correlated with the degree of PD-like symptoms. Most of the aSyn aggregates, which were associated with disease progression, were 20–250 nm in size, which is below the diffraction limit of conventional microscopes. The use of SRM also revealed that the aSyn aggregate modifier anle138b was able to specifically reduce the levels of medium-sized aSyn aggregates, which was correlated with improvement in mouse motor function (Wegrzynowicz et al., 2019). Indeed, SRM has been used to characterize amyloid-beta (Aβ) and tau aggregates in CSF samples of AD patients and allowed for distinguishing AD patients from HC subjects (Zhang et al., 2015). Together, these results provide proof of concept for the use of SRM, specifically dSTORM, to detect sub-diffraction-sized aSyn aggregates, allowing such particles to serve as an accessible biomarker of PD.
Here, we present a novel combination of SRM and an advanced analysis platform, which improves imaging and detection sensitivity. When applied to biological samples from PD patients and HC subjects, this combination enabled the detailed characterization of nano-sized aSyn aggregates and their classification according to different quantitative parameters, allowing the development of a new molecular biomarker for PD.
Participants were recruited from three medical centers in Israel: Tel Aviv Sourasky Medical Center, Meir Medical Center, and Sheba Medical Center. The study was approved by the hospitals’ medical ethics committees (ethics committee approvals 8492–21, 0257–08, and 0302–23, respectively). All subjects gave written informed consent.
A single skin biopsy from the upper back (at level C7) of each PD patient (seven total: five males and two females) and each HC subject (seven total: five males and two females) was obtained by clinicians at the three medical centers using a 3–4 mm punch (Figure 1A and Supplementary Table S1). All subjects were clinically evaluated by a movement disorders neurologist using the Movement Disorder Society-Unified Parkinson’s Disease Rating Scale (MDS-UPDRS), Montreal Cognitive Assessment (MoCA), and Hoehn and Yahr (H&Y) scales to assess PD severity (mean UPDRS: 34. mean MoCA: 23.7. mean H&Y: 2.2) and to confirm that the HC subjects were free of disease (mean UPDRS: 0.86. Mean MoCA: 26.6. All H&Y: 0). The biopsies were fixed in 4% paraformaldehyde (PFA) overnight, moved to 15% sucrose solution for 1 h and then to a 30% sucrose solution overnight. The samples were frozen in optimal cutting temperature (OCT) compound and kept at −80°C until used. The samples were then sliced using a cryostat (Leica CM3050-S) into 12 μm-thick sections and mounted on 1.5H positively charged coverslips or glass slides.
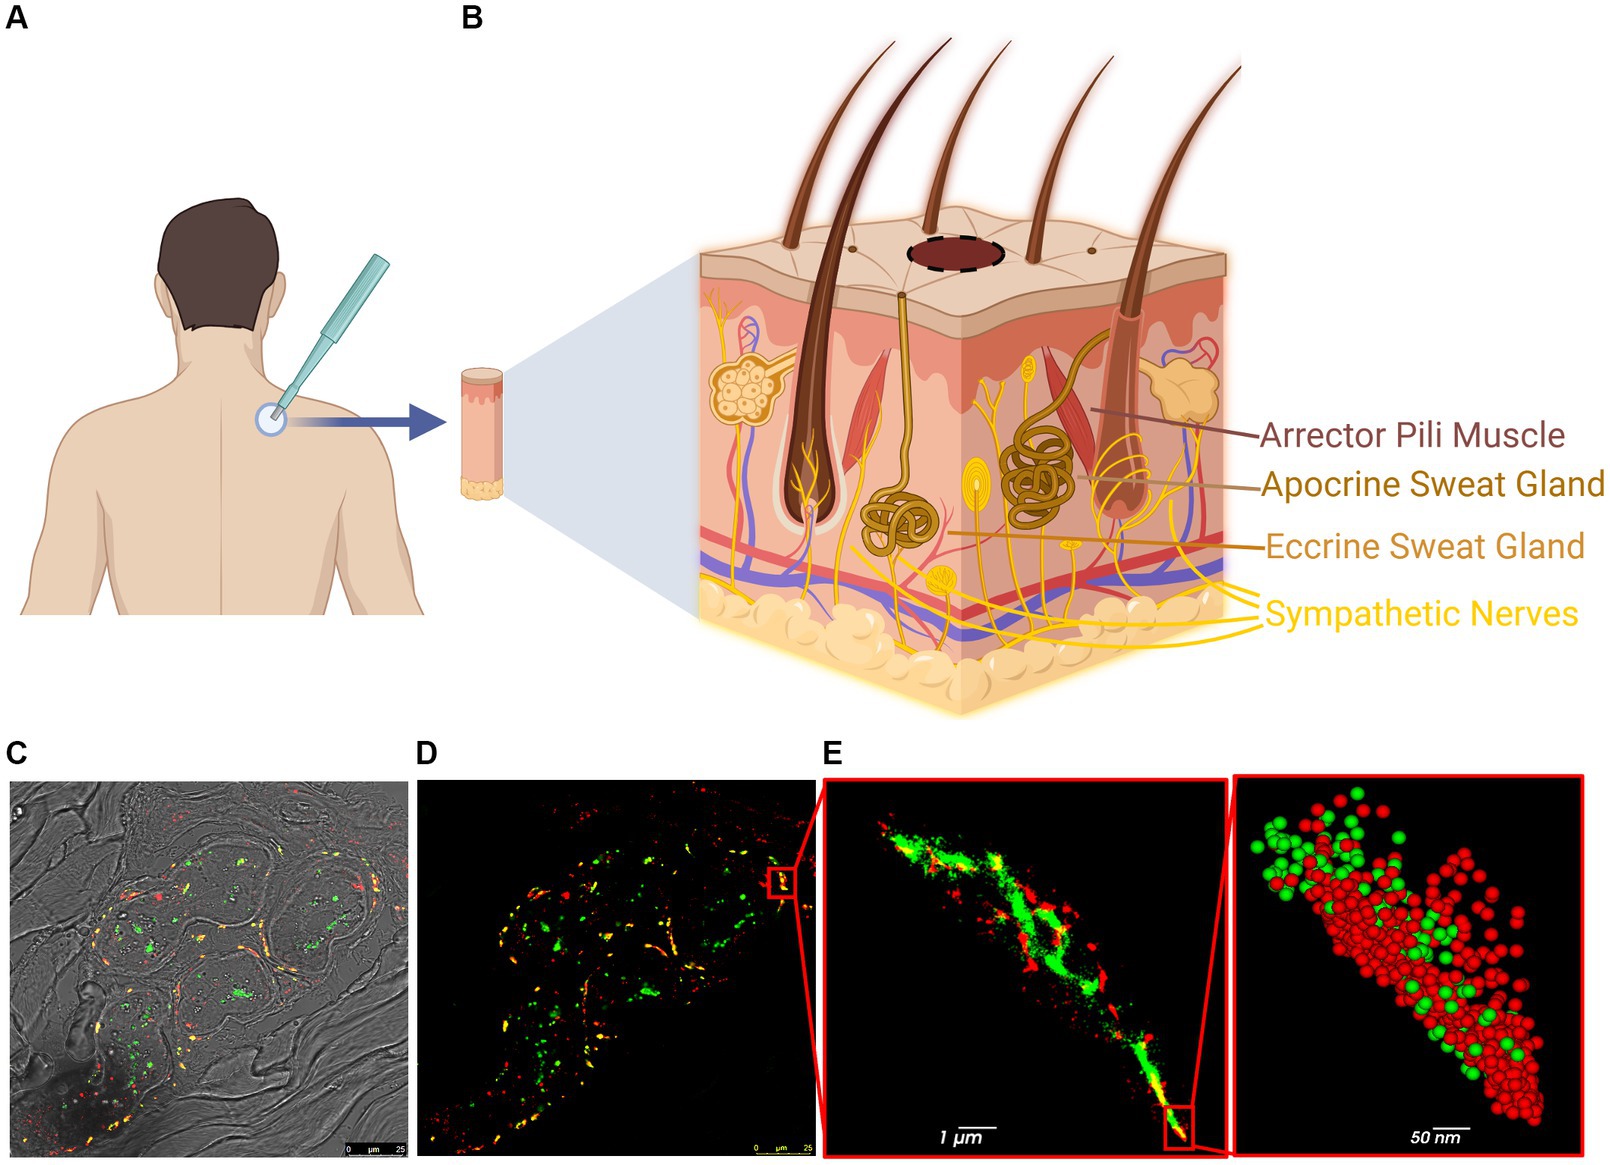
Figure 1. Steps and methodology of skin biopsy processing for dSTORM. (A) Skin biopsy taken from the upper back (C7). (B) The skin contains various innervated structures, such as erector pili muscles, sweat glands, autonomic nerves, and cutaneous nerves. (C,D) Confocal image of a sweat gland from PD patient: p-aSyn (red), neuronal marker PGP9.5 (green) and areas of co-localization (yellow). (E) dSTORM reconstructed image of part of the sweat gland innervation (insert in D) shows p-aSyn (red) and PGP9.5 (green) and their co-localization (yellow). Insert-a close-up view showing single-molecule distribution of both p-aSyn (red) and PGP9.5 (green).
For subsequent analysis, biopsies from 7 HC and 7 PD samples (Supplementary Table S1) were immunostained and analyzed (Figure 1). Skin sections were stained with an anti-p-aSyn antibody (mouse anti-phosphorylated-aSyn antibody (Ser129), diluted 1:500; 825,701, Biolegend). Subsequent skin sections from the same 4 HC subjects and 4 PD patients were stained with an anti-total aSyn (t-aSyn) antibody (mouse anti-α-synuclein antibody, clone 42, 1:250 dilution; 610,787, BD Bioscience). Both conditions were also stained with anti-protein gene product 9.5 (PGP9.5), a neuronal marker (rabbit anti-PGP9.5 antibody, diluted 1:200; ab108986, Abcam) (Supplementary Table S1) and nerve areas that showed PGP9.5 staining were imaged with an anti-aSyn antibody as detailed above. Samples from one PD patient and one HC were excluded from analysis due to tissue disintegration, leaving six PD patients (four males and two females; median age: 69.5) and six HC subjects (five males and one female; median age: 65.5) for the analysis. For each subject, 10 images from 2 to 3 slices were analyzed.
All skin sections from each subject were initially imaged with a confocal scanning laser microscope (Leica SP8). Images (1,024 × 1,024 pixels) were acquired using an HC PL APO CS2 63X/1.40 NA oil objective, DD 488/552 and 638 excitation beam splitters, and optically pumped semi-conductor lasers (OPSLs) at 552 and 638 nm lasers (Leica Microsystems). Images were obtained by averaging four scans using LasX software (Leica Microsystems). This step was performed to confirm antibody staining and the presence of a sweat gland or nerve bundle.
dSTORM was performed using a single-molecule localization microscope (Vutara350, Bruker) (Wegrzynowicz et al., 2019; Sade et al., 2023; Sela et al., 2023). Briefly, in dSTORM, fluorophores are photo-switched between bright and dark states in a stochastic manner (Supplementary Figure S1), with the position of a single fluorophore (i.e., molecule) being estimated to a resolution of ~10–20 nm by fitting a point spread function (PSF). The sample is imaged for 3,000 frames. In each frame, stochastic activation of different molecules occurs, allowing for the separation of closely positioned molecules and subsequent reconstruction of an inclusive image of all localizations in the image (Supplementary Figures S1C,D). The improved resolution of dSTORM (~10–20 nm), as compared to that of confocal microscopy (~200 nm), enables the detection of single molecules and populations of sub-diffractional aggregates, that would otherwise be indistinguishable.
A combination of two laser wavelengths was used (i.e., 561 and 647 nm), with laser power of 1,000 mW with a range of 5–10 kW/cm2 (for the 562 nm laser, we measured at the objective plane 116 mW and for the 647 nm laser 110 mW at 100%). In the scans introduced in this paper, 30% laser power was applied, reaching approximately 1.5–3 kW/cm2. The Vutara350 microscope is equipped with a bi-plane detection option, which allows three-dimensional imaging of up to a few hundred nanometers (SRX Full System Manual|SRX Manual, 2022). The Vutara350 microscope also uses a water immersion 60x objective, 1.20NA, with a field of view of 10 μm × 10 μm. The cameras used were a sCMOS camera (4 MP, 6.5 μm × 6.5 μm pixel size for super-resolution imaging) and a CCD camera (1,392 × 1,040 pixels, for wide-field imaging) with an exposure time of 20 ms per frame and 20 ms between frames. We acquired a total of 3,000 frames at each wavelength (i.e., 561 and 647 nm), or 6,000 frames in total, and fitted a PSF to each detected particle using VutaraSRX software. Particles with skewed or wide PSFs were discarded. High-quality PSFs were used to convert particles from a pixelated image into precise single-molecule localizations, represented by three-dimensional coordinates that correspond to the peak of the fitted PSF, using VutaraSRX software.
Several modules were implemented to analyze dSTORM output data. Each subject was represented by a vector consisting of one average value from each of their dSTORM images (n = 30 for t-aSyn, n = 10 for p-aSyn). The statistical test used was Mann–Whitney U (MWU) test due to the small sample sizes. All the analysis was performed using self-written Python code, using open-source libraries.
We created a tailor-made platform for the cluster analysis of dSTORM images programmed in Python using open-source libraries. The platform included three cluster-identification algorithms: density-based spatial clustering of applications with noise (DBSCAN) (Ester et al., 1996; Pedregosa et al., 2011a), hierarchical density-based spatial clustering of applications with noise (HDBSCAN) (Mcinnes et al., 2016; McInnes et al., 2017), and fast optimized cluster algorithm for localizations (FOCAL) (Mazouchi and Milstein, 2016; Nino et al., 2020). Considering the strengths and limitations of each algorithm allowed us to select the most suitable approach for a given dataset and analysis objective. We initially applied the DBSCAN and FOCAL algorithms to our datasets (Supplementary Figure S4) and found that, as described below, they most accurately characterized aSyn aggregates in skin biopsies. DBSCAN-based searches for areas of high density in the dataset and defines clusters. The Sci-Kit DBSCAN library (Python3.6) was used here (Pedregosa et al., 2011a). FOCAL examines the number of localizations per 3D voxel and defines minimal numbers of localizations per voxel (minL) and per neighboring voxels (minC). As dSTORM output provides information in addition to localization coordinates, specifically the intensity or photon count (PC) at each localization, we implemented an adjustment to FOCAL (FOCALPC) and defined a new parameter, namely, the minimum average photon count (maPC) in a group of voxels considered as a cluster candidate (Supplementary Figure S2). In this manner, we also give weight to the intensity at each localization, which correlated with localization precision (Supplementary Figure S3).
Various parameter combinations were tested using FOCAL to optimize skin p-aSyn cluster detection. All parameter combinations were supplemented with a PCA of one standard deviation for noise reduction, a minimum threshold of PC of 1,000, and a maximum threshold of x-precision of 100 nm. The average PC at all localizations in each voxel was calculated and only voxels with an average PC higher than the maPC were reconsidered as clusters. If the new voxel group met the minL and minC, it was considered a cluster; otherwise, it was discarded. This adjustment allowed FOCALPC to detect clusters containing more intense localizations, which we found to be correlated with higher localization precision (Supplementary Figure S3). This adjustment was further used to ensure that the clustering was strict and did not allow localizations that strongly deviated spatially from most localizations in the cluster. For convenience, density measures in the platform were multiplied by a factor of 1,000.
As dSTORM data provide single-molecule resolution, one can estimate both the overall distribution of aSyn molecules in skin nerves and their organization into aggregates. Accordingly, we first performed a basic comparison of the number of aSyn molecules that were detected in all conditions and their characteristics (Figures 1A,B). We compared the number of localizations (estimated for the number of molecules detected), their localization precision, and their correlation with their intensity (measured as a PC). The number of localizations per image was normalized per image region of interest (ROI) volume to account for possible bias in ROI selection between PD patients and HC samples. The average number of localizations per dSTORM image normalized to ROI volume was similar for t-aSyn in both sets of subjects (PD patients: 2.23e-07 ± 1.3e-08, n = 40 images; HC subjects: 2.48e-07 ± 8.4e-09, n = 40 images). The average number and distribution of the number localizations for p-aSyn were also similar (PD patients: 2.4e-07 ± 9.2e-09, n = 60; HC subjects: 2.4e-07 ± 1e-08, n = 60).
We next examined the precision of each localization by correlating the precision of each localization with its intensity (PC) and validated that for high PC values, the localization precision was better for both t-aSyn and p-aSyn in both subject populations (Supplementary Figure S3). We also found that the localization precision was similar for PD patients and HC subjects for both t-aSyn and p-aSyn in the X, Y, and Z axes, allowing for the use of the same clustering algorithms on all data sets. As localization precision was lower for localizations with PC values lower than 1,000, we defined a minimum PC of 1,000 as a cutoff for further analysis, as localizations with lower values showed lower precision. Together, these results suggest that overall, the number and parameter of each aSyn molecule in both PD patients and HC subjects are similar. This allowed us to continue onto the next stages of analysis and compare the distribution of aSyn molecules in PD patients and HC subjects.
Peripheral nerve cells undergo degeneration in PD patients (Mu et al., 2013; Comi et al., 2014; Marogianni et al., 2020; Paul et al., 2020; Sharabi et al., 2021; Vacchi et al., 2021). To examine if there was a correlation between the appearance of p-aSyn molecules and degeneration of peripheral nerve fibers in the skin (Figures 2A,B), we compared two parameters, namely, the ratio of volumes covered by aSyn and by a neuronal marker (PGP9.5) (Figures 2C,E) and the ratio of the number of localizations of aSyn and a neuronal marker (PGP9.5) in these volumes (Figures 2D,F). No significant differences between subject groups were observed in ratios of the volume of both t-aSyn and p-aSyn to nerve fiber area in both HC subjects (Figure <bold>2</bold>C) and PD patients (Figure <bold>2</bold>E). However, we hypothesized that in nerve tissues, over-abundance of aSyn molecules and especially with p-aSyn molecules could cause damage to the nerve fiber or synapse of autonomic nerve fibers, such that less neuronal signal should be detected. Our results show that the number of t-aSyn molecules that were detected, as compared to a neuronal marker (PGP9.5), was significantly higher in PD subjects than HC subjects (Figure 2D). However, the number of p-aSyn molecules that were detected, as compared to a neuronal marker (PGP9.5), was significantly lower in PD patients as compared to HC subjects (Figure 2F). This suggests that in areas enriched with p-aSyn, less nerve fiber tissue is preserved. We next examined the areas marked by the neuronal marker (PGP9.5) over 200 × 200 μm regions of the sweat gland/nerve bundle in wide-field images containing the areas that were imaged in dSTORM. We found that the neuronal marker labeling is significantly higher in HC subjects compared to PD patients (Supplementary Figure S5), as previously demonstrated (Mu et al., 2013; Comi et al., 2014; Marogianni et al., 2020; Paul et al., 2020; Sharabi et al., 2021; Vacchi et al., 2021).
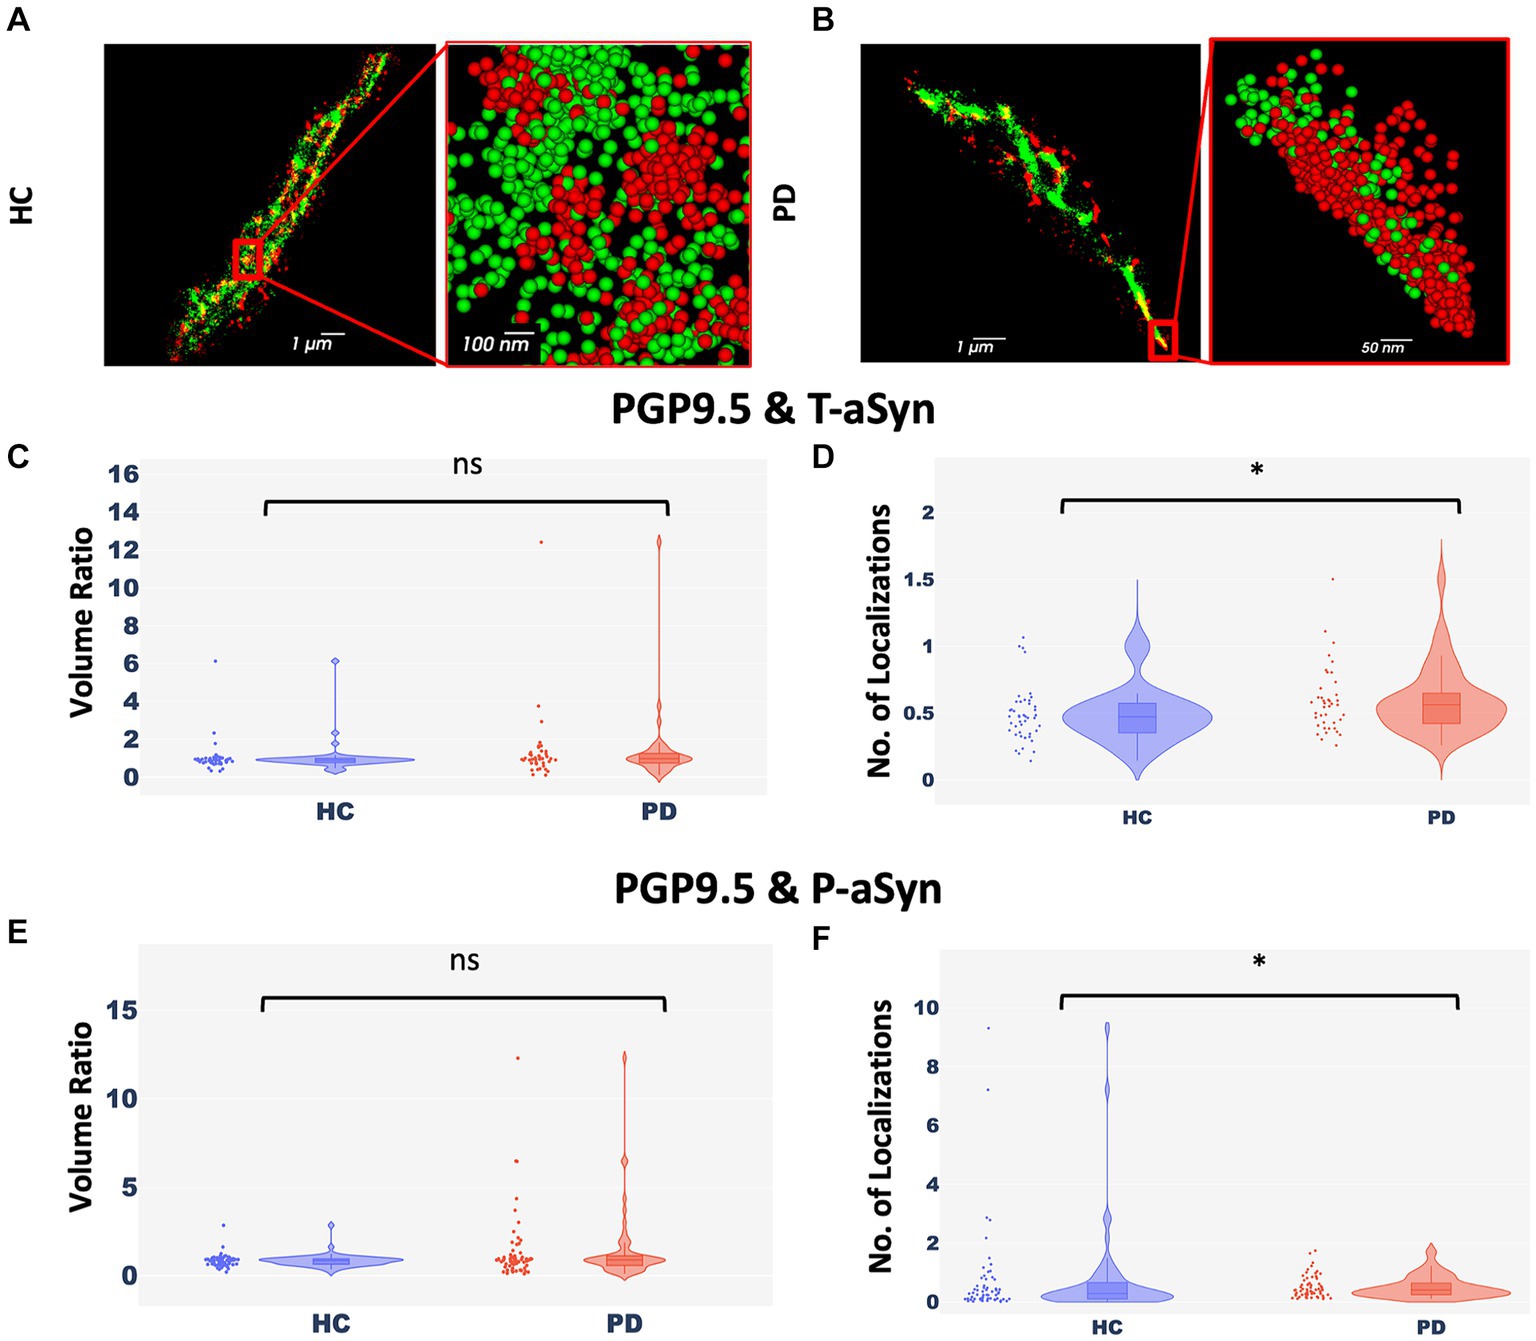
Figure 2. Nerve cells enriched with p-aSyn are less well-preserved. (A,B) Reconstructed dSTORM images showing p-aSyn localization (red) and that of a neuronal marker (green) in sweat gland innervation in a PD patient (A) and an HC subject (B). (A) and (B) insert - a close-up view showing single molecules distribution of both t-aSyn (red) and PGP9.5 (green). (C) The ratio of PGP9.5 ROI volume to t-aSyn ROI volume within each dSTORM image is not significantly different between HC subjects (blue) [Median: 0.89±0.125, n = 40] and PD patients (red) [Median: 0.97±0.295, n = 40], with a p-value of 0.165. (D) The ratio of the number of PGP9.5 localizations to t-aSyn localizations is significantly different between HC subjects (blue) [Mean (median) – 0.485±0.03 (0.47)] and PD patients (red) [Mean (median) – 0.59±0.04 (0.56)], with a p-value of 0.026. (E) The ratio of PGP9.5 ROI volume to p-aSyn ROI volume within each dSTORM image is not significantly different between HC subjects [Median: −18.5e+09±10.7e+09, n = 60] and PD patients [Median: −21.6e+09±5e+09, n = 60], with a p-value of 0.39. (F) The ratio of the number of PGP9.5 localizations to p-aSyn localizations is significantly higher in HC subjects (blue) [Mean (median) – 0.74±0.2 (0.29)] compared to PD patients (red) [Mean (median) – 0.51±0.05 (0.41)] (each point represents a ratio in a single dSTORM image), with p-value of 0.03. *p < 0.05.
aSyn is known to form aggregates, while p-aSyn is known to be highly enriched in both brain LBs (Spillantini et al., 1997) and in skin aSyn deposits. To characterize t-aSyn and p-aSyn distribution into aggregates in the skin, we next used several analysis algorithms to analyze the distribution of the dSTORM localization data into aggregates. We have previously implemented DBSCAN to analyze the organization of aSyn into aggregates (Wegrzynowicz et al., 2019; Sade et al., 2023; Sela et al., 2023) and extended these earlier efforts here by introducing FOCAL and FOCALPC as additional analysis algorithms (Figure 3). Briefly, FOCAL examines the number of localizations per 3D voxel and defines minimal numbers of localizations per voxel and per neighboring voxels. By implementing FOCALPC that gives weight to the intensity of each localization and hence its localization precision (see Materials and Methods and Supplementary Figure S2 for more details), we were able to integrate only those voxels that measured single aSyn molecules with higher localization precision into an aggregate (Figure 3 and Supplementary Figure S3).
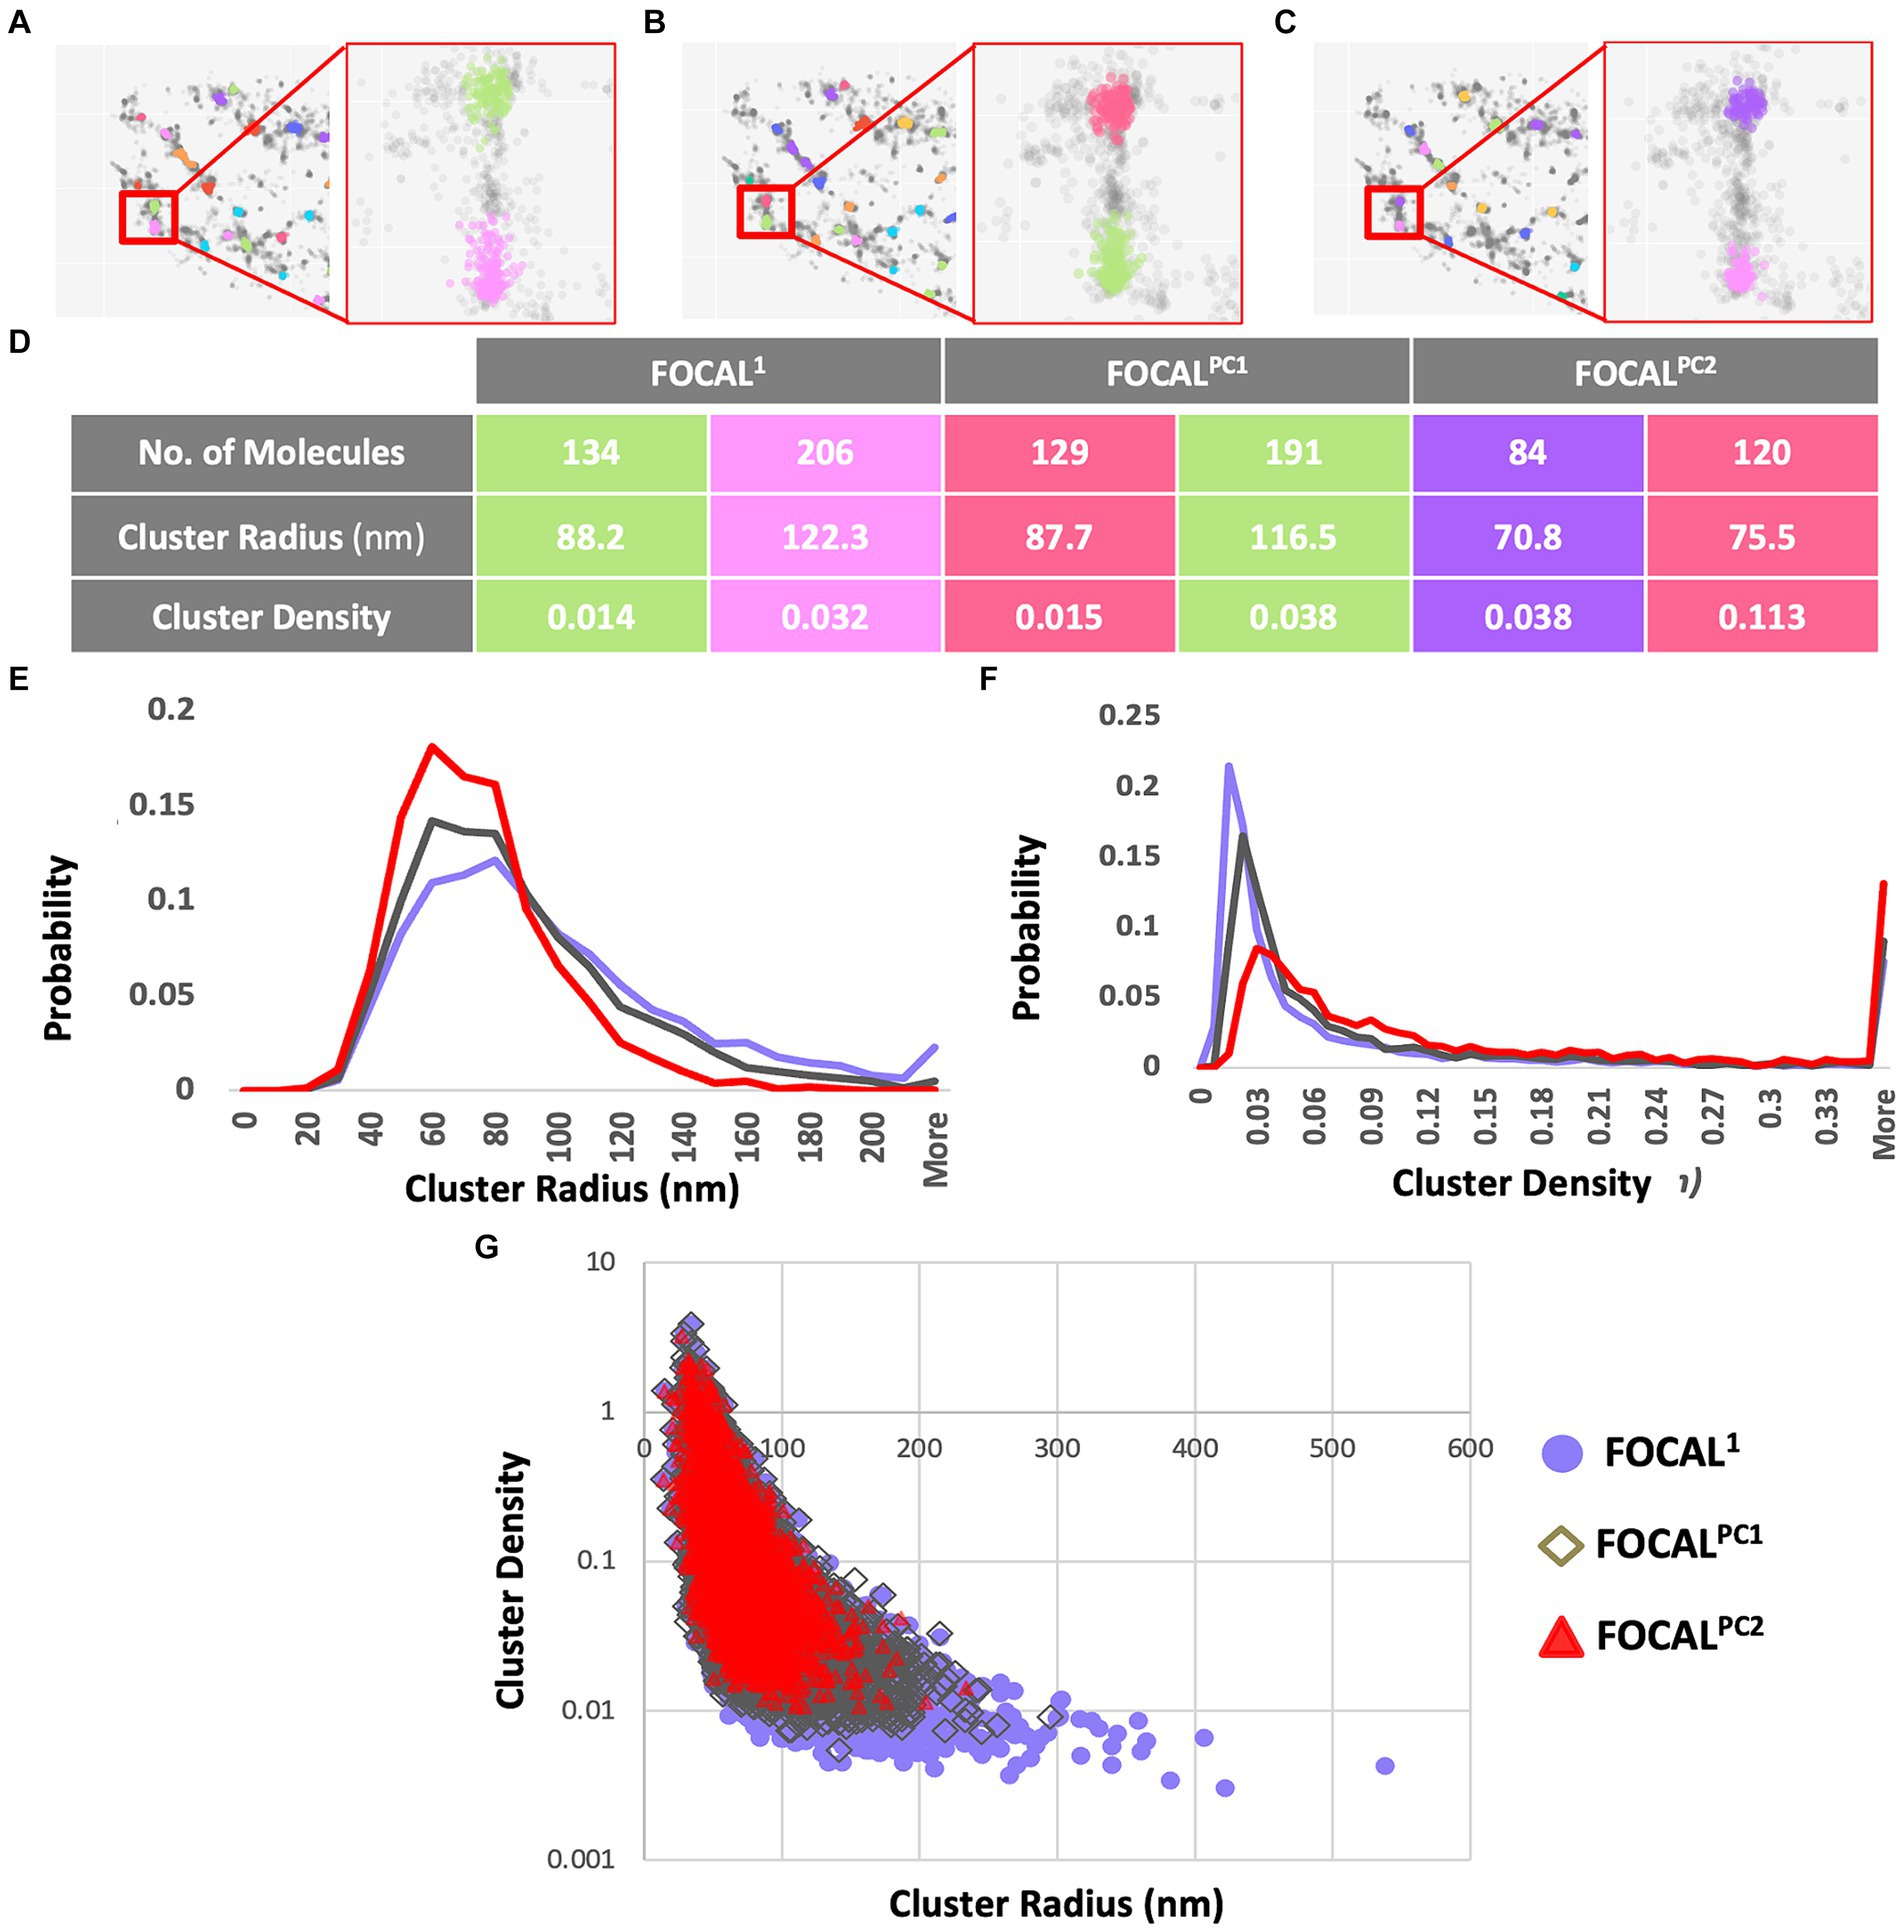
Figure 3. Aggregates’ radii decrease and aggregates’ densities increase when increasing maPC from 0 to 2,500 to 5,000 using FOCAL1, FOCALPC1, and FOCALPC2. (A–C) Clustering visualization and parameters comparison. Aggregate identification in the same area is shown using FOCAL1 (A), FOCALPC1 (B), and FOCALPC2 (C). Inserts show the same 2 aggregates under the different FOCAL analyses. (D) Aggregate properties, such as the number of localizations in the aggregates, its radius, and density are listed for the 2 aggregates in the inserts for the 3 FOCAL parameters shown above. (E) Distribution of aggregates’ radii identified by each algorithm. FOCAL1 (purple), FOCALPC1 (gray), and FOCALPC2 (red). (F) Distribution of aggregates’ densities identified by each algorithm. FOCAL1 (purple), FOCALPC1 (gray), and FOCALPC2 (red). (G) Scatter plot showing the correlation between aggregates’ radius and density as detected in the different FOCAL analyses. The mean numbers of aggregates per image in FOCAL1 [85.79], in FOCALPC1 [78.403], and in FOCALPC2 [55.919]. The mean percentage of localizations identified as aggregates in FOCAL1 = 49.1%, in FOCALPC1 = 49.5%, and in FOCALPC2 = 49.6%.
We first examined the effect of adding the maPC to p-aSyn aggregate detection in the PD patients dataset. When maPC was increased (from 0 in FOCAL1 to 2,500 in FOCALPC1, and to 5,000 in FOCALPC2), less voxels were characterized as part of the aggregates and hence, less localizations were allocated to the aggregate. As such, the aggregates were smaller and became denser (compare FOCAL1 to FOCALPC1 and FOCALPC2 values; Figure 3). On average, the number of localizations assigned to clusters by FOCAL1 was larger (267.29 ± 4.63), as compared to the assignments made by FOCALPC1 (203.69 ± 2.44) or FOCALPC2 (203.68 ± 2.63). Similarly, FOCAL1 reported clusters with larger radii (92.5 nm ±0.6), in comparison with those reported by FOCALPC1 (84.12 nm ±0.5) or FOCALPC2 (74.98 nm ±0.46; Figure 3E). Expectedly, we also found clusters of lower densities with FOCAL1 (0.02 ± 0.0006) than with FOCALPC1 (0.09 ± 0.002) or FOCALPC2 (0.13 ± 0.003; Figure 3F). On average, 85.8 clusters were identified by FOCAL1 [75 (median), 7.9 (SEM)], a slightly smaller number (78 clusters) was classified by FOCALPC1 (69, 5.5), and the smallest number (56 clusters) was classified by FOCALPC2 (47, 3.2). Furthermore, the percentage of localizations assigned to clusters was reduced as the maPC increased (FOCAL1: 33.9%, FOCALPC1: 30.3%, and FOCALPC2: 21.6%). It is hence apparent that the additional maPC parameter has a visible impact on the clusters identified by FOCALPC. It should be noted that the new algorithm gave similar results to the DBSCAN algorithm that was used in a previous study (Wegrzynowicz et al., 2019; Supplementary Figure S4), but decreased the range of cluster densities and radii, as well as the number of identified clusters, thereby making clustering more specific to more dense clusters, presumably representing pathological p-aSyn deposits.
Figures 4, 5 present the distribution of p-aSyn aggregates and t-aSyn in PD patients and HC subjects as obtained with the modified FOCAL. We hypothesized that the number or composition of p-aSyn aggregates would differ between PD patients and HC subjects. The average number of p-aSyn clusters per image identified by FOCALPC2 was significantly larger in PD patients (56 ± 4.705) than in HC subjects (42 ± 3.914; Figure 4E). The total number of p-aSyn aggregates found and analyzed in PD patients (3,467) was larger than the total number of p-aSyn aggregates found in HC subjects (2,547). We found no effect of the subjects’ age on the number of clusters either in HC or in PD (Supplementary Figure S6). p-aSyn clusters were significantly larger in PD patients (75 nm ±0.459) than in HC subjects (69 nm ±0.487; Figures 4C,F) but were significantly denser in HC subjects (0.18 localizations per nm3 ± 0.005) than in PD patients (0.13 localizations per nm3 ± 0.004; Figures 4D,H). In agreement with these observations, the clusters identified by FOCALPC2 in PD patients (203.68 ± 2.626) contained fewer localizations than those in HC subjects (217.66 ± 3.23, Figure 4G). Hence, in agreement with our hypothesis, skin slices of PD patients contained more p-aSyn aggregates than those of HC subjects.
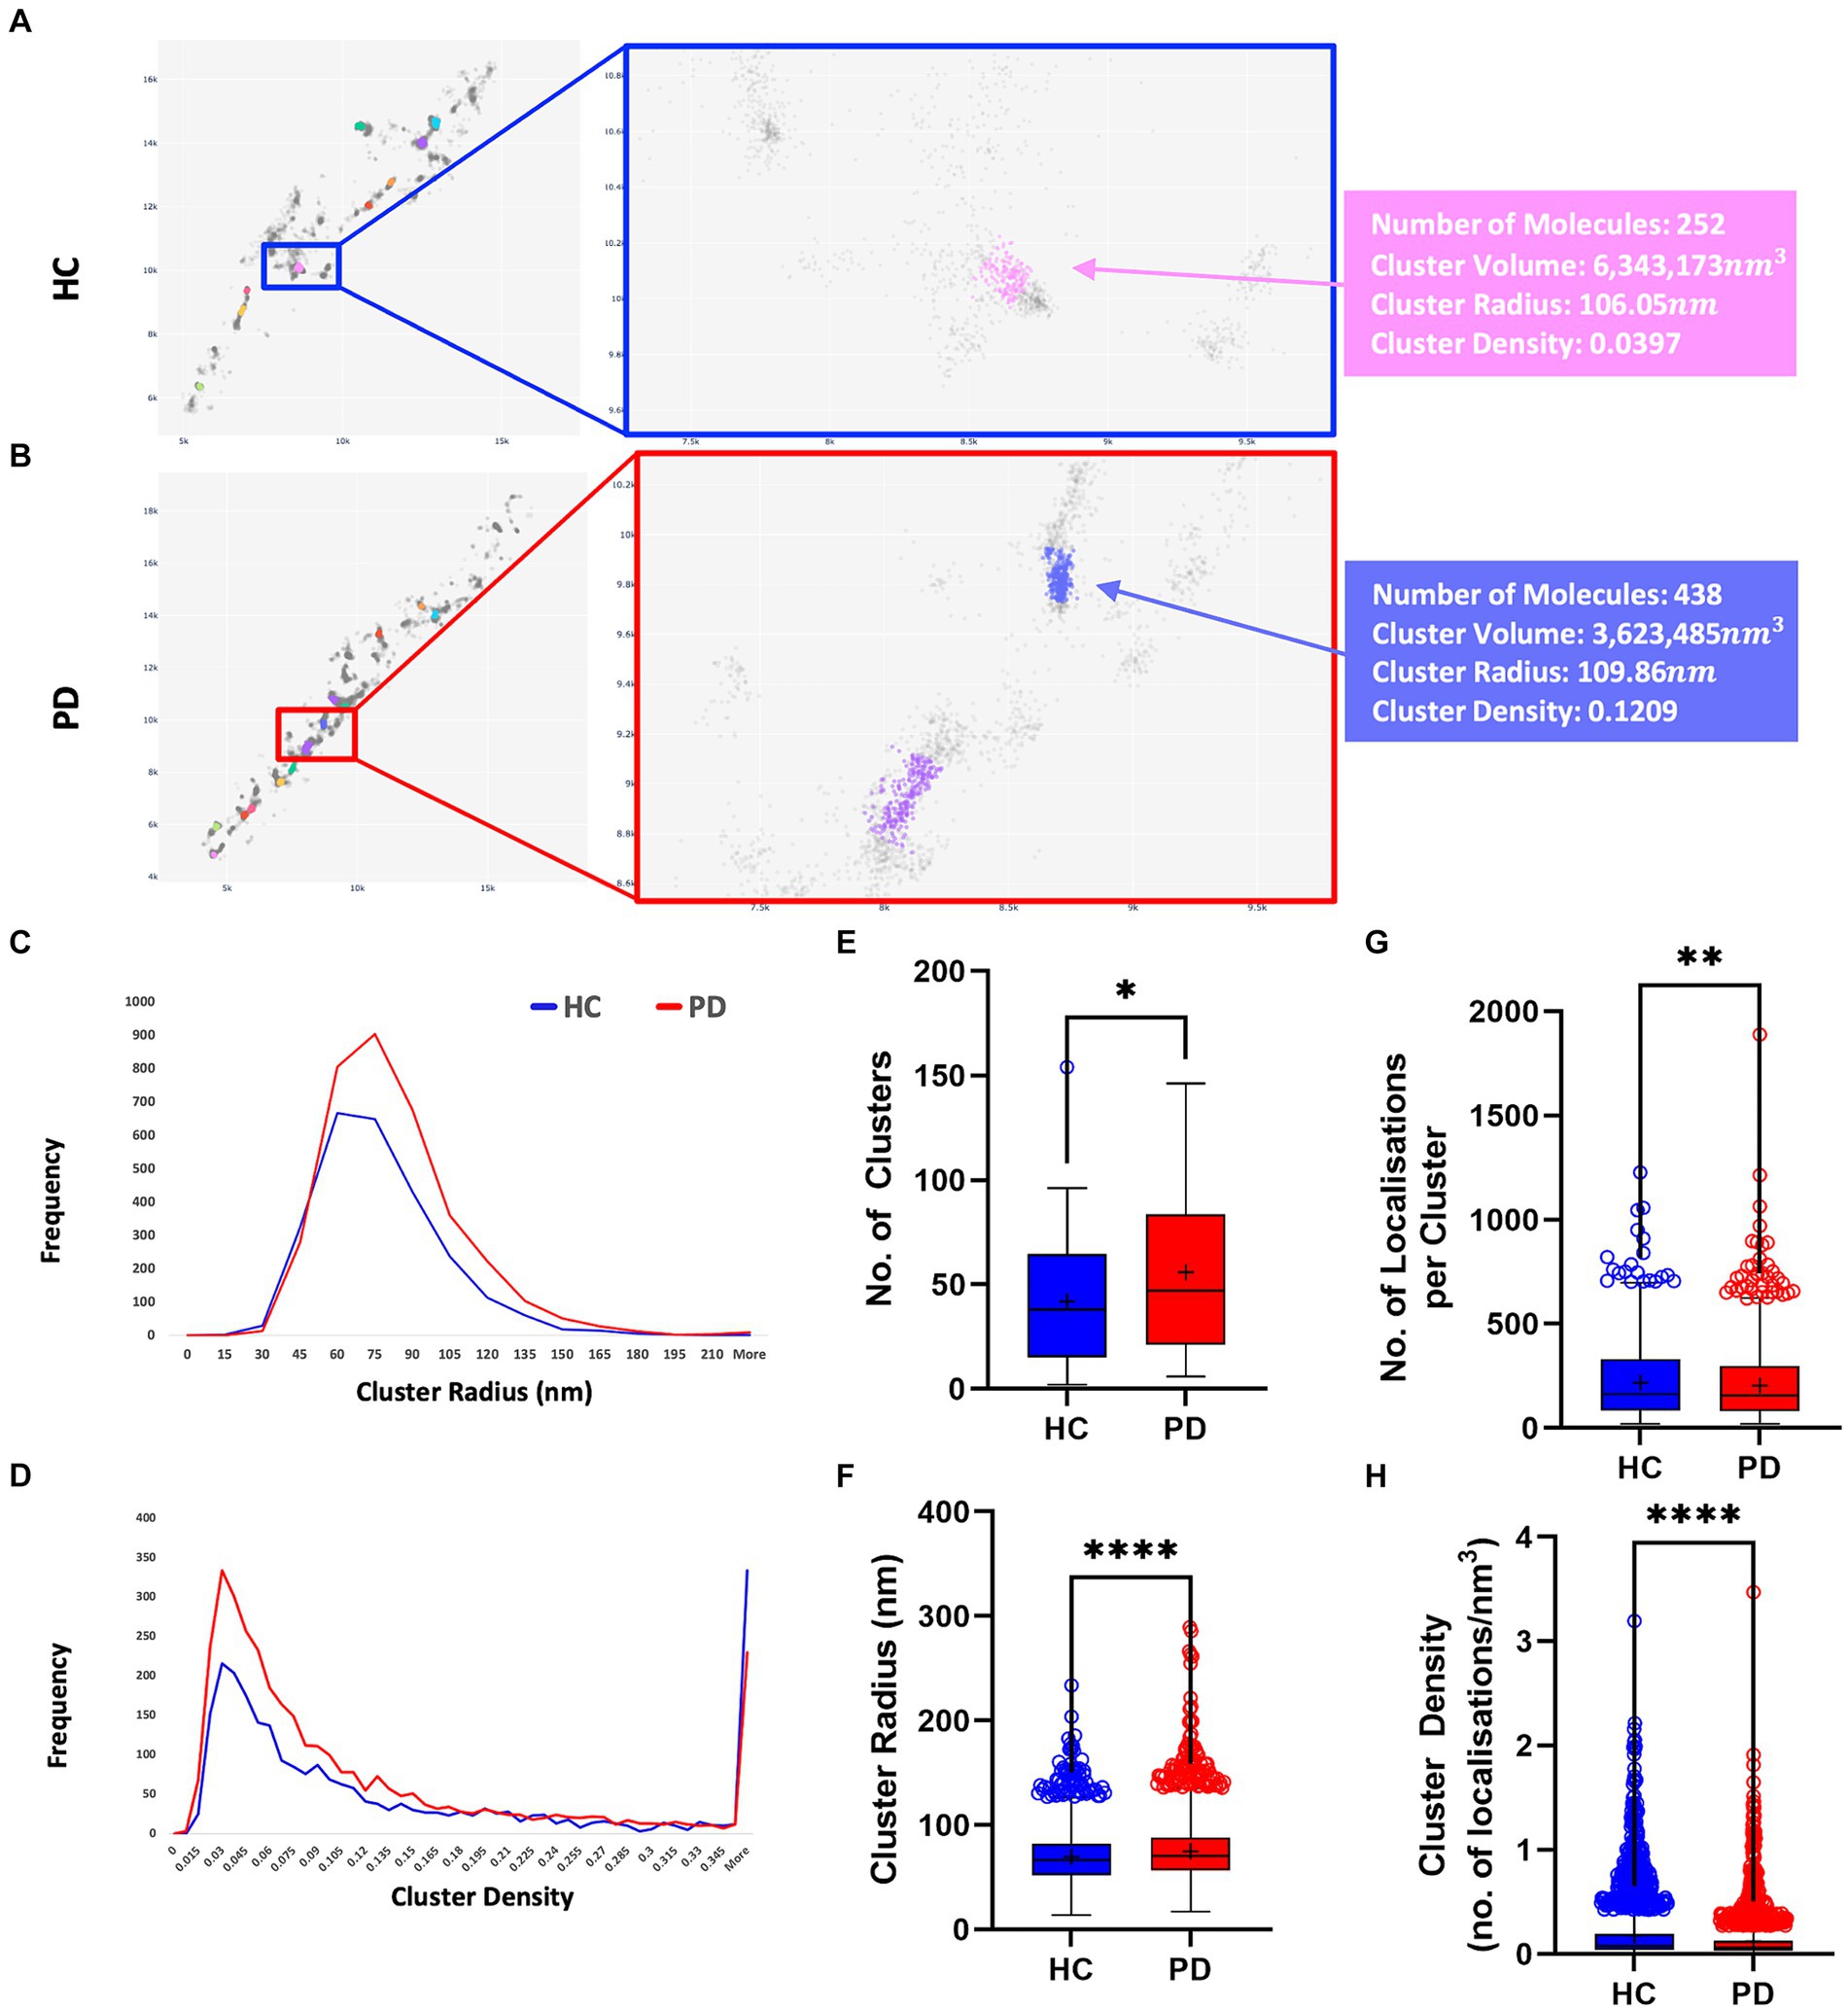
Figure 4. PD patients display a higher number of aggregates compared to HC subjects. (A,B) Visualization of aggregates identified by FOCALPC2 in an HC subject (A) and a PD patient (B). (C) Distribution of aggregates’ radii shows that PD patient-derived images contain a larger number of aggregates with medium radii than do HC subject-derived images. (D) Distribution of aggregates’ densities shows that PD patient-derived images display a larger number of aggregates with low-medium densities. (E) Number of aggregates is significantly higher in PD patients than in HC subjects [means – HC: 42.45, PD: 55.92]. (F) Radii of aggregates are significantly larger in PD patients than in HC subjects [means – HC: 69.43, PD: 74.98]. (G) Densities of aggregates are significantly higher in HC subjects than in PD patients [means – HC: 0.1785, PD: 0.1263]. (H) Number of localizations per aggregates is significantly higher in HC subjects than in PD patients [means – HC: 217.66, PD: 203.68]. The mean percentage of localizations identified as aggregates in HC subjects is 20.3% and in PD patients is 21.6%. Means are marked with a + sign, and the 25th percentile, median, and 75th percentile are marked by the bottom, middle, and top black lines outlining the whisker box, respectively. Each outlier data point is marked with a diamond. *p < 0.05, **p < 0.01, ****p < 0.0001.
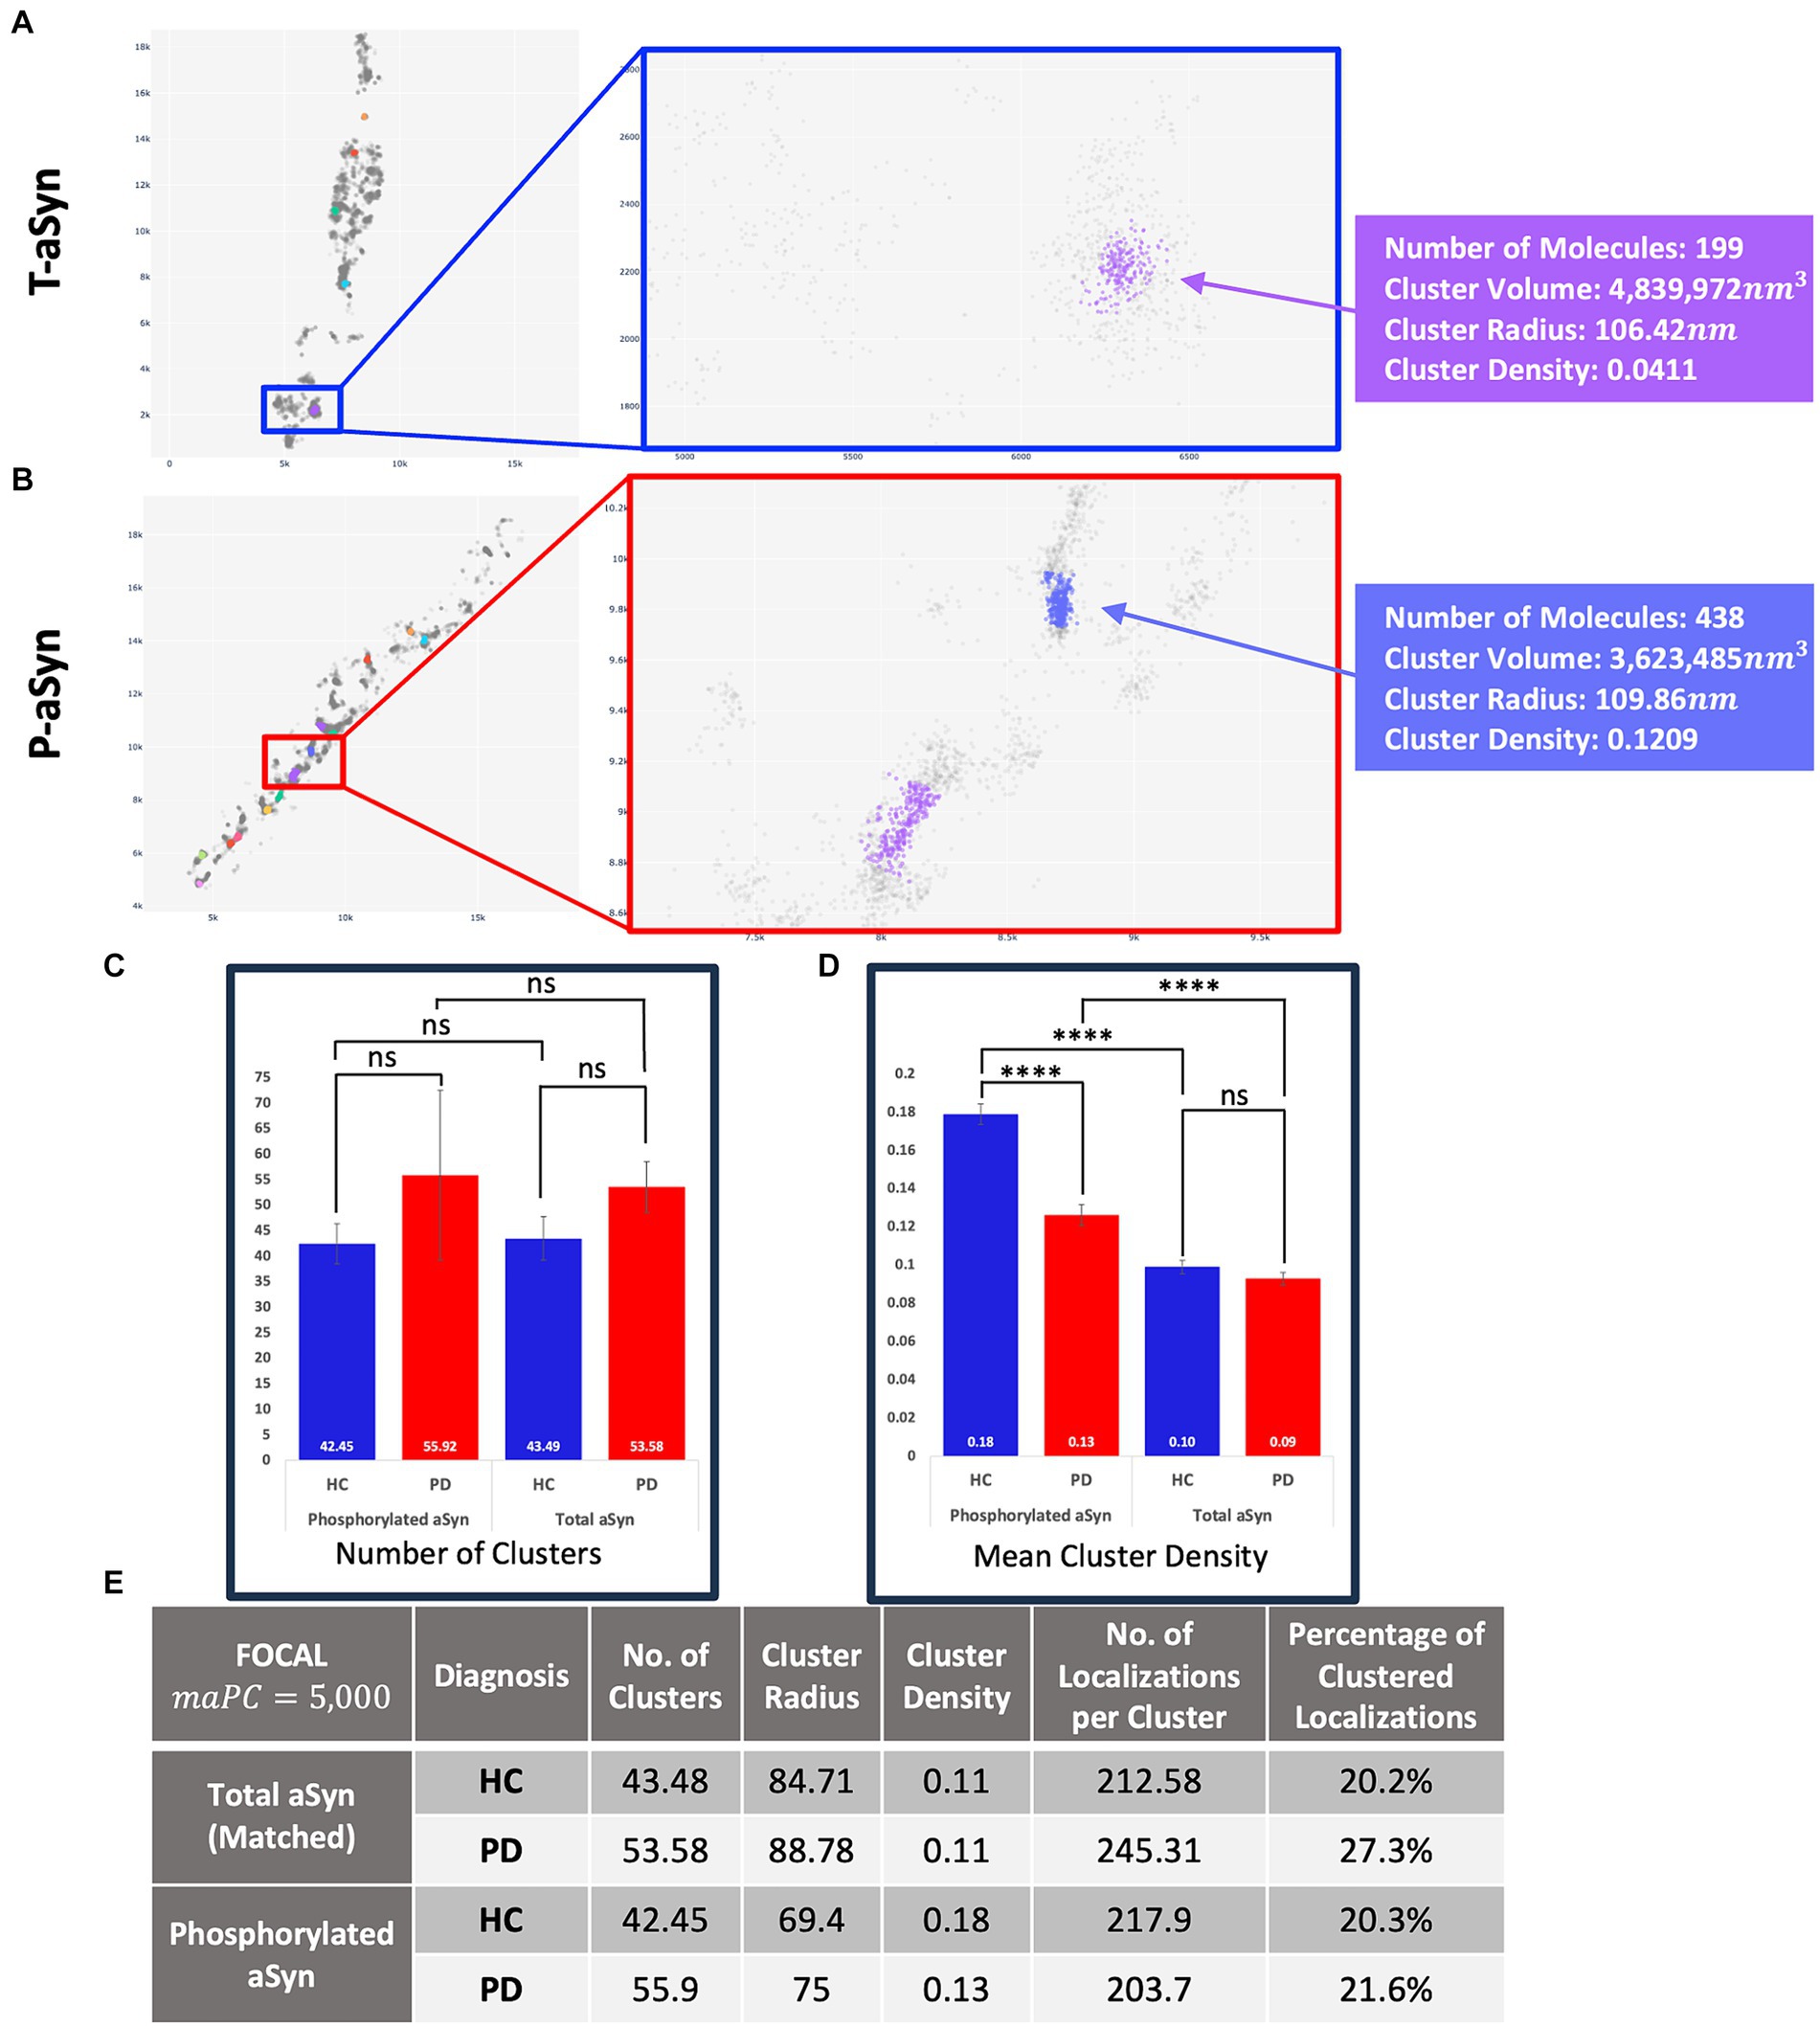
Figure 5. t-aSyn aggregates are larger and less dense compared to p-aSyn aggregates in both PD patients and HC subjects. Comparison of t-aSyn and p-aSyn clustering in PD patients and HC subjects using FOCALPC2. (A,B) Visualizations of clusters of t-aSyn (A) and p-aSyn in a PD patient (B). (C–E) t-aSyn aggregates are larger and less dense compared to p-aSyn aggregates for both PD patients and HC subjects. ****p < 0.0001.
We then compared and characterized the t-aSyn-containing clusters detected. Similar to the analysis of p-aSyn, PD patients contained more t-aSyn aggregates per image (53.58 ± 4.97) than HC subjects (43.49 ± 4.27; Figure 5). Cluster radii were significantly smaller in HC subjects (84.71 ± 2.19) than in PD patients (88.78 ± 2.42) and their densities were not significantly different between HC subjects (0.11 ±0.0099) and PD patients (0.11 ±0.008). However, t-aSyn clusters were slightly sparser than p-aSyn (Figures 5C,E). This might reflect differences between pathological p-aSyn versus physiological t-aSyn. Most probably, the t-aSyn antibody also recognizes the p-aSyn in the synapse, which is organized in aggregates. The findings thus provide additional support that dSTORM combined with immuno-labeling using different anti-aSyn antibodies allows the detection of both the physiological and pathological form of aSyn.
In this study, we introduced an innovative integration of SRM with an advanced analysis platform, enhancing both detection sensitivity and the information extracted from images. This integrated approach facilitated comprehensive profiling of nanoscale aSyn aggregates in skin biopsies obtained from both PD patients and HC subjects. Our novel strategy allowed for aggregate characterization based on various quantitative criteria, such as aggregate size, distribution, and density—information that was not previously available using convectional microscopy, or SAA. Our findings suggest that p-aSyn, representing the pathological form of aSyn, is organized into dense aggregates, sized approximately 75 nm, and that these aggregates are more enriched in PD patients than in HC subjects.
Today, by the time PD is clinically diagnosed, an irreversible loss of approximately 70–80% of dopaminergic neurons at the substantia nigra has already occurred (Sveinbjornsdottir, 2016), leaving little room for intervention of the basic pathological process responsible for the neurodegenerative process. PD diagnosis based on quantitative parameters thus represents an unmet need that offers a route to revolutionize the way PD and other synucleinopathies are diagnosed and treated (Hughes et al., 2001, 2002; Tolosa et al., 2006). aSyn-SAA can differentiate between different HC and PD patients and between different synucleinopathies, such as PD and multiple systems atrophy (MSA) (Manne et al., 2020; Shahnawaz et al., 2020; Kuzkina et al., 2021; Mammana et al., 2021; Concha-Marambio et al., 2023; Iranzo et al., 2023; Donadio et al., 2024; Gibbons et al., 2024; Huang et al., 2024). In a new approach used to define PD and dementia with LBs based on a biological definition, it was suggested that aSyn-SAA of CSF can provide a reliable measure of the status of pathological processes associated with aSyn (Simuni et al., 2024). Still, SAA does not provide information on different aSyn species, their distribution, density, and size, and at the moment, it does not provide a quantitative measure that correlates with disease progression. Hence, the application of SRM and advanced analysis to PD diagnosis provides these missing quantitative parameters, namely, aggregate size, distribution, density, and shape. This can also be used in the future to track disease progression quantitatively. Furthermore, SRM analysis of a skin biopsy can provide information about the patient’s molecular status in a much less invasive manner, as compared to a lumbar puncture for collecting CSF.
Previous studies suggested that detecting aSyn aggregates in skin biopsies holds good promise for PD diagnosis (Al-Qassabi et al., 2020; Mammana et al., 2021; Iranzo et al., 2023; Waqar et al., 2023; Donadio et al., 2024; Gibbons et al., 2024), yet thus far it has not met the requirements needed to become clinically relevant. In most cases, the immunoassays that are employed overlook the size, density, and composition of aSyn aggregates. We hypothesized that these parameters are essential for understanding synuclein pathology in PD and should be examined as well. The application of SRM methods for addressing various diseases (Suleiman et al., 2013), some associated with protein aggregation, provides new mechanistic information that allows both insight into disease state and progression (Zhang et al., 2015; Wegrzynowicz et al., 2019; Padmanabhan et al., 2021; Johansson et al., 2023) and into the mechanism of drug action (Wegrzynowicz et al., 2019; Sela et al., 2023). For example, using SRM to study the aggregate species secreted from cells, it was found that seeding of externally applied fibrils resulted in the increased secretion of nanoscopic aSyn and Aβ aggregates with a mean diameter of 35 nm (Sang et al., 2003). As conventional confocal microscopy cannot differentiate between the aggregates sized below 200 nm (i.e., any aggregate between 10 and 200 nm will be seen as a 200 nm aggregate), SRM allowed the identification of these sub-diffraction aggregates for the first time. Hence, the use of SRM allows the differentiation of these small aggregates and the ability to define what aggregate species are secreted. Similarly, it was shown that small (20–300 nm), rather than large (>500 nm) aSyn aggregate levels correlated with disease progression in a mouse model of PD (Wegrzynowicz et al., 2019), again emphasizing the strength of SRM for examining sub-diffraction aggregates. The current study provides new information on the arrangement of aSyn aggregates in the innervation of PD patients’ skin.
Using a tailor-made in-house platform termed ‘dSTORM Analyser’ that is available to the scientific community, we created a novel platform that revealed unique fingerprints of aSyn aggregates. The analysis detected a larger number of clusters, clusters with larger radii, sparser clusters, and clusters containing a smaller number of localizations in PD patients, relative to what was seen with HC subjects. These findings provide complementary information to SAA results by providing new characteristics of the aggregates. No correlation was detected between the number of clusters and the participants’ ages. However, a larger patient cohort, with a smaller variability in participants’ ages, and longitudinal tracking of the changes in clusters properties along the progression of the disease will be beneficial in future studies. (Kuzkina et al., 2021, 2023; Wang et al., 2021). The study also shows that p-aSyn in PD patients is organized into aggregates with an average radius of 75 nm and that the ratio of neuronal staining to aSyn expression is higher in HC than in PD. This suggests that the existence of more p-aSyn correlates with reduced nerve fibers in PD patients. Hence, our study offers new quantitative biomarkers for future comparison of various aSyn aggregates (Young et al., 2019; Doppler, 2021).
Most studies that utilize immunoassays for p-aSyn detection reported that HC subjects did not contain p-aSyn. Yet, our results clearly showed p-aSyn molecules in skin biopsies from HC subjects. Although our efforts relied on regular antibody staining, we were able to detect every single p-aSyn molecule, thus providing evidence that HC also contains p-aSyn molecules, unlike what was reported in other studies. Still, it was previously suggested that diffuse or granular p-aSyn staining is found in HC (Al-Qassabi et al., 2020; Waqar et al., 2023). This could explain the staining that we detected in HC subjects, given how dSTORM is more sensitive and detects every molecule, demonstrating that p-aSyn molecules are found in HC subjects. It is also possible that the p-aSyn antibody is less specific than advertised, and it also recognizes some of the t-aSyn molecules. Yet, the detailed dSTORM image analysis revealed that in PD patients, p-aSyn molecules are organized into aggregate-like structures, with this being less frequent in HC. This correlates with previous publications that suggested that discrete p-aSyn aggregates were found in PD patient biopsies (Al-Qassabi et al., 2020; Waqar et al., 2023).
An unmet need in treating PD is the availability of a sensitive, quantitative, and specific biomarker that could serve to report on the progression of pathological processes in the early stages of the disease. Such a sensitive and reliable biomarker will allow subjects at risk to receive disease-modifying treatment at the prodromal stages and potentially prevent the clinical syndrome of PD altogether. At present, many novel technologies are being tested in advanced clinical stages, aiming to intervene in the basic pathological process responsible for PD. Such technologies include those leading to the inhibition of aSyn aggregation, reduction of aSyn expression, reduction in leucine-rich repeat kinase 2 (LRRK2) kinase activity, enhancement of glucocerebrosidase activity, and stem cell transplantation (Chopade et al., 2023; McFarthing et al., 2023). Ideally, subjects at risk, such as carriers of specific mutations in the glucosylceramidase beta 1 (GBA1) or LRRK2 genes or subjects with prodromal symptoms such as rapid eye movement (REM) sleep without atonia or decreased sense of smell, could undergo a simple procedure to extract a skin biopsy, undergo full SRM aggregate analysis, and potentially be treated (if positively diagnosed with the pathological biomarker for PD) before irreversible neural damage has occurred.
To conclude, using rigorous detection of dSTORM together with our advanced ‘dSTORM Analyser’ platform, we were able to characterize aSyn aggregate traits in skin biopsies for the first time. In future research, correlating the molecular fingerprints identified here with patient clinical status and disease progression may provide a new molecular toolbox that can be used to (a) track disease progression at the pathological level objectively, (b) track the efficacy of disease-modifying treatment, and (c) set a new threshold for PD patients with defined aSyn aggregates levels for recruitment to clinical trials, thus reducing patient population heterogeneity. Furthermore, the implementation of our unique method will advance our understanding of the aSyn aggregation process and may define peripheral aSyn as a reliable biomarker for following PD pathology and disease progression.
All datasets will be available upon request to the email b2ZpcnNhZGVAbWFpbC50YXUuYWMuaWw=.
The studies involving humans were approved by Ethics Committees of Tel-Aviv Sourasky Medical Center, Meir Medical Center and Sheba Medical Center (8492-21, 0257-08 and 0302-23). The studies were conducted in accordance with the local legislation and institutional requirements. The participants provided their written informed consent to participate in this study.
OS: Conceptualization, Formal analysis, Investigation, Methodology, Software, Writing – original draft, Writing – review & editing. DF: Formal analysis, Investigation, Methodology, Writing – review & editing. NB-B: Investigation, Methodology, Writing – review & editing. SH: Investigation, Methodology, Writing – review & editing. IG: Supervision, Writing – review & editing, Writing – original draft. DB-O: Writing – review & editing, Conceptualization. SFS: Methodology, Writing – review & editing. AM: Writing – review & editing, Resources. AT: Writing – review & editing, Resources. AG: Resources, Writing – review & editing. MK: Resources, Writing – review & editing. MG: Writing – review & editing, Resources. SA: Resources, Writing – review & editing. CS: Writing – review & editing. MSR: Writing – review & editing. SS: Statistics expertise, Writing – review & editing. KD: Methodology, Writing – review & editing. MS: Writing – review & editing, Methodology. NG: Writing – review & editing, Resources, Supervision. NL: Writing – review & editing, Resources, Supervision. RA: Writing – review & editing, Resources, Supervision. SH-B: Writing – review & editing, Resources, Supervision. UA: Writing – original draft, Writing – review & editing, Conceptualization, Methodology.
The author(s) declare that financial support was received for the research, authorship, and/or publication of this article. This research was supported by the Ministry of Innovation, Science & Technology, Israel (1001576154), TEVA Pharmaceutical Industries, The Aufzien Family Center for the Prevention and Treatment of Parkinson’s Disease at Tel Aviv University (UA), and the Michael J. Fox Foundation (MJFF-022407) (UA, SH-B, NG, RA, and NL).
We would like to thank Michal Redmard-Blutner and Nada Rayan for their involvement in the initial implementation of FOCAL algorithm.
The authors declare that the research was conducted in the absence of any commercial or financial relationships that could be construed as a potential conflict of interest.
The author(s) declared that they were an editorial board member of Frontiers, at the time of submission. This had no impact on the peer review process and the final decision.
All claims expressed in this article are solely those of the authors and do not necessarily represent those of their affiliated organizations, or those of the publisher, the editors and the reviewers. Any product that may be evaluated in this article, or claim that may be made by its manufacturer, is not guaranteed or endorsed by the publisher.
The Supplementary material for this article can be found online at: https://www.frontiersin.org/articles/10.3389/fnmol.2024.1431549/full#supplementary-material
Adler, C. H., Dugger, B. N., Hentz, J. G., Hinni, M. L., Lott, D. G., Driver-Dunckley, E., et al. (2016). Peripheral synucleinopathy in early Parkinson’s disease: submandibular gland needle biopsy findings. Mov. Disord. 31, 250–256. doi: 10.1002/MDS.26476
Almikhlafi, M. A. (2024). A review of the gastrointestinal, olfactory, and skin abnormalities in patients with Parkinson’s disease. Neurosciences (Riyadh) 29, 4–9. doi: 10.17712/nsj.2024.1.20230062
Al-Qassabi, A., Tsao, T. S., Racolta, A., Kremer, T., Cañamero, M., Belousov, A., et al. (2020). Immunohistochemical detection of synuclein pathology in skin in idiopathic rapid eye movement sleep behavior disorder and parkinsonism. Mov. Disord. 36, 895–904. doi: 10.1002/MDS.28399
Antelmi, E., Donadio, V., Incensi, A., Plazzi, G., and Liguori, R. (2017). Skin nerve phosphorylated a-synuclein deposits in idiopathic REM sleep behavior disorder. Neurology 88, 2128–2131. doi: 10.1212/WNL.0000000000003989
Beach, T. G., Serrano, G. E., Kremer, T., Canamero, M., Dziadek, S., Sade, H., et al. (2018). Immunohistochemical method and histopathology judging for the systemic synuclein sampling study (S4). J. Neuropathol. Exp. Neurol. 77, 793–802. doi: 10.1093/JNEN/NLY056
Berg, D., Adler, C. H., Bloem, B. R., Chan, P., Gasser, T., Goetz, C. G., et al. (2018). Movement disorder society criteria for clinically established early Parkinson’s disease. Mov. Disord. 33, 1643–1646. doi: 10.1002/MDS.27431
Brás, I. C., and Outeiro, T. F. (2021). Alpha-synuclein: mechanisms of release and pathology progression in synucleinopathies. Cells 10, 1–19. doi: 10.3390/cells10020375
Burré, J., Sharma, M., and Südhof, T. C. (2014). α-Synuclein assembles into higher-order multimers upon membrane binding to promote SNARE complex formation. Proc. Natl. Acad. Sci. U. S. A. 111, E4274–E4283. doi: 10.1073/pnas.1416598111
Chen, S. W., Barritt, J. D., Cascella, R., Bigi, A., Cecchi, C., Banchelli, M., et al. (2024). Structure−toxicity relationship in intermediate fibrils from α-Synuclein condensates. Am. Chem. Soc. 146, 10537–10549. doi: 10.1021/jacs.3c14703
Chopade, P., Chopade, N., Zhao, Z., Mitragotri, S., Liao, R., and Chandran Suja, V. (2023). Alzheimer’s and Parkinson’s disease therapies in the clinic. Bioeng. Transl. Med. 8:e10367. doi: 10.1002/BTM2.10367
Comi, C., Magistrelli, L., Oggioni, G. D., Carecchio, M., Fleetwood, T., Cantello, R., et al. (2014). Peripheral nervous system involvement in Parkinson’s disease: evidence and controversies. Parkinsonism Relat. Disord. 20, 1329–1334. doi: 10.1016/J.PARKRELDIS.2014.10.010
Concha-Marambio, L., Pritzkow, S., Shahnawaz, M., Farris, C. M., and Soto, C. (2023). Seed amplification assay for the detection of pathologic alpha-synuclein aggregates in cerebrospinal fluid. Nat. Protoc. 18, 1179–1196. doi: 10.1038/s41596-022-00787-3
Conway, K. A., Rochet, J. C., Ding, T. T., Harper, J. D., Williamson, R. E., and Lansbury, P. T. (2000). Accelerated oligomerization by Parkinson’s disease linked α-synuclein mutants. Ann. N. Y. Acad. Sci. 920, 42–45. doi: 10.1111/J.1749-6632.2000.TB06903.X
Dankovich, T. M., and Rizzoli, S. O. (2021). Challenges facing quantitative large-scale optical super-resolution, and some simple solutions. iScience 24:102134. doi: 10.1016/J.ISCI.2021.102134
Donadio, V., Doppler, K., Incensi, A., Kuzkina, A., Janzen, A., Mayer, G., et al. (2019). Abnormal α-synuclein deposits in skin nerves: intra-and inter-laboratory reproducibility. Eur. J. Neurol. 26, 1245–1251. doi: 10.1111/ENE.13939
Donadio, V., Fadda, L., Incensi, A., Furia, A., Parisini, S., Colaci, F., et al. (2024). Skin nerve phosphorylated α-synuclein in the elderly. J. Neuropathol. Exp. Neurol. 83, 245–250. doi: 10.1093/JNEN/NLAE015
Donadio, V., Incensi, A., Leta, V., Giannoccaro, M. P., Scaglione, C., Martinelli, P., et al. (2014). Skin nerve a-synuclein deposits A biomarker for idiopathic Parkinson disease. Neurology 82, 1362–1369. doi: 10.1212/WNL.0000000000000316
Doppler, K. (2021). Detection of dermal alpha-Synuclein deposits as a biomarker for Parkinson’s disease. J. Parkinsons Dis. 11, 937–947. doi: 10.3233/JPD-202489
Doppler, K., Ebert, S., Üçeyler, N., Trenkwalder, C., Ebentheuer, J., Volkmann, J., et al. (2014). Cutaneous neuropathy in Parkinson’s disease: a window into brain pathology. Acta Neuropathol. 128, 99–109. doi: 10.1007/S00401-014-1284-0
Doppler, K., Jentschke, H. M., Schulmeyer, L., Vadasz, D., Janzen, A., Luster, M., et al. (2017). Dermal phospho-alpha-synuclein deposits confirm REM sleep behaviour disorder as prodromal Parkinson’s disease. Acta Neuropathol. 133, 535–545. doi: 10.1007/s00401-017-1684-z
Ester, M., Kriegel, H.-P., Sander, J., and Xu, X. (1996). A density-based algorithm for discovering clusters in large spatial databases with noise. Available at: www.aaai.org
Giannoccaro, M. P., Donadio, V., Giannini, G., Devigili, G., Rizzo, G., Incensi, A., et al. (2020). Comparison of 123I-MIBG scintigraphy and phosphorylated α-synuclein skin deposits in synucleinopathies. Parkinsonism Relat. Disord. 81, 48–53. doi: 10.1016/J.PARKRELDIS.2020.10.016
Gibbons, C., Donadio, V., Sommer, C., Liguori, R., Lauria Pinter, G., Lombardi, R., et al. (2021). Reader response: in vivo distribution of α-Synuclein in multiple tissues and biofluids in Parkinson disease. Neurology 96, 964–965. doi: 10.1212/WNL.0000000000011941
Gibbons, C. H., Garcia, J., Wang, N., Shih, L. C., and Freeman, R. (2016). The diagnostic discrimination of cutaneous α-synuclein deposition in Parkinson disease. Neurology 87, 505–512. doi: 10.1212/WNL.0000000000002919
Gibbons, C. H., Levine, T., Adler, C., Bellaire, B., Wang, N., Stohl, J., et al. (2024). Skin biopsy detection of phosphorylated α-synuclein in patients with synucleinopathies. JAMA 331, 1298–1306. doi: 10.1001/JAMA.2024.0792
Goldberg, M. S., and Lansbury, P. T. (2000). Is there a cause-and-effect relationship between α-synuclein fibrillization and Parkinson’s disease? Nat. Cell Biol. 2.
Goldman, J. G., Andrews, H., Amara, A., Naito, A., Alcalay, R. N., Shaw, L. M., et al. (2018). Cerebrospinal fluid, plasma, and saliva in the BioFIND study: relationships among biomarkers and Parkinson’s disease features. Mov. Disord. 33, 282–288. doi: 10.1002/mds.27232
Huang, B., Bates, M., and Zhuang, X. (2009). Super-resolution fluorescence microscopy. Annu. Rev. Biochem. 78, 993–1016. doi: 10.1146/annurev.biochem.77.061906.092014
Huang, J., Yuan, X., Chen, L., Hu, B., Wang, H., Wang, Y., et al. (2024). Pathological α-synuclein detected by real-time quaking-induced conversion in synucleinopathies. Exp. Gerontol. 187:112366. doi: 10.1016/J.EXGER.2024.112366
Hughes, A. J., Daniel, S. E., Ben-Shlomo, Y., Lees, A. J., and Weston, R. L. (2002). The accuracy of diagnosis of parkinsonian syndromes in a specialist movement disorder service. Brain 125, 861–870. doi: 10.1093/brain/awf080
Hughes, A. J., Daniel, S. E., and Lees, A. J. (2001). Improved accuracy of clinical diagnosis of Lewy body Parkinson’s disease. Neurology 57, 1497–1499. doi: 10.1212/WNL.57.8.1497
Iranzo, A., Mammana, A., Muñoz-Lopetegi, A., Dellavalle, S., Mayà, G., Rossi, M., et al. (2023). Misfolded α-Synuclein assessment in the skin and CSF by RT-QuIC in isolated REM sleep behavior disorder. Neurology 100, E1944–E1954. doi: 10.1212/WNL.0000000000207147
Johansson, B., Oasa, S., Muntsant Soria, A., Tiiman, A., Söderberg, L., Amandius, E., et al. (2023). The interwoven fibril-like structure of amyloid-beta plaques in mouse brain tissue visualized using super-resolution STED microscopy. Cell Biosci. 13, 1–9. doi: 10.1186/S13578-023-01086-4/FIGURES/3
Kuzkina, A., Bargar, C., Schmitt, D., Rößle, J., Wang, W., Schubert, A. L., et al. (2021). Diagnostic value of skin RT-QuIC in Parkinson’s disease: a two-laboratory study. NPJ Parkinsons Dis. 7:99. doi: 10.1038/s41531-021-00242-2
Kuzkina, A., Rößle, J., Seger, A., Panzer, C., Kohl, A., Maltese, V., et al. (2023). Combining skin and olfactory α-synuclein seed amplification assays (SAA)—towards biomarker-driven phenotyping in synucleinopathies. NPJ Parkinsons Dis. 9:79. doi: 10.1038/s41531-023-00519-8
Lashuel, H. A., Overk, C. R., Oueslati, A., and Masliah, E. (2013). The many faces of α-synuclein: from structure and toxicity to therapeutic target. Nat. Rev. Neurosci. 14, 38–48. doi: 10.1038/nrn3406
Lebouvier, T., Chaumette, T., Damier, P., Coron, E., Touchefeu, Y., Vrignaud, S., et al. (2008). Pathological lesions in colonic biopsies during Parkinson’s disease. Gut 57, 1741–1743. doi: 10.1136/GUT.2008.162503
Mammana, A., Baiardi, S., Quadalti, C., Rossi, M., Donadio, V., Capellari, S., et al. (2021). RT-QuIC detection of pathological α-Synuclein in skin punches of patients with Lewy body disease. Mov. Disord. 36, 2173–2177. doi: 10.1002/MDS.28651
Manne, S., Kondru, N., Jin, H., Serrano, G. E., Anantharam, V., Kanthasamy, A., et al. (2020). Blinded RT-QuIC analysis of α-Synuclein biomarker in skin tissue from Parkinson’s disease patients. Mov. Disord. 35, 2230–2239. doi: 10.1002/MDS.28242
Marogianni, C., Sokratous, M., Dardiotis, E., Hadjigeorgiou, G. M., Bogdanos, D., and Xiromerisiou, G. (2020). Neurodegeneration and inflammation—an interesting interplay in Parkinson’s disease. Int. J. Mol. Sci. 21:8421. doi: 10.3390/IJMS21228421
Massano, J., and Bhatia, K. P. (2012). Clinical approach to Parkinson’s disease: features, diagnosis, and principles of management. Cold Spring Harb. Perspect. Med. 2. doi: 10.1101/CSHPERSPECT.A008870
Mazouchi, A., and Milstein, J. N. (2016). Fast optimized cluster algorithm for localizations (FOCAL): a spatial cluster analysis for super-resolved microscopy. Bioinformatics 32, 747–754. doi: 10.1093/bioinformatics/btv630
McFarthing, K., Buff, S., Rafaloff, G., Fiske, B., Mursaleen, L., Fuest, R., et al. (2023). Parkinson’s disease drug therapies in the clinical trial pipeline: 2023 update. J. Parkinsons Dis. 13, 427–439. doi: 10.3233/JPD-239901
Mcinnes, L., Healy, J., and Astels, S. (2016). The hdbscan clustering library. Available at: https://hdbscan.readthedocs.io/en/latest/ (Accessed April 21, 2024).
McInnes, L., Healy, J., and Astels, S. (2017). Hdbscan: hierarchical density based clustering. J. Open Source Softw. 2:205. doi: 10.21105/joss.00205
Mollenhauer, B., Trautmann, E., Taylor, P., Manninger, P., Sixel-Döring, F., Ebentheuer, J., et al. (2013). Total CSF α-synuclein is lower in de novo Parkinson patients than in healthy subjects. Neurosci. Lett. 532, 44–48. doi: 10.1016/J.NEULET.2012.11.004
Mu, L., Sobotka, S., Chen, J., Su, H., Sanders, I., Adler, C. H., et al. (2013). Alpha-synuclein pathology and axonal degeneration of the peripheral motor nerves innervating pharyngeal muscles in Parkinson disease. J. Neuropathol. Exp. Neurol. 72, 119–129. doi: 10.1097/NEN.0B013E3182801CDE
Nino, D., Djayakarsana, D., and Milstein, J. N. (2020). FOCAL3D: a 3-dimensional clustering package for single-molecule localization microscopy. PLoS Comput. Biol. 16:e1008479. doi: 10.1371/journal.pcbi.1008479
Nuber, S., Zhang, X., McCaffery, T. D., Moors, T. E., Adom, M. A., Hahn, W. N., et al. (2024). Generation of G51D and 3D mice reveals decreased α-synuclein tetramer-monomer ratios promote Parkinson’s disease phenotypes. NPJ Parkinsons Dis. 10, 1–12. doi: 10.1038/s41531-024-00662-w
Okochi, M., Walter, J., Koyama, A., Nakajo, S., Baba, M., Iwatsubo, T., et al. (2000). Constitutive phosphorylation of the Parkinson’s disease associated α-synuclein. J. Biol. Chem. 275, 390–397. doi: 10.1074/jbc.275.1.390
Padmanabhan, P., Kneynsberg, A., and Götz, J. (2021). Super-resolution microscopy: a closer look at synaptic dysfunction in Alzheimer disease. Nat. Rev. Neurosci. 22, 723–740. doi: 10.1038/s41583-021-00531-y
Paul, D. A., Qureshi, A. R. M., and Rana, A. Q. (2020). Peripheral neuropathy in Parkinson’s disease. Neurol. Sci. 41, 2691–2701. doi: 10.1007/s10072-020-04407-4
Pedregosa, F., Michel, V., Grisel, O., Blondel, M., Prettenhofer, P., Weiss, R., et al. (2011a). Scikit-learn: machine learning in Python. J. Mach. Learn. Res. 12, 2825–2830.
Poewe, W., Seppi, K., Tanner, C. M., Halliday, G. M., Brundin, P., Volkmann, J., et al. (2017). Parkinson disease. Nat. Rev. Dis. Primers 3, 1–21. doi: 10.1038/NRDP.2017.13
Sade, O., Boneberg, R., Weiss, Y., Beldjilali-Labro, M., Leichtmann-Bardoogo, Y., Talpir, I., et al. (2023). Super-resolution-Chip: an in-vitro platform that enables super-resolution microscopy of co-cultures and 3D systems. Biomed. Opt. Express 14, 5223–5237, 5223–5237. doi: 10.1364/BOE.498038
Sahl, S. J., and Hell, S. W. (2019). High-resolution 3D light microscopy with STED and RESOLFT. High Resol. Imaging Microscopy Ophthalmol., 3–32. doi: 10.1007/978-3-030-16638-0_1
Sang, J. C., Hidari, E., Meisl, G., Ranasinghe, R. T., Spillantini, M. G., and Klenerman, D. (2003). Super-resolution imaging reveals alpha-synuclein seeded aggregation in SH-SY5Y cells
Santos, J., Pallarès, I., and Moro, F. (2023). The structural architecture of an α-synuclein toxic oligomer. bio Rxiv. doi: 10.1101/2023.02.10.527650
Sauer, M., and Heilemann, M. (2017). Single-molecule localization microscopy in eukaryotes. Chem. Rev. 117, 7478–7509. doi: 10.1021/acs.chemrev.6b00667
Sela, M., Poley, M., Mora-Raimundo, P., Kagan, S., Avital, A., Kaduri, M., et al. (2023). Brain-targeted liposomes loaded with monoclonal antibodies reduce alpha-Synuclein aggregation and improve behavioral symptoms in Parkinson’s disease. Adv. Mater. 35:e2304654. doi: 10.1002/ADMA.202304654
Shahnawaz, M., Mukherjee, A., Pritzkow, S., Mendez, N., Rabadia, P., Liu, X., et al. (2020). Discriminating α-synuclein strains in Parkinson’s disease and multiple system atrophy. Nature 578, 273–277. doi: 10.1038/s41586-020-1984-7
Shannon, K. M., Keshavarzian, A., Dodiya, H. B., Jakate, S., and Kordower, J. H. (2012). Is alpha-synuclein in the colon a biomarker for premotor Parkinson’s disease? Evidence from 3 cases. Mov. Disord. 27, 716–719. doi: 10.1002/mds.25020
Sharabi, Y., Vatine, G. D., and Ashkenazi, A. (2021). Parkinson’s disease outside the brain: targeting the autonomic nervous system. Lancet Neurol. 20, 868–876. doi: 10.1016/S1474-4422(21)00219-2
Sigrist, S. J., and Sabatini, B. L. (2012). Optical super-resolution microscopy in neurobiology. Curr. Opin. Neurobiol. 22, 86–93. doi: 10.1016/J.CONB.2011.10.014
Simuni, T., Chahine, L. M., Poston, K., Brumm, M., Buracchio, T., Campbell, M., et al. (2024). A biological definition of neuronal α-synuclein disease: towards an integrated staging system for research. Lancet Neurol. 23, 178–190. doi: 10.1016/S1474-4422(23)00405-2
Spillantini, M. G., Schmidt, M. L., Lee, V. M. Y., Trojanowski, J. Q., Jakes, R., and Goedert, M. (1997). α-Synuclein in Lewy bodies. Nature 388, 839–840. doi: 10.1038/42166
SRX Full System Manual|SRX Manual (2022). Available at: https://guide.vutara.bruker.com/m/11201 (Accessed August 12, 2023).
Stefanis, L. (2012). α-Synuclein in Parkinson’s disease. Cold Spring Harb. Perspect. Med. 2. doi: 10.1101/cshperspect.a009399
Suleiman, H., Zhang, L., Roth, R., Heuser, J. E., Miner, J. H., Shaw, A. S., et al. (2013). Nanoscale protein architecture of the kidney glomerular basement membrane. eLife 2013. doi: 10.7554/ELIFE.01149.001
Sveinbjornsdottir, S. (2016). The clinical symptoms of Parkinson’s disease. J. Neurochem. 139, 318–324. doi: 10.1111/JNC.13691
Tolosa, E., Wenning, G., and Poewe, W. (2006). The diagnosis of Parkinson’s disease. Lancet Neurol. 5, 75–86. doi: 10.1016/S1474-4422(05)70285-4
Tsukita, K., Sakamaki-Tsukita, H., Tanaka, K., Suenaga, T., and Takahashi, R. (2019). Value of in vivo α-synuclein deposits in Parkinson’s disease: a systematic review and meta-analysis. Mov. Disord. 34, 1452–1463. doi: 10.1002/MDS.27794
Tysnes, O. B., and Storstein, A. (2017). Epidemiology of Parkinson’s disease. J. Neural Transm. 124, 901–905. doi: 10.1007/s00702-017-1686-y
Vacchi, E., Senese, C., Chiaro, G., Disanto, G., Pinton, S., Morandi, S., et al. (2021). Alpha-synuclein oligomers and small nerve fiber pathology in skin are potential biomarkers of Parkinson’s disease. NPJ Parkinson’s Disease 7:119. doi: 10.1038/s41531-021-00262-y
Videlock, E. J., Xing, T., Yehya, A. H. S., and Travagli, R. A. (2023). Experimental models of gut-first Parkinson’s disease: a systematic review. Neurogastroenterol. Motil. 35:e14604. doi: 10.1111/NMO.14604
Vivacqua, G., Suppa, A., Mancinelli, R., Belvisi, D., Fabbrini, A., Costanzo, M., et al. (2019). Salivary alpha-synuclein in the diagnosis of Parkinson’s disease and progressive Supranuclear palsy. Parkinsonism Relat. Disord. 63, 143–148. doi: 10.1016/j.parkreldis.2019.02.014
Wang, Z., Becker, K., Donadio, V., Siedlak, S., Yuan, J., Rezaee, M., et al. (2021). Skin α-Synuclein aggregation seeding activity as a novel biomarker for Parkinson disease. JAMA Neurol. 78, 30–11. doi: 10.1001/jamaneurol.2020.3311
Wang, N., Gibbons, C. H., Lafo, J., and Freeman, B. S. R. (2013). α-Synuclein in cutaneous autonomic nerves. Neurology 81, 1604–1610. doi: 10.1212/WNL.0b013e3182a9f449
Waqar, S., Khan, H., Zulfiqar, S. K., and Ahmad, A. (2023). Skin biopsy as a diagnostic tool for Synucleinopathies. Cureus 15:e47179. doi: 10.7759/cureus.47179
Wegrzynowicz, M., Bar-On, D., Calo, L., Anichtchik, O., Iovino, M., Xia, J., et al. (2019). Depopulation of dense α-synuclein aggregates is associated with rescue of dopamine neuron dysfunction and death in a new Parkinson’s disease model. Acta Neuropathol. 138, 575–595. doi: 10.1007/S00401-019-02023-X
Young, Kim Jee, Illigens Ben, MW, McCormick, Michael P., Wang, Ningshan, and Gibbons Christopher, H. (2019). Alpha-synuclein in skin nerve fibers as a biomarker for alpha-synucleinopathies. Available at: www.thejcn.com
Keywords: alpha-synuclein aggregates, biomarker, density-based spatial clustering of applications with noise (DBSCAN), direct stochastic optical reconstruction microscopy (dSTORM), early diagnosis, fast optimized cluster algorithm for localizations (FOCAL), Parkinson’s disease, super-resolution microscopy
Citation: Sade O, Fischel D, Barak-Broner N, Halevi S, Gottfried I, Bar-On D, Sachs S, Mirelman A, Thaler A, Gour A, Kestenbaum M, Gana Weisz M, Anis S, Soto C, Roitman MS, Shahar S, Doppler K, Sauer M, Giladi N, Lev N, Alcalay RN, Hassin-Baer S and Ashery U (2024) A novel super-resolution microscopy platform for cutaneous alpha-synuclein detection in Parkinson’s disease. Front. Mol. Neurosci. 17:1431549. doi: 10.3389/fnmol.2024.1431549
Edited by:
Yihong Ye, National Institutes of Health (NIH), United StatesReviewed by:
Zhuyu Peng, Massachusetts Institute of Technology, United StatesCopyright © 2024 Sade, Fischel, Barak-Broner, Halevi, Gottfried, Bar-On, Sachs, Mirelman, Thaler, Gour, Kestenbaum, Gana Weisz, Anis, Soto, Roitman, Shahar, Doppler, Sauer, Giladi, Lev, Alcalay, Hassin-Baer, and Ashery. This is an open-access article distributed under the terms of the Creative Commons Attribution License (CC BY). The use, distribution or reproduction in other forums is permitted, provided the original author(s) and the copyright owner(s) are credited and that the original publication in this journal is cited, in accordance with accepted academic practice. No use, distribution or reproduction is permitted which does not comply with these terms.
*Correspondence: Uri Ashery, dXJpYXNoZXJ5QGdtYWlsLmNvbQ==
Disclaimer: All claims expressed in this article are solely those of the authors and do not necessarily represent those of their affiliated organizations, or those of the publisher, the editors and the reviewers. Any product that may be evaluated in this article or claim that may be made by its manufacturer is not guaranteed or endorsed by the publisher.
Research integrity at Frontiers
Learn more about the work of our research integrity team to safeguard the quality of each article we publish.