 Jeong-Min Shim
 Seo-Eun Cho
 Chang-Ki Kang
 Seung-Gul Kang
95% of researchers rate our articles as excellent or good
Learn more about the work of our research integrity team to safeguard the quality of each article we publish.
Find out more
ORIGINAL RESEARCH article
Front. Mol. Neurosci. , 10 August 2023
Sec. Brain Disease Mechanisms
Volume 16 - 2023 | https://doi.org/10.3389/fnmol.2023.1214738
This article is part of the Research Topic Myelin in White Matter Function and Related Diseases View all 7 articles
Introduction: Abnormalities in myelin are believed to be one of the important causes of major depressive disorder, and it is becoming important to more accurately quantify myelin in in vivo magnetic resonance imaging of major depressive disorder patients. We aimed to investigate the difference in myelin concentration in the white matter and subcortical areas using new quantitative myelin-related maps of high-resolution 7 Tesla (7 T) magnetic resonance imaging between patients with major depressive disorder and healthy controls.
Methods: Myelin-related comparisons of the white matter and nearby subcortical regions were conducted between healthy controls (n = 36) and patients with major depressive disorder (n = 34). Smoothed quantitative ratio (sq-Ratio) myelin-related maps were created using the multi-echo magnetization-prepared two rapid gradient echoes (ME-MP2RAGE) sequence of the T1 and T2* images of 7 T magnetic resonance imaging. Differences in the myelin-related values of the regions of interest between the two groups were analyzed using a two-sample t-test, and multiple comparison corrections were performed using the false discovery rate.
Results: The average sq-Ratio myelin-related values were 2.62% higher in the white matter and 2.26% higher in the subcortical regions of the healthy controls group than in the major depressive disorder group. In the group analysis of the healthy control and major depressive disorder groups, the sq-Ratio myelin-related values were significantly different in the fornix area of the white matter (false discovery rate-corrected p = 0.012). In addition, significant differences were observed in both the left (false discovery rate-corrected p = 0.04) and right thalamus (false discovery rate-corrected p = 0.040) among the subcortical regions.
Discussion: The average sq-ratio myelin-related value and sq-ratio myelin-related values in the fornix of the white matter and both thalami were higher in the healthy controls group than in the major depressive disorder group. We look forward to replicating our findings in other populations using larger sample sizes.
Major depressive disorder (MDD) is a psychiatric disorder and serious illness that significantly impairs quality of life and is the most common cause of suicide (Cho et al., 2016). In 2008, the World Health Organization ranked MDD as the third most common global disease and predicted that it would become the most common in 2030 (World Health Organization, 2008). The causes of MDD are abnormalities in neurotransmitters, such as the monoamine hypothesis; hypothalamic–pituitary–adrenal axis changes; abnormalities in neuronal networks; genetic factors; stressors; and experiences such as childhood abuse; however, the biological mechanisms of depression are still not completely understood.
Recently, there has been increased interest in the myelin sheath and oligodendrocyte lineage cells, and their role in the central nervous system (CNS; Zhou et al., 2021). Oligodendrocyte lineage cells is the collective term for oligodendrocyte progenitor cells and mature oligodendrocytes, which form myelin sheaths around axons and are known to physically and metabolically support axons and mediate the process of neuroplasticity (Zhou et al., 2021). In this manner, oligodendrocyte lineage cells form the white matter, which is a major component of the CNS. Myelin wraps around the axons of the neurons to maintain the efficiency of brain function, maintain nerve fiber integrity, and accelerate the propagation of action potentials (Salzer, 2015). The role of myelin in several neuropsychiatric disorders, such as multiple sclerosis, acute disseminated encephalomyelitis, depression, and schizophrenia, has been studied (Van der Knaap and Valk, 2005). Disordered synaptic transmission may cause abnormal brain development and major psychiatric disorders, such as MDD and schizophrenia (Davis et al., 2003). Myelin has also been implicated in the pathogenesis of depression (Zhou et al., 2021), and numerous studies have implicated myelination as a critical process affecting neuronal connectivity (Davis et al., 2003; Mighdoll et al., 2015; Moura et al., 2021).
In MDD, brain imaging studies have used techniques such as structural abnormalities, functional connectivity, and diffusion tensor imaging depending on the objectives and hypotheses of the study. Recent brain imaging studies have shown that abnormalities in white matter hyperintensities and myelin integrity start to change in the prefrontal areas in the early stages of depression (Cole et al., 2012). In previous studies, white matter tract regions in various brain regions decreased significantly (Taylor et al., 2004; Aston et al., 2005; Bae et al., 2006; Benedetti et al., 2011; Zhang et al., 2013; Bhatia et al., 2018; Williams et al., 2019). Samples from patients have shown a reduction in myelin content and axon numbers in various brain areas (Regenold et al., 2007; Tham et al., 2011). This suggests that individuals with depression may have differences in the structure and function of myelin in the brain compared with those without depression, particularly in the prefrontal cortex, which is involved in emotional regulation, decision-making, and other cognitive processes.
Myelin abnormalities are an important cause of depression, and it is important to accurately quantify myelin using in vivo magnetic resonance imaging (MRI) for more accurate research into the pathogenesis of depression. In a previous study, we introduced a myelin-related mapping technique to obtain quantitative maps using 7 Tesla MRI (Shim et al., 2022). In this study, the term “quantitative maps” refers to maps derived from quantitative R1 and T2* images, which are not indicative of the anatomical content of myelin, but rather obtained through imaging parameters that are independent and quantitative in MRI. This technique improves the myelin contrast between the myelinated and unmyelinated areas by dividing the R1 and T2* images in which the received bias field is removed. This enables the quantification of myelin-related density using R1 and T2* images instead of weighted images with varying signal intensity values according to the selected MR parameters. In addition, this technique uses a signal MR pulse sequence, such as multi-echo magnetization-prepared by two rapid gradient-echo (ME-MP2RAGE) sequences, which is not necessary for further image registration (Metere et al., 2017). Two or more MR pulse sequences are used to obtain R1 and T2* images, requiring a long acquisition time and further correction of the motion artifacts. Therefore, this technique can provide objective and accurate quantification of myelin using high-resolution quantitative images in a relatively short scan time (Shim et al., 2022), and can be applied to the study of various neuropsychiatric diseases related to demyelination, including depression.
Several quantitative MRI (qMRI) methods have been developed and used to measure myelin-related properties of white matter in patients with MDD (Sacchet and Gotlib, 2017). Sacchet et al. measured in vivo myelin concentration through R1 (1/T1), compared myelin concentration between patients with MDD and healthy controls, and revealed that patients with MDD had lower levels of myelin at the whole-brain level and in the nucleus accumbens (Sacchet and Gotlib, 2017). Hou et al. compared the myelin levels between patients with MDD and controls using an inhomogeneous magnetization transfer method, which is a surrogate measure of myelin content, and showed myelin impairment in the fornix, left anterior limb of the internal capsule, and left sagittal striatum (Hou et al., 2021). We aimed to determine whether myelin concentration in the white matter and subcortical areas differs between patients with MDD and normal controls using 7 T high-resolution MRI.
Thirty-four patients with MDD and 36 healthy controls (HCs) were included in the study after providing written informed consent. Age, sex, and duration of education were matched between the two groups. The study was approved by the Institutional Review Board of Gil Medical Center (IRB No. GDIRB2018-005 and GDIRB2020-207). One board-certified psychiatrist (SGK) interviewed all the participants and assessed their eligibility for the study using a structured clinical interview based on the fifth edition of the Diagnostic and Statistical Manual of Mental Disorders (DSM-5) (SCID-5; First et al., 2016). Patients meeting the DSM-5 diagnostic criteria for MDD were included in the MDD group.
The common exclusion criteria for MDD and HC were as follows: age < 19 or > 65 years; left-handed use in the Edinburgh Handedness Test (Oldfield, 1971); current serious suicide risk; previous abnormal findings on brain imaging; contraindications to MRI (e.g., metals in the body); pregnancy or lactation; major or unstable medical and neurological disorders within the past year; history of head trauma; substance use disorder within the past year; intellectual disability; personality disorder; and neurocognitive disorders. Additional exclusion criteria for MDDs were comorbidities of major psychiatric disorders (i.e., schizophrenia spectrum and other psychotic disorders, obsessive–compulsive and related disorders, substance-related and addictive disorders, major anxiety disorders, and disruptive, impulse control, and conduct disorders). Further exclusion criteria for the HCs were as follows: Hamilton Depression Rating Scale 17 items (HDRS-17) total score > 6; psychiatric history; history of taking psychotropic medications; and first-degree relatives with schizophrenia, MDD, or bipolar disorder.
Depression severity was quantified using the HDRS-17 (Yi et al., 2005), Clinical Global Impression of Severity (CGI-S) (Busner and Targum, 2007), and Beck Depression Inventory (BDI) (Rhee et al., 1995) at baseline and on the MRI scanning date. Based on the HDRS-17 score, depression severity was classified as severe (≥25), moderate (18–24), mild (7–17), and no depression (0–6). We assessed depressive symptoms on the same day as the MRI scan.
Brain images were acquired with an eight-channel phased array coil using a 7 T MRI system (Magnetom, Siemens, Erlangen, Germany). A prototype multi-echo magnetization-prepared two rapid gradient-echo (ME-MP2RAGE) sequence was used (Metere et al., 2017), and sagittal images were acquired using the following parameters: repetition time (TR) = 8,000 ms; four echo times (TEs) = 3.46, 7.28, 11.1, and 14.92 ms; two inversion times (TIs) = 1000/3200 ms; flip angle = 4°; field of view (FOV) = 166 × 166 × 135.2 mm3 with nominal isotropic resolutions of 0.65 mm; matrix size = 256 × 256; 208 slices along the right–left axis; bandwidth = 280 Hz/px; bipolar readout; generalized auto-calibrating partially parallel acquisitions (GRAPPA) with accelerating factor = 3 (50 reference lines); and 7/8 and 6/8 partial Fourier factors along the phase-encoding and slice-encoding directions, respectively, yielding an acquisition time (TA) = 14 min 16 s.
Images acquired from the ME-MP2RAGE sequence were used to reconstruct the T1 and T2* images. The T1 images were generated immediately after scanning through the reconstruction process provided by the sequence, but the R2* (= 1/T2*) images were reconstructed using the Fit T2 or T2 Star MRI data program1 with multiple echo images obtained after the second inversion radiofrequency pulse.
To generate myelin-related maps, T1 and R2* images were normalized using a voxel size of 0.5 mm to the standard space and the Montreal Neurological Institute (MNI) 152 template using statistical parametric mapping (SPM) 12 (Ashburner et al., 2020). T2* maps were generated from normalized R2* maps, and the T1 and T2* ranges were set to 700–4,000 ms and 1–60 ms (Metere et al., 2017), respectively. Quantitative ratio (q-Ratio) myelin-related maps were generated by dividing the R1 images by the T2* images (Shim et al., 2022).
To remove artifacts around the outer boundary of the brain images, which could make the analysis of myelin-related values difficult, we used weighted ratio (w-Ratio) images in which T2*-weighted (T2*W) images were divided from T1-weighted (T1W) images, providing a better contrast between white and gray matter (Shim et al., 2022). During preprocessing, the T1W and T2*W images obtained using the ME-MP2RAGE sequence were normalized to 0.5 mm on the MNI 152 template in the same manner as the T1 and R2* images. The resulting w-Ratio myelin-related images were generated by dividing the normalized T2*W image by the normalized T1W image (Figure 1). The standard T1 image provided by the SPM was segmented and divided into gray and white matter, which were used as mask images to reconstruct the w-ratio myelin-related images. Furthermore, the artifacts in the w-Ratio myelin-related images were removed after identifying outliers using the quartile method (Rousseeuw and Hubert, 2011).
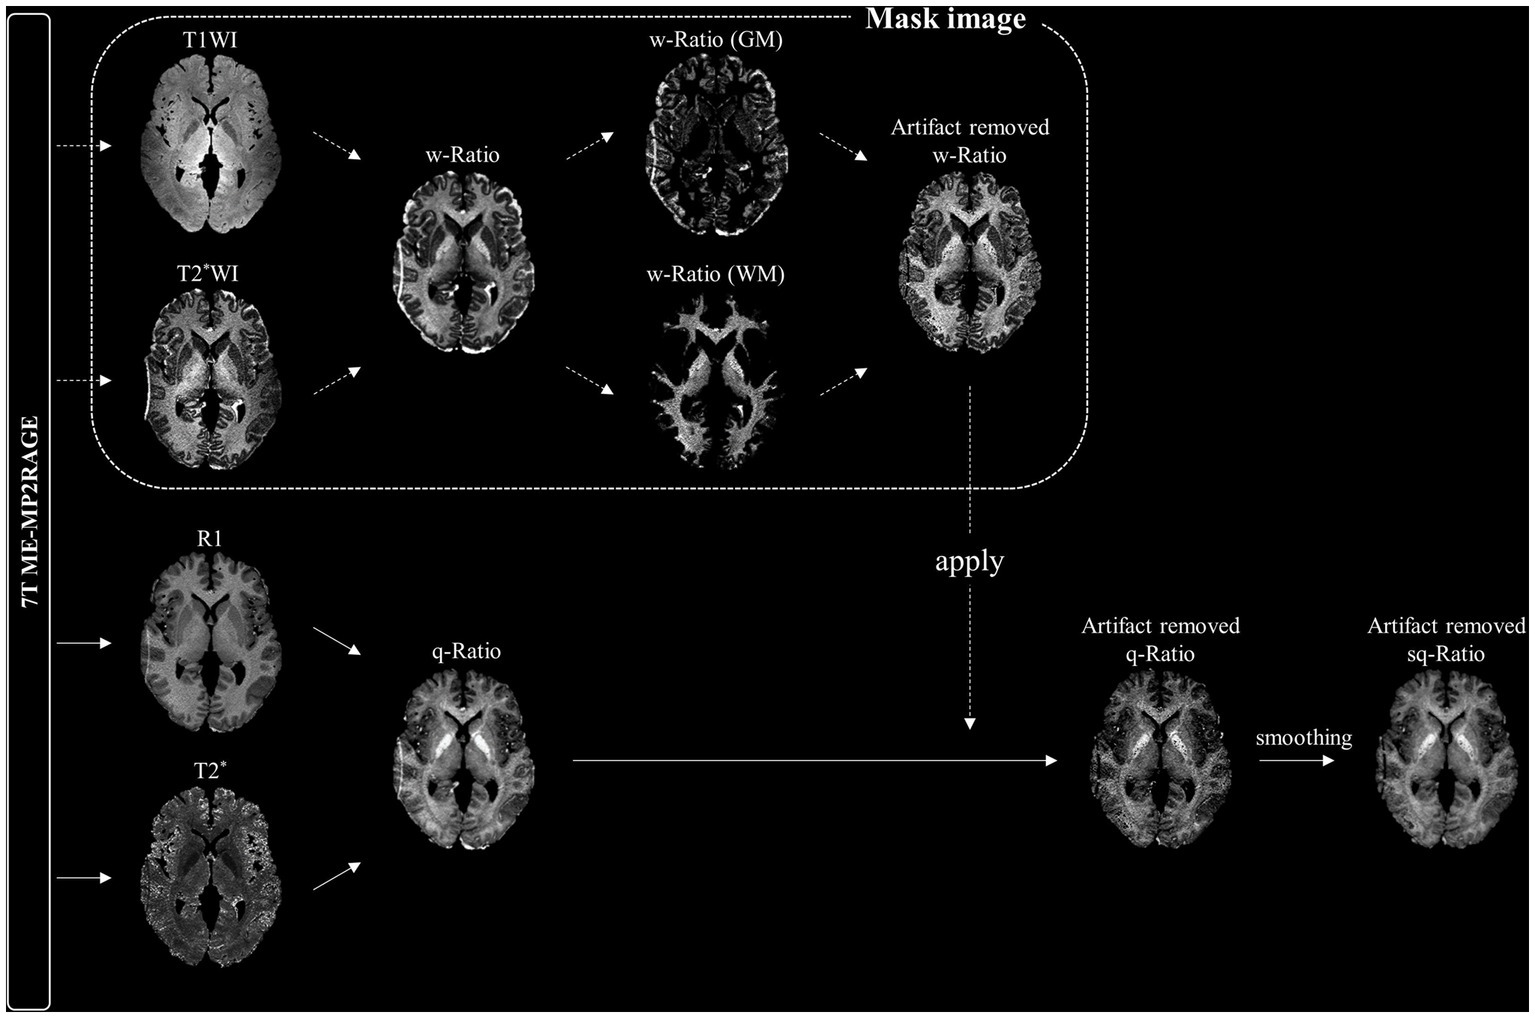
Figure 1. Schematic diagram of smoothed quantitative ratio (sq-Ratio) myelin-related mapping. For the mask image, we first created a weighted ratio (w-Ratio) myelin-related map by dividing the T1-weighted image (T1WI) and T2*-weighted image (T2*WI) obtained from the ME-MP2RAGE sequence, and then applied the quartile method to create an artifact-removed w-Ratio map. We applied this mask image to the q-ratio myelin-related map (q-ratio) to create an artifact-free map, which was then smoothed to 1 mm. GM, gray matter; WM, white matter.
Finally, the artifact-removed w-Ratio myelin-related image was used as a mask image to create a q-Ratio myelin-related image. The individual images were then smoothed with an isotropic three-dimensional Gaussian kernel of 1 mm full width at half maximum to obtain smoothed q-Ratio (sq-Ratio) myelin-related maps.
We analyzed the myelin-related differences in the normal HCs and MDD groups, focusing primarily on the white matter, where myelin is predominantly located, as well as the nearby subcortical areas. We used the Johns Hopkins University (JHU) ICBM-DTI-81 white matter label atlas to analyze the white matter (Mori et al., 2008). To observe myelin in the subcortical and cerebellar areas adjacent to the white matter (Zhang F. F. et al., 2018), which are considered important in the recent onset mechanism of depression, we used the Automated Anatomical Labeling Atlas 2 (AAL2; Rolls et al., 2015). Both the JHU ICBM-DTI-81 white matter labels atlas and AAL2 were normalized to 0.5 mm, using Matlab 2018b (The MathWorks Inc., Natick, MA).
Differences in sq-Ratio myelin-related values between the MDD and HC groups in 50 white matter regions of interest (ROIs) and 40 subcortical ROIs were analyzed using Welch’s t-test, and multiple comparison corrections were performed using the false discovery rate (FDR; Benjamini and Hochberg, 1995). To further examine the impact of medication in the MDD group, we divided it into those taking and those not taking antidepressants, and used the same statistical methods to compare the two groups by medication status. The statistical threshold was set at p < 0.05. In addition, in the MDD group, we performed a partial correlation analysis (p < 0.05, two-tailed) to determine the statistical association of sq-Ratio myelin-related values (mean values in the subcortex, white matter, and regions that were significant when comparing the MDD and HC groups) with key clinical variables such as depression severity and duration of illness (Chen et al., 2022). All statistical analyses were performed using SPSS ver. 25 (IBM Corp., Armonk, NY) and Jamovi ver. 2.2.5 (The Jamovi Project [2021]).
The demographic and clinical characteristics of the MDD and HC groups and their comparisons are shown in Table 1. There were no significant differences in age, sex ratio, or duration of education between the two groups. As expected, the MDD patients had significantly more severe depressive symptoms than the HC group, as measured using the HDRS and BDI (p < 0.001; Table 1). Based on HDRS scores, the severity of depression in the MDD group was severe, moderate, and mild in 2 (6%), 17 (50%), and 13 patients (38%), respectively. In addition, 28 patients in the MDD group were taking antidepressants, 14 of whom were taking more than one type thereof, and the antidepressants were escitalopram (n = 10), trazodon (n = 8), bupropion (n = 5), desvenlafaxine (n = 4), vortioxetine (n = 3), fluoxetine (n = 3), mirtazapine (n = 3), paroxetine (n = 3), milnacipran (n = 2), setraline (n = 1), agomelatine (n = 1), and imipramine (n = 1). Furthermore, in the MDD group, the average duration of depression was 5.53 years, and 11 patients had history of a previous suicide attempt. The BHS, CGI, and Scale for Suicide Ideation (SSI) scores were higher in patients with MDD than in the HCs (p < 0.001; Table 1).

Table 1. Demographic and clinical characteristics of the participants.
We compared the sq-Ratio myelin-related values between the HC and MDD groups in the white matter and subcortical regions. The average sq-ratio myelin-related value of the HC group was higher than that of the MDD group in both white matter and subcortical regions. The average sq-Ratio myelin-related value for the entire ROI in the white matter was 2.62% higher in HCs than in MDD patients (HC, 23.298 ± 1.374 [mean ± standard deviation]; MDD, 22.703 ± 1.480; p = 0.085). Additionally, in the subcortical regions, the value was 2.26% larger in HCs than in MDD patients (HC, 17.862 ± 0.966; MDD, 17.467 ± 1.280; p = 0.148; Tables 2, 3). Higher myelin-related signals of HCs compared to MDD patients were also clear (Figure 2).
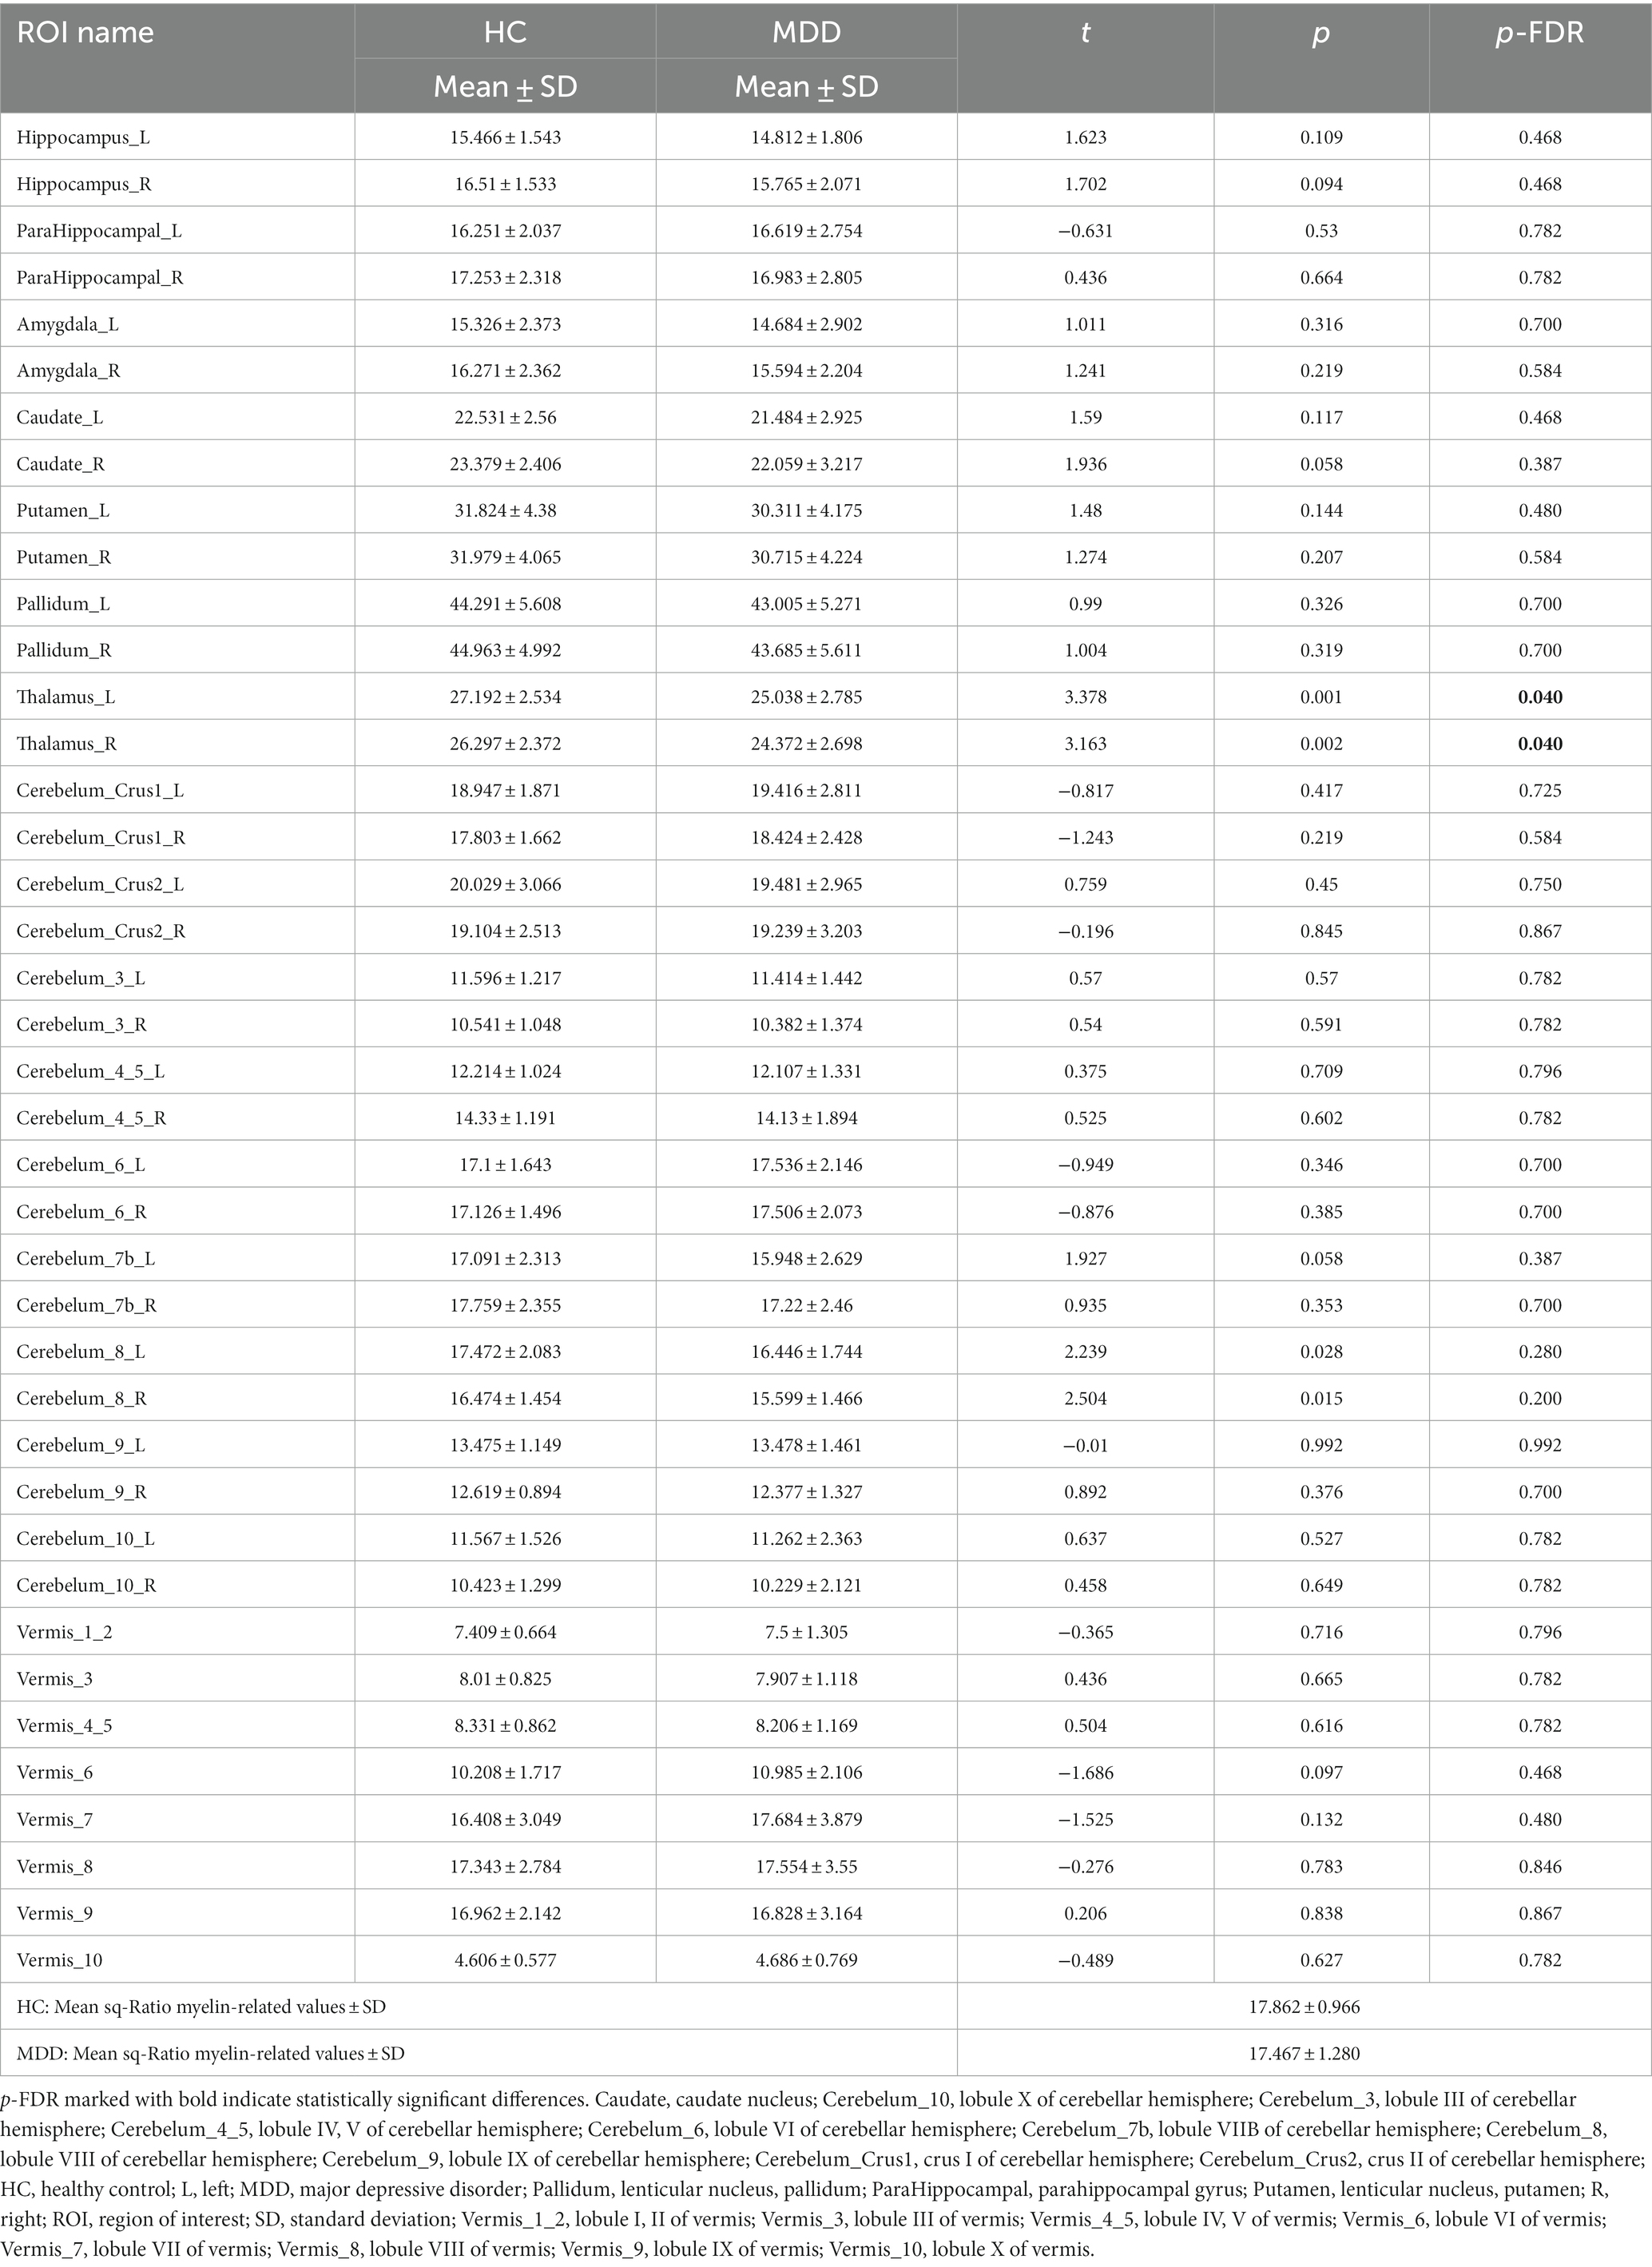
Table 2. Smoothed quantitative ratio (sq-Ratio) myelin-related values and group analysis results in subcortical regions.
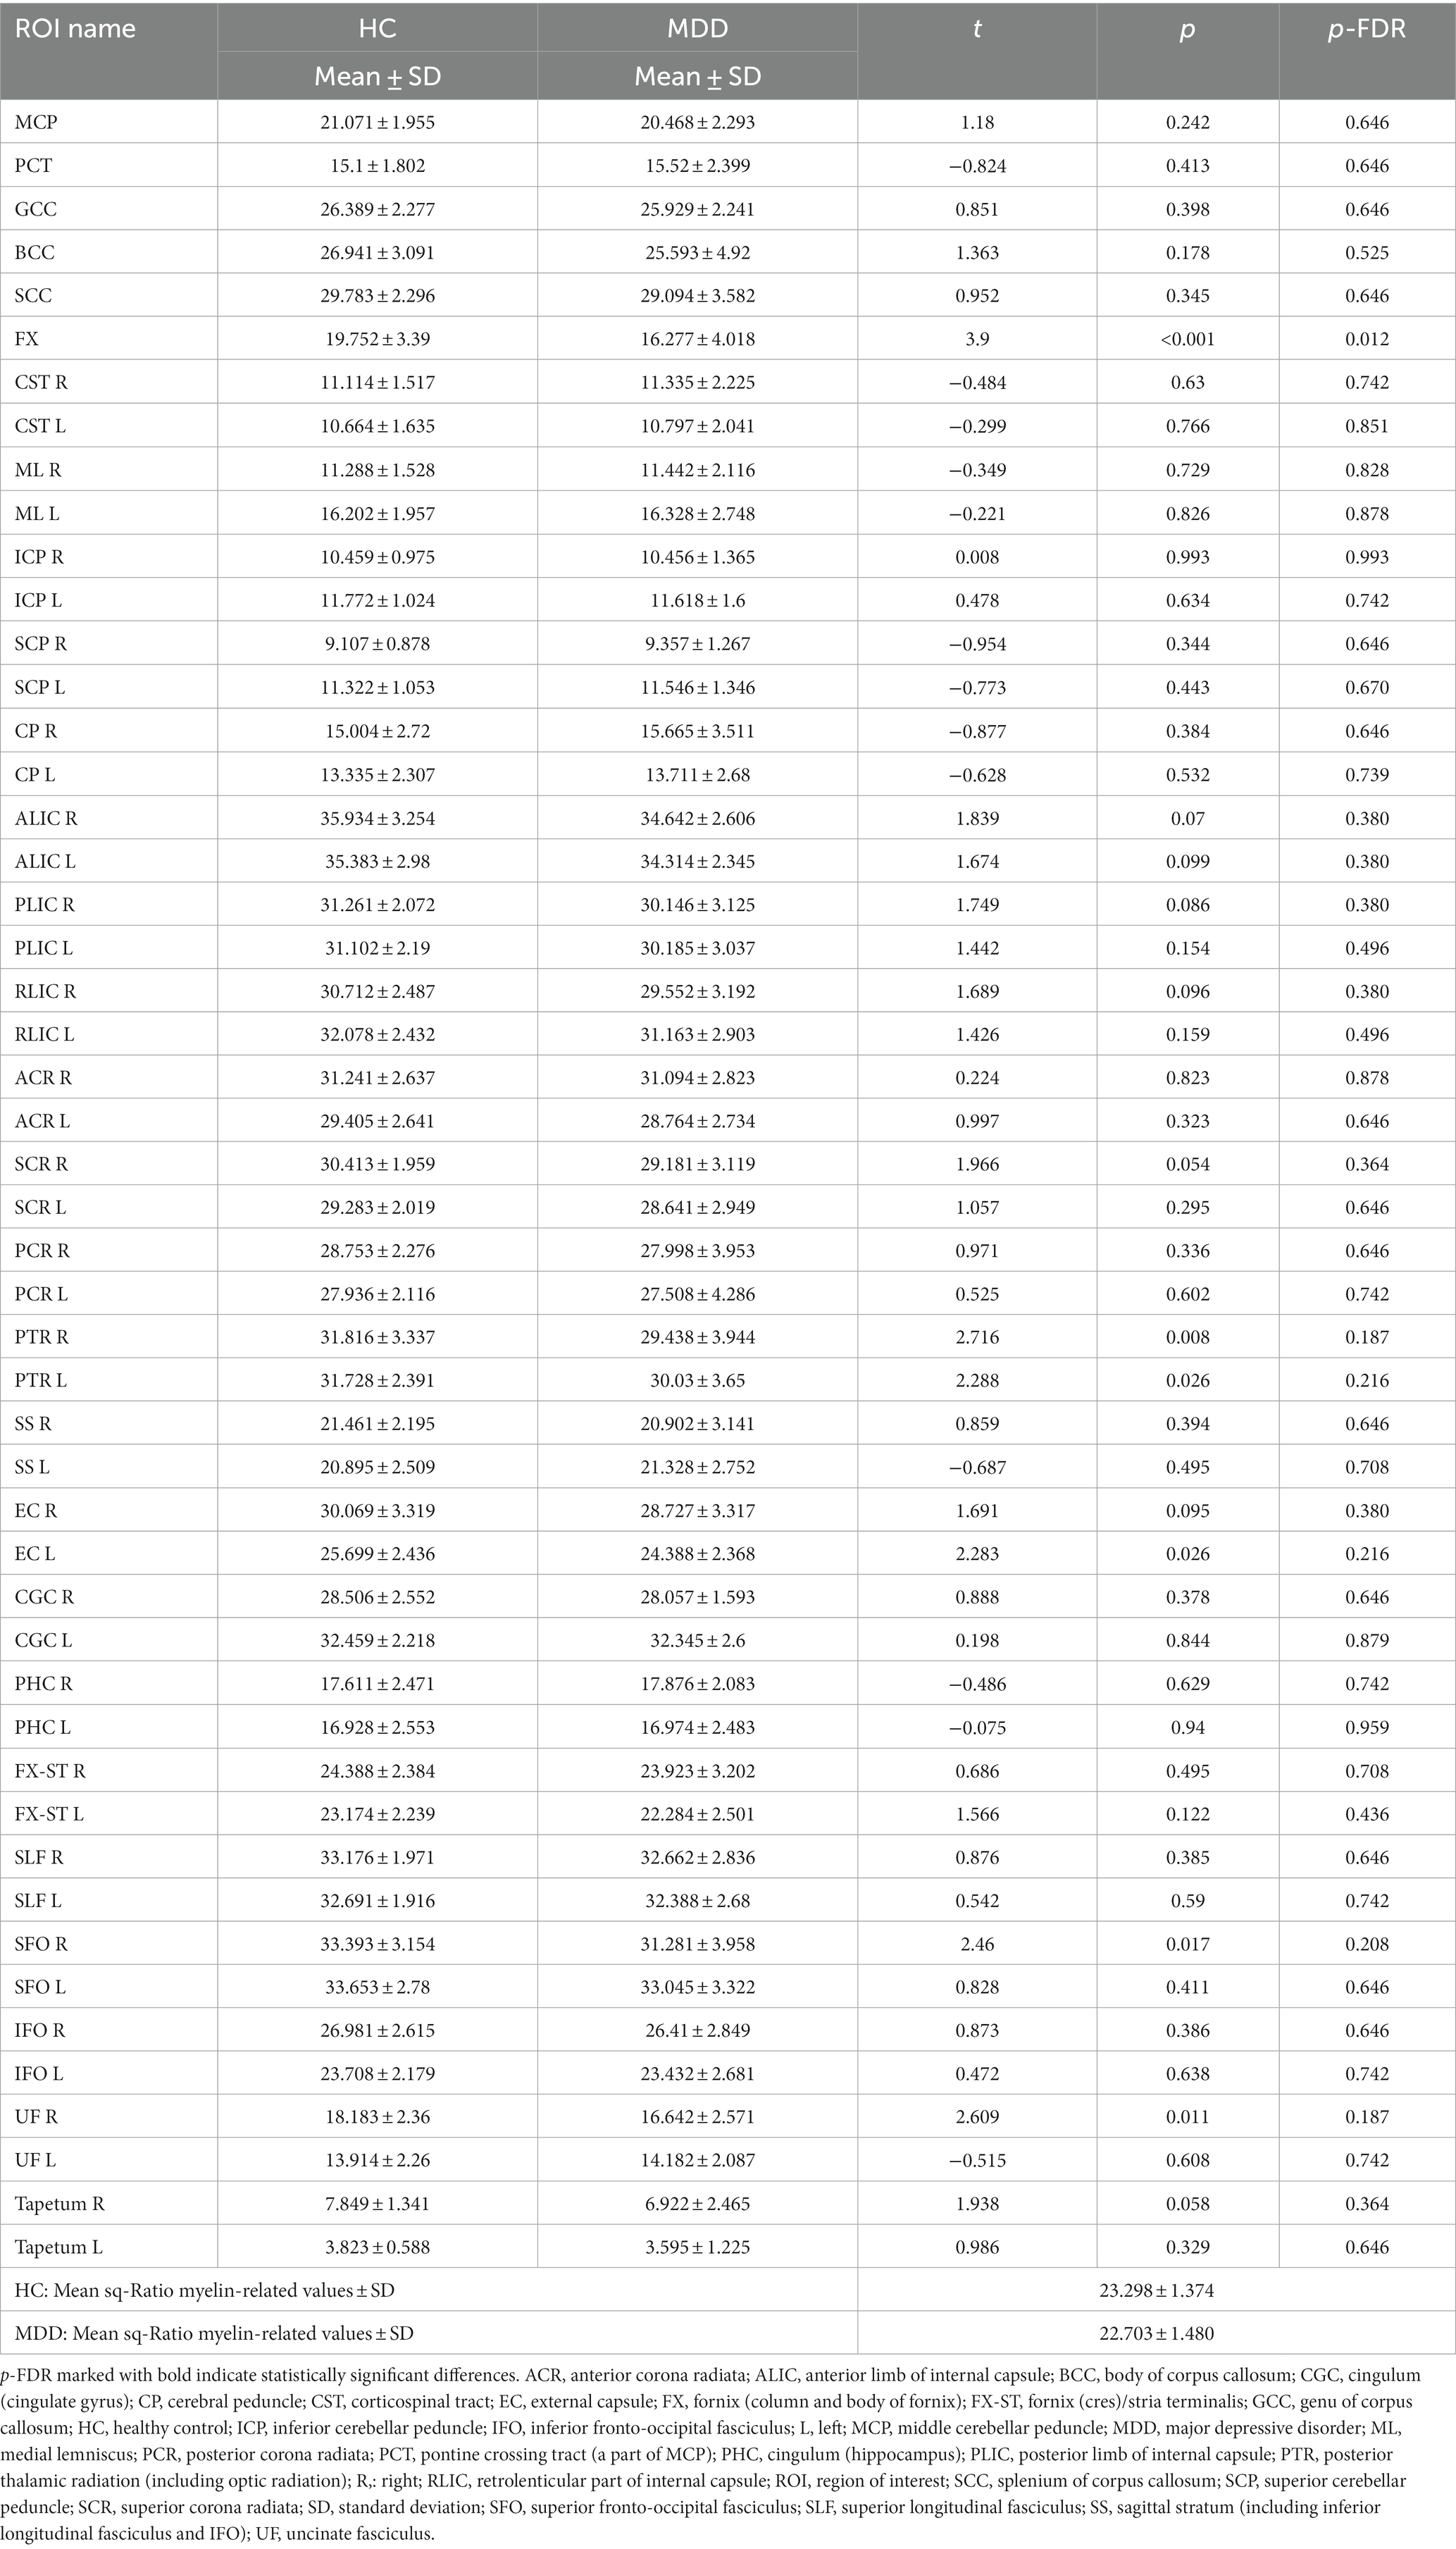
Table 3. Smoothed quantitative ratio (sq-Ratio) myelin-related values and group analysis results in white matter regions.
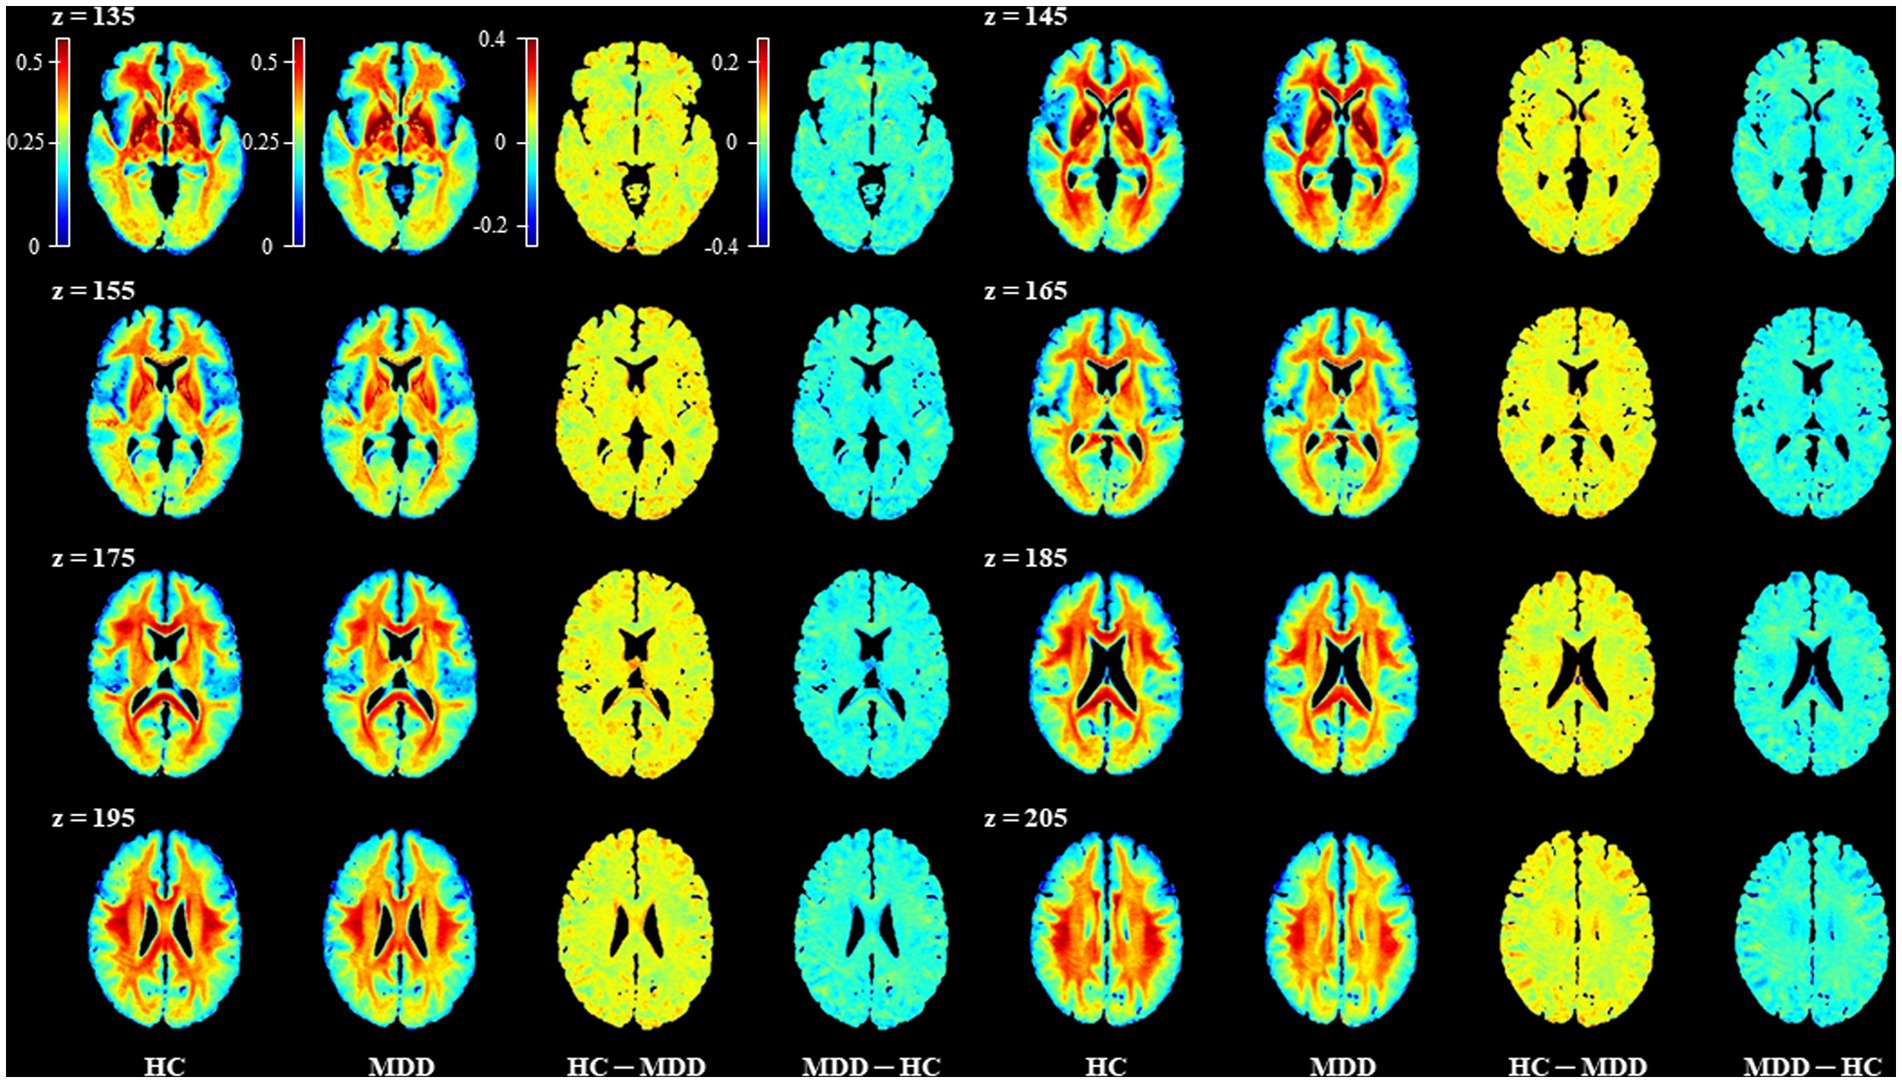
Figure 2. Representative images for comparison of the mean sq-Ratio myelin-related values between the healthy control (HC) and major depressive disorder (MDD) groups. To compare the group average sq-Ratio myelin-related maps on the same scale, each group’s average sq-Ratio myelin-related map was normalized to have values between 0 and 1. When the normalized group average myelin-related maps were subtracted from each other, the HC – MDD myelin-related map had values ranging from −0.2 to 0.4, indicating that the average myelin-related value in the HC group was higher than that in the MDD group.
In the group analysis between HC and MDD, the sq-Ratio myelin-related values were significantly different in the fornix (FX) area of the white matter (FDR-corrected p = 0.012; HC, 19.752 ± 3.39; MDD, 16.277 ± 4.018; Table 2). A significant difference was observed in both the left and right thalamus areas of the subcortical regions (FDR-corrected p = 0.040; left thalamus: HC, 27.192 ± 2.534; MDD, 25.038 ± 2.785; FDR-corrected p = 0.040; right thalamus: HC, 26.297 ± 2.372; MDD, 24.372 ± 2.698; Table 3). An additional analysis comparing medication status within the MDD group showed no significant differences in each ROI (Supplementary Tables S1, S2). Moreover, in the MDD group, the number of suicide attempts showed significant positive correlations with the mean of sq-Ratio myelin-related values in the subcortex (r = 0.491, p = 0.004) and white matter (r = 0.415, p = 0.018; Supplementary Table S3).
The average sq-Ratio myelin-related value of the HC group was higher than that of the MDD group in both the white matter and subcortical regions. In addition, the myelin-related sq-Ratio values were higher in the HC group than in the MDD group in the fornix areas of the white matter and both thalami.
Hou et al. compared myelin in patients with recurrent MDD and HCs using the inhomogeneous magnetization transfer technique developed through the myelin imaging method and showed lower quantitative inhomogeneous magnetization transfer values in the fornix in patients with recurrent MDD (Hou et al., 2021). Additionally, in patients with recurrent MDD, quantitative inhomogeneous magnetization transfer values in the fornix and quantitative myelin transfer values were negatively correlated with disease duration, indicating a decrease in myelin levels as the disease progressed (Hou et al., 2021). Geng et al. also found white matter abnormalities in the fornix, which connects the prefrontal cortex and hippocampus, in patients with early onset MDD, using a resting-state fMRI study (Geng et al., 2016). In a previous DTI study, Li et al. reported white matter disruptions in the fornix and the hippocampal cingulum during late-life depression (Li et al., 2014). The fornix is a part of the limbic system and is a C-shaped bundle of nerve fibers in the brain, which is comprised mostly of efferent fibers from the hippocampus (Griffiths et al., 2009). Hippocampal fibers project via the fornix to the orbitofrontal cortex and anterior cingulate, ventral striatum, septal, and preoptic nuclei. Less prominent connections to the anterior thalamic nucleus and hypothalamus also exist (Griffiths et al., 2009). The fornix is a channel for important neurotransmitters such as GABA and acetylcholine, and electrical activity such as theta rhythms in the hippocampus, septal nuclei, Broca’s band, and deep brain structures (Rawlins et al., 1979; Cassel et al., 1997; Hasselmo, 1999). Therefore, the reduction in myelin in depression patients observed in this study may be evidence of the pathophysiology of MDD by impairing connections between brain regions such as the hippocampus and prefrontal cortex, which are important for depression and mental functioning. Our study also showed reduced myelin levels in the thalamus of patients with MDD. To the best of our knowledge, there have been no reports of quantitative abnormalities of thalamic myelin in patients with depression. However, previous studies have provided indirect evidence of reduced myelin levels in the thalamus of patients with depression. Zhang et al. (2021) reported a larger T1 in the left thalamus in patients with MDD and insisted that this finding could be related to abnormal development of the thalamus, such as microstructural proliferation and myelination (Zhang et al., 2022). Jiang et al. reported higher serum levels of myelin oligodendrocyte glycoprotein and myelin-associated glycoprotein, which are related to demyelination in patients with MDD, and decreased fractional anisotropy and axial diffusivity in the white matter of the bilateral thalamus (Jiang et al., 2018). They reported an association between an increase in oligodendrocyte glycoprotein and myelin-associated glycoprotein levels and a decrease in myelin levels in brain regions such as the thalamus (Jiang et al., 2018). The thalamus is a key node in the limbic–cortical-striatal-pallidal-thalamic circuit (Drevets et al., 1992). The thalamus is anatomically interconnected with the prefrontal cortex, striatum, and amygdala, and its reciprocal connections with cortical and subcortical regions facilitate the exchange of subcortical information with the cortex (Price and Drevets, 2010). Previous neuroimaging findings have shown thalamic involvement in the macroscopic structural abnormalities associated with depression. Specifically, diffusion tensor imaging (DTI) studies have shown abnormal structural connectivity of the white matter within the thalamofrontal pathway in MDD patients (Jia et al., 2014; Korgaonkar et al., 2014; Long et al., 2015; Myung et al., 2016).
Previous studies comparing patients with MDD with controls by quantifying myelin have found reduced myelin at the whole-brain level, nucleus accumbens, fornix, left anterior limb of the internal capsule, and left sagittal striatum in patients with MDD (Sacchet and Gotlib, 2017; Hou et al., 2021). Postmortem studies on human brains with depression also showed lower intensity of myelin staining in the dorsolateral prefrontal cortex regions in MDD patients and unipolar and bipolar affective disorders (Regenold et al., 2007; Lake et al., 2017). Although the brain regions showing differences between groups differed among studies, most have shown decreased myelin levels in MDD. There are several hypotheses regarding myelin-related changes in depression, but it seems that stress causes structural alterations in myelin, which in turn may trigger depression (Smaga, 2022). It is possible that the chronic stress associated with depression contributes to decreased myelin levels in the thalamus. Previous mouse experiments have found that chronic social defeat stress causes downregulation of myelin-related genes and is associated with an altered myelin structure (Lehmann et al., 2017), which has been reported to cause depression-like behavior (Birey et al., 2015). Oligodendroglia defects that causes myelin disruption and proposed mechanisms associated with depression are increased levels of circulating corticosterone due to overactivation of HPA axis in stress, pro-inflammatory cytokines and reactive oxygen species released by activated microglia, and epigenetic factors including histone/DNA modification and microRNA (Lutz et al., 2017; Zhang L. et al., 2018; Boda, 2021). Consistent with this mechanism, previous studies suggest that antidepressant use in depressed patients might promote the repair of myelin in the brain (Haroutunian et al., 2014; Boda, 2021). In addition, there are studies showing a correlation between myelin stability, microglial phagocytosis, and synaptic and plasticity-associated proteins with microarray investigation of myelin in relation to suicide, similar to our findings that correlated the number of suicide attempts with sq-ratio values in the MDD group (Klempan et al., 2009; Zhang et al., 2021).
In this study, a reduced myelin concentration in the white matter and subcortical areas of MDD patients was revealed using a more accurate and faster myelin quantification technique in high-resolution 7 T MRI. The sq-Ratio method used in this study enhances contrast by dividing R1 and T2* to detect the presence of myelin, but its limitation is that it can be affected by iron content. Further research on iron content using T2* or quantitative susceptibility mapping is necessary. By incorporating iron content information obtained through such research as a covariate, it is expected that a more precise analysis of myelin can be conducted in terms of sq-Ratio myelin-related values. Although there are many studies on decreased myelin levels in MDD, it is difficult to conclude that myelin reduction in MDD has been clearly demonstrated in the human brain. In the future, we look forward to replicating our results in other populations with larger sample sizes, and future studies on the mechanisms underlying myelin reduction in depression are also warranted. In addition, repeated studies in larger groups are needed to refine the relationship between psychiatric drugs, including antidepressants, and clinical variables such as suicide attempts, duration of illness, and severity of depression.
The original contributions presented in the study are included in the article/Supplementary material, further inquiries can be directed to the corresponding authors.
The studies involving human participants were reviewed and approved by the study was approved by the Institutional Review Board of Gil Medical Center (IRB no. GDIRB2018-005 and GDIRB2020-207). The patients/participants provided their written informed consent to participate in this study.
J-MS, S-GK, and C-KK conceived and designed the study. S-EC and S-GK recruited participants and conducted the experiments. J-MS, S-EC, C-KK, and S-GK analyzed the data and wrote the first draft of the manuscript and edited the manuscript. All authors contributed to the article and approved the submitted version.
This work was supported by the National Research Foundation of Korea (NRF) grants funded by the South Korean government (MSIT; NRF-2020R1A2C1004355 and NRF-2020R1A2C1007527). This research was funded by the Korea Health Technology R&D Project through the Korea Health Industry Development Institute, which is funded by the Ministry of Health and Welfare, Republic of Korea (grant number HI17C2665).
This study was performed with the support of Tobias Kober, the developer of the MP2RAGE sequence (Advanced Clinical Imaging Technology, Siemens Healthineers, Lausanne, Switzerland). The authors would also like to thank the staff of Siemens, Korea (Inseong Kim and Sugil Kim).
The authors declare that the research was conducted in the absence of any commercial or financial relationships that could be construed as a potential conflict of interest.
All claims expressed in this article are solely those of the authors and do not necessarily represent those of their affiliated organizations, or those of the publisher, the editors and the reviewers. Any product that may be evaluated in this article, or claim that may be made by its manufacturer, is not guaranteed or endorsed by the publisher.
The Supplementary material for this article can be found online at: https://www.frontiersin.org/articles/10.3389/fnmol.2023.1214738/full#supplementary-material
BDI, beck depression inventory; CNS, central nervous system; DTI, diffusion tensor imaging; HC, healthy control; MDD, major depressive disorder; MRI, magnetic resonance imaging; ROI, regions of interest; SPM, statistical parametric mapping; SSI, scale for suicide ideation.
Ashburner, J., Barnes, G., Chen, C. C., Daunizeau, J., Flandin, G., Friston, K., et al. (2020). SPM12 Manual. Wellcome Trust Centre for Neuroimaging, London, UK, 2464.
Aston, C., Jiang, L., and Sokolov, B. (2005). Transcriptional profiling reveals evidence for signaling and oligodendroglial abnormalities in the temporal cortex from patients with major depressive disorder. Mol. Psychiatry 10, 309–322. doi: 10.1038/sj.mp.4001565
Bae, J. N., MacFall, J. R., Krishnan, K. R. R., Payne, M. E., Steffens, D. C., and Taylor, W. D. (2006). Dorsolateral prefrontal cortex and anterior cingulate cortex white matter alterations in late-life depression. Biol. Psychiatry 60, 1356–1363. doi: 10.1016/j.biopsych.2006.03.052
Benedetti, F., Yeh, P.-H., Bellani, M., Radaelli, D., Nicoletti, M. A., Poletti, S., et al. (2011). Disruption of white matter integrity in bipolar depression as a possible structural marker of illness. Biol. Psychiatry 69, 309–317. doi: 10.1016/j.biopsych.2010.07.028
Benjamini, Y., and Hochberg, Y. (1995). Controlling the false discovery rate: a practical and powerful approach to multiple testing. J. R. Stat. Soc. 57, 289–300.
Bhatia, K. D., Henderson, L. A., Hsu, E., and Yim, M. (2018). Reduced integrity of the uncinate fasciculus and cingulum in depression: a stem-by-stem analysis. J. Affect. Disord. 235, 220–228. doi: 10.1016/j.jad.2018.04.055
Birey, F., Kloc, M., Chavali, M., Hussein, I., Wilson, M., Christoffel, D. J., et al. (2015). Genetic and stress-induced loss of NG2 glia triggers emergence of depressive-like behaviors through reduced secretion of FGF2. Neuron 88, 941–956. doi: 10.1016/j.neuron.2015.10.046
Boda, E. (2021). Myelin and oligodendrocyte lineage cell dysfunctions: new players in the etiology and treatment of depression and stress-related disorders. Eur. J. Neurosci. 53, 281–297. doi: 10.1111/ejn.14621
Busner, J., and Targum, S. D. (2007). The clinical global impressions scale: applying a research tool in clinical practice. Psychiatry (Edgmont) 4, 28–37.
Cassel, J. C., Duconseille, E., Jeltsch, H., and Will, B. (1997). The fimbria-fornix/cingular bundle pathways: a review of neurochemical and behavioural approaches using lesions and transplantation techniques. Prog. Neurobiol. 51, 663–716. doi: 10.1016/s0301-0082(97)00009-9
Chen, G., Fu, S., Chen, P., Zhong, S., Chen, F., Qian, L., et al. (2022). Reduced myelin density in unmedicated major depressive disorder: an inhomogeneous magnetization transfer MRI study. J. Affect. Disord. 300, 114–120. doi: 10.1016/j.jad.2021.12.111
Cho, S. E., Na, K. S., Cho, S. J., Im, J. S., and Kang, S. G. (2016). Geographical and temporal variations in the prevalence of mental disorders in suicide: systematic review and meta-analysis. J. Affect. Disord. 190, 704–713. doi: 10.1016/j.jad.2015.11.008
Cole, J., Chaddock, C. A., Farmer, A. E., Aitchison, K. J., Simmons, A., McGuffin, P., et al. (2012). White matter abnormalities and illness severity in major depressive disorder. Br. J. Psychiatry 201, 33–39. doi: 10.1192/bjp.bp.111.100594
Davis, K. L., Stewart, D. G., Friedman, J. I., Buchsbaum, M., Harvey, P. D., Hof, P. R., et al. (2003). White matter changes in schizophrenia: evidence for myelin-related dysfunction. Arch. Gen. Psychiatry 60, 443–456. doi: 10.1001/archpsyc.60.5.443
Drevets, W. C., Videen, T. O., Price, J. L., Preskorn, S. H., Carmichael, S. T., and Raichle, M. E. (1992). A functional anatomical study of unipolar depression. J. Neurosci. 12, 3628–3641. doi: 10.1523/JNEUROSCI.12-09-03628.1992
First, M., Williams, J., Karg, R., and Spitzer, R. (2016). Structured Clinical Interview for DSM-5® Disorders: Clinical Version (SCID-5-CV) American Psychiatric Publishing. Washington, DC, USA.
Geng, H., Wu, F., Kong, L., Tang, Y., Zhou, Q., Chang, M., et al. (2016). Disrupted structural and functional connectivity in prefrontal-Hippocampus circuitry in First-episode medication-Naïve adolescent depression. PLoS One 11:e0148345. doi: 10.1371/journal.pone.0148345
Griffiths, P. D., Batty, R., Connolly, D. A., and Reeves, M. J. (2009). Effects of failed commissuration on the septum pellucidum and fornix: implications for fetal imaging. Neuroradiology 51, 347–356. doi: 10.1007/s00234-009-0507-x
Haroutunian, V., Katsel, P., Roussos, P., Davis, K. L., Altshuler, L. L., and Bartzokis, G. (2014). Myelination, oligodendrocytes, and serious mental illness. Glia 62, 1856–1877. doi: 10.1002/glia.22716
Hasselmo, M. E. (1999). Neuromodulation: acetylcholine and memory consolidation. Trends Cogn. Sci. 3, 351–359. doi: 10.1016/s1364-6613(99)01365-0
Hou, G., Lai, W., Jiang, W., Liu, X., Qian, L., Zhang, Y., et al. (2021). Myelin deficits in patients with recurrent major depressive disorder: an inhomogeneous magnetization transfer study. Neurosci. Lett. 750:135768. doi: 10.1016/j.neulet.2021.135768
Jia, Z., Wang, Y., Huang, X., Kuang, W., Wu, Q., Lui, S., et al. (2014). Impaired frontothalamic circuitry in suicidal patients with depression revealed by diffusion tensor imaging at 3.0 T. J. Psychiatry Neurosci. 39, 170–177. doi: 10.1503/jpn.130023
Jiang, L., Cheng, Y., Jiang, H., Xu, J., Lu, J., Shen, Z., et al. (2018). Association between abnormal serum myelin-specific protein levels and white matter integrity in first-episode and drug-naïve patients with major depressive disorder. J. Affect. Disord. 232, 61–68. doi: 10.1016/j.jad.2018.02.044
Klempan, T. A., Ernst, C., Deleva, V., Labonte, B., and Turecki, G. (2009). Characterization of QKI gene expression, genetics, and epigenetics in suicide victims with major depressive disorder. Biol. Psychiatry 66, 824–831.
Korgaonkar, M. S., Fornito, A., Williams, L. M., and Grieve, S. M. (2014). Abnormal structural networks characterize major depressive disorder: a connectome analysis. Biol. Psychiatry 76, 567–574. doi: 10.1016/j.biopsych.2014.02.018
Lake, E. M., Steffler, E. A., Rowley, C. D., Sehmbi, M., Minuzzi, L., Frey, B. N., et al. (2017). Altered intracortical myelin staining in the dorsolateral prefrontal cortex in severe mental illness. Eur. Arch. Psychiatry Clin. Neurosci. 267, 369–376. doi: 10.1007/s00406-016-0730-5
Lehmann, M. L., Weigel, T. K., Elkahloun, A. G., and Herkenham, M. (2017). Chronic social defeat reduces myelination in the mouse medial prefrontal cortex. Sci. Rep. 7, 1–13. doi: 10.1038/srep46548
Li, W., Muftuler, L. T., Chen, G., Ward, B. D., Budde, M. D., Jones, J. L., et al. (2014). Effects of the coexistence of late-life depression and mild cognitive impairment on white matter microstructure. J. Neurol. Sci. 338, 46–56. doi: 10.1016/j.jns.2013.12.016
Long, Z., Duan, X., Wang, Y., Liu, F., Zeng, L., Zhao, J.-P., et al. (2015). Disrupted structural connectivity network in treatment-naive depression. Prog. Neuro-Psychopharmacol. Biol. Psychiatry 56, 18–26. doi: 10.1016/j.pnpbp.2014.07.007
Lutz, P.-E., Tanti, A., Gasecka, A., Barnett-Burns, S., Kim, J. J., Zhou, Y., et al. (2017). Association of a history of child abuse with impaired myelination in the anterior cingulate cortex: convergent epigenetic, transcriptional, and morphological evidence. Am. J. Psychiatr. 174, 1185–1194. doi: 10.1176/appi.ajp.2017.16111286
Metere, R., Kober, T., Moller, H. E., and Schafer, A. (2017). Simultaneous quantitative MRI mapping of T1, T2* and magnetic susceptibility with multi-Echo MP2RAGE. PLoS One 12:e0169265. doi: 10.1371/journal.pone.0169265
Mighdoll, M. I., Tao, R., Kleinman, J. E., and Hyde, T. M. (2015). Myelin, myelin-related disorders, and psychosis. Schizophr. Res. 161, 85–93. doi: 10.1016/j.schres.2014.09.040
Mori, S., Oishi, K., Jiang, H., Jiang, L., Li, X., Akhter, K., et al. (2008). Stereotaxic white matter atlas based on diffusion tensor imaging in an ICBM template. NeuroImage 40, 570–582. doi: 10.1016/j.neuroimage.2007.12.035
Moura, D. M. S., Brennan, E. J., Brock, R., and Cocas, L. A. (2021). Neuron to oligodendrocyte precursor cell synapses: protagonists in oligodendrocyte development and myelination, and targets for therapeutics. Front. Neurosci. 15:779125. doi: 10.3389/fnins.2021.779125
Myung, W., Han, C., Fava, M., Mischoulon, D., Papakostas, G., Heo, J., et al. (2016). Reduced frontal-subcortical white matter connectivity in association with suicidal ideation in major depressive disorder. Transl. Psychiatry 6:e835. doi: 10.1038/tp.2016.110
Oldfield, R. C. (1971). The assessment and analysis of handedness: the Edinburgh inventory. Neuropsychologia 9, 97–113. doi: 10.1016/0028-3932(71)90067-4
Price, J. L., and Drevets, W. C. (2010). Neurocircuitry of mood disorders. Neuropsychopharmacology 35, 192–216. doi: 10.1038/npp.2009.104
Rawlins, J. N., Feldon, J., and Gray, J. A. (1979). Septo-hippocampal connections and the hippocampal theta rhythm. Exp. Brain Res. 37, 49–63. doi: 10.1007/bf01474253
Regenold, W. T., Phatak, P., Marano, C. M., Gearhart, L., Viens, C. H., and Hisley, K. C. (2007). Myelin staining of deep white matter in the dorsolateral prefrontal cortex in schizophrenia, bipolar disorder, and unipolar major depression. Psychiatry Res. 151, 179–188. doi: 10.1016/j.psychres.2006.12.019
Rhee, M., Lee, Y., and Park, S. (1995). A standardization study of Beck depression inventory I; Korean version (K-BDI): reliability and factor analysis. Korean J Psychopathol 4, 77–95.
Rolls, E. T., Joliot, M., and Tzourio-Mazoyer, N. (2015). Implementation of a new parcellation of the orbitofrontal cortex in the automated anatomical labeling atlas. NeuroImage 122, 1–5. doi: 10.1016/j.neuroimage.2015.07.075
Rousseeuw, P. J., and Hubert, M. (2011). Robust statistics for outlier detection. WIREs Data Mining Knowl Discov 1, 73–79. doi: 10.1002/widm.2
Sacchet, M. D., and Gotlib, I. H. (2017). Myelination of the brain in major depressive disorder: an in vivo quantitative magnetic resonance imaging study. Sci. Rep. 7, 1–14. doi: 10.1038/s41598-017-02062-y
Salzer, J. L. (2015). Schwann cell myelination. Cold Spring Harb. Perspect. Biol. 7:a020529. doi: 10.1101/cshperspect.a020529
Shim, J. M., Cho, S. E., Kang, S. G., and Kang, C. K. (2022). Quantitative myelin-related maps from R1 and T2* ratio images using a single ME-MP2RAGE sequence in 7T MRI. Front. Neuroanat. 16:950650. doi: 10.3389/fnana.2022.950650
Smaga, I. (2022). Understanding the links among maternal diet, myelination, and depression: preclinical and clinical overview. Cells 11:540. doi: 10.3390/cells11030540
Taylor, W. D., MacFall, J. R., Payne, M. E., McQuoid, D. R., Provenzale, J. M., Steffens, D. C., et al. (2004). Late-life depression and microstructural abnormalities in dorsolateral prefrontal cortex white matter. Am. J. Psychiatr. 161, 1293–1296. doi: 10.1176/appi.ajp.161.7.1293
Tham, M. W., San Woon, P., Sum, M. Y., Lee, T.-S., and Sim, K. (2011). White matter abnormalities in major depression: evidence from post-mortem, neuroimaging and genetic studies. J. Affect. Disord. 132, 26–36. doi: 10.1016/j.jad.2010.09.013
Van der Knaap, M. S., and Valk, J. (2005). Magnetic Resonance of Myelination and Myelin Disorders. Berlin Heidelberg New York: Springer Science & Business Media.
Williams, M. R., Sharma, P., Macdonald, C., Pearce, R., Hirsch, S., and Maier, M. (2019). Axonal myelin decrease in the splenium in major depressive disorder. Eur. Arch. Psychiatry Clin. Neurosci. 269, 387–395. doi: 10.1007/s00406-018-0904-4
World Health Organization (2008). The Global Burden of Disease: 2004 Update. Geneva, Switzerland World Health Organization.
Yi, J.-S., Bae, S.-O., Ahn, Y.-M., Park, D.-B., Noh, K.-S., Shin, H.-K., et al. (2005). Validity and reliability of the Korean version of the Hamilton depression rating scale (K-HDRS). J. Korean Neuropsychiatr. Assoc. 44, 456–465.
Zhang, A., Ajilore, O., Zhan, L., GadElkarim, J., Korthauer, L., Yang, S., et al. (2013). White matter tract integrity of anterior limb of internal capsule in major depression and type 2 diabetes. Neuropsychopharmacology 38, 1451–1459. doi: 10.1038/npp.2013.41
Zhang, F. F., Peng, W., Sweeney, J. A., Jia, Z. Y., and Gong, Q. Y. (2018). Brain structure alterations in depression: Psychoradiological evidence. CNS Neurosci. Ther. 24, 994–1003. doi: 10.1111/cns.12835
Zhang, L., Verwer, R. W. H., Zhao, J., Huitinga, I., Lucassen, P. J., and Swaab, D. F. (2021). Changes in glial gene expression in the prefrontal cortex in relation to major depressive disorder, suicide and psychotic features. J Affect Disord 295, 893–303.
Zhang, Y., Zhang, Y., Ai, H., Van Dam, N. T., Qian, L., Hou, G., et al. (2022). Microstructural deficits of the thalamus in major depressive disorder. Brain Communications 4:fcac236. doi: 10.1093/braincomms/fcac236
Zhang, L., Zhang, J., and You, Z. (2018). Switching of the microglial activation phenotype is a possible treatment for depression disorder. Front. Cell. Neurosci. 12:306. doi: 10.3389/fncel.2018.00306
Keywords: major depressive disorder, myelin-related map, relaxation times, ratio mapping, ME-MP2RAGE, 7 T MRI
Citation: Shim J-M, Cho S-E, Kang C-K and Kang S-G (2023) Low myelin-related values in the fornix and thalamus of 7 Tesla MRI of major depressive disorder patients. Front. Mol. Neurosci. 16:1214738. doi: 10.3389/fnmol.2023.1214738
Edited by:
Zhen Tian, Southwest University, ChinaReviewed by:
Harald E. Möller, Max Planck Institute for Human Cognitive and Brain Sciences, GermanyCopyright © 2023 Shim, Cho, Kang and Kang. This is an open-access article distributed under the terms of the Creative Commons Attribution License (CC BY). The use, distribution or reproduction in other forums is permitted, provided the original author(s) and the copyright owner(s) are credited and that the original publication in this journal is cited, in accordance with accepted academic practice. No use, distribution or reproduction is permitted which does not comply with these terms.
*Correspondence: Chang-Ki Kang, Y2trYW5nQGdhY2hvbi5hYy5rcg==; Seung-Gul Kang, a2FuZ3NnQGdhY2hvbi5hYy5rcg==
†These authors have contributed equally to this work and share first authorship
Disclaimer: All claims expressed in this article are solely those of the authors and do not necessarily represent those of their affiliated organizations, or those of the publisher, the editors and the reviewers. Any product that may be evaluated in this article or claim that may be made by its manufacturer is not guaranteed or endorsed by the publisher.
Research integrity at Frontiers
Learn more about the work of our research integrity team to safeguard the quality of each article we publish.