 Daniel S. Gareau1*†Nicholas RochaKim2Arnab Choudhury2
 Michael Bamkole2Matija Snuderl3Julia Zou1
 Anna Yaroslavsky4Steven L. Jacques5
 Sidney Strickland6James G. Krueger1
 Hyung Jin Ahn2,7*†
- 1Laboratory of Investigative Dermatology, The Rockefeller University, New York, NY, United States
- 2Department of Pharmacology, Physiology and Neuroscience, Rutgers-New Jersey Medical School, Newark, NJ, United States
- 3Department of Pathology, NYU Langone Health and Grossman School of Medicine, New York, NY, United States
- 4Department of Physics and Applied Physics, University of Massachusetts, Lowell, MA, United States
- 5Department of Bioengineering, University of Washington, Seattle, WA, United States
- 6Laboratory of Neurobiology and Genetics, The Rockefeller University, New York, NY, United States
- 7Brain Health Institute, Rutgers University, Piscataway, NJ, United States
Many Alzheimer’s disease (AD) patients suffer from altered cerebral blood flow and damaged cerebral vasculature. Cerebrovascular dysfunction could play an important role in this disease. However, the mechanism underlying a vascular contribution in AD is still unclear. Cerebrovascular reactivity (CVR) is a critical mechanism that maintains cerebral blood flow and brain homeostasis. Most current methods to analyze CVR require anesthesia which is known to hamper the investigation of molecular mechanisms underlying CVR. We therefore combined spectroscopy, spectral analysis software, and an implantable device to measure cerebral blood volume fraction (CBVF) and oxygen saturation (SO2) in unanesthetized, freely-moving mice. Then, we analyzed basal CBVF and SO2, and CVR of 5-month-old C57BL/6 mice during hypercapnia as well as during basic behavior such as grooming, walking and running. Moreover, we analyzed the CVR of freely-moving AD mice and their wildtype (WT) littermates during hypercapnia and could find impaired CVR in AD mice compared to WT littermates. Our results suggest that this optomechanical approach to reproducibly getting light into the brain enabled us to successfully measure CVR in unanesthetized freely-moving mice and to find impaired CVR in a mouse model of AD.
1. Introduction
Cerebral perfusion is tightly regulated in response to ischemia or metabolic demand, and proper regulation of cerebral perfusion is therefore a fundamental property of cerebral blood vessels. Cerebrovascular reactivity (CVR) is a primary mechanism that enables adjustment of cerebral blood flow to maintain proper metabolic supply for brain tissues and is coordinated by the interaction of neurons, glia, endothelium, smooth muscle cells, and pericytes (Girouard and Iadecola, 2006). The partial pressure of arterial carbon dioxide (PaCO2) is the most potent vascular factor which can induce CVR (Perry et al., 2014). Increased PaCO2 (hypercapnia) causes dilation of cerebral arteries and arterioles and leads to an increase in cerebral blood flow (CBF). Impaired CVR has been implicated in Alzheimer’s disease (AD) (Iadecola, 2004; Hardee and Zagzag, 2012). AD patients show decreased cerebral hemoglobin oxygen saturation (SO2) during verbal fluency tasks (Hock et al., 1997) and a failure of CBF increase during visual stimulus tests (Mentis et al., 1996). Impaired CO2 vasoreactivity is associated with cognitive deficits in hypertension patients (Hajjar et al., 2014), and blood oxygenation level-dependent (BOLD) functional Magnetic Resonance Imaging (fMRI) study showed impaired CVR to hypercapnia in patients with AD and amnestic mild cognitive impairment (MCI) patients (Cantin et al., 2011). However, several studies also showed that CVR to hypercapnia did not differ between AD and age-matched healthy control subjects (Kuwabara et al., 1992; Jagust et al., 1997; Rodell et al., 2012). Furthermore, a recent study using a mouse model of AD, J20-hAPP, showed that blood volume in the brains of AD mice under hyperoxia was substantially enhanced compared to wildtype (WT) controls (Shabir et al., 2020). Therefore, more studies are required to understand the mechanism of the impairment of CVR in AD.
Several diagnostic modalities, including fMRI (Stobart et al., 2023), and laser Doppler flowmetry (LDF; Park et al., 2014; Munting et al., 2021) have been used to measure vascular reactivity in animal studies and patients. In animal studies, these techniques require anesthesia in order to minimize movement artifacts, which prevents analysis of cerebral perfusion during the animals’ movement. In addition, most anesthetic agents including isoflurane and ketamine, are known to significantly modulate or inhibit vascular smooth muscle cell function (Akata et al., 2001, 2003; Akata, 2007; Masamoto and Kanno, 2012), leading to modified cerebrovascular function. Compared to fMRI, fiberoptic spectroscopy is inexpensive and portable and offers a higher temporal resolution. While the Near-Infrared light (650–950 nm) used in fNIRS is capable of penetrating several centimeters through brain tissue to capture human brain structures accurately (Min et al., 2017; Pinti et al., 2020), we chose a relatively narrow spectral range (540–650 nm) because the penetration is more superficial (~0.39 mm due to higher scattering) and our chosen range contains not only multiple isobestic points in the hemoglobin absorption spectra for oxygenated vs. de-oxygenated around 550 nm, but also a point around 640 nm where absorption by oxyhemoglobin is 10-fold lower than absorption by deoxyhemoglobin. Our method offers measurement in a banana-shaped volume between a source fiber that illuminates the brain surface and a radially-displaced detector fiber (see Supplementary Figure 1). As a result, visible light spectroscopy can provide a more precise measurement for small mouse brains than fNIRS. With deeper implantation of the probe fibers, cerebrovascular measurements of deep brain regions, such as the hypothalamus or amygdala, in response to complex behavioral tasks will be possible with our approach.
The ability to study cerebrovascular reactivity in freely moving animals without anesthesia could greatly contribute to a more accurate understanding of oxygen needs, minimize stress, and enable the analysis of cerebrovascular changes during the behavior of animals in various animal models of neurological disorders. In order to overcome these limitations, we developed a device and method for measuring cerebral blood volume fraction (CBVF), the percent volume of blood in the measured volume of brain tissue, and oxygen saturation (SO2), the ratio of oxygenated hemoglobin to total hemoglobin, in freely moving animals using fiberoptic spectroscopy. Cerebrovascular tone and cerebral blood oxygen level are critical parameters of cerebral circulation that can be measured with CBVF and SO2 using visible-light diffuse-reflectance spectroscopy. These measurements depend on the balance of blood flow and oxygen consumption by the tissue, making them attractive candidates to monitor cerebral circulation as used in functional magnetic resonance imaging (fMRI) and functional near-infrared spectroscopy (fNIRS). The measurement of CBVF is closely linked to cerebrovascular reactivity in the brain. When exposed to hypercapnic conditions, blood vessels in the brain dilate to match the tissue’s increased demand for blood, a process known as CVR to CO2. One way to investigate CVR is by measuring the changes in CBF or cerebral blood volume (CBV) induced by vasodilation (Grubb et al., 1974; Sleight et al., 2021). In this study, we measured the change of CBVF and SO2 as a percentage in tissue during hypercapnia, which can indicate cerebrovascular reactivity events. Furthermore, we examined CBVF and SO2 during rest and running of animals using the rotarod test, as CVR has been linked to physical exercise (Braz and Fisher, 2016; Miller and Mitra, 2017; Steventon et al., 2020).
2. Materials and methods
2.1. System and computational method of fiberoptic measurement
A white light source (HL-2000-HP, Ocean Optics) illuminated the cerebral cortex through an illumination fiber bundle of 8 fibers (FG105UCA, Thorlabs) in 7-around-1 mated to a solid core fiber in the tip (FT400UMT, Thorlabs), or a solid core plastic polymer fiber (DIY-Fiber-500, Prizmatix) mated to the same fiber material in the tip, while an identical detection fiber tip and bundle directed the measured diffuse reflectance to a spectrometer (HDX, Ocean Optics). Our system was controlled through Matlab (Mathworks) software by a laptop computer running Windows 10. Spectra were fit for real-time readout of CBVF and SO2 on the perioperative laptop during experimentation. The graphic user interface is provided in Supplementary material. The sampling rate of the spectroscopic measurement (generally ~1 Hz) is set and determined by the spectrometer integration time, which is automatically set over iterative measurements during spectroscopy to achieve a signal that is in the high, but not saturated region of between 70% and 90% of the spectrometers’ specified saturation level.
2.2. Spectroscopy
Calibration spectra C(λ) were acquired using measurements of a 99% reflectance standard (AS-011XX-X60, Labsphere, North Sutton, NH) while holding the fiber probe 3 cm from the standard. The dark noise of the spectrometer was also measured (dark) with the illumination lamp off. Calibrated spectral measurements M(λ) of tissue were calculated from the raw tissue spectral measurements R(λ) and the calibration measurements C(λ) according to Equation 1. Measured spectra depended on the spectra of the light source and the detector sensitivity but these factors were canceled by the normalization:
A theoretically predicted spectral measurement Mp(λ) was created by multiplying the predicted reflectance, Rp(λ), by a scaling factor K: Mp(λ) = KRp(λ) as in equation 12, below. Least squares minimization between Mp(λ) and M(λ) specified the endpoint metrics SO2 and CBVF. Equations 3–13 implement diffusion theory (Egan, 1979; Groenhuis et al., 1983a,b; Farrell et al., 1992) to calculate Rp(λ) as adopted from our previous esophagus studies (Gareau et al., 2010; Pham et al., 2011).
Equations 3–12 are implemented in the simulated diffuse reflectance spectrum in the supplementary Matlab spectroscopy code (GUI.m) and the key diffusion parameters are defined in the referenced literature, such as the internal reflection coefficient A for light totally internally reflecting within the media at the media boundary, the equivalent point source depth z0(λ), diffusion constant D(λ) and the effective attenuation coefficient Diffusion theory was considered valid since the 2.5 mm source-detector separation on our probe was large compared to the transport scattering mean free path (MFP’ = 0.39 mm), calculated using scattering spectra (Supplementary Figures 2A,B) and for the least scattering wavelength in our measurement (650 nm). The reduced mean free path (MFP’) is effectively the probing depth of optical penetration.
where “Tissue” denotes the approximate mixed brain tissue type to be 1/3 white matter and 2/3 gray matter as in Equations 14, 15, below.
An internal reflection parameter (A) that accounts for the refractive index mismatch at the boundary between the tissue and the external medium is calculated based on (ri).
Diffuse reflectance (light escaping the tissue surface) emanates as if from an equivalent point source depth (z0) within the tissue.
The diffusion constant (D) is calculated:
The effective attenuation coefficient is derived from the diffusion constant and the absorption.
The Greens function describing fluence at a point separated from the source fiber by a distance (r) uses two geometrical factors (r1) and (r2).
Two other variables— —are needed to calculate the diffuse reflectance.
The predicted fiberoptic measurement (Mp) based on diffusion theory is a constant (K) multiplied by the predicted diffuse reflectance Rp .
The fiber separation (distance between the source fiber tip and the detector fiber tip) was r ≈ 0.25 cm, and the refractive index mismatch between glass (nglass = 1.52), or plastic polymer fiber (npolymer = 1.49) and tissue (ntissue = 1.4) was n = nglass/ntissue = 1.09 or n = npolymer/ntissue = 1.06 μa(λ) and μs’(λ) were the absorption and reduced scattering coefficients of the tissue, respectively. The spectral absorption coefficient, μa(λ), was calculated as a weighted sum of the absorption spectra of oxygenated whole blood [μa_oxy(λ)], deoxygenated whole blood [μa_deoxy(λ)], and water [μa_water(λ)], according to Equation 13:
2.3. Calculation of fitting parameters to quantify SO2 and CBVF
Spectra were analyzed in the range 540 to 650 nm by least-squares fitting. The rationale for this wavelength range is that the optical penetration is restricted to the superficial brain layers including the cortex and that the range includes multiple isosbestic points of the hemoglobin absorption curve so it is rich in information content regarding hemoglobin saturation. Regarding the superficial penetration, our visible light at approximately 600 nm penetrated to a depth of the MFP, which is 0.39 mm (Equation 2) whereas optical scattering properties of mouse brain tissue at the 950 nm near infrared wavelength are less diffusing, with a deeper sampling (Min et al., 2017).
The difference between M (Eq. 1) and Mp = KRp (see Eq. 12) was minimized by adjusting Mp using a multidimensional unconstrained nonlinear minimization method (Nelder–Mead), the fminsearch() in Matlab. Fitting adjusted 3 variables: CBVF, SO2, and K where CBVF = 1 specifies 150 g/L hemoglobin. W, the fractional tissue water content, was fixed at an assumed value of 0.78, which has been reported for the mouse cortex (Nakamura et al., 2004). Absorption due to water was minimal. For example, at 650 nm, low CBVF = 0.01 and SO2 = 0.5, the absorption coefficient in the tissue due to the presence of blood is μa_blood = CBVF×SO2 × μa_oxy + CBVF×(1-SO2) × μa_deoxy = 0.1103 cm−1. μa_water = 0.0025 cm−1, which is 44-fold lower than μa_blood.
The absorption of the tissue due to blood was specified by the fitting described above while the scattering optical properties (scattering coefficient μs(λ) [cm−1] and scattering anisotropy g(λ) [−]), which were constant across all experiments, were spectral functions (λ) fit to the previous measurements of fresh human brain tissue (Yaroslavsky et al., 2002). Thus to specify tissue scattering properties, μs(λ) and g(λ) were used as interpolated functions of wavelength (Equations 14, 15) that, in combination yielded the reduced scattering coefficient, μs’(λ) = μs(λ) × (1 − g(λ)) used in Equation 5. These optical properties agree reasonably with the literature (Yaroslavsky et al., 2002; Jacques, 2013), such as our previous data (Yaroslavsky et al., 2002) that can be fit for the reduced scattering coefficients of gray and white matter as shown in Supplementary Figure 2C.
2.4. Brain optical scattering properties
Supplementary Figure 2 shows the brain scattering properties specified by the spectral data from Yaroslavsky et al., 2002 (Yaroslavsky et al., 2002). Supplementary Figures 2A,B show the spectral behavior of the scattering coefficient (μs) and the anisotropy of scattering (g). The combination of μs and g yields the reduced scattering coefficient [μs’ = μs(1 − g)] shown in Supplementary Figure 2C for white and gray matter. Scattering properties of whole tissue were set as a weighted-sum based on a 1:2 ratio of white to gray matter, as reported (Zhang and Sejnowski, 2000) for the mouse cortex.
The μs’(λ) spectrum was assumed when using least-square fitting of the data to specify K, CBVF, and SO2. After spectral fitting, the values for CBVF and SO2 were output as a function of time over time periods where spectroscopic measurements were made on mice under various experimental conditions. These optical properties were also used to model the photon transport in the mouse brain.
2.5. Fabrication of fiberoptic probe with surgically implantable, magnetically-coupled tip
The connection between the mouse brain and the spectrometer consisted of an implanted brain probe (~1 cm fiber) and a spectrometer connector (~2 m fiber). The connector (Figure 1A) is fiber-optically coupled to the illumination source and the spectrometer and opto-magnetically coupled to the brain probe, which is fiber-optically coupled to the brain. Plastic connectors were 3D-printed using a 3D Systems ProJet printer and VisiJet M3 Crystal material. Mating surfaces were 3D-printed facing upward (opposite the print bed) to minimize warp and maximize surface flatness. The plastic connector design was optimized to align and hold (press fit) two ceramic ferrule cannulas (CF440-10, Thor Labs, Newton NJ) and two cylinder magnets (D12-N52, K&J Magnetics, Plumsteadville PA).
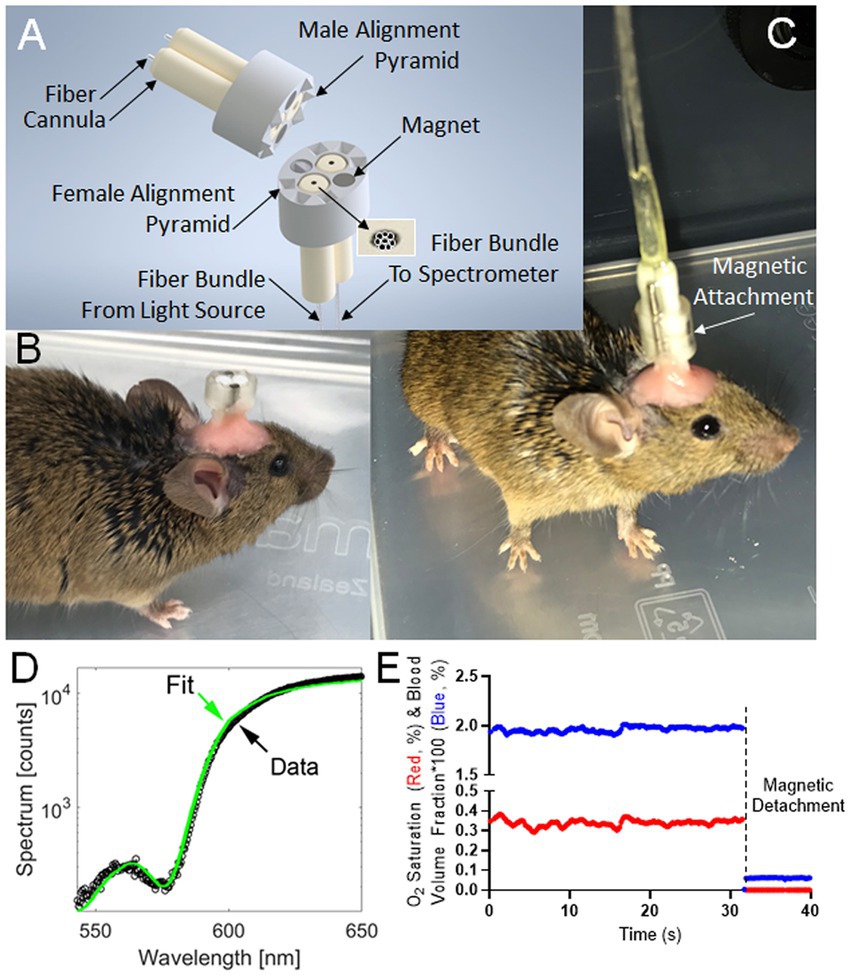
Figure 1. Instrumentation and typical readout for Fiberoptic cerebral oximetry in freely moving mice. (A) 3D model of the magnetic-coupled probe. Six male/female mating pyramid pairs secure the detachable, implantable brain probe into a linking connector with mating female pyramid components to enable fiberoptic alignment. (B) Surgically-implanted brain probe. (C) Brain probe connected to a spectrometer. (D) Spectral fitting in <0.25 s yielding instantaneous measurements of the percentages of CBVF and SO2 in the 540 nm to 650 nm range chosen to contain 3 isosbestic points of hemoglobin spectral absorption alongside an anchoring wavelength (650 nm) of differential absorption. (E) Typical time-course measurement over resting behavior and decoupling event corresponding to magnetic probe detachment. The graph shows cerebral blood volume fraction (blue) times 100 such that a y-axis value of 1 means 1% blood volume fraction and the oxygen saturation fraction (red), which is the fraction of hemoglobin molecules bound to oxygen within the cerebral probed volume.
During assembly, the connector’s flat surface was pressed against the glass, and the ferrules and magnets were inserted and also pressed against the glass for alignment (friction fit). The male side connector was fabricated using a similar process of press-fitting the cannulae and magnets, but the assembly was pressed against an alignment tool (see Supplemental material), instead of the flat glass plate. The connector was then mated to its probe with magnetic attachment, and pre-polished fibers (FT400UMT, Thor Labs, Newton NJ) were inserted into the ferrules and affixed using UV-cure adhesive (#68, Norland Products, Cranbury NJ). After drying, the protruding fibers were clipped and polished to a length of 0.5 mm protruding from the cannulas using a custom polishing tool set. The CAD file of a polishing toolset is available in the repository at Rutgers University Libraries.1
In order to maintain alignment, so that the fibers in the brain probe and spectrometer connector mated precisely, the brain probe surface was printed with 6 small 4-sided pyramids while the connector surface was printed with complementary mating holes. This design configuration enabled the secure mating of the two connecting parts during measurements. Finished fiber probes were visually inspected under a 20X stereomicroscope for polish level and analyzed through a series of signal and noise tests using the spectroscopy probe in a dark room and the light source targeted at human skin.
The quantitative performance parameter for magnetic coupling was the amount of white light that leaked directly from the source fiber bundle to the detector fiber bundle. This amount defined the noise and was measured with the surgically-implantable tip magnetically coupled and the illumination light going from it toward the Vantablack target in a dark room. The quantitative spectrometer readout, in counts, was read out (R1) at the 650 nm wavelength. A second count readout (R2) was measured with the probe contacting human skin. The ventral skin surface is less pigmented and the easily accessible, finger pad has little unwanted influence of melanin. The signal-to-noise ratio was then [R1 – R2]/R1 and the manufacturing quality control threshold was set as a 60-1 signal-to-noise ratio so that, as a first-order approximation, an extra 1/60th of an optical measurement of the brain consisting of leaked white light would erroneously decrease the absolute CBVF no more than 100%/60 = 1.6%.
2.6. Analysis of cerebrovascular reactivity in freely moving mice
5-month-old C57BL/6 mice (The Jackson Laboratory) were used to measure basal cerebrovascular dynamic properties of the cortex while freely moving. The AD model mice studied were 13-month-old Tg6799, also called 5xFAD (Jackson Laboratory) double transgenic mice overexpressing both human amyloid precursor protein (APP) gene with KM670/671/NL, V717I, and I716V mutations and human presenilin 1 (PSEN1) harboring M146L and L286V mutations under the Thy1 promoter (Oakley et al., 2006). Wildtype (WT) littermates were used as controls. Only male mice were used in experiments. All mice were maintained on a 12-h light/dark cycle and given ad lib access to irradiated mouse chow and water for the duration of the experiment. All experiments were done according to policies on the care and use of laboratory animals of the Ethical Guidelines for Treatment of Laboratory Animals of the NIH. Relevant protocols were approved by the Rockefeller and Rutgers Institutional Animal Care and Use Committee (IACUC).
After anesthesia with isoflurane mixed with pure oxygen (3% isoflurane and 1 L/min oxygen for induction and 1.5% isoflurane and 1 L/min oxygen for maintenance), mice were mounted on a stereotactic frame. After the removal of hair over the scalp, the scalp was cleaned with sterile alcohol and Betadine three times. We performed a minimal-sized midline scalp incision (~5 mm). We then drilled two small holes in the skull using a 0.7 mm diameter stainless steel micro drill burr (Fine Science Tools). The coordinates of the two holes in reference to Bregma were anterior = −1 mm, lateral = 1.5 mm and anterior = −3.5 mm, lateral = 1.5 mm. Brain probes were fitted to the holes and immobilized using dental cement. The skin incision was sutured and animals were monitored throughout the recovery period. A week after surgery, mice were placed into a chamber (22.8 cm × 20.3 cm × 15 cm) and we measured cerebral perfusion in the freely moving state.
For the free moving recording study, we allowed the animal to freely move in an open field and measured CBVF and SO2 while video recording the animal. After the measurement, we classified the animal activity seen in the video recording as grooming, resting, or walking activity. In order to assert more control over animal behavior during fiberoptic measurements, we measured CBVF and SO2 during an accelerating rotating rod (Rotarod) behavior test. For the Rotarod behavior test, we allowed the animal to rest on the Rotarod device for 60 s and then started the device for 180 s. The initial speed during the running period was set to 1 rpm and ramped up to 10 rpm over 60 s, staying at the top speed for another 120 s. After the 180 s running period, the animal was allowed to rest for 120 s for a total measurement period of 360 s. For the hypercapnia study, we injected 10%CO2/10% O2/80%N2 mixture into the induction chamber and measured changes in CBVF and SO2 during and after hypercapnia.
3. Results
3.1. Development of fiberoptic cerebral oximetry in freely moving mice
To investigate cerebrovascular changes in freely moving mice, we developed a connection between the mouse brain and the spectrometer consisting of an implanted brain probe (~1 cm fiber) and a spectrometer connector (~2 m fiber). The device (Figure 1A) fiber-optically coupled the brain to the light source and the spectrometer when magnetically coupled but could be detached so that the probe could be surgically implanted before surgical recovery and subsequent measurement during normal behavior (Figures 1B,C). After recovery and attachment, spectral measurements were analyzed by least-square fitting to light transport theory (Figure 1D) to specify the instantaneous SO2 and CBVF (Figure 1E). These values were significantly changed when decoupling event corresponding to magnetic probe detachment (Figure 1E).
Fiber spectroscopic measurement of CBVF and SO2 in mixed arterial and venous blood of the cortex of freely moving 5-month-old C57BL/6 mice yielded values of ~1.9% and ~35%, respectively (Figure 2A). We were interested in the effect of animal behavior on measurements of CBVF and SO2 from the fiberoptic device. To investigate these effects, we measured CBVF and SO2 in our free moving experiment and tracked the time that each animal was exhibiting grooming, resting, and walking behavior over the course of the measurements (Figure 2B). We found that there was no significant difference in average CBVF and SO2 values between the three classifications of behavior.
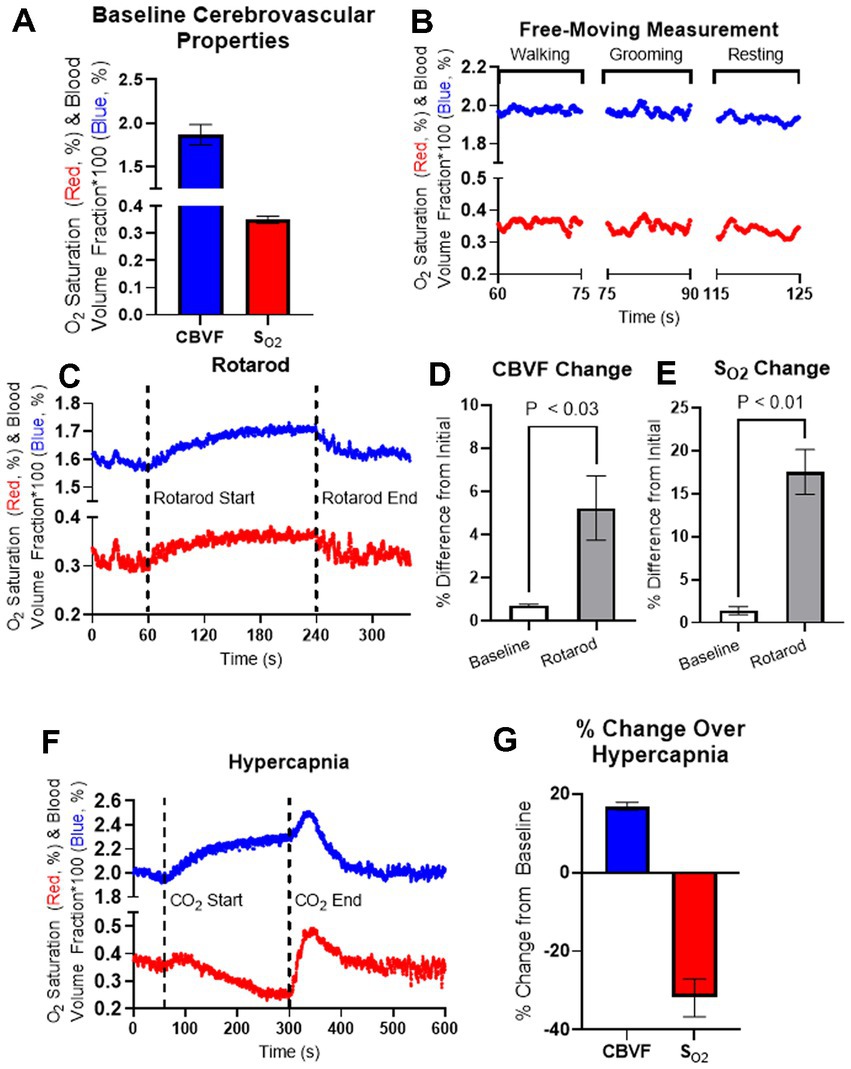
Figure 2. Fiberoptic measurement of 5-month-old C57BL/6 mice during the behavior and hypercapnia. (A) Averaged baseline CBVF and SO2 measurements of 5-month-old C57BL/6 mice (n = 4). (B) Representation for cerebrovascular changes during activity classified as either walking, grooming, or resting during a measurement of a freely moving, 5-month-old C57BL/6 mouse. (C) Cerebrovascular responses in 5-month-old mice were obtained using fiberoptic spectroscopy during Rotarod experiments. Running behavior was induced by the Rotarod device at 60 s and stopped at 240 s as the animal was allowed to rest until 360 s. (D,E) The average values of CBVF and SO2 during 60 s of basal measurement as well as the maximum values of CBVF and SO2 over the running period of the experiment were measured as a percent change from the average CBVF and SO2 values of the first 10 s measurement. (D) The percent change of the maximum CBVF value over the running period was found to be significantly higher than basal measurement (p < 0.03, n = 4). (E) The percent change of the maximum SO2 value over the running period was also found to be significantly higher than basal measurement (p < 0.01, n = 4). (F) Cerebrovascular responses in 5-month-old freely moving mice were obtained using fiberoptic spectroscopy during hypercapnia. Hypercapnia was induced at 60 s by increasing CO2 concentration up to 10% and was kept until releasing CO2 at 300 s. (G) Maximum CBVF and minimum SO2 over the course of hypercapnia were measured as a percent change from the baseline averages. Bar graphs represent mean ± s.e.m.; n = 4; statistical analyses were performed using two tailed unpaired t-test.
In order to have more control over animal behavior exhibited over the course of fiberoptic measurement, we measured CBVF and SO2 in our accelerating rotarod experiment to control running and resting behavior in the mice. During the accelerating rotarod experiment, CBVF and SO2 measurements were taken over 360 s where the animal rested for the first 60 s, ran for the next 180 s, and then rested again for the final 120 s (Figure 2C). In order to understand the effects of running on CBVF and SO2, the average baseline CBVF and SO2 values over the first 60 s of rest and the maximum CBVF and SO2 values over the course of the running period were projected as the percent of change as compared to the average CBVF and SO2 values of the first 10 s of the beginning of the test. We found a significant increase in the percent change of the maximum CBVF (5.2 ± 1.5%) and SO2 (17.5% ± 2.6%) values over the course of the running period as compared to the percent change of the average CBVF and SO2 values of the baseline (Figures 2D,E). Our results suggest that minor behavior changes such as walking and grooming do not significantly affect the cerebrovascular properties measured by our device, but constant exercise such as running on the rotarod significantly increase CBVF and SO2.
To investigate the change in CBVF and SO2 of the cortex during hypercapnia in the mouse cortex, we placed mice in an insulated chamber and increased CO2 concentration up to 10%. When hypercapnia was induced after 60 s of baseline measurement by increasing CO2 concentration, we found an increase in CBVF (16.9 ± 1.0%), which is a typical hyperaemic response to increased CO2 through vasodilation. SO2 decreased (−31.8% ± 2.4%) slowly during hypercapnia but normalized rapidly after stopping CO2 injection and releasing CO2 at 300 s, while CBVF increased before returning to a basal level (Figures 2F,G).
3.2. Impaired cerebrovascular reactivity in freely moving AD mice
To investigate the cerebrovascular properties of AD (Tg6799) mice, we measured the baseline of CBVF and SO2 of the cortex of freely moving 13-month-old Tg6799 mice and wild-type (WT) littermates and also analyzed the difference in vascular reactivity between Tg6799 mice and WT littermates during and after hypercapnia using fiberoptic spectroscopy (Figures 3A,B). While there was no difference in the baseline of CBVF and SO2 between the two groups (Figures 3C,D), the increase of CBVF of the cortex of AD mice during hypercapnia was significantly higher than that of WT littermates (Figure 3E). In addition, although not statistically significant, there was a strong tendency of delayed recovery time to the baseline of CBVF of AD mice in comparison to WT littermates (Figure 3F).
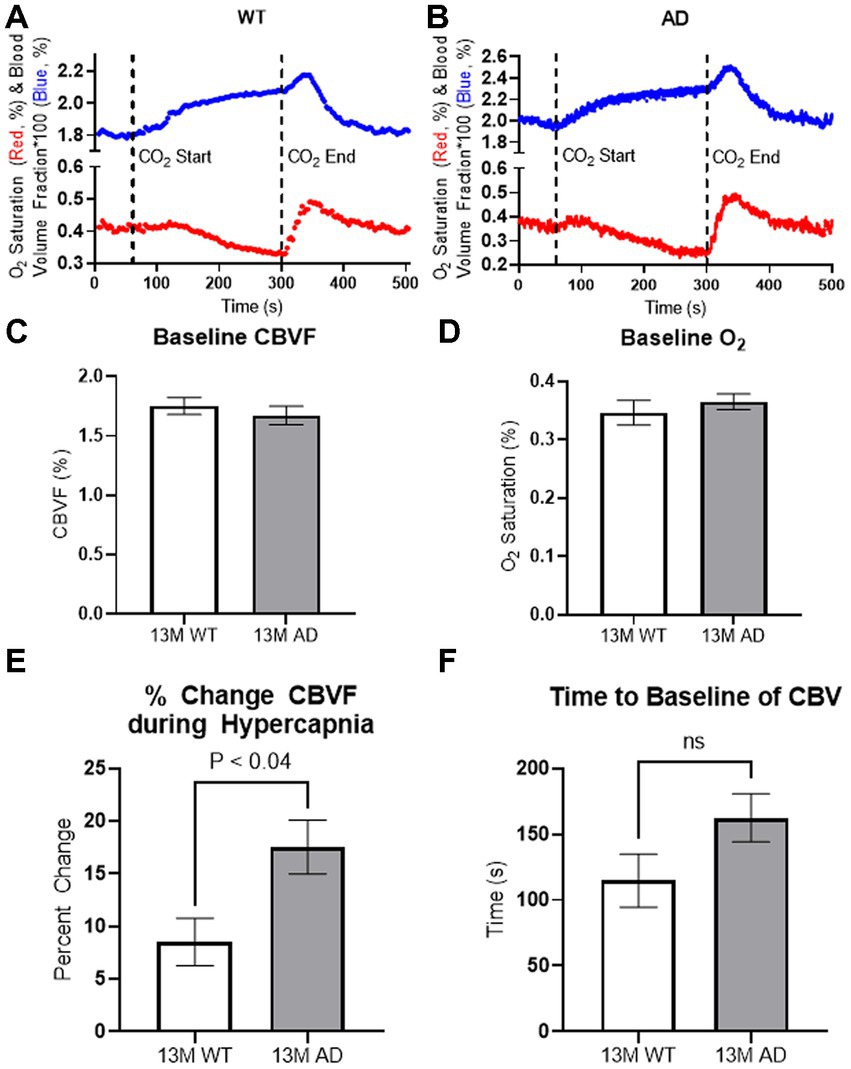
Figure 3. In vivo spectroscopy results. (A,B) Representation for cortical vascular reactivity of WT littermate (A) and Tg6799 13-month-old mice (B) during hypercapnia was analyzed using fiberoptic spectroscopy. Hypercapnia was induced at 60 s by increasing CO2 concentration up to 10% and was kept until releasing CO2 at 300 s. (C,D) 13-month-old Tg6799 mice and WT littermates showed similar levels of basal oxygen saturation (D) and cerebral blood volume fraction (CBVF) (C) in the cortex. (E) The increase of CBVF during the hypercapnia was significantly higher in Tg6799 mice compared to WT littermate (p < 0.04, n = 4 AD, 4 WT). (F) There is a tendency of delayed time to the baseline of CBVF after hypercapnia in Tg6799 mice, but it is not statistically significant (n = 4 AD, 4 WT). Bar graphs represent mean ± s.e.m.; n = 4 AD, 4 WT; analyzed by two tailed unpaired t-test.
To assess longitudinal measurement and repeatability, we performed several measurements over time in the same animal and found that repeated measurements were stable between 1 and 3 weeks after the brain probe implantation surgery. Supplementary Figure 3 shows repeated measurements from one 5-month-old animal (Supplementary Figures 3A,B). Fiberoptic measurements with hypercapnia-induced vasodilation were also taken at 1 and 3 weeks postsurgery, and show similar responses to hypercapnia conditions between the two time points (Supplementary Figures 3C,D). These results suggest that the longitudinal measurement of basal level cerebrovascular properties and hypercapnia-induced cerebrovascular change are stable.
4. Discussion
Fiberoptic spectroscopy can assess the SO2 and the CBVF in the brains of freely moving mice when implemented with a magnetic coupling tip. The present study showed that our fiberoptic method detected changes in freely moving mice and measured cerebrovascular impairment in a mouse model of AD. Previous studies on SO2 in the cortex of anesthetized rodents (Vovenko, 1999; Sakadžić et al., 2010) have demonstrated that SO2 or oxygen partial pressure (pO2) exhibits high heterogeneity based on the types of blood vessels, such as arterioles, venules, and capillaries. Moreover, Sakadzic et al. observed a decline in vascular pO2 with an increase in cortical depth. Considering that our device measured mixed arterial and venous blood of the cortex at a depth of 0.3–0.7 mm (Supplementary Figure 1), the 30%–40% SO2 measurement in the cerebral blood of mice is comparable to that of previous studies. The average CBVF of 5-month-old C57BL/6 mice was ~1.9% (Figure 2A) and CBVF of 13-month-old Tg6799 (C57BL/6 background) was ~1.7% (Figure 3C). This range from 1.7% to 1.9% in our results is slightly less than the range reported in other literature: 2.1% reported by Synchrotron Radiation Quantitative Computed Tomography in the parietal cortex (Adam et al., 2003), 2.03%–3.14% reported by MRI in the cortex (Dunn et al., 2004; Huang et al., 2013; Han et al., 2015), 2.0%–2.4% reported by multiphoton laser scanning microscopy and in the capillary-rich cerebral cortex (Verant et al., 2007). One possible reason is that we measured CBVF of 5- and 13-month-old mice, instead of young rodents (4–8 weeks old), which other studies mainly used (Dunn et al., 2004; Verant et al., 2007; Huang et al., 2013; Han et al., 2015). Another possible reason is that large blood vessels on the surface of the brain such as meningeal vessels were excluded from our assessment because our fibers were implanted ~0.3 mm below the skull, which can be seen in our immunohistochemical staining of a surgery mouse brain with antibodies against collagen and DAPI staining (Supplementary Figure 1B).
Several previous studies have explored the development of devices for monitoring cerebrovascular properties in freely-moving animals, including head-mounted microscope devices (Sigal et al., 2016; Senarathna et al., 2019). While the miniature multi-contrast microscope developed by the Pathak group provides high spatio-temporal resolution of cerebral blood flow (CBF) and cerebral blood volume (CBV) combined with several advanced technologies in freely moving mice (Senarathna et al., 2019), our system offers greater freedom of movement for the animals (Supplementary Video 1), enabling us to measure SO2 and CBVF during a wider range of behavior tests, such as the rotarod, and objective recognition tests. Furthermore, our device provides specific SO2 and CBVF values for targeted brain regions, enabling investigation of age-dependent changes and differences between animal models. In contrast to head-fixed mouse approaches, our system permits cerebrovascular measurements of deeper brain regions, such as the thalamus or striatum, through deeper implantation of the probe fibers. However, a current limitation of our device is its lower spatial resolution, which will need to be improved in future studies.
Tg6799 mice start to develop amyloid plaque deposits by 2 months of age (Oakley et al., 2006) and show a substantial amount of amyloid plaque deposits and cerebral amyloid angiopathy in their cortex (Ahn et al., 2014). In addition, recent dynamic susceptibility contrast-enhanced (DSC) MRI analysis showed increased vasodilation in 12-month-old Tg6799 mice compared to littermate control, in response to contrast injection (Tataryn et al., 2021). Contrast injection to the lateral tail vein increases systemic blood pressure and might induce a similar vascular effect from hypercapnia. This result is quite similar to the current study showing increased vascular reactivity in Tg6799 mice. The study using another AD mouse model, J20-hAPP, also showed increased vasodilation in the brains of AD mice under hyperoxia compared to WT controls (Shabir et al., 2020). Although cerebral hypoperfusion is typically observed in advanced AD patients (Du et al., 2006; Austin et al., 2011), an increase in cerebral perfusion was also seen in some cases of early AD patients (Alsop et al., 2008; Luckhaus et al., 2008; Ding et al., 2014). Integrating several studies of cerebral blood flow (CBF) in AD patients suggests that there is cerebral hyperperfusion in early disease followed by hypoperfusion later in the disease (Chen et al., 2011; Østergaard et al., 2013). In AD patients, as the disease progresses, severe neuronal cell death and brain atrophy have been widely reported (Raskin et al., 2015; Weiner et al., 2015). However, our AD mouse model (Tg6799) showed very minor neuronal cell death in limited brain areas and no brain atrophy. Therefore, Tg6799 may represent the early stage of the disease, and hyperperfusion of this mouse model could be relevant to early AD patients.
Though reliable SO2 and CBVF values over longitudinal measurements have been shown here, another limitation is the lack of validation of absolute estimates of these parameters across animal models, and results thus far may be subject to estimation error. Mechanically, our device allows natural animal movement because of the flexibility of our fiber bundle and a video of an exemplary animal’s free movement is provided as Supplementary Video. When animal movement becomes so severe that continued connectivity of the device would become dangerous to the animal, our magnetic detachment clean break-away protects the animal and therefore measurement integrity of future measurements. Figure 1E shows the distinction between resting fit measurements and the fitting result when the magnetic attachment (which assures fit quality) has been broken. This fiberoptic method may improve understanding of the mechanisms of impaired vascular reactivity in AD. Our vasculature and hemodynamic measurements raise the question as to whether the observed phenomena are consequences of the pathology or more fundamental changes that are required for disease progression. We hope to explore these temporal measurements in future work, potentially combining CBVF and SO2 with time-differential mathematics to access perfusion and oxygen consumption parameters.
Data availability statement
The datasets presented in this study can be found in online repositories. The names of the repository/repositories and accession number(s) can be found at: https://scholarship.libraries.rutgers.edu/esploro/outputs/technicalDocumentation/Code-data-and-materials-for-fiberoptic/991031663984304646?institution=01RUT_INST.
Ethics statement
The animal study was reviewed and approved by Rutgers University and Rockefeller University.
Author contributions
DG, NR, AC, MB, JZ, and HA performed the experiments. DG, NR, AC, AY, SJ, and HA analyzed the data and wrote the manuscript. DG, MS, SS, JK, and HA designed the study. DG and HA participated in the interpretation of data and manuscript preparation. All authors contributed to the article and approved the submitted version.
Funding
Research reported in this publication was supported by the National Institute on Aging of the National Institutes of Health under Award Number RF1AG078245 (HA), by the National Institute of Neurological Disorders And Stroke of the National Institutes of Health under Award Number R01NS104386 (HA), and the Robertson Therapeutic Development Fund (HA). The content is solely the responsibility of the authors and does not necessarily represent the official views of the National Institutes of Health.
Acknowledgments
We thank Dimitris Placantonakis for the helpful discussion, Michael Dietz for experimental assistance, and Tinh Phan for providing a complementary literature references for brain scattering properties measurement. Some content of the manuscript have previously appeared in an open access preprint repository (biorxiv; doi: https://doi.org/10.1101/2021.05.17.444224).
Conflict of interest
The authors declare that the research was conducted in the absence of any commercial or financial relationships that could be construed as a potential conflict of interest.
Publisher’s note
All claims expressed in this article are solely those of the authors and do not necessarily represent those of their affiliated organizations, or those of the publisher, the editors and the reviewers. Any product that may be evaluated in this article, or claim that may be made by its manufacturer, is not guaranteed or endorsed by the publisher.
Supplementary material
The Supplementary material for this article can be found online at: https://www.frontiersin.org/articles/10.3389/fnmol.2023.1163447/full#supplementary-material
Footnotes
1. ^https://scholarship.libraries.rutgers.edu/esploro/outputs/technicalDocumentation/Code-data-and-materials-for-fiberoptic/991031663984304646?institution=01RUT_INST
References
Adam, J. F., Elleaume, H., Le Duc, G., Corde, S., Charvet, A. M., Troprès, I., et al. (2003). Absolute cerebral blood volume and blood flow measurements based on synchrotron radiation quantitative computed tomography. J. Cereb. Blood Flow Metab. 23, 499–512. doi: 10.1097/01.WCB.0000050063.57184.3C
Ahn, H. J., Glickman, J. F., Poon, K. L., Zamolodchikov, D., Jno-Charles, O. C., Norris, E. H., et al. (2014). A novel Abeta-fibrinogen interaction inhibitor rescues altered thrombosis and cognitive decline in Alzheimer's disease mice. J. Exp. Med. 211, 1049–1062. doi: 10.1084/jem.20131751
Akata, T. (2007). General anesthetics and vascular smooth muscle: direct actions of general anesthetics on cellular mechanisms regulating vascular tone. Anesthesiology 106, 365–391. doi: 10.1097/00000542-200702000-00026
Akata, T., Izumi, K., and Nakashima, M. (2001). Mechanisms of direct inhibitory action of ketamine on vascular smooth muscle in mesenteric resistance arteries. Anesthesiology 95, 452–462. doi: 10.1097/00000542-200108000-00030
Akata, T., Kanna, T., Yoshino, J., and Takahashi, S. (2003). Mechanisms of direct inhibitory action of isoflurane on vascular smooth muscle of mesenteric resistance arteries. Anesthesiology 99, 666–677. doi: 10.1097/00000542-200309000-00023
Alsop, D. C., Casement, M., de Bazelaire, C., Fong, T., and Press, D. Z. (2008). Hippocampal hyperperfusion in Alzheimer's disease. Neuroimage 42, 1267–1274. doi: 10.1016/j.neuroimage.2008.06.006
Austin, B. P., Nair, V. A., Meier, T. B., Xu, G., Rowley, H. A., Carlsson, C. M., et al. (2011). Effects of hypoperfusion in Alzheimer's disease. J. Alzheimers Dis. 26, 123–133. doi: 10.3233/JAD-2011-0010
Braz, I. D., and Fisher, J. P. (2016). The impact of age on cerebral perfusion, oxygenation and metabolism during exercise in humans. J. Physiol. 594, 4471–4483. doi: 10.1113/JP271081
Cantin, S., Villien, M., Moreaud, O., Tropres, I., Keignart, S., Chipon, E., et al. (2011). Impaired cerebral vasoreactivity to CO2 in Alzheimer's disease using BOLD fMRI. Neuroimage 58, 579–587. doi: 10.1016/j.neuroimage.2011.06.070
Chen, W., Song, X., Beyea, S., D'Arcy, R., Zhang, Y., and Rockwood, K. (2011). Advances in perfusion magnetic resonance imaging in Alzheimer's disease. Alzheimers Dement. 7, 185–196. doi: 10.1016/j.jalz.2010.04.004
Ding, B., Ling, H. W., Zhang, Y., Huang, J., Zhang, H., Wang, T., et al. (2014). Pattern of cerebral hyperperfusion in Alzheimer's disease and amnestic mild cognitive impairment using voxel-based analysis of 3D arterial spin-labeling imaging: initial experience. Clin. Interv. Aging 9, 493–500. doi: 10.2147/CIA.S58879
du, A. T., Jahng, G. H., Hayasaka, S., Kramer, J. H., Rosen, H. J., Gorno-Tempini, M. L., et al. (2006). Hypoperfusion in frontotemporal dementia and Alzheimer disease by arterial spin labeling MRI. Neurology 67, 1215–1220. doi: 10.1212/01.wnl.0000238163.71349.78
Dunn, J. F., Roche, M. A., Springett, R., Abajian, M., Merlis, J., Daghlian, C. P., et al. (2004). Monitoring angiogenesis in brain using steady-state quantification of DeltaR2 with MION infusion. Magn. Reson. Med. 51, 55–61. doi: 10.1002/mrm.10660
Egan, W. (1979). Optical Properties of Inhomogeneous materials. New York City, New York: Academic Press.
Farrell, T. J., Patterson, M. S., and Wilson, B. (1992). A diffusion theory model of spatially resolved, steady-state diffuse reflectance for the noninvasive determination of tissue optical properties in vivo. Med. Phys. 19, 879–888. doi: 10.1118/1.596777
Gareau, D. S., Truffer, F., Perry, K. A., Pham, T. H., Enestvedt, C. K., Dolan, J. P., et al. (2010). Optical fiber probe spectroscopy for laparoscopic monitoring of tissue oxygenation during esophagectomies. J. Biomed. Opt. 15:061712. doi: 10.1117/1.3512149
Girouard, H., and Iadecola, C. (2006). Neurovascular coupling in the normal brain and in hypertension, stroke, and Alzheimer disease. J. Appl. Physiol. 100, 328–335. doi: 10.1152/japplphysiol.00966.2005
Groenhuis, R. A., Ferwerda, H. A., and Ten Bosch, J. J. (1983a). Scattering and absorption of turbid materials determined from reflection measurements. 1: theory. Appl. Optics 22, 2456–2462. doi: 10.1364/AO.22.002456
Groenhuis, R. A., Ten Bosch, J. J., and Ferwerda, H. A. (1983b). Scattering and absorption of turbid materials determined from reflection measurements. 2: measuring method and calibration. Appl. Optics 22, 2463–2467. doi: 10.1364/AO.22.002463
Grubb, R. L., Raichle, M. E., Eichling, J. O., and Ter-Pogossian, M. M. (1974). The effects of changes in PaCO2 on cerebral blood volume, blood flow, and vascular mean transit time. Stroke 5, 630–639. doi: 10.1161/01.str.5.5.630
Hajjar, I., Marmerelis, V., Shin, D. C., and Chui, H. (2014). Assessment of cerebrovascular reactivity during resting state breathing and its correlation with cognitive function in hypertension. Cerebrovasc. Dis. 38, 10–16. doi: 10.1159/000365349
Han, S. H., Cho, J. H., Jung, H. S., Suh, J. Y., Kim, J. K., Kim, Y. R., et al. (2015). Robust MR assessment of cerebral blood volume and mean vessel size using SPION-enhanced ultrashort echo acquisition. Neuroimage 112, 382–389. doi: 10.1016/j.neuroimage.2015.03.042
Hardee, M. E., and Zagzag, D. (2012). Mechanisms of glioma-associated neovascularization. Am. J. Pathol. 181, 1126–1141. doi: 10.1016/j.ajpath.2012.06.030
Hock, C., Villringer, K., Müller-Spahn, F., Wenzel, R., Heekeren, H., Schuh-Hofer, S., et al. (1997). Decrease in parietal cerebral hemoglobin oxygenation during performance of a verbal fluency task in patients with Alzheimer's disease monitored by means of near-infrared spectroscopy (NIRS)–correlation with simultaneous rCBF-PET measurements. Brain Res. 755, 293–303. doi: 10.1016/S0006-8993(97)00122-4
Huang, S., Kim, J. K., Atochin, D. N., Farrar, C. T., Huang, P. L., Suh, J. Y., et al. (2013). Cerebral blood volume affects blood-brain barrier integrity in an acute transient stroke model. J. Cereb. Blood Flow Metab. 33, 898–905. doi: 10.1038/jcbfm.2013.27
Iadecola, C. (2004). Neurovascular regulation in the normal brain and in Alzheimer's disease. Nat. Rev. Neurosci. 5, 347–360. doi: 10.1038/nrn1387
Jacques, S. L. (2013). Optical properties of biological tissues: a review. Phys. Med. Biol. 58, R37–R61. doi: 10.1088/0031-9155/58/11/R37
Jagust, W. J., Eberling, J. L., Reed, B. R., Mathis, C. A., and Budinger, T. F. (1997). Clinical studies of cerebral blood flow in Alzheimer's disease. Ann. N. Y. Acad. Sci. 826, 254–262. doi: 10.1111/j.1749-6632.1997.tb48477.x
Kuwabara, Y., Ichiya, Y., Otsuka, M., Masuda, K., Ichimiya, A., and Fujishima, M. (1992). Cerebrovascular responsiveness to hypercapnia in Alzheimer's dementia and vascular dementia of the Binswanger type. Stroke 23, 594–598. doi: 10.1161/01.str.23.4.594
Luckhaus, C., Flüß, M. O., Wittsack, H. J., Grass-Kapanke, B., Jänner, M., Khalili-Amiri, R., et al. (2008). Detection of changed regional cerebral blood flow in mild cognitive impairment and early Alzheimer's dementia by perfusion-weighted magnetic resonance imaging. Neuroimage 40, 495–503. doi: 10.1016/j.neuroimage.2007.11.053
Masamoto, K., and Kanno, I. (2012). Anesthesia and the quantitative evaluation of neurovascular coupling. J. Cereb. Blood Flow Metab. 32, 1233–1247. doi: 10.1038/jcbfm.2012.50jcbfm201250 [pii]
Mentis, M. J., Horwitz, B., Grady, C. L., Alexander, G. E., VanMeter, J. W., Maisog, J. M., et al. (1996). Visual cortical dysfunction in Alzheimer's disease evaluated with a temporally graded "stress test" during PET. Am. J. Psychiatry 153, 32–40. doi: 10.1176/ajp.153.1.32
Miller, S., and Mitra, K. (2017). NIRS-based cerebrovascular regulation assessment: exercise and cerebrovascular reactivity. Neurophotonics 4:041503:1. doi: 10.1117/1.NPh.4.4.041503
Min, E., Ban, S., Wang, Y., Bae, S. C., Popescu, G., Best-Popescu, C., et al. (2017). Measurement of multispectral scattering properties in mouse brain tissue. Biomed. Opt. Express 8, 1763–1770. doi: 10.1364/BOE.8.001763
Munting, L. P., Derieppe, M., Suidgeest, E., Hirschler, L., van Osch, M. J., Denis de Senneville, B., et al. (2021). Cerebral blood flow and cerebrovascular reactivity are preserved in a mouse model of cerebral microvascular amyloidosis. Elife 10:e61279. doi: 10.7554/eLife.61279
Nakamura, T., Xi, G., Hua, Y., Schallert, T., Hoff, J. T., and Keep, R. F. (2004). Intracerebral hemorrhage in mice: model characterization and application for genetically modified mice. J. Cereb. Blood Flow Metab. 24, 487–494. doi: 10.1097/00004647-200405000-00002
Oakley, H., Cole, S. L., Logan, S., Maus, E., Shao, P., Craft, J., et al. (2006). Intraneuronal beta-amyloid aggregates, neurodegeneration, and neuron loss in transgenic mice with five familial Alzheimer's disease mutations: potential factors in amyloid plaque formation. J. Neurosci. 26, 10129–10140. doi: 10.1523/JNEUROSCI.1202-06.2006
Østergaard, L., Aamand, R., Gutiérrez-Jiménez, E., Ho, Y. C., Blicher, J. U., Madsen, S. M., et al. (2013). The capillary dysfunction hypothesis of Alzheimer's disease. Neurobiol. Aging 34, 1018–1031. doi: 10.1016/j.neurobiolaging.2012.09.011
Park, L., Koizumi, K., el Jamal, S., Zhou, P., Previti, M. L., van Nostrand, W. E., et al. (2014). Age-dependent neurovascular dysfunction and damage in a mouse model of cerebral amyloid angiopathy. Stroke 45, 1815–1821. doi: 10.1161/STROKEAHA.114.005179
Perry, B. G., Lucas, S. J., Thomas, K. N., Cochrane, D. J., and Mundel, T. (2014). The effect of hypercapnia on static cerebral autoregulation. Physiol. Rep. 2:e12059. doi: 10.14814/phy2.12059
Pham, T. H., Perry, K. A., Enestvedt, C. K., Gareau, D., Dolan, J. P., Sheppard, B. C., et al. (2011). Decreased conduit perfusion measured by spectroscopy is associated with anastomotic complications. Ann. Thorac. Surg. 91, 380–385. doi: 10.1016/j.athoracsur.2010.10.006
Pinti, P., Tachtsidis, I., Hamilton, A., Hirsch, J., Aichelburg, C., Gilbert, S., et al. (2020). The present and future use of functional near-infrared spectroscopy (fNIRS) for cognitive neuroscience. Ann. N. Y. Acad. Sci. 1464, 5–29. doi: 10.1111/nyas.13948
Raskin, J., Cummings, J., Hardy, J., Schuh, K., and Dean, R. A. (2015). Neurobiology of Alzheimer's disease: integrated molecular, physiological, anatomical, biomarker, and cognitive dimensions. Curr. Alzheimer Res. 12, 712–722. doi: 10.2174/1567205012666150701103107
Rodell, A. B., Aanerud, J., Braendgaard, H., and Gjedde, A. (2012). Low residual CBF variability in Alzheimer's disease after correction for CO(2) effect. Front. Neuroenerg. 4:8. doi: 10.3389/fnene.2012.00008
Sakadžić, S., Roussakis, E., Yaseen, M. A., Mandeville, E. T., Srinivasan, V. J., Arai, K., et al. (2010). Two-photon high-resolution measurement of partial pressure of oxygen in cerebral vasculature and tissue. Nat. Methods 7, 755–759. doi: 10.1038/nmeth.1490
Senarathna, J., Yu, H., Deng, C., Zou, A. L., Issa, J. B., Hadjiabadi, D. H., et al. (2019). A miniature multi-contrast microscope for functional imaging in freely behaving animals. Nat. Commun. 10:99. doi: 10.1038/s41467-018-07926-z
Shabir, O., Sharp, P., Rebollar, M. A., Boorman, L., Howarth, C., Wharton, S. B., et al. (2020). Enhanced cerebral blood volume under Normobaric Hyperoxia in the J20-hAPP mouse model of Alzheimer's disease. Sci. Rep. 10:7518. doi: 10.1038/s41598-020-64334-4
Sigal, I., Koletar, M. M., Ringuette, D., Gad, R., Jeffrey, M., Carlen, P. L., et al. (2016). Imaging brain activity during seizures in freely behaving rats using a miniature multi-modal imaging system. Biomed. Opt. Express 7, 3596–3609. doi: 10.1364/BOE.7.003596
Sleight, E., Stringer, M. S., Marshall, I., Wardlaw, J. M., and Thrippleton, M. J. (2021). Cerebrovascular reactivity measurement using magnetic resonance imaging: a systematic review. Front. Physiol. 12:643468. doi: 10.3389/fphys.2021.643468
Steventon, J. J., Foster, C., Furby, H., Helme, D., Wise, R. G., and Murphy, K. (2020). Hippocampal blood flow is increased after 20 min of moderate-intensity exercise. Cereb. Cortex 30, 525–533. doi: 10.1093/cercor/bhz104
Stobart, J. L., Erlebach, E., Glück, C., Huang, S. F., Barrett, M. J., Li, M., et al. (2023). Altered hemodynamics and vascular reactivity in a mouse model with severe pericyte deficiency. J. Cereb. Blood Flow Metab. 43, 763–777. doi: 10.1177/0271678X221147366
Tataryn, N. M., Singh, V., Dyke, J. P., Berk-Rauch, H. E., Clausen, D., Aronowitz, E., et al. (2021). Vascular endothelial growth factor associated dissimilar cerebrovascular phenotypes in two different mouse models of Alzheimer's disease. Neurobiol. Aging 107, 96–108. doi: 10.1016/j.neurobiolaging.2021.07.015
Verant, P., Serduc, R., Van Der Sanden, B., Remy, C., and Vial, J. C. (2007). A direct method for measuring mouse capillary cortical blood volume using multiphoton laser scanning microscopy. J. Cereb. Blood Flow Metab. 27, 1072–1081. doi: 10.1038/sj.jcbfm.9600415
Vovenko, E. (1999). Distribution of oxygen tension on the surface of arterioles, capillaries and venules of brain cortex and in tissue in normoxia: an experimental study on rats. Pflugers Archiv Eur J Physiol 437, 617–623. doi: 10.1007/s004240050825
Weiner, M. W., Veitch, D. P., Aisen, P. S., Beckett, L. A., Cairns, N. J., Cedarbaum, J., et al. (2015). 2014 update of the Alzheimer's disease neuroimaging initiative: a review of papers published since its inception. Alzheimers Dement. 11, e1–e120. doi: 10.1016/j.jalz.2014.11.001
Yaroslavsky, A. N., Schulze, P. C., Yaroslavsky, I. V., Schober, R., Ulrich, F., and Schwarzmaier, H. J. (2002). Optical properties of selected native and coagulated human brain tissues in vitro in the visible and near infrared spectral range. Phys. Med. Biol. 47, 2059–2073. doi: 10.1088/0031-9155/47/12/305
Keywords: Alzheimer’s disease, cerebrovascular reactivity, fiberoptic spectroscopy, cerebral blood volume, hypercapnia
Citation: Gareau DS, RochaKim N, Choudhury A, Bamkole M, Snuderl M, Zou J, Yaroslavsky A, Jacques SL, Strickland S, Krueger JG and Ahn HJ (2023) Fiberoptic hemodynamic spectroscopy reveals abnormal cerebrovascular reactivity in a freely moving mouse model of Alzheimer’s disease. Front. Mol. Neurosci. 16:1163447. doi: 10.3389/fnmol.2023.1163447
Edited by:
Bernhard Luscher, The Pennsylvania State University (PSU), United StatesReviewed by:
Bing-Xing Huo, Broad Institute, United StatesPrerana Shrestha, Stony Brook University, United States
Copyright © 2023 Gareau, RochaKim, Choudhury, Bamkole, Snuderl, Zou, Yaroslavsky, Jacques, Strickland, Krueger and Ahn. This is an open-access article distributed under the terms of the Creative Commons Attribution License (CC BY). The use, distribution or reproduction in other forums is permitted, provided the original author(s) and the copyright owner(s) are credited and that the original publication in this journal is cited, in accordance with accepted academic practice. No use, distribution or reproduction is permitted which does not comply with these terms.
*Correspondence: Hyung Jin Ahn, aHl1bmdqaW4uYWhuQHJ1dGdlcnMuZWR1; Daniel S. Gareau, ZGdhcmVhdUByb2NrZWZlbGxlci5lZHU=
†These authors have contributed equally to this work