 Boru Jin
 Guoqiang Fei1,2
 Shaoming Sang
 Chunjiu Zhong
94% of researchers rate our articles as excellent or good
Learn more about the work of our research integrity team to safeguard the quality of each article we publish.
Find out more
ORIGINAL RESEARCH article
Front. Mol. Neurosci. , 10 May 2023
Sec. Brain Disease Mechanisms
Volume 16 - 2023 | https://doi.org/10.3389/fnmol.2023.1152279
Background: Alzheimer’s disease (AD) is the most common neurodegenerative disease, imposing huge mental and economic burdens on patients and society. The specific molecular pathway(s) and biomarker(s) that distinguish AD from other neurodegenerative diseases and reflect the disease progression are still not well studied.
Methods: Four frontal cortical datasets of AD were integrated to conduct differentially expressed genes (DEGs) and functional gene enrichment analyses. The transcriptional changes after the integrated frontal cortical datasets subtracting the cerebellar dataset of AD were further compared with frontal cortical datasets of frontotemporal dementia and Huntingdon’s disease to identify AD-frontal-associated gene expression. Integrated bioinformatic analysis and machine-learning strategies were applied for screening and determining diagnostic biomarkers, which were further validated in another two frontal cortical datasets of AD by receiver operating characteristic (ROC) curves.
Results: Six hundred and twenty-six DEGs were identified as AD frontal associated, including 580 downregulated genes and 46 upregulated genes. The functional enrichment analysis revealed that immune response and oxidative stress were enriched in AD patients. Decorin (DCN) and regulator of G protein signaling 1 (RGS1) were screened as diagnostic biomarkers in distinguishing AD from frontotemporal dementia and Huntingdon’s disease of AD. The diagnostic effects of DCN and RGS1 for AD were further validated in another two datasets of AD: the areas under the curve (AUCs) reached 0.8148 and 0.8262 in GSE33000, and 0.8595 and 0.8675 in GSE44770. There was a better value for AD diagnosis when combining performances of DCN and RGS1 with the AUCs of 0.863 and 0.869. Further, DCN mRNA level was correlated to CDR (Clinical Dementia Rating scale) score (r = 0.5066, p = 0.0058) and Braak staging (r = 0.3348, p = 0.0549).
Conclusion: DCN and RGS1 associated with the immune response may be useful biomarkers for diagnosing AD and distinguishing the disease from frontotemporal dementia and Huntingdon’s disease. DCN mRNA level reflects the development of the disease.
Alzheimer’s disease (AD) is the most common neurodegenerative disease that is pathologically characterized by brain β-amyloid (Aβ) deposition forming extracellular plaques, Tau hyperphosphorylation aggregating to intracellular neurofibrillary tangles, and the progressive reduction of synapses and neurons causing brain atrophy (Alzheimer’s Association, 2021). More and more studies also suggest that glial activation underlying neuroinflammation, brain glucose hypometabolism, mitochondrial dysfunction, and oxidative stress also participate in the occurrence and progression of the disease (Liu et al., 2019; Long and Holtzman, 2019). Yet, the pathogenesis of AD remains elusive and the ideal diagnostic biomarkers reflecting the outcome of the disease are still rare.
Genome-wide studies have disclosed the complexity of networks in altered expressions of genes contributing to the pathogenesis of AD. The abnormal modules in immune and microglia-specific activities (Zhang et al., 2013), neural communication, amyloid-β clearance (Magistri et al., 2015), cerebral vasculature (Magistri et al., 2015), and synaptic transmission (Williams et al., 2021) have been indicated the involvement in the disease pathogenesis according to transcriptomics studies on postmortem brain samples of AD patients. The selective regional vulnerability of these involvements and the correlation with clinical outcomes further enhance the complexity (Wang et al., 2016). It leads to significant difficulties in exploring the real pathogenic factor(s) and ideal diagnostic biomarkers for the disease. The recently emerging integrated bioinformatic analysis and machine learning strategy may help to address this challenge. AD, frontotemporal lobar degeneration (FTD), and Huntington’s disease (HD) are all classified into neurodegenerative diseases and they share common neurodegeneration and some clinical symptoms such as cognitive decline (Walker, 2007; Boeve et al., 2022), metabolic changes (Vercruysse et al., 2018; Moll et al., 2020), behavioral and psychological disorders (Santacruz Escudero et al., 2019; Menculini et al., 2021) and so forth, which causes clinically misdiagnosis and mistreatment (Boeve et al., 2022). Accurate diagnostic differentiation also requires expensive PET or aggressive cerebrospinal fluid tests. Meanwhile, these diseases are heterogeneous in pathological mechanisms such as susceptibility of different types of synapses and neuronal cell death (Kamat et al., 2016; Smith-Dijak et al., 2019; John and Reddy, 2021; Wang et al., 2022), which provides the theoretical basis for identifying the differential biomarkers and AD specific pathogenesis. Previous studies have indicated that plasma phosphorylated tau 217 and phosphorylated tau 181 could differentiate AD from FTD (Thijssen et al., 2020, 2021), while a few studies suggested potential biomarkers only on diagnosis of HD without reporting the differential effect from AD (Wild et al., 2008; Battaglia et al., 2011; Caron et al., 2022). Therefore, analyzing the differences in gene expressions of AD, FTD, and HD may provide help for further understanding the pathogenesis and exploring new diagnostic biomarkers of AD differentiating from other neurodegenerative disease.
In this study, we integrated four frontal cortical datasets from the GEO database into an integrated dataset which was used to be compared to one cerebellar dataset of AD, one frontal cortical dataset of FTD, and one frontal cortical dataset of HD, and the results were further verified in another two frontal cortical datasets of AD. We aim at discovering novel pathways and key genes that may serve as valuable diagnostic biomarkers for distinguishing AD from normal patients, FTD, and HD by bioinformatic analysis combined with machine learning strategies. Furthermore, the correlations between the biomarkers with the CDR (Clinical Dementia Rating scale) scores and Braak staging of AD patients were analyzed to explore whether they could also reflect the development of the disease.
The microarray datasets referred to profiles of gene expressions with frontal cortical tissue of brain samples of AD patients were retrieved in National Center for Biotechnology Information (NCBI) Gene Expression Omnibus (GEO) database1 with the following keywords including “Alzheimer’s disease,” “Expression profiling by array” and the species was selected as “Homo sapiens.” Four datasets including GSE5281 (10 control and 23 AD samples), GSE131617 (52 control and 19 AD samples), GSE48350 (48 control and 21 AD samples), and GSE84422 (15 control and 24 AD samples) originated from frontal cortical samples with the diagnosis of AD, which are all from the same platform of Affymetrix. Based on the annotation from corresponding datasets, probes were transformed into gene symbols. And if there were more than one probe referring to the same gene symbol, the gene expression values would be assigned as an average value of them. The four AD frontal cortical datasets were normalized with the “SVA” package in R to compensate for the batch effect and merged into an integrated dataset (Leek et al., 2020). The “SVA” package can help remove batch effect in two ways, including estimating surrogate variables for unknown sources of variation and directly removing known batch effects using the “Combat” function (Leek and Storey, 2007, 2008). The integrated AD frontal cortical dataset subtracted the expressed genes in dataset GSE44768 of AD cerebellum to screen frontal-associated genes. Then, the frontal-associated genes of AD were further compared with that in the FTD frontal cortical dataset GSE13162 and HD frontal cortical dataset GSE3790 to identify the candidates of diagnostic biomarkers for AD. More detailed information about the included datasets is summarized in Supplementary Table 1.
Differentially expressed genes (DEGs) were analyzed with the “limma” package in R and identified with the thresholds that | log2FC| (fold change) was larger than 2 and the adjusted p-value was less than 0.05. After subtracting the DEGs of the AD cerebellar dataset and comparing them with that in FTD and HD frontal cortical datasets, DEGs only expressed in AD frontal cortex were identified. Besides, heatmaps and volcano plots were conducted with “pheatmap” and “EnhancedVolcano” packages in R. Venn diagrams were used to visualize the overlapping or unique genes among AD cortex, AD cerebellum, HD, and FTD (Bardou et al., 2014).
Gene ontology (GO) enrichment analysis was performed under three hierarchical categories of biological process, molecular function, and cellular component with the “clusterProfiler” package in R (Yu et al., 2012). Kyoto Encyclopedia of Genes and Genomes (KEGG) database was applied to do the pathway enrichment analysis with the “clusterProfiler” package in R (Yu et al., 2012; Yu and He, 2016; Minoru et al., 2017; Jassal et al., 2020).
We employed three machine learning strategies to identify potential diagnostic biomarkers differentiating Alzheimer’s disease from other neurodegenerative diseases. Least absolute shrinkage and selection operator (LASSO) logistic regression was applied to identify the diagnostic genes associated with discrimination with the “glmnet” package in R (Tibshirani, 1996; Bühlmann, 2011). Support vector machine-recursive feature elimination (SVM-RFE) was conducted in R using the “e1071” package with 5-fold cross-validation (Suykens and Vandewalle, 1999; Weston and Guyon, 2012). Random forest (RF) was performed in R with the “randomForest” package (Breiman, 2001; Qi, 2012). Then, the overlapping genes of the above three machine-learning strategies were identified and would be further verified as candidate biomarkers.
Two additional AD frontal cortical datasets (GSE33000 and GSE44772) were applied as the validation datasets. The overlapping genes with differential expression identified in the above three mentioned machine-learning strategies were validated. The receiver operating characteristic curves (ROCs) analysis was conducted and the area under the curves (AUCs) was calculated to evaluate the diagnostic efficacy of the selected biomarkers (Seshan et al., 2013). Besides, CDR scale is an informant-based global clinical instrument which has been widely applied for clinical grading of dementia severity (Schafer et al., 2004; Huang H. et al., 2021). Based on the neurofibrillary tangle topographic distribution in the brain, the Braak staging is strongly associated with the degree of cognitive impairment (Braak and Braak, 1991; Nelson et al., 2012; Lowe et al., 2018). Thus, the correlation analysis between the diagnostic biomarkers and the CDR scores and Braak staging was also performed in dataset GSE84422 to explore whether they could reflect the development of the disease.
A diagram of the workflow of the bioinformatics analyses combined with machine learning strategies is shown in Figure 1.

Figure 1. The workflow of the analysis process.
After removing batch effects, the data of expression profiles of frontal cortical samples of AD from four GEO datasets (GSE5281, GSE131617, GSE48350, and GSE84422) were merged into an integrated dataset, including frontal cortical samples of 87 AD patients and 125 control subjects. Firstly, the DEGs in the frontal cortical samples of AD from the integrated dataset, cerebellar samples of AD (GSE44768), frontal samples of FTD (GSE13162), and HD (GSE3790) patients were all analyzed. Secondly, the frontal-associated genes of AD were screened, and selected the DEGs in the frontal cortex of AD patients as compared with control subjects, while not in the cerebellum of AD patients as compared with control subjects. Then, the frontal-associated genes were further compared with those in FTD and HD datasets to finally identify the candidates of diagnostic biomarkers for AD. The results showed that 626 DEGs were AD-associated, including 580 downregulated genes and 46 upregulated genes. The Venn diagram showed the intersection of the DEGs from the above-mentioned datasets (Figure 2A). The volcano plot described AD frontal associated gene distribution (Figure 2B), and the heatmap illustrated the remarkable differences (Supplementary Figure 1).
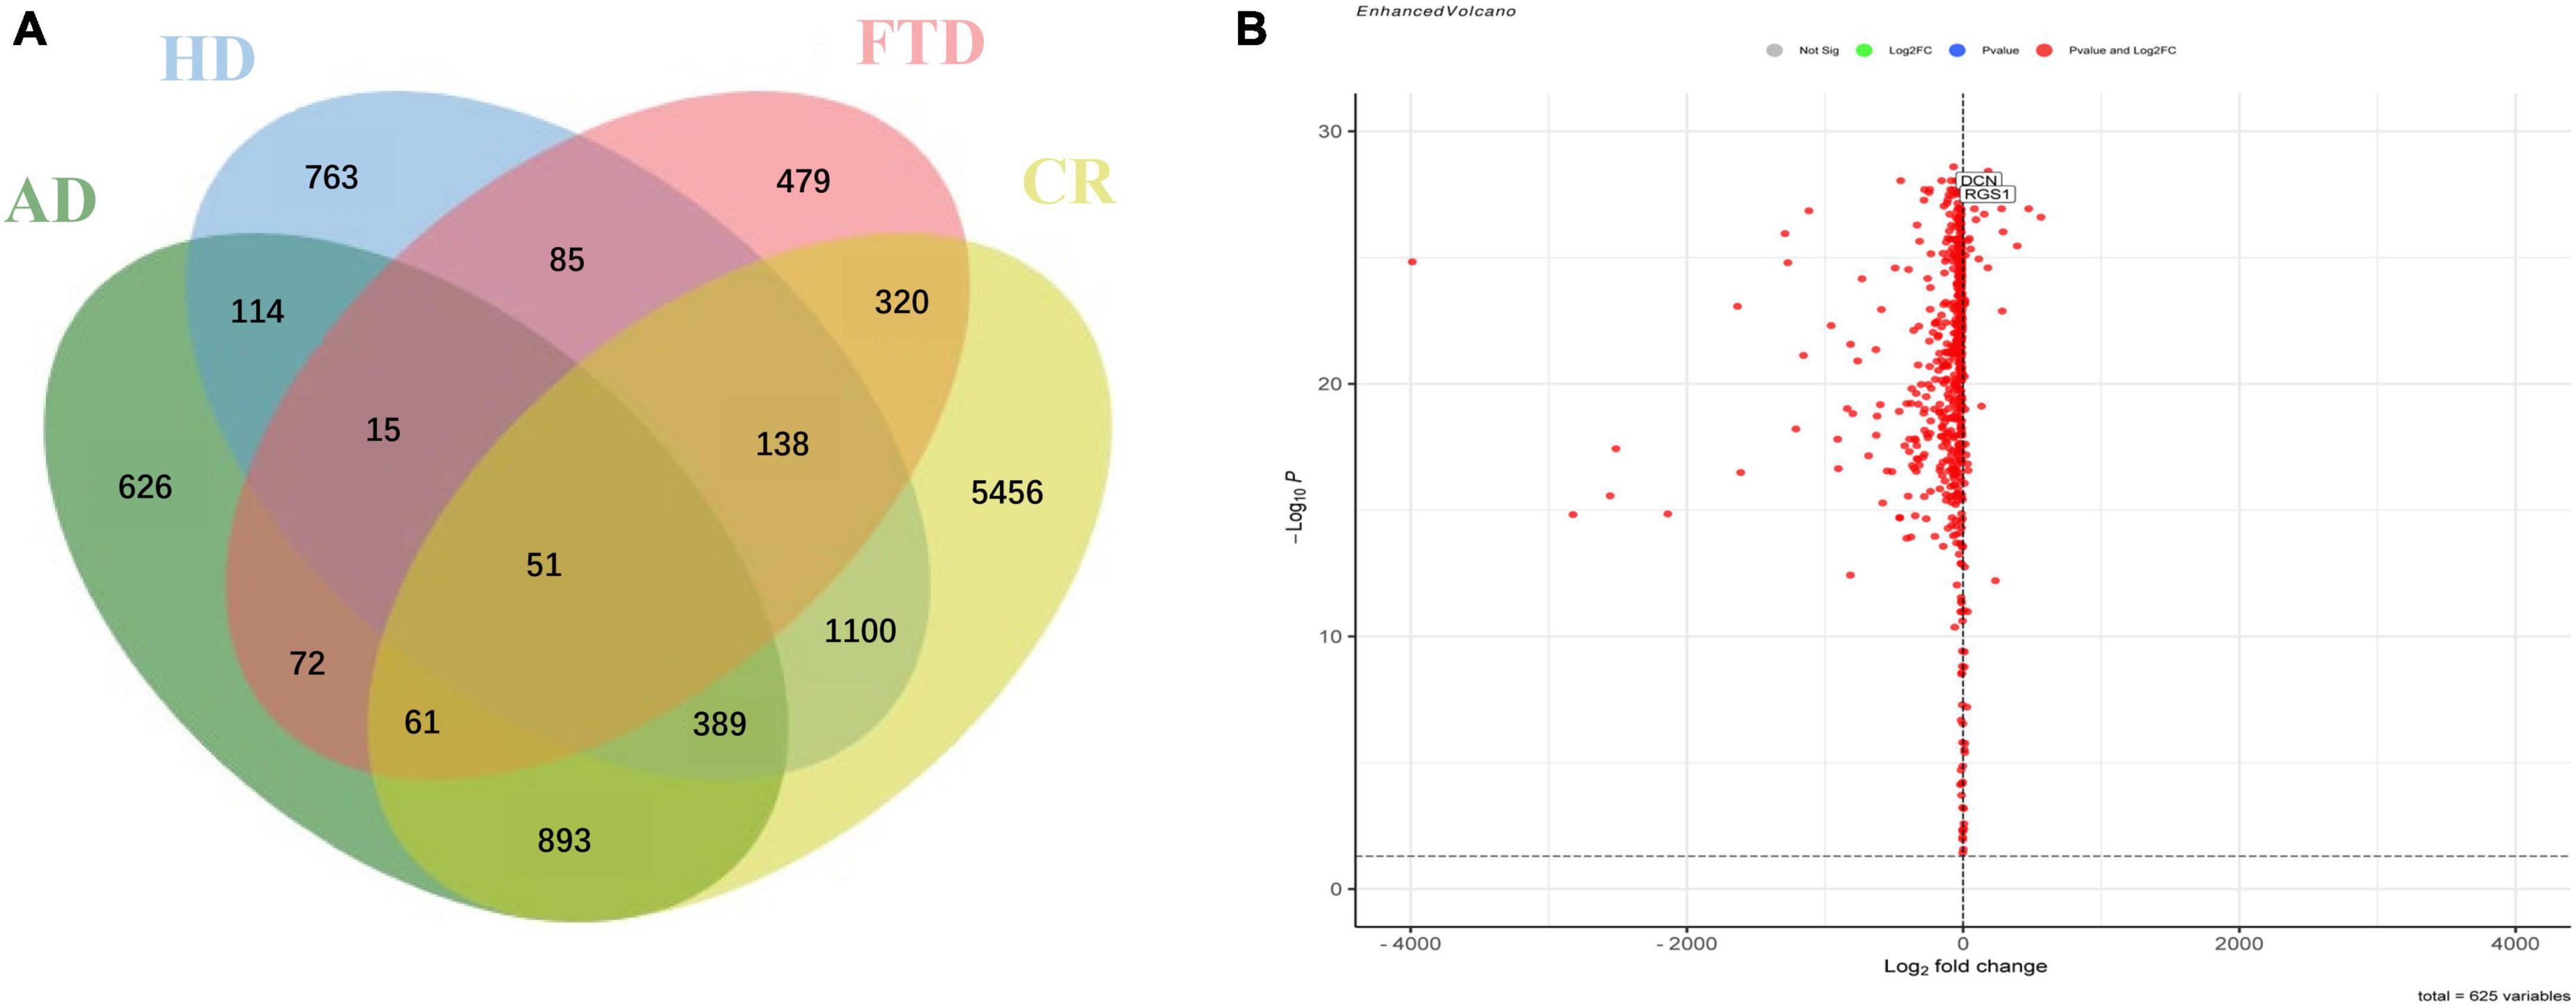
Figure 2. Identification of specific differentially expressed genes in the frontal cortex of Alzheimer’s disease. (A) Venn diagram showed the intersection of differentially expressed genes in frontal cortical samples of Alzheimer’s disease (AD), cerebellar samples of Alzheimer’s disease (CR), frontal cortical samples of frontotemporal lobar degeneration (FTD), and frontal cortical samples of Huntington’s disease (HD). (B) Volcano plot of frontal specific differentially expressed genes between Alzheimer’s disease and controls.
Based on the DEGs in AD frontal cortex, GO analysis was performed to explore the main cell functions, most of which were associated with the immune response and oxidative stress-related such as response to lipopolysaccharide, neutrophil activation, response to oxidative stress, reactive oxygen species metabolic process, etc. (Figure 3A and Supplementary Table 1). KEGG pathway analysis was also conducted and suggests significant enrichment in pathways of the cGMP-PKG signaling pathway, Peroxisome, Ras signaling pathway, etc. (Figure 3B).
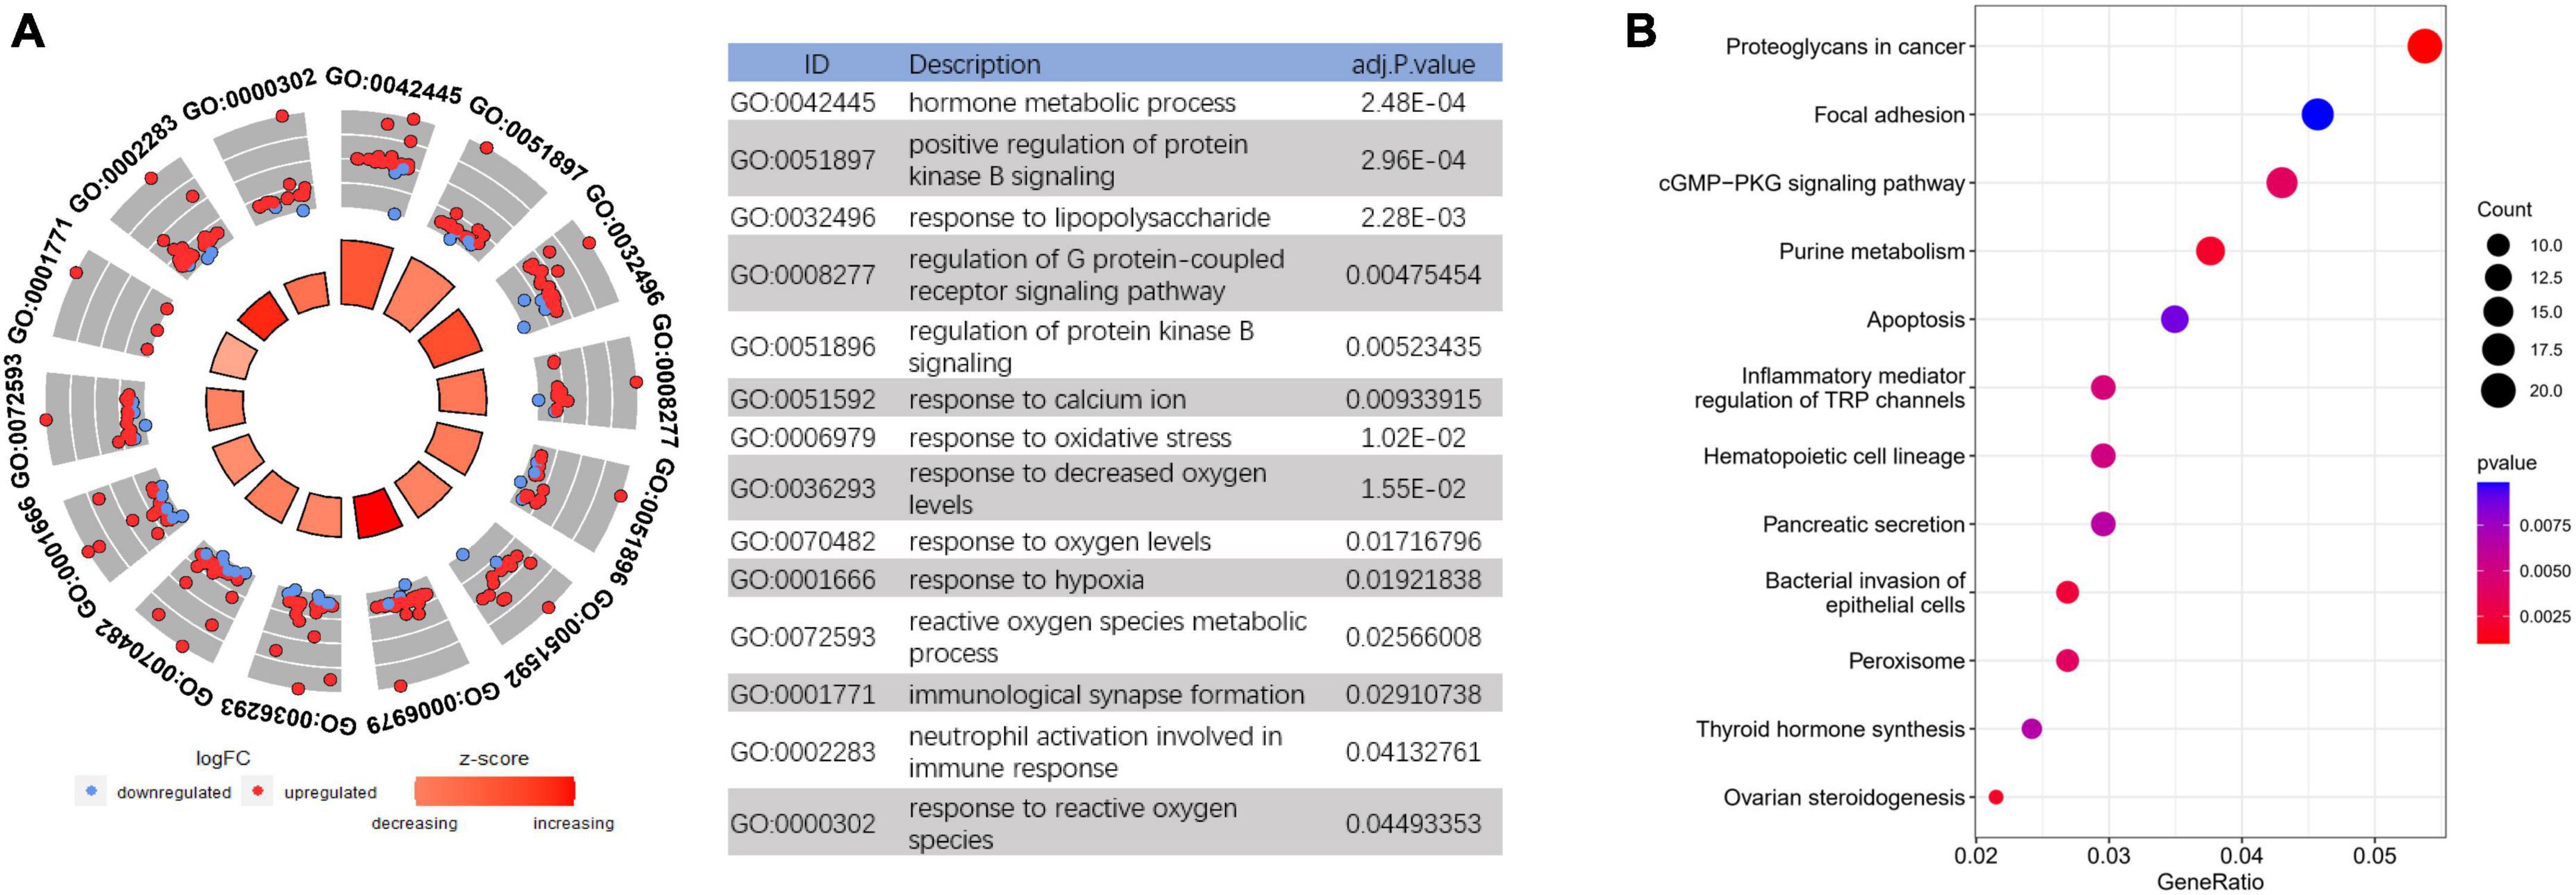
Figure 3. Functional enrichment analysis to investigate the potential function of differentially expressed genes (DEGs). (A) GO analyses of DEGs. (B) Kyoto Encyclopedia of Genes and Genomes (KEGG) pathway analysis of DEGs.
Least absolute shrinkage and selection operator logistic regression algorithm identified 17 potential diagnostic markers from AD frontal-associated DEGs (Figure 4A). SVM-RFE and RF analysis showed there were 25 and 30 potential diagnostic markers for AD, respectively (Figures 4B, C). Among these potential biomarkers, there were two overlapping genes including decorin (DCN), and regulator of G protein signaling 1 (RGS1) (Figure 4D).
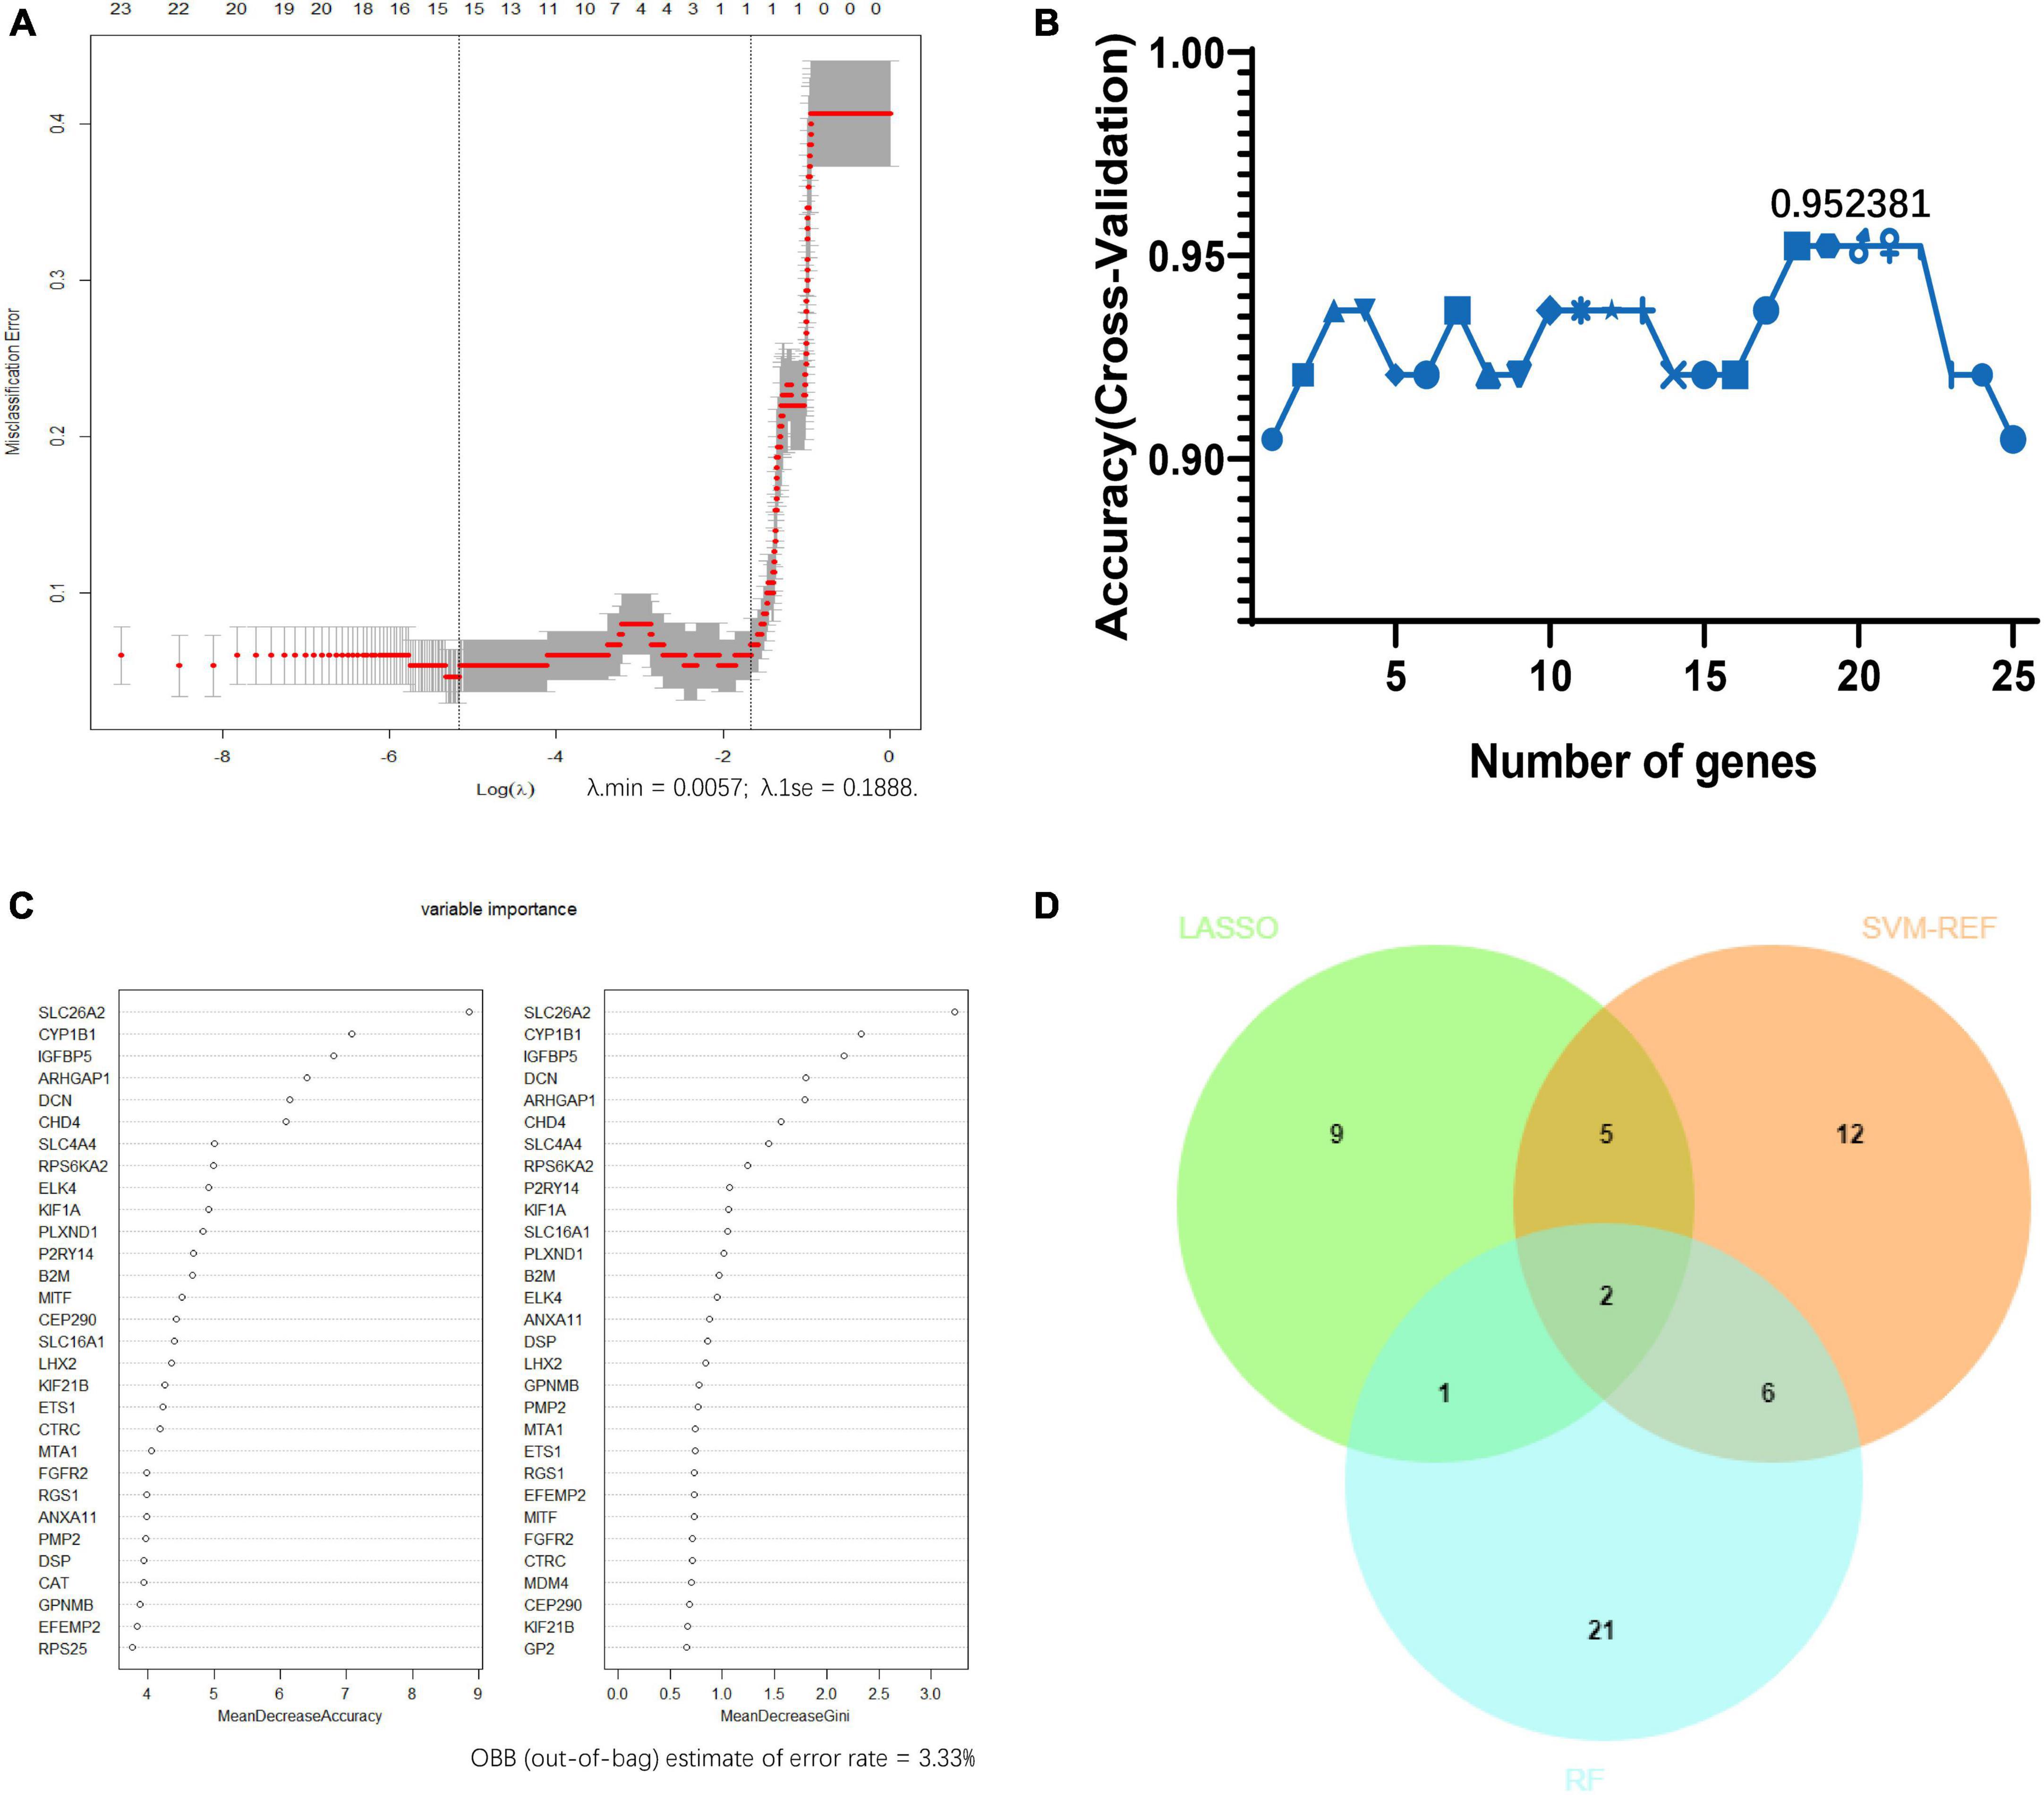
Figure 4. Screening candidate biomarkers of Alzheimer’s disease via machine-learning strategies. (A) Least absolute shrinkage and selection operator (LASSO) logistic regression. (B) Support vector machine-recursive feature elimination (SVM-RFE) analysis. (C) Random forest (RF) analysis. (D) Venn diagram showed the intersection of diagnostic markers obtained by the three machine learning strategies.
The differential expressions of DCN and RGS1 were further validated in two additional datasets GSE33000 and GSE44770, and the results suggested that both of them were significantly upregulated (Figure 5 and Supplementary Table 1). The ROC analysis of DCN and RGS1 was conducted to assess the diagnostic efficacy. The AUCs of DCN and RGS1 were 0.8148 and 0.8262 in dataset GSE33000, and 0.8595 and 0.8675 in GSE44770 (Figure 5E). The AUCs of the combination of the two biomarkers as a diagnostic tool for AD were 0.863 and 0.869 (Figure 5F). DCN mRNA level was correlated to CDR (Clinical Dementia Rating scale) score (r = 0.5066, p = 0.0058) and Braak staging (r = 0.3348, p = 0.0549) (Figures 6A, B). RGS1 mRNA level correlates with Braak staging (r = 0.3141 p = 0.0675) and CDR score (r = 0.1184, p = 0.2908) (Figures 6C, D).
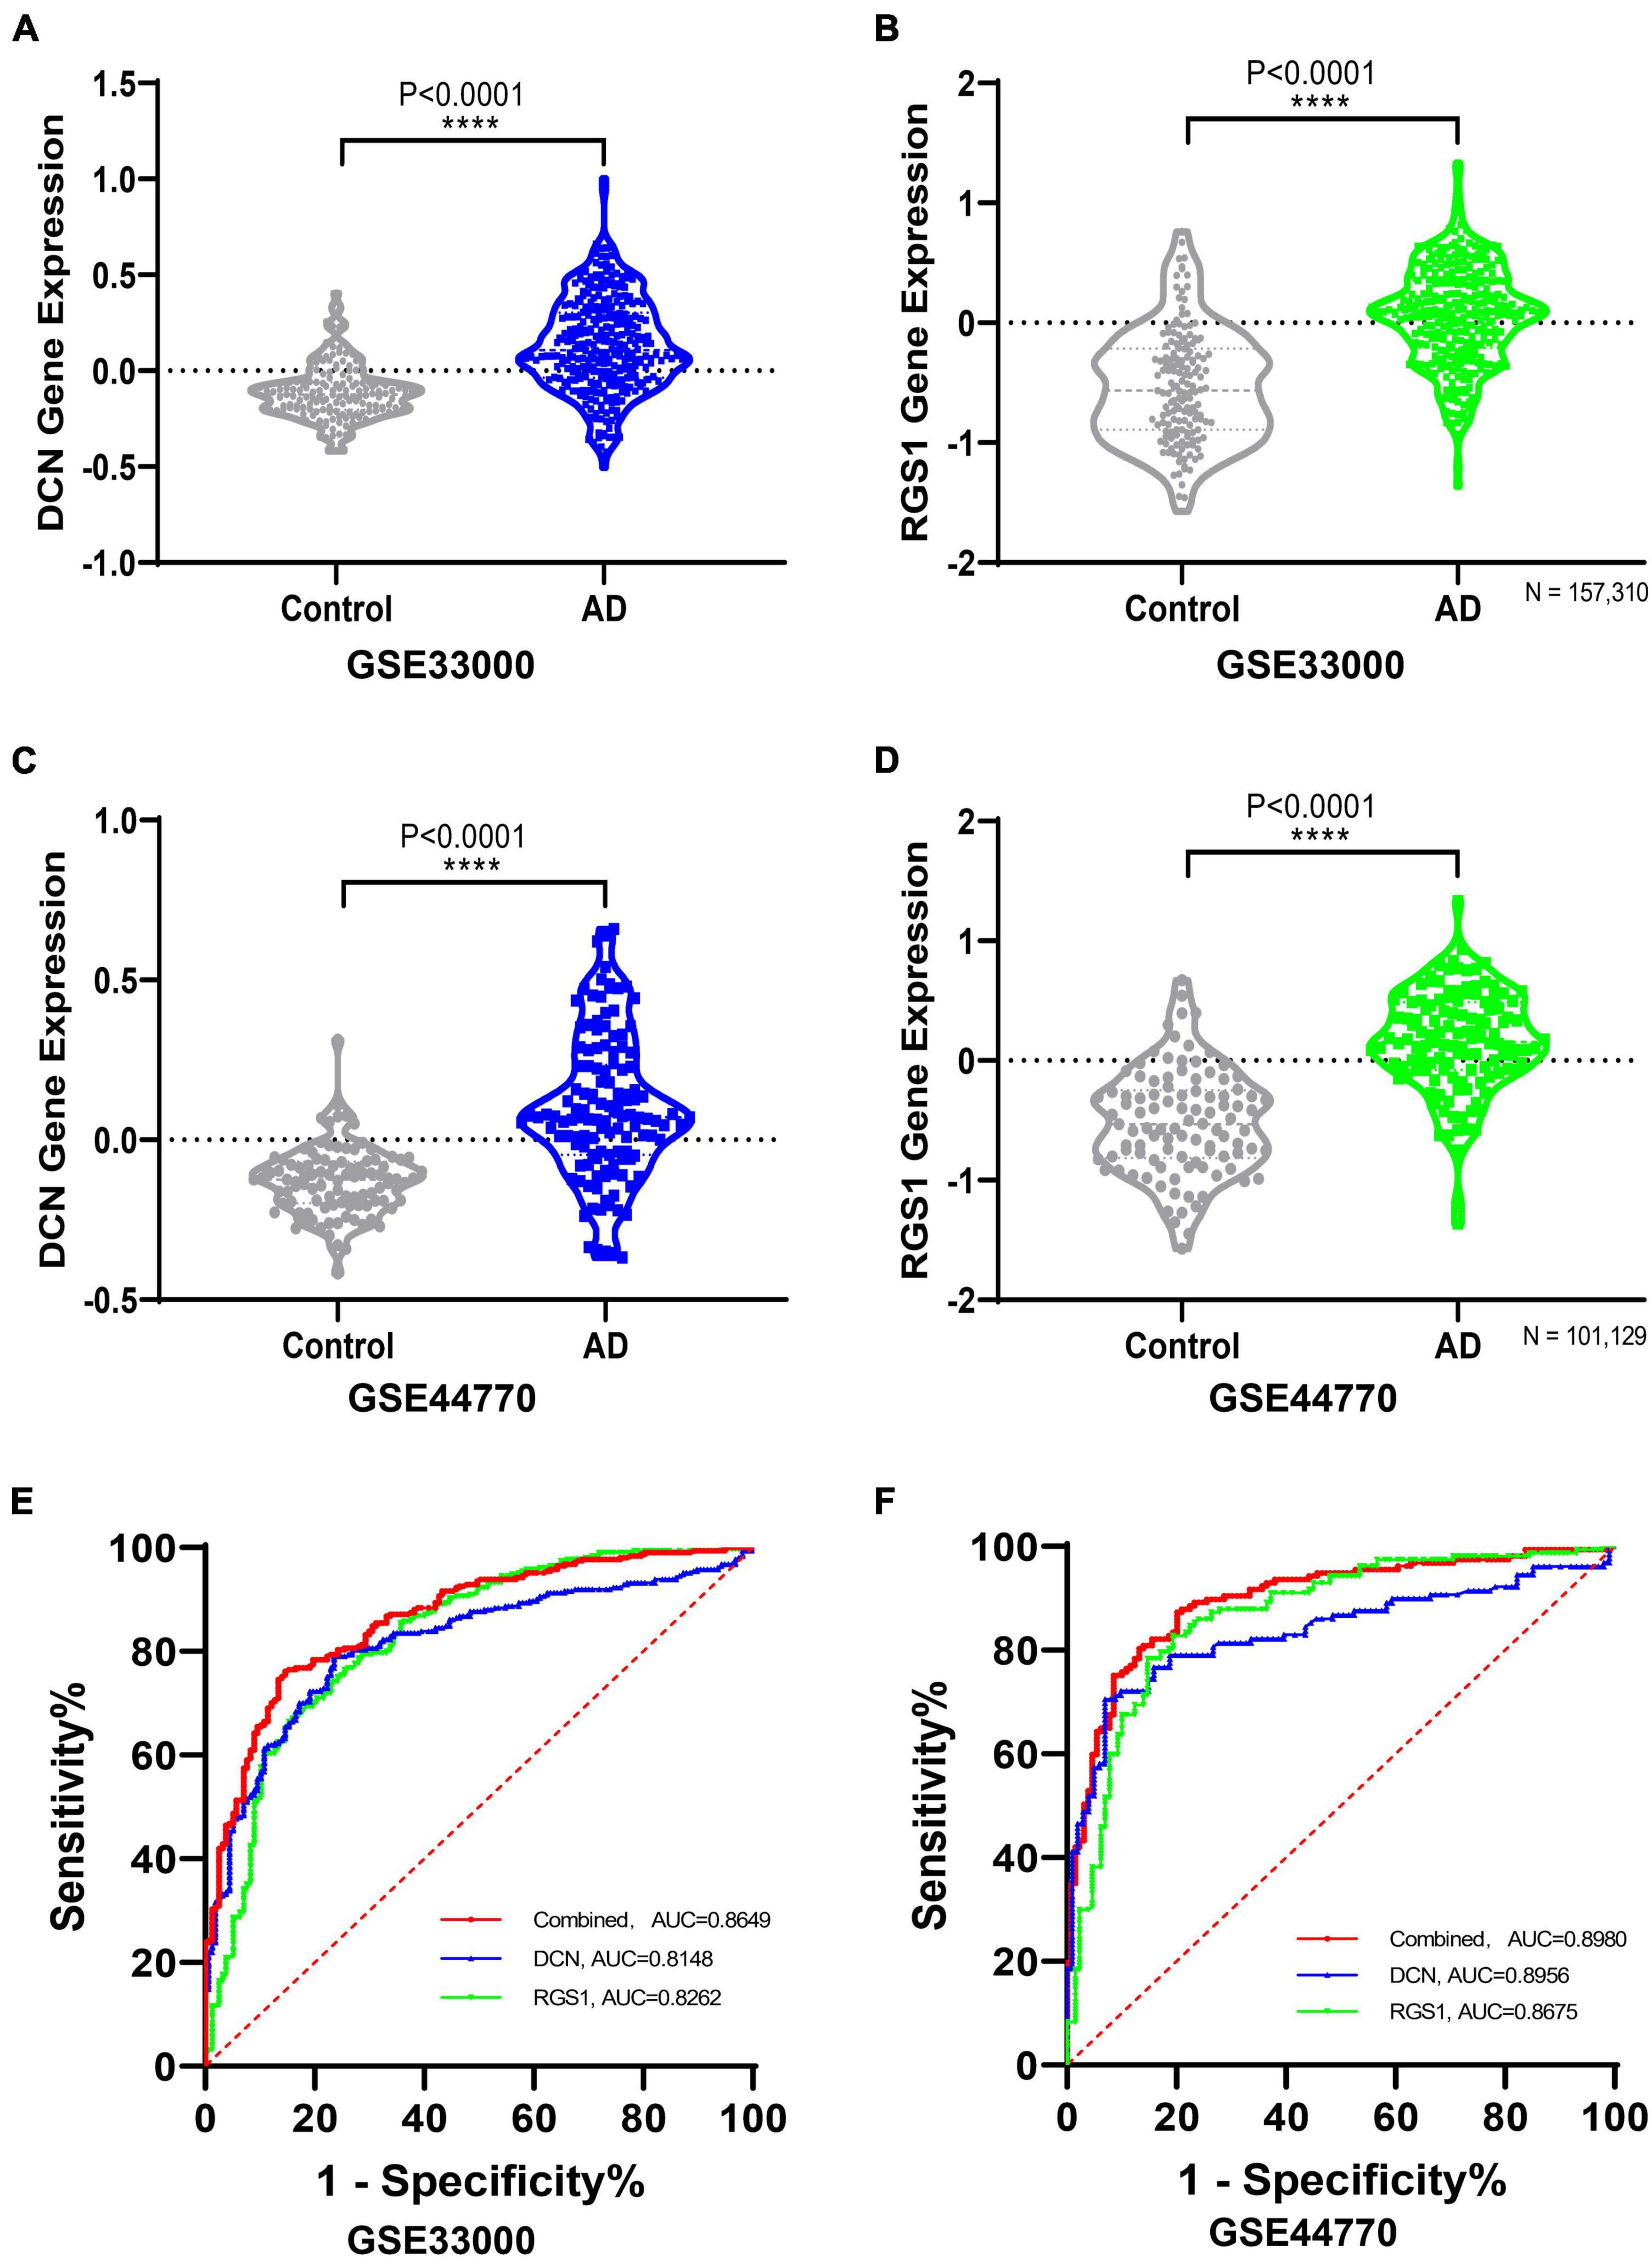
Figure 5. Validating the differential expressions of diagnostic biomarkers in verification datasets. (A) Validation of the expression levels and diagnostic efficacy of DCN in dataset GSE33000. (B) Validation of the expression levels of RGS1 in dataset GSE33000. (C) Validation of the expression levels of DCN in dataset GSE44770. (D) Validation of the expression levels of RGS1 in dataset GSE44770. (E) ROC analysis of DCN, RGS1, and the combination of the two biomarkers as a diagnostic tool in the validation dataset GSE33000. (F) Receiver operating characteristic (ROC) analysis of DCN, RGS1, and the combination of the two biomarkers as a diagnostic tool in the validation dataset GSE44770.
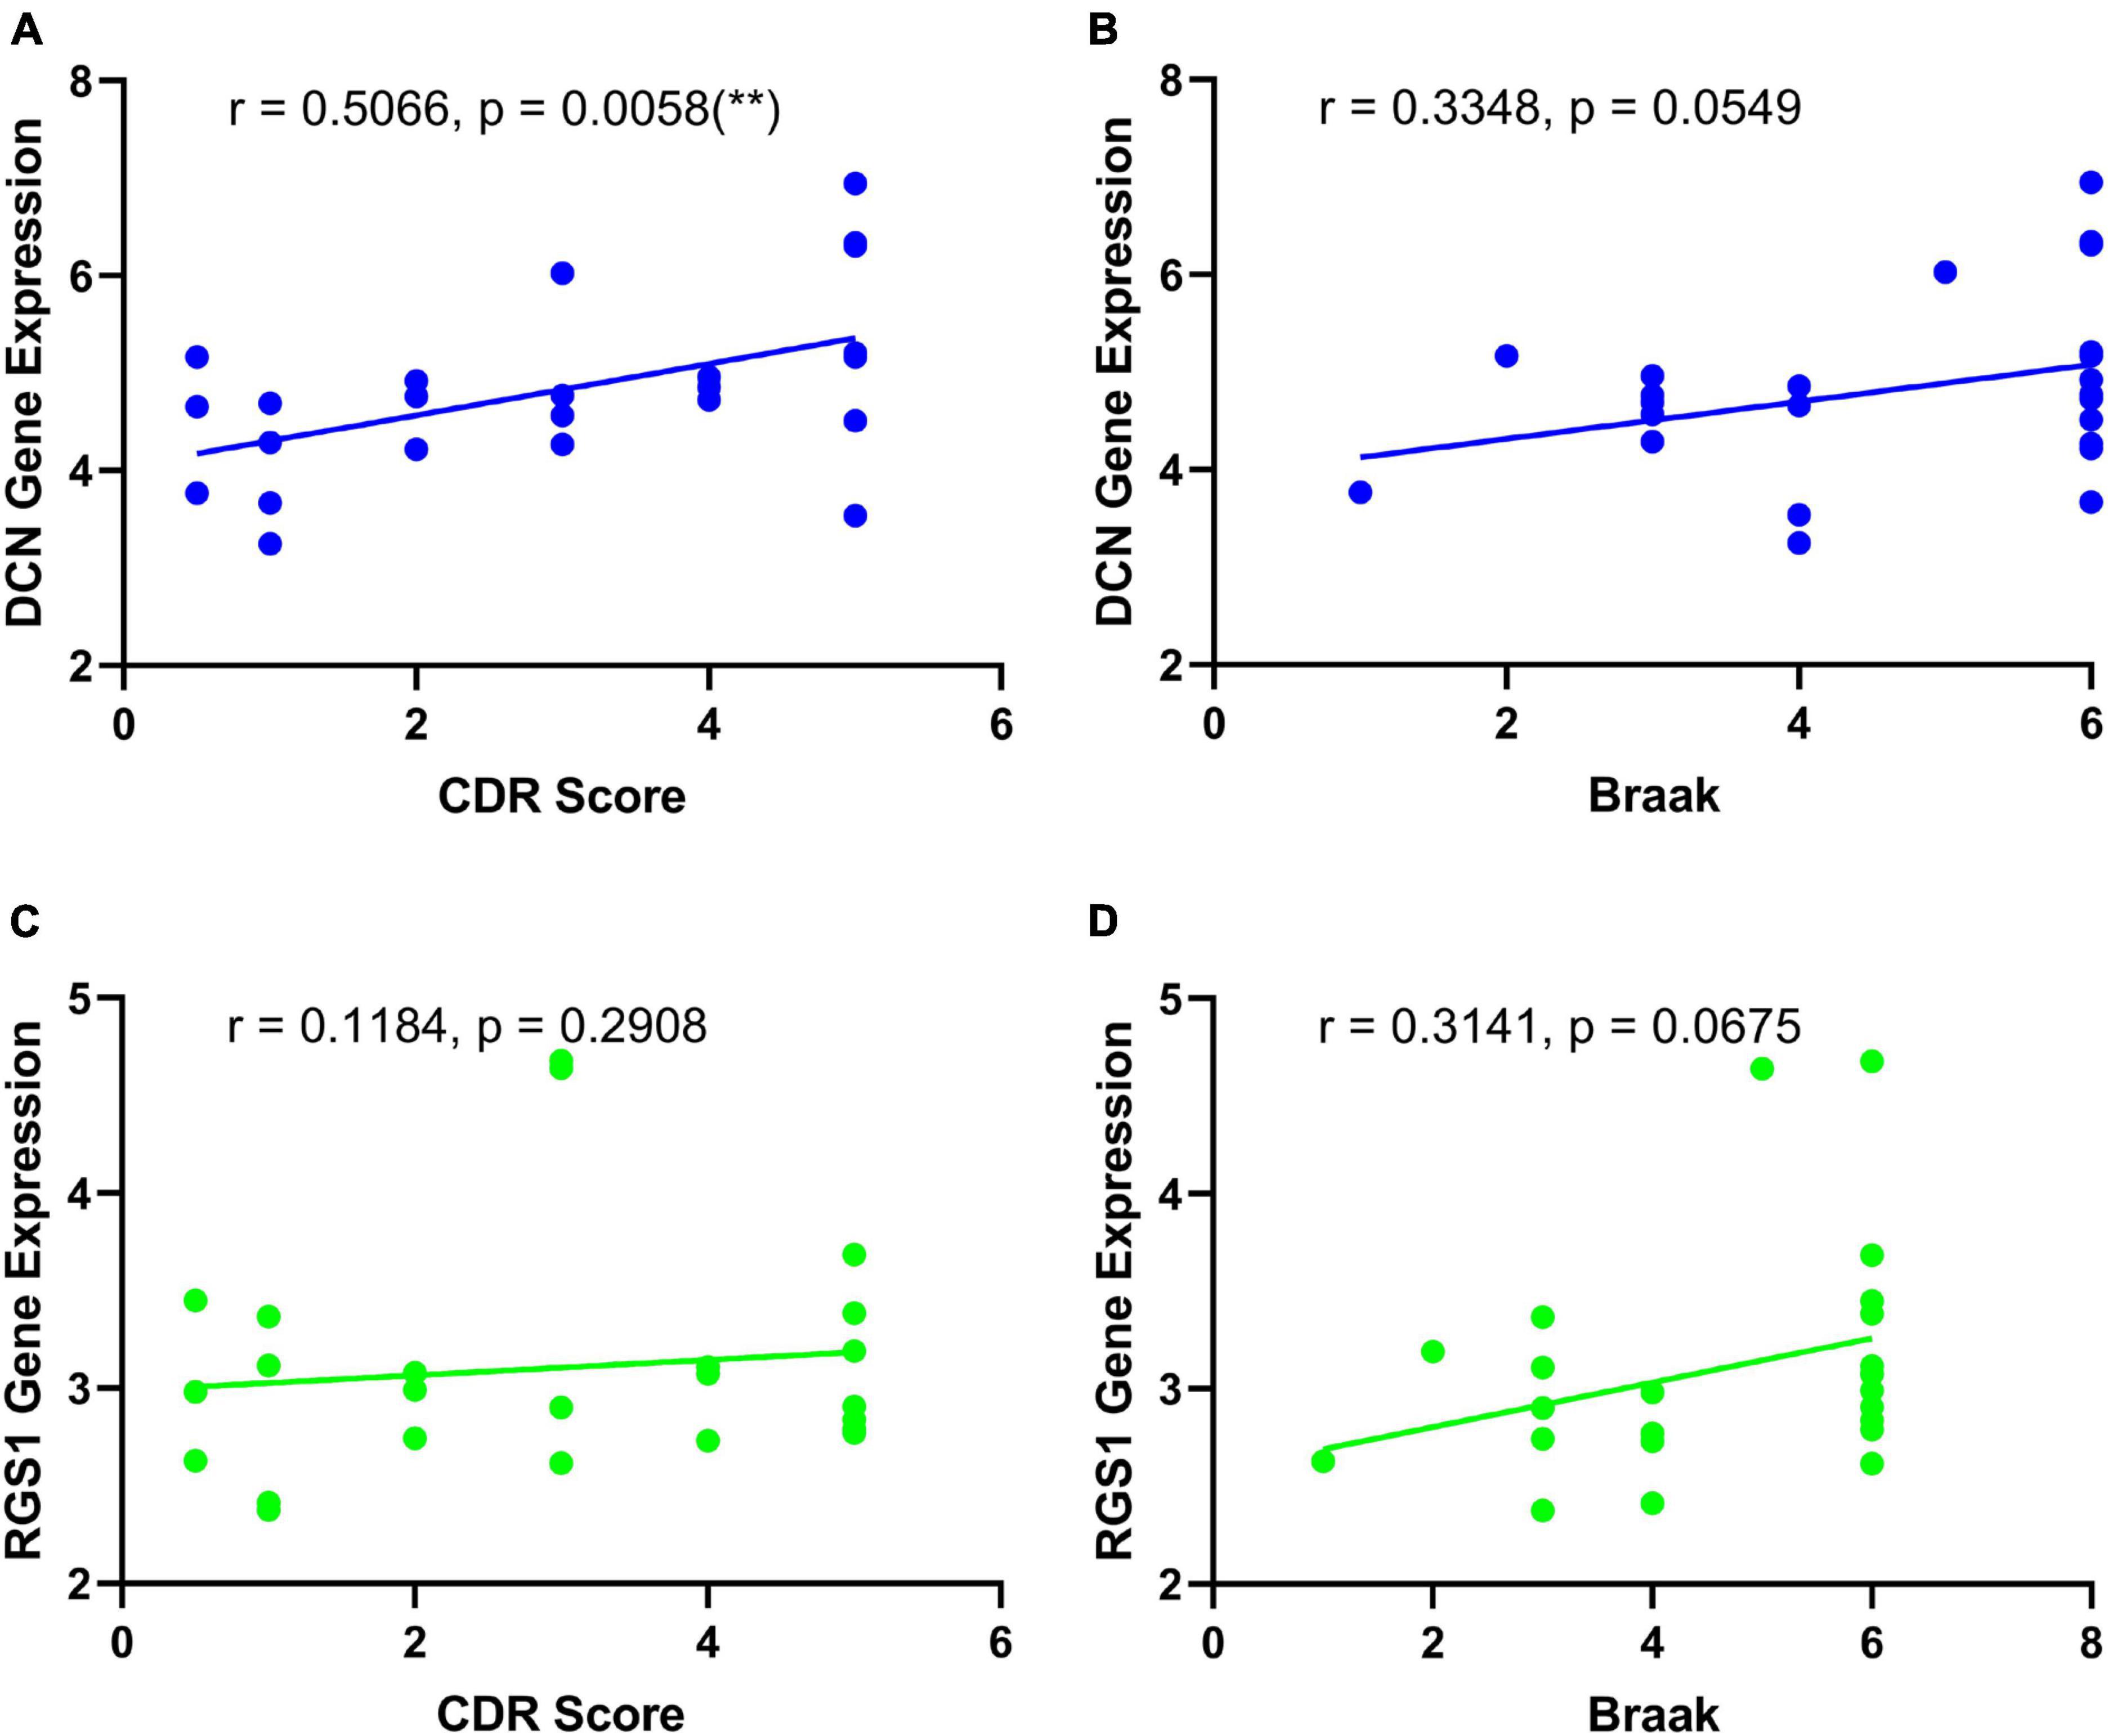
Figure 6. Correlation analysis of the diagnostic biomarkers and the development of disease. (A) Correlation analysis of DCN and CDR score. (B) Correlation analysis of DCN and Braak staging. (C) Correlation analysis of RGS1 and CDR score. (D) Correlation analysis of RGS1 and Braak staging.
Cerebellum has always been viewed as a less affected or even neglected area of AD because autopsy studies found that the two main neuropathological hallmarks of AD including amyloid plaques and neurofibrillary tangles are both present first in the cerebral cortex while the cerebellum could escape from neurofibrillary tangles (Larner, 1997). Although the emerging role of the cerebellum in AD has gained some attention, recent studies revealed that the genomic changes mainly occurred in the cortex instead of the cerebellum, especially excitatory neurons are preferentially vulnerable to pathological changes in AD (Fu et al., 2019; Leng et al., 2021; Miller et al., 2022). Multiple cerebral regions have been reported to be related to AD (Mu and Gage, 2011; Aggleton et al., 2016; Cogswell et al., 2021), among which the frontal cortex is more predictive of cognitive impairments and early disturbance of daily activities, which gives rise to more sensitivity to subclinical changes (Stoeckel et al., 2013; Marshall et al., 2019). Therefore, to identify biomarkers that are more related to the pathogenesis and clinical manifestations of AD and avoid interference from non-AD-associated genes, we selected DEGs in the frontal cortex of AD patients as compared with control subjects, while not in cerebellum AD patients as compared with control subjects. Those DEGs were defined as AD-associated genes.
In the current studies, in order to solve the problem of the small sample size of existing individual databases originating from frontal samples of AD patients, we first integrated four homogeneous databases into an integrated database with a larger sample size. Then, the frontal-associated DEGs of AD were screened by comparing the differences in the DEGs between the integrated and cerebellar datasets (Figure 2A). AD, HD, and FTD are neurodegenerative diseases with cognitive impairment, which clinically need differential diagnosis. To further identify the potential biomarkers for AD diagnosis, the frontal-associated DEGs and the DEGs from the datasets of FTD and HD frontal samples were analyzed. The 626 AD-associated DEGs were identified, including 580 upregulated genes and 46 downregulated genes (Figure 2B). The functional enrichment analysis revealed that the immune response and oxidative stress-related processes were highly enriched such as neutrophil activation, immunological synapse formation, response to oxidative stress, reactive oxygen species, and so forth (Figure 3). As mounting genetic and functional evidence indicates, neuroinflammation is a prominent manifestation of AD, and the immune response does matter a lot in the pathogenesis of the disease (Gjoneska et al., 2015; Shi and Holtzman, 2018). The immune response in AD is mobilized by the immune components in the central nervous system (CNS) mainly including complement and microglia, which function as a “double-edged sword.” Complement proteins not only act as the first line of defense to help synaptic pruning, mediate Aβ clearance and maintain neural circuits (Schafer et al., 2012; Hong et al., 2016) but associate with Aβ plaques causing the surrounding neuronal atrophy and synapse loss (Hong et al., 2016; Jevtic et al., 2017; Shi et al., 2017). As one of the prominent immune cells of the CNS, microglia rapidly respond to stimuli and pathogens performing immune surveillance, phagocytosis, and neuroprotection (Streit et al., 1999; Davalos et al., 2005; Nimmerjahn et al., 2005). However, the inflammatory cytokines and oxidative stress produced by microglia also lead to neural impairment (Heneka et al., 2013; McIntosh et al., 2019; Marschallinger et al., 2020; Hashioka et al., 2021). Recent studies also suggest that oxidative stress causes neuronal damage in various pathways, and plays a critical or even center role pathogenesis and mechanism of AD (Jiang et al., 2016; Bai et al., 2022). Oxidative stress promotes the expression of amyloid precursor protein (APP) and upregulates the activity of β-secretase contributing to the aggregation of Aβ (Tamagno et al., 2012; Butterfield and Boyd-Kimball, 2018). Oxidative stress can also enhance the Tau phosphorylation by producing reactive oxygen species (ROS) and directly interacting with glycogen synthase kinase-3 (GSK3) (Su et al., 2010; Du et al., 2022).
Most importantly, DCN and RGS1 were identified to be useful diagnostic biomarkers by integrated bioinformatic analysis and machine-learning strategies. The diagnostic efficacies of DCN and RGS1 were verified by ROC analysis with the AUCs of 0.8148 and 0.8262 in dataset GSE33000, and 0.8595 and 0.8675 in GSE44770. And the combination of the two biomarkers as a diagnostic tool for AD owned even higher AUCs of 0.863 and 0.869 in the validated datasets. Furthermore, the correlation analysis indicated that DCN was significantly correlated to the CDR score and may be correlated to the Braak stage, and the RGS1 showed a significant correlation to the Braak stage. The CDR is one of the most widely used global clinical rating scales to evaluate the development of disease (Morris, 1993). Braak staging is based on the neurofibrillary tangle topographic distribution in the brain and is strongly associated with cognitive impairment (Braak and Braak, 1991). Therefore, DCN and RGS1 may reflect the development of the disease.
Decorin is an extracellular matrix proteoglycan associated with collagen fibril formation (Reed and Iozzo, 2002). Recent researches have shown that it also plays a critical role in autoimmune and inflammatory diseases (Dong et al., 2022), antifibrotic (Järvinen and Ruoslahti, 2019), antioxidant, and antiangiogenic properties (Sofeu Feugaing et al., 2013; Järveläinen et al., 2015). DCN was found significantly increased in both AD mouse models and CSF of AD patients, predicting well innate immune activation and potential choroid plexus dysfunction (Jiang et al., 2022). Other studies also demonstrated that endothelial-activated DCN-positive astrocytes contributed to vascular amyloid deposits but not parenchymal amyloid plaques in AD mouse models and AD/CAA patients (Taylor et al., 2022). Our study here confirmed that DCN was significantly increased in AD brain parenchyma at the mRNA level and could perform as a useful diagnostic marker. Future study is still needed to clarify the source and function of AD pathogenesis.
RGS1 is one of the members of the RGS family and is identified as an immediate early gene responding to B cell activation signals (Liang et al., 2018). RGS1 serves as a negative regulator to inhibit the chemotaxis of cytotoxic T lymphocytes and TH1 cells toward tumor-associated chemokines (Huang D. et al., 2021). It was also found to regulate the homeostasis and trafficking of B and T cells to inflammatory diseases and attract macrophages to atherosclerotic plaques (Patel et al., 2015). At present, research on the association between RGS1 and AD is limited. Only one study has shown that RGS1 was upregulated in the PBMCs of AD patients (Leandro et al., 2018). Therefore, RGS1 is expected to be a blood-based diagnostic marker, and the role of RGS1 in AD is worthy of further study.
There are some limitations to our study. First, although we carefully select the same frontal lobe of brain samples of AD from the same platforms of Affymetrix and have validated them in another two datasets, the results still need to be thoroughly confirmed experimentally. Second, limited by the sample size, the availability of the biomarkers in differentiating from other neurodegenerative diseases and reflecting the development of the disease needs further clinical exploration. Third, lacking appropriate datasets of the frontal cortex with a diagnosis of HD and FTD from the same platform as the selected datasets of AD, we failed to further evaluate the differential effect of biomarkers distinguishing AD from HD and FTD. We would like to update this evaluation, once there were appropriate datasets.
We applied an approach of integrated bioinformatic analysis combined with machine learning strategies to identify AD frontal-associated biomarkers differentiating from normal subjects, FTD and HD. The results revealed that DCN and RGS1 associated with immune response are useful biomarkers for diagnosing AD and distinguishing from FTD and HD, and their mRNA levels may also reflect the development of the disease.
The original contributions presented in this study are included in the article/Supplementary material, further inquiries can be directed to the corresponding authors.
SS and CZ designed the study and accessed the funding. BJ downloaded the data and perform bioinformatics analysis. SS, GF, and BJ wrote the manuscript. All authors contributed to the article and approved the submitted manuscript.
This study was supported by grants from the National Natural Science Foundation of China (81901081, 81870822, 91332201, and 82171408), Shanghai Municipal Science and Technology Major Project, and the Natural Science Foundation of Fujian Province (2020CXB049).
CZ holds shares of Shanghai Raising Pharmaceutical Co., Ltd., which is dedicated to developing drugs for the prevention and treatment of AD. SS was employed by the company Shanghai Raising Pharmaceutical Technology Co., Ltd.
The remaining authors declare that the research was conducted in the absence of any commercial or financial relationships that could be construed as a potential conflict of interest.
All claims expressed in this article are solely those of the authors and do not necessarily represent those of their affiliated organizations, or those of the publisher, the editors and the reviewers. Any product that may be evaluated in this article, or claim that may be made by its manufacturer, is not guaranteed or endorsed by the publisher.
The Supplementary Material for this article can be found online at: https://www.frontiersin.org/articles/10.3389/fnmol.2023.1152279/full#supplementary-material
Aggleton, J., Pralus, A., Nelson, A., and Hornberger, M. (2016). Thalamic pathology and memory loss in early Alzheimer’s disease: moving the focus from the medial temporal lobe to Papez circuit. Brain. 139(Pt. 7), 1877–1890. doi: 10.1093/brain/aww083
Alzheimer’s Association (2021). 2021 Alzheimer’s disease facts and figures. Alzheimers Dement. 17, 327–406. doi: 10.1002/alz.12328
Bai, R., Guo, J., Ye, X., Xie, Y., and Xie, T. (2022). Oxidative stress: the core pathogenesis and mechanism of Alzheimer’s disease. Ageing Res. Rev. 77:101619. doi: 10.1016/j.arr.2022.101619
Bardou, P., Mariette, J., Escudié, F., Djemiel, C., and Klopp, C. (2014). jvenn: an interactive Venn diagram viewer. BMC Bioinform. 15:293. doi: 10.1186/1471-2105-15-293
Battaglia, G., Cannella, M., Riozzi, B., Orobello, S., Maat-Schieman, M., Aronica, E., et al. (2011). Early defect of transforming growth factor β1 formation in Huntington’s disease. J. Cell Mol. Med. 15, 555–571. doi: 10.1111/j.1582-4934.2010.01011.x
Boeve, B., Boxer, A., Kumfor, F., Pijnenburg, Y., and Rohrer, J. (2022). Advances and controversies in frontotemporal dementia: diagnosis, biomarkers, and therapeutic considerations. Lancet Neurol. 21, 258–272. doi: 10.1016/S1474-4422(21)00341-0
Braak, H., and Braak, E. (1991). Neuropathological stageing of Alzheimer-related changes. Acta Neuropathol. 82, 239–259. doi: 10.1007/BF00308809
Bühlmann, P. (2011). Regression shrinkage and selection via the Lasso: a retrospective (Robert Tibshirani). J R Stat. Soc. Ser. B Stat. Methodol. 73, 277–279. doi: 10.1111/j.1467-9868.2011.00771.x
Butterfield, D., and Boyd-Kimball, D. (2018). Oxidative stress, Amyloid-β peptide, and altered key molecular pathways in the pathogenesis and progression of Alzheimer’s disease. J. Alzheimers Dis. 62, 1345–1367. doi: 10.3233/JAD-170543
Caron, N., Banos, R., Aly, A., Xie, Y., Ko, S., Potluri, N., et al. (2022). Cerebrospinal fluid mutant huntingtin is a biomarker for huntingtin lowering in the striatum of Huntington disease mice. Neurobiol. Dis. 166, 105652. doi: 10.1016/j.nbd.2022.105652
Cogswell, P., Wiste, H., Senjem, M., Gunter, J., Weigand, S., Schwarz, C., et al. (2021). Associations of quantitative susceptibility mapping with Alzheimer’s disease clinical and imaging markers. Neuroimage 224:117433. doi: 10.1016/j.neuroimage.2020.117433
Davalos, D., Grutzendler, J., Yang, G., Kim, J., Zuo, Y., Jung, S., et al. (2005). ATP mediates rapid microglial response to local brain injury in vivo. Nat. Neurosci. 8, 752–758. doi: 10.1038/nn1472
Dong, Y., Zhong, J., and Dong, L. (2022). The role of decorin in autoimmune and inflammatory diseases. J. Immunol. Res. 2022:1283383. doi: 10.1155/2022/1283383
Du, F., Yu, Q., Kanaan, N., and Yan, S. (2022). Mitochondrial oxidative stress contributes to the pathological aggregation and accumulation of tau oligomers in Alzheimer’s disease. Hum. Mol. Genet. 31, 2498–2507. doi: 10.1093/hmg/ddab363
Fu, H., Possenti, A., Freer, R., Nakano, Y., Hernandez Villegas, N., Tang, M., et al. (2019). A tau homeostasis signature is linked with the cellular and regional vulnerability of excitatory neurons to tau pathology. Nat. Neurosci. 22, 47–56. doi: 10.1038/s41593-018-0298-7
Gjoneska, E., Pfenning, A., Mathys, H., Quon, G., Kundaje, A., Tsai, L., et al. (2015). Conserved epigenomic signals in mice and humans reveal immune basis of Alzheimer’s disease. Nature 518, 365–369. doi: 10.1038/nature14252
Hashioka, S., Wu, Z., and Klegeris, A. (2021). Glia-driven neuroinflammation and systemic inflammation in Alzheimer’s disease. Curr Neuropharmacol. 19, 908–924. doi: 10.2174/1570159X18666201111104509
Heneka, M., Kummer, M., Stutz, A., Delekate, A., Schwartz, S., Vieira-Saecker, A., et al. (2013). NLRP3 is activated in Alzheimer’s disease and contributes to pathology in APP/PS1 mice. Nature 493, 674–678. doi: 10.1038/nature11729
Hong, S., Beja-Glasser, V., Nfonoyim, B., Frouin, A., Li, S., Ramakrishnan, S., et al. (2016). Complement and microglia mediate early synapse loss in Alzheimer mouse models. Science 352, 712–716. doi: 10.1126/science.aad8373
Huang, D., Chen, X., Zeng, X., Lao, L., Li, J., Xing, Y., et al. (2021). Targeting regulator of G protein signaling 1 in tumor-specific T cells enhances their trafficking to breast cancer. Nat. Immunol. 22, 865–879. doi: 10.1038/s41590-021-00939-9
Huang, H., Tseng, Y., Chen, Y., Chen, P., and Chiu, H. (2021). Diagnostic accuracy of the clinical dementia rating scale for detecting mild cognitive impairment and dementia: a bivariate meta-analysis. Int. J. Geriatr. Psychiatry 36, 239–251. doi: 10.1002/gps.5436
Järveläinen, H., Sainio, A., and Wight, T. (2015). Pivotal role for decorin in angiogenesis. Matrix Biol. 43, 15–26. doi: 10.1016/j.matbio.2015.01.023
Järvinen, T., and Ruoslahti, E. (2019). Generation of a multi-functional, target organ-specific, anti-fibrotic molecule by molecular engineering of the extracellular matrix protein, decorin. Br. J. Pharmacol. 176, 16–25. doi: 10.1111/bph.14374
Jassal, B., Matthews, L., Viteri, G., Gong, C., Lorente, P., Fabregat, A., et al. (2020). The reactome pathway knowledgebase. Nucleic Acids Res. 48, D498–D503. doi: 10.1093/nar/gkz1031
Jevtic, S., Sengar, A., Salter, M., and McLaurin, J. (2017). The role of the immune system in Alzheimer disease: etiology and treatment. Ageing Res. Rev. 40, 84–94. doi: 10.1016/j.arr.2017.08.005
Jiang, R., Smailovic, U., Haytural, H., Tijms, B., Li, H., Haret, R., et al. (2022). Increased CSF-decorin predicts brain pathological changes driven by Alzheimer’s Aβ amyloidosis. Acta Neuropathol. Commun. 10:96. doi: 10.1186/s40478-022-01398-5
Jiang, T., Sun, Q., and Chen, S. (2016). Oxidative stress: a major pathogenesis and potential therapeutic target of antioxidative agents in Parkinson’s disease and Alzheimer’s disease. Prog. Neurobiol. 147, 1–19. doi: 10.1016/j.pneurobio.2016.07.005
John, A., and Reddy, P. (2021). Synaptic basis of Alzheimer’s disease: focus on synaptic amyloid beta, P-tau and mitochondria. Ageing Res. Rev. 65:101208. doi: 10.1016/j.arr.2020.101208
Kamat, P., Kalani, A., Rai, S., Swarnkar, S., Tota, S., Nath, C., et al. (2016). Mechanism of oxidative stress and synapse dysfunction in the pathogenesis of Alzheimer’s disease: understanding the therapeutics strategies. Mol. Neurobiol. 53, 648–661. doi: 10.1007/s12035-014-9053-6
Larner, A. (1997). The cerebellum in Alzheimer’s disease. Dement. Geriatr. Cogn. Disord. 8, 203–209. doi: 10.1159/000106632
Leandro, G., Evangelista, A., Lobo, R., Xavier, D., Moriguti, J., and Sakamoto-Hojo, E. (2018). Changes in expression profiles revealed by transcriptomic analysis in peripheral blood mononuclear cells of Alzheimer’s disease patients. J. Alzheimers Dis. 66, 1483–1495. doi: 10.3233/JAD-170205
Leek, J., and Storey, J. (2007). Capturing heterogeneity in gene expression studies by surrogate variable analysis. PLoS Genet. 3:1724–1735. doi: 10.1371/journal.pgen.0030161
Leek, J., and Storey, J. D. (2008). A general framework for multiple testing dependence. Proc. Natl. Acad. Sci. U.S.A. 105, 18718–18723. doi: 10.1073/pnas.0808709105
Leek, J., Johnson, W., Parker, H., Fertig, E., Jaffe, A., Zhang, Y., et al. (2020). sva: Surrogate variable analysis. R package version.
Leng, K., Li, E., Eser, R., Piergies, A., Sit, R., Tan, M., et al. (2021). Molecular characterization of selectively vulnerable neurons in Alzheimer’s disease. Nat. Neurosci. 24, 276–287. doi: 10.1038/s41593-020-00764-7
Liang, X., Ma, M., Zhou, Z., Wang, J., Yang, X., Rao, S., et al. (2018). Ligand-triggered de-repression of Arabidopsis heterotrimeric G proteins coupled to immune receptor kinases. Cell Res. 28, 529–543. doi: 10.1038/s41422-018-0027-5
Liu, P., Xie, Y., Meng, X., and Kang, J. (2019). History and progress of hypotheses and clinical trials for Alzheimer’s disease. Signal Transduct. Target Ther. 4:29. doi: 10.1038/s41392-019-0063-8
Long, J., and Holtzman, D. (2019). Alzheimer disease: an update on pathobiology and treatment strategies. Cell 179, 312–339. doi: 10.1016/j.cell.2019.09.001
Lowe, V., Wiste, H., Senjem, M., Weigand, S., Therneau, T., Boeve, B., et al. (2018). Widespread brain tau and its association with ageing, Braak stage and Alzheimer’s dementia. Brain 141, 271–287. doi: 10.1093/brain/awx320
Magistri, M., Velmeshev, D., Makhmutova, M., and Faghihi, M. (2015). Transcriptomics profiling of Alzheimer’s disease reveal neurovascular defects, altered Amyloid-β homeostasis, and deregulated expression of long noncoding RNAs. J Alzheimers Dis. 48, 647–665. doi: 10.3233/JAD-150398
Marschallinger, J., Iram, T., Zardeneta, M., Lee, S., Lehallier, B., Haney, M., et al. (2020). Lipid-droplet-accumulating microglia represent a dysfunctional and proinflammatory state in the aging brain. Nat. Neurosci. 23, 194–208. doi: 10.1038/s41593-019-0566-1
Marshall, G. A., Gatchel, J. R., Donovan, N. J., Muniz, M. C., Schultz, A. P., Becker, J. A., et al. (2019). Regional tau correlates of instrumental activities of daily living and apathy in mild cognitive impairment and Alzheimer’s disease dementia. J. Alzheimers Dis. 67, 757–768. doi: 10.3233/JAD-170578
McIntosh, A., Mela, V., Harty, C., Minogue, A., Costello, D., Kerskens, C., et al. (2019). Iron accumulation in microglia triggers a cascade of events that leads to altered metabolism and compromised function in APP/PS1 mice. Brain Pathol. 29, 606–621. doi: 10.1111/bpa.12704
Menculini, G., Chipi, E., Paolini Paoletti, F., Gaetani, L., Nigro, P., Simoni, S., et al. (2021). Insights into the pathophysiology of psychiatric symptoms in central nervous system disorders: implications for early and differential diagnosis. Int. J. Mol. Sci. 22:4440. doi: 10.3390/ijms22094440
Miller, M., Huang, A., Kim, J., Zhou, Z., Kirkham, S., Maury, E., et al. (2022). Somatic genomic changes in single Alzheimer’s disease neurons. Nature 604, 714–722. doi: 10.1038/s41586-022-04640-1
Minoru, K., Miho, F., Mao, T., Yoko, S., and Kanae, M. (2017). KEGG: new perspectives on genomes, pathways, diseases and drugs. Nucleic Acids Res. 45, D353–D361. doi: 10.1093/nar/gkw1092
Moll, T., Shaw, P., and Cooper-Knock, J. (2020). Disrupted glycosylation of lipids and proteins is a cause of neurodegeneration. Brain 143, 1332–1340. doi: 10.1093/brain/awz358
Morris, J. (1993). The clinical dementia rating (CDR): current version and scoring rules. Neurology 43, 2412–2414. doi: 10.1212/WNL.43.11.2412-a
Mu, Y., and Gage, F. (2011). Adult hippocampal neurogenesis and its role in Alzheimer’s disease. Mol. Neurodegener. 6:85. doi: 10.1186/1750-1326-6-85
Nelson, P., Alafuzoff, I., Bigio, E., Bouras, C., Braak, H., Cairns, N., et al. (2012). Correlation of Alzheimer disease neuropathologic changes with cognitive status: a review of the literature. J. Neuropathol. Exp. Neurol. 71, 362–381. doi: 10.1097/NEN.0b013e31825018f7
Nimmerjahn, A., Kirchhoff, F., and Helmchen, F. (2005). Resting microglial cells are highly dynamic surveillants of brain parenchyma in vivo. Science 308, 1314–1318. doi: 10.1126/science.1110647
Patel, J., McNeill, E., Douglas, G., Hale, A., de Bono, J., Lee, R., et al. (2015). RGS1 regulates myeloid cell accumulation in atherosclerosis and aortic aneurysm rupture through altered chemokine signaling. Nat. Commun. 6:6614. doi: 10.1038/ncomms7614
Qi, Y. (2012). “Random forest for bioinformatics,” in Ensemble machine learning, eds C. Zhang and Y. Q. Ma (Berlin: Springer), 307–323. doi: 10.1007/978-1-4419-9326-7_11
Reed, C., and Iozzo, R. (2002). The role of decorin in collagen fibrillogenesis and skin homeostasis. Glycoconj. J. 19, 249–255. doi: 10.1023/A:1025383913444
Santacruz Escudero, J., Beltrán, J., Palacios, Á, Chimbí, C., Matallana, D., Reyes, P., et al. (2019). Neuropsychiatric symptoms as predictors of clinical course in neurodegeneration. A longitudinal study. Front. Aging Neurosci. 11:176. doi: 10.3389/fnagi.2019.00176
Schafer, D., Lehrman, E., Kautzman, A., Koyama, R., Mardinly, A., Yamasaki, R., et al. (2012). Microglia sculpt postnatal neural circuits in an activity and complement-dependent manner. Neuron 74, 691–705. doi: 10.1016/j.neuron.2012.03.026
Schafer, K., Tractenberg, R., Sano, M., Mackell, J., Thomas, R., Gamst, A., et al. (2004). Reliability of monitoring the clinical dementia rating in multicenter clinical trials. Alzheimer Dis. Assoc. Disord. 18, 219–222.
Seshan, V., Gnen, M., and Begg, C. (2013). Comparing ROC curves derived from regression models. Stat. Med. 32, 1483–1493. doi: 10.1002/sim.5648
Shi, Q., Chowdhury, S., Ma, R., Le, K., Hong, S., Caldarone, B., et al. (2017). Complement C3 deficiency protects against neurodegeneration in aged plaque-rich APP/PS1 mice. Sci. Transl. Med. 9:eaaf6295. doi: 10.1126/scitranslmed.aaf6295
Shi, Y., and Holtzman, D. (2018). Interplay between innate immunity and Alzheimer disease: APOE and TREM2 in the spotlight. Nat. Rev. Immunol. 18, 759–772. doi: 10.1038/s41577-018-0051-1
Smith-Dijak, A., Sepers, M., and Raymond, L. (2019). Alterations in synaptic function and plasticity in Huntington disease. J. Neurochem. 150, 346–365. doi: 10.1111/jnc.14723
Sofeu Feugaing, D., Götte, M., and Viola, M. (2013). More than matrix: the multifaceted role of decorin in cancer. Eur. J. Cell Biol. 92, 1–11. doi: 10.1016/j.ejcb.2012.08.004
Stoeckel, L. E., Stewart, C. C., Griffith, H. R., Triebel, K., Okonkwo, O. C., den Hollander, J. A., et al. (2013). MRI volume of the medial frontal cortex predicts financial capacity in patients with mild Alzheimer’s disease. Brain Imaging Behav. 7, 282–292. doi: 10.1007/s11682-013-9226-3
Streit, W., Walter, S., and Pennell, N. (1999). Reactive microgliosis. Prog. Neurobiol. 57, 563–581. doi: 10.1016/S0301-0082(98)00069-0
Su, B., Wang, X., Lee, H., Tabaton, M., Perry, G., Smith, M., et al. (2010). Chronic oxidative stress causes increased tau phosphorylation in M17 neuroblastoma cells. Neurosci. Lett. 468, 267–271. doi: 10.1016/j.neulet.2009.11.010
Suykens, J., and Vandewalle, J. (1999). Least squares support vector machine classifiers. Neural Process. Lett. 9, 293–300. doi: 10.1023/A:1018628609742
Tamagno, E., Guglielmotto, M., Monteleone, D., and Tabaton, M. (2012). Amyloid-β production: major link between oxidative stress and BACE1. Neurotox Res. 22, 208–219. doi: 10.1007/s12640-011-9283-6
Taylor, X., Cisternas, P., Jury, N., Martinez, P., Huang, X., You, Y., et al. (2022). Activated endothelial cells induce a distinct type of astrocytic reactivity. Commun. Biol. 5:282. doi: 10.1038/s42003-022-03237-8
Thijssen, E., La Joie, R., Strom, A., Fonseca, C., Iaccarino, L., Wolf, A., et al. (2021). Plasma phosphorylated tau 217 and phosphorylated tau 181 as biomarkers in Alzheimer’s disease and frontotemporal lobar degeneration: a retrospective diagnostic performance study. Lancet Neurol. 20, 739–752. doi: 10.1016/S1474-4422(21)00214-3
Thijssen, E., La Joie, R., Wolf, A., Strom, A., Wang, P., Iaccarino, L., et al. (2020). Diagnostic value of plasma phosphorylated tau181 in Alzheimer’s disease and frontotemporal lobar degeneration. Nat. Med. 26, 387–397. doi: 10.1038/s41591-020-0762-2
Tibshirani, R. (1996). Regression shrinkage and Selection via the lasso. J. R. Stat. Soc. Ser. B. 58, 267–288. doi: 10.1111/j.2517-6161.1996.tb02080.x
Vercruysse, P., Vieau, D., Blum, D., Petersén, Å, and Dupuis, L. (2018). Hypothalamic alterations in neurodegenerative diseases and their relation to abnormal energy metabolism. Front. Mol. Neurosci. 11:2. doi: 10.3389/fnmol.2018.00002
Wang, J., Ma, G., Tang, X., Shi, Q., Yu, M., Lou, M., et al. (2022). Brain region-specific synaptic function of FUS underlies the FTLD-linked behavioural disinhibition. Brain. [Epub ahead of print]. doi: 10.1093/brain/awac411
Wang, M., Roussos, P., McKenzie, A., Zhou, X., Kajiwara, Y., Brennand, K., et al. (2016). Integrative network analysis of nineteen brain regions identifies molecular signatures and networks underlying selective regional vulnerability to Alzheimer’s disease. Genome Med. 8:104. doi: 10.1186/s13073-016-0355-3
Weston, J., and Guyon, I. (2012). Support vector machine—Recursive feature elimination (SVM-RFE). Washington, DC: U.S. Google Patents.
Wild, E., Björkqvist, M., and Tabrizi, S. (2008). Immune markers for Huntington’s disease? Expert Rev. Neurother. 8, 1779–1781. doi: 10.1586/14737175.8.12.1779
Williams, J., Cao, Q., and Yan, Z. (2021). Transcriptomic analysis of human brains with Alzheimer’s disease reveals the altered expression of synaptic genes linked to cognitive deficits. Brain Commun. 3:fcab123. doi: 10.1093/braincomms/fcab123
Yu, G., and He, Q. (2016). ReactomePA: an R/Bioconductor package for reactome pathway analysis and visualization. Mol. Biosyst. 12, 477–479. doi: 10.1039/C5MB00663E
Yu, G., Wang, L., Han, Y., and He, Q. (2012). clusterProfiler: an R package for comparing biological themes among gene clusters. Omics 16, 284–287. doi: 10.1089/omi.2011.0118
Keywords: Alzheimer’s disease, neurodegenerative diseases, bioinformatic analysis, machine learning strategies, biomarkers
Citation: Jin B, Fei G, Sang S and Zhong C (2023) Identification of biomarkers differentiating Alzheimer’s disease from other neurodegenerative diseases by integrated bioinformatic analysis and machine-learning strategies. Front. Mol. Neurosci. 16:1152279. doi: 10.3389/fnmol.2023.1152279
Received: 27 January 2023; Accepted: 24 April 2023;
Published: 10 May 2023.
Edited by:
Wenjun Zhou, Hangzhou Shansier Medical Technologies Co., Ltd., ChinaReviewed by:
Li Zeng, National Neuroscience Institute (NNI), SingaporeCopyright © 2023 Jin, Fei, Sang and Zhong. This is an open-access article distributed under the terms of the Creative Commons Attribution License (CC BY). The use, distribution or reproduction in other forums is permitted, provided the original author(s) and the copyright owner(s) are credited and that the original publication in this journal is cited, in accordance with accepted academic practice. No use, distribution or reproduction is permitted which does not comply with these terms.
*Correspondence: Shaoming Sang, c2FuZ3NoYW9taW5nNjIwMkAxMjYuY29t; Chunjiu Zhong, emhvbmdjakAxNjMuY29t
Disclaimer: All claims expressed in this article are solely those of the authors and do not necessarily represent those of their affiliated organizations, or those of the publisher, the editors and the reviewers. Any product that may be evaluated in this article or claim that may be made by its manufacturer is not guaranteed or endorsed by the publisher.
Research integrity at Frontiers
Learn more about the work of our research integrity team to safeguard the quality of each article we publish.