
94% of researchers rate our articles as excellent or good
Learn more about the work of our research integrity team to safeguard the quality of each article we publish.
Find out more
ORIGINAL RESEARCH article
Front. Mol. Neurosci. , 13 December 2022
Sec. Brain Disease Mechanisms
Volume 15 - 2022 | https://doi.org/10.3389/fnmol.2022.999938
This article is part of the Research Topic Advances in Brain Disorders: from Mechanisms to Therapeutic Targets View all 21 articles
 Zheyu Zhang1,2†
 Sifang Zhang1,2†
 Jianhua Huang3Xiaoyun Cao1,4Chao Hou1,4Zhihong Luo1,4Xiaoyan Wang1,4Xuejun Liu1,4Qiang Li1,4
 Xi Zhang1,4Yujun Guo1,4Huiqiong Xiao1,4Ting Xie1,4
 Xuhui Zhou1,4*
Objective: In this study, we aimed to characterize the plasma metabolic profiles of brain atrophy and alcohol dependence (s) and to identify the underlying pathogenesis of brain atrophy related to alcohol dependence.
Methods: We acquired the plasma samples of alcohol-dependent patients and performed non-targeted metabolomic profiling analysis to identify alterations of key metabolites in the plasma of BA-ADPs. Machine learning algorithms and bioinformatic analysis were also used to identify predictive biomarkers and investigate their possible roles in brain atrophy related to alcohol dependence.
Results: A total of 26 plasma metabolites were significantly altered in the BA-ADPs group when compared with a group featuring alcohol-dependent patients without brain atrophy (NBA-ADPs). Nine of these differential metabolites were further identified as potential biomarkers for BA-ADPs. Receiver operating characteristic curves demonstrated that these potential biomarkers exhibited good sensitivity and specificity for distinguishing BA-ADPs from NBA-ADPs. Moreover, metabolic pathway analysis suggested that glycerophospholipid metabolism may be highly involved in the pathogenesis of alcohol-induced brain atrophy.
Conclusion: This plasma metabolomic study provides a valuable resource for enhancing our understanding of alcohol-induced brain atrophy and offers potential targets for therapeutic intervention.
Excessive and chronic alcohol consumption, caused by addictive behaviors in alcoholic patients, is closely related to the reduced viability of neuronal cells (neurons and glial cells) and axonal degradation, thus resulting in brain atrophy (Sutherland et al., 2014; Angebrandt et al., 2022). It has been reported that the degree of brain atrophy correlates with the rate and amount of alcohol consumed over a lifetime (de la Monte and Kril, 2014). Moreover, the latest research has detected negative relationships between alcohol consumption and gray and white matter volumes across the brain (Daviet et al., 2022). Abnormal patterns of macroscopic and microstructural changes in the brain, especially brain atrophy, are closely related to the cognitive dysfunction of alcoholics in the clinical setting (Zahr et al., 2011). Cognitive impairment, including deficits in memory, executive abilities, visuospatial processing, speed of processing and, to a lesser extent, attention and general intelligence, may dramatically influence a patient’s social function and quality-of-life (Godin et al., 2019). In view of the high prevalence of alcohol-related brain atrophy (ARBA) and its associated cognitive dysfunction, a comprehensive analysis of the mechanisms underlying ARBA and the identification of potential biomarkers for this disease are urgently needed.
Metabolomics, a systematic method for the qualitative and quantitative analysis of all low-molecular-weight metabolites, is suitable for identifying metabolic indicators and can provide a basis for individualized diagnosis and treatment (Ribbenstedt et al., 2018). Moreover, the discovery of new markers can provide new ideas for the diagnosis and treatment of difficult diseases and can provide a useful guide for clinical diagnosis and treatment (Vuckovic, 2018). Metabolomic research based on untargeted/targeted mass spectrometry (MS) and proton nuclear magnetic resonance (1H-NMR) spectroscopy approaches may represent a valuable research tool to identify the underlying pathogenesis of alcohol-related disorders. Mittal and Dabur previously studied the influence of an aqueous extract of Tinospora cordifolia on the urinary metabolic signature of chronic alcohol using liquid chromatography–tandem mass spectrometry (LC–MS/MS; Mittal and Dabur, 2015). In another study, Zhu et al. identified discriminatory metabolic profiles between healthy and alcohol dependent individuals by using metabolomics technology (Zhu et al., 2021). To our knowledge, no previous study has identified alterations in the metabolic and protein profiles of plasma samples taken from alcohol-dependent patients with brain atrophy.
Machine learning, as a field of artificial intelligence (AI), provides intelligent data processing while facilitating reasoning and the initial settings to determine functional relationships (Deo, 2015). Due to the diversification of algorithms, machine learning is gradually emerging in the field of multi-omics, including artificial neural networks (ANNs), and random forest (RF) algorithms (Liebal et al., 2020). The main applications of machine learning in disease-related multi-omics data analysis include (1) the stratification of patients to discover various subtypes of human diseases and to discover different treatment/prognostic outcomes, and (2) the investigation of various diseases by identifying biomarkers of omics features under various state (Nicora et al., 2020). Traditional methods for processing metabolomics data tend to only focus on bridging sample differences within groups. However, in applied pharmaceutical research (such as candidate target discovery and drug sensitivity), we also need to consider data perturbation and sensitivity to sample size (Schrimpe-Rutledge et al., 2016). Based on their specific characteristics, a combination of traditional single evaluation and machine learning algorithms could provide an efficient means of evaluating the performance of metabolomics data processing from multiple perspectives (Mirza et al., 2019; Picard et al., 2021). Specifically, this strategy can achieve effective data processing from five relatively independent directions: reducing within-group sample differences, differential metabolic analysis, the stability of marker identification, classification accuracy, and the consistency of biological gold standards.
In this study, we used a LC–MS/MS-based metabonomics approach to provide a robust technical platform to investigate the profiles of plasma metabolites in ARBA patients and identify characteristic metabolites that can be used to discriminate ARBA from non-ARBA. MetaboAnalyst version 5.0 was then used to identify metabolites and metabolic pathways showing significant enrichment in ARBA. Then, machine learning algorithms were used to identify the most important distinctive metabolites that might be associated with patients with ARBA. The findings of the present study may help to identify the molecular mechanisms that underlie ARBA.
This study was approved by the Ethics Committee of the Hunan Brain Hospital (Reference: 2016121). Signed and informed consent was obtained from each patient.
A total of 126 patients with alcohol addiction were enrolled from Hunan Brain Hospital between March 2019 and January 2020. Brain MRI were performed in all patients to evaluate the extent of brain atrophy.
The inclusion and exclusion criteria were described in our previous publication (Liu et al., 2020). Briefly, the inclusion criteria were as follows: (1) age 18–60 years, Han Chinese; (2) no contraindications for MRI. The exclusion criteria were as follows: (1) patients had any general medical conditions or neurological disorders, including infectious, hepatic, or endocrine disease; (2) patients with a history of severe head injury with skull fracture or loss of consciousness of more than 10 min; (3) patients had any current or previous psychiatric disorder; (4) patients had a family history of psychiatric disorder. The diagnosis of alcohol dependence was made according to the Structured Clinical Interview (SCID) based on the Diagnostic and Statistical Manual of Mental Disorders DSM-IV criteria (Battle, 2013). Alcohol-dependent patients were divided into two subgroups based on whether they have brain atrophy (the experimental group) or not (the control group).
Brain MRI were performed in all patients after blood samples collection. The extent of brain atrophy was evaluated by at least two independent neuroradiologists using the global cortical atrophy scale (Pasquier et al., 1996). Both cortical regions (frontal, temporal, parietal and occipital) and subcortical regions (peri-insular, basal, and vault) were assessed. The severity of atrophy (low, moderate, or severe) was detected by the widening of sulci and narrow of gyri, as well as the reduction in amplitude of the respective regions. Figure 1 shows examples of different severity of brain atrophy.
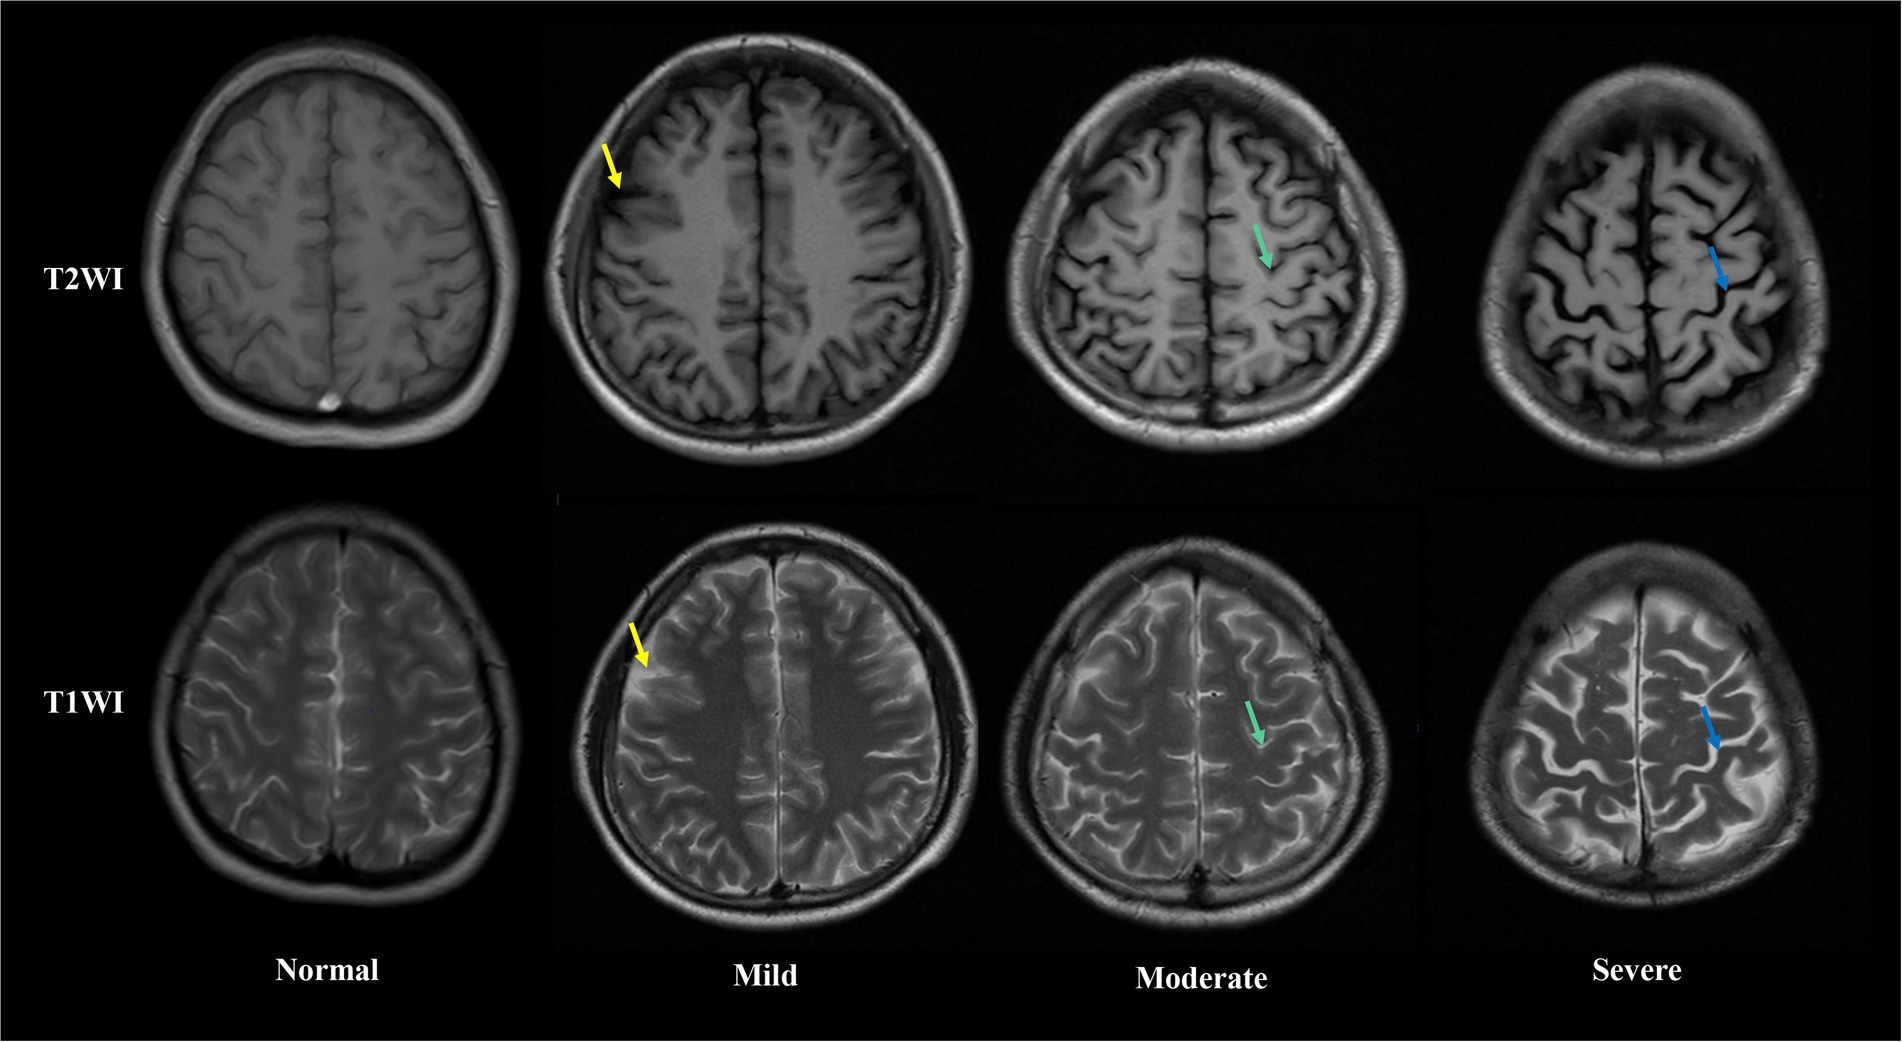
Figure 1. Axial T1 weight (up) and T2 weight (down) magnetic resonance images showing different extent of brain atrophy in Alcohol-dependent patients. From left to right, columns represent absent, low, moderate and sever brain atrophy. In low brain atrophy, sulcal opening peripherally (yellow arrows) is observed. In moderate brain atrophy, widening along the length of the sulcus (green arrows) are observed. In severe brain atrophy, gyral thining (red arrows) is observed.
Blood samples were taken from all inpatients after hospital admission but prior to starting treatment. Blood samples were taken from the experimental and control patients between 6:00 and 6:30 am and placed into plasma collecting tubes. Samples were then centrifuged at 3,000 rpm for 10 min at 4°C and the plasma was aliquoted into 1.5 ml microcentrifuge tubes and immediately stored at −80°C.
For LC–MS, we removed 100 μl of each plasma sample and added 0.4 ml of pre-cooled 0.2% methanol-acetonitrile mixture (1:1, v/v); this was followed by vortex-mixing and ultrasonic extraction on iced water. Next, the solution was centrifuged at 13,000 × g for 15 min at 4°C; 400 μl of the supernatant was taken and dried with nitrogen. Finally, 100 μl of acetonitrile water (1:1, v/v) was added and the re-dissolved solution was injected into a sample bottle for detection. Quality control samples (a mixture of equal quantities of all sample extractions) were injected after every 10 analytical samples to monitor the stability of the LC–MS system.
Data acquisition was performed by UPLC-Q-TOF-MS/MS with the following parameter settings: an ethylene bridged hybrid C18 column (2.1 mm × 100 mm id, 1.7 μm; Waters), mobile phase A (water with 0.1% formic acid), and mobile phase B (acetonitrile with 0.1% formic acid). The gradient of the mobile phase was consistent with our previous metabolomic studies (Zhang et al., 2020). The MS signal was acquired in positive-ion and negative-ion modes.
Raw files for the acquired LC–MS/MS data were imported into the metabolomics-processing software Progenesis QI (Waters) to obtain matched and aligned peak data. Subsequently, peak data containing retention time (RT), molecular formula, along with accurate relative molecular mass and peak area information, were imported into Microsoft Excel so that we could normalize the peak area for further analysis.
Following normalization of the peak area, data were subjected to principal component analysis (PCA), partial least squares discriminant analysis (PLS-DA), and orthogonal partial least squares discriminant analysis (OPLS-DA). The variables showing the most significant differences were identified by selecting those with a VIP > 1 from an S-plot and p < 0.05 from an independent samples t-test. Based on the Human Metabolome Database (HMDB) and secondary fragment ions, we were then able to identify differential variables. Then, we performed metabolic pathway analysis for differentially expressed metabolites with MetaboAnalyst version 5.0 to gain insight into the pathogenesis of ARBA, as described previously (Zhang et al., 2020).
Three machine learning methods (Extreme Gradient Boosting (XGBoost), random forest (RF), and AdaBoost Classifier) were used to identify potential biomarkers from differential metabolites or proteins. The five most important metabolites were identified by XGBoost, RF and AdaBoost, and then combined for subsequent analysis. Machine learning was then performed using the Extreme Smart Analysis Platform.1
The sensitivity and specificity of the combined biomarkers were further analyzed using logistic regression analysis and receiver operating characteristic (ROC) curves. In ROC analysis, the area enclosed by the curve and the x-axis (x = 1 line) was defined as the area under the curve (AUC). Logistic regression analysis was performed using OmicStudio.2
A total of 226 participants were recruited for the present study: 62 were assigned to the NBA-ADP group, 64 were assigned to the BA-ADP group, and 100 were assigned to the Healthy Control (HC) group. Clinical and demographic characteristics were summarized in Table 1. The sex, age, and duration of alcohol dependence between NBA-ADP and BA-ADP group were equivalent. There was no statistical difference in Repeatable Battery for the Assessment of Neuropsychological Status (RBANS) scores between two groups. However, the RBANS scores (including attention, delay memory, immediate memory, language, visuospatial) in BA-ADP group were all slightly higher than these in NBA-ADP group.
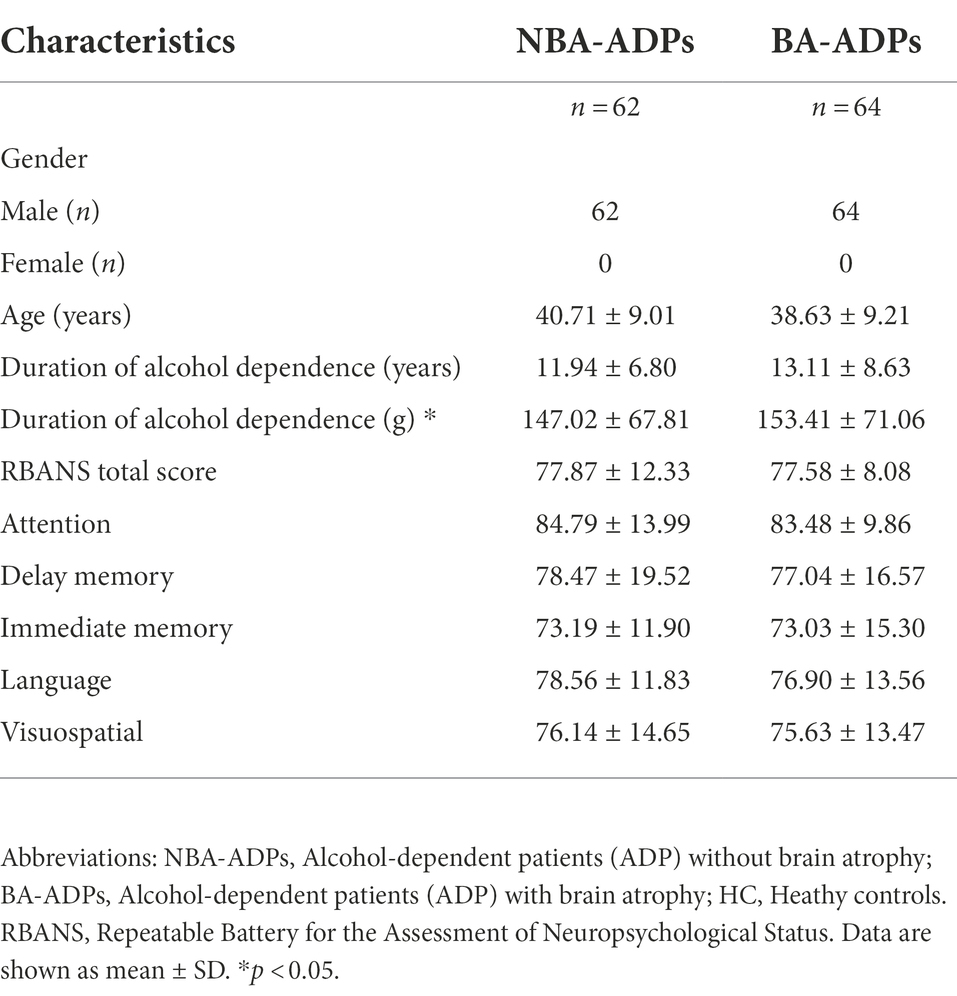
Table 1. Demographic and baseline patient characteristics.
A total of 13,601 peaks were obtained, including 6,189 positive-mode features and 8,432 negative-mode features. A total of 178 positive-mode and 253 negative-mode metabolites were annotated and mapped to public databases. Corresponding to the two modes, 52 and 84 metabolites were, respectively, annotated and mapped to the Kyoto Encyclopedia of Genes and Genomes (KEGG) database. These metabolites belonged to 15 different KEGG compound classifications. Figure 2A shows that these metabolites were mainly classified as phospholipids. According to the KEGG database, these metabolites belonged to 25 different KEGG pathways (Figure 2B). Of these, the lipid metabolism pathway was the pathway that contained the most metabolites.
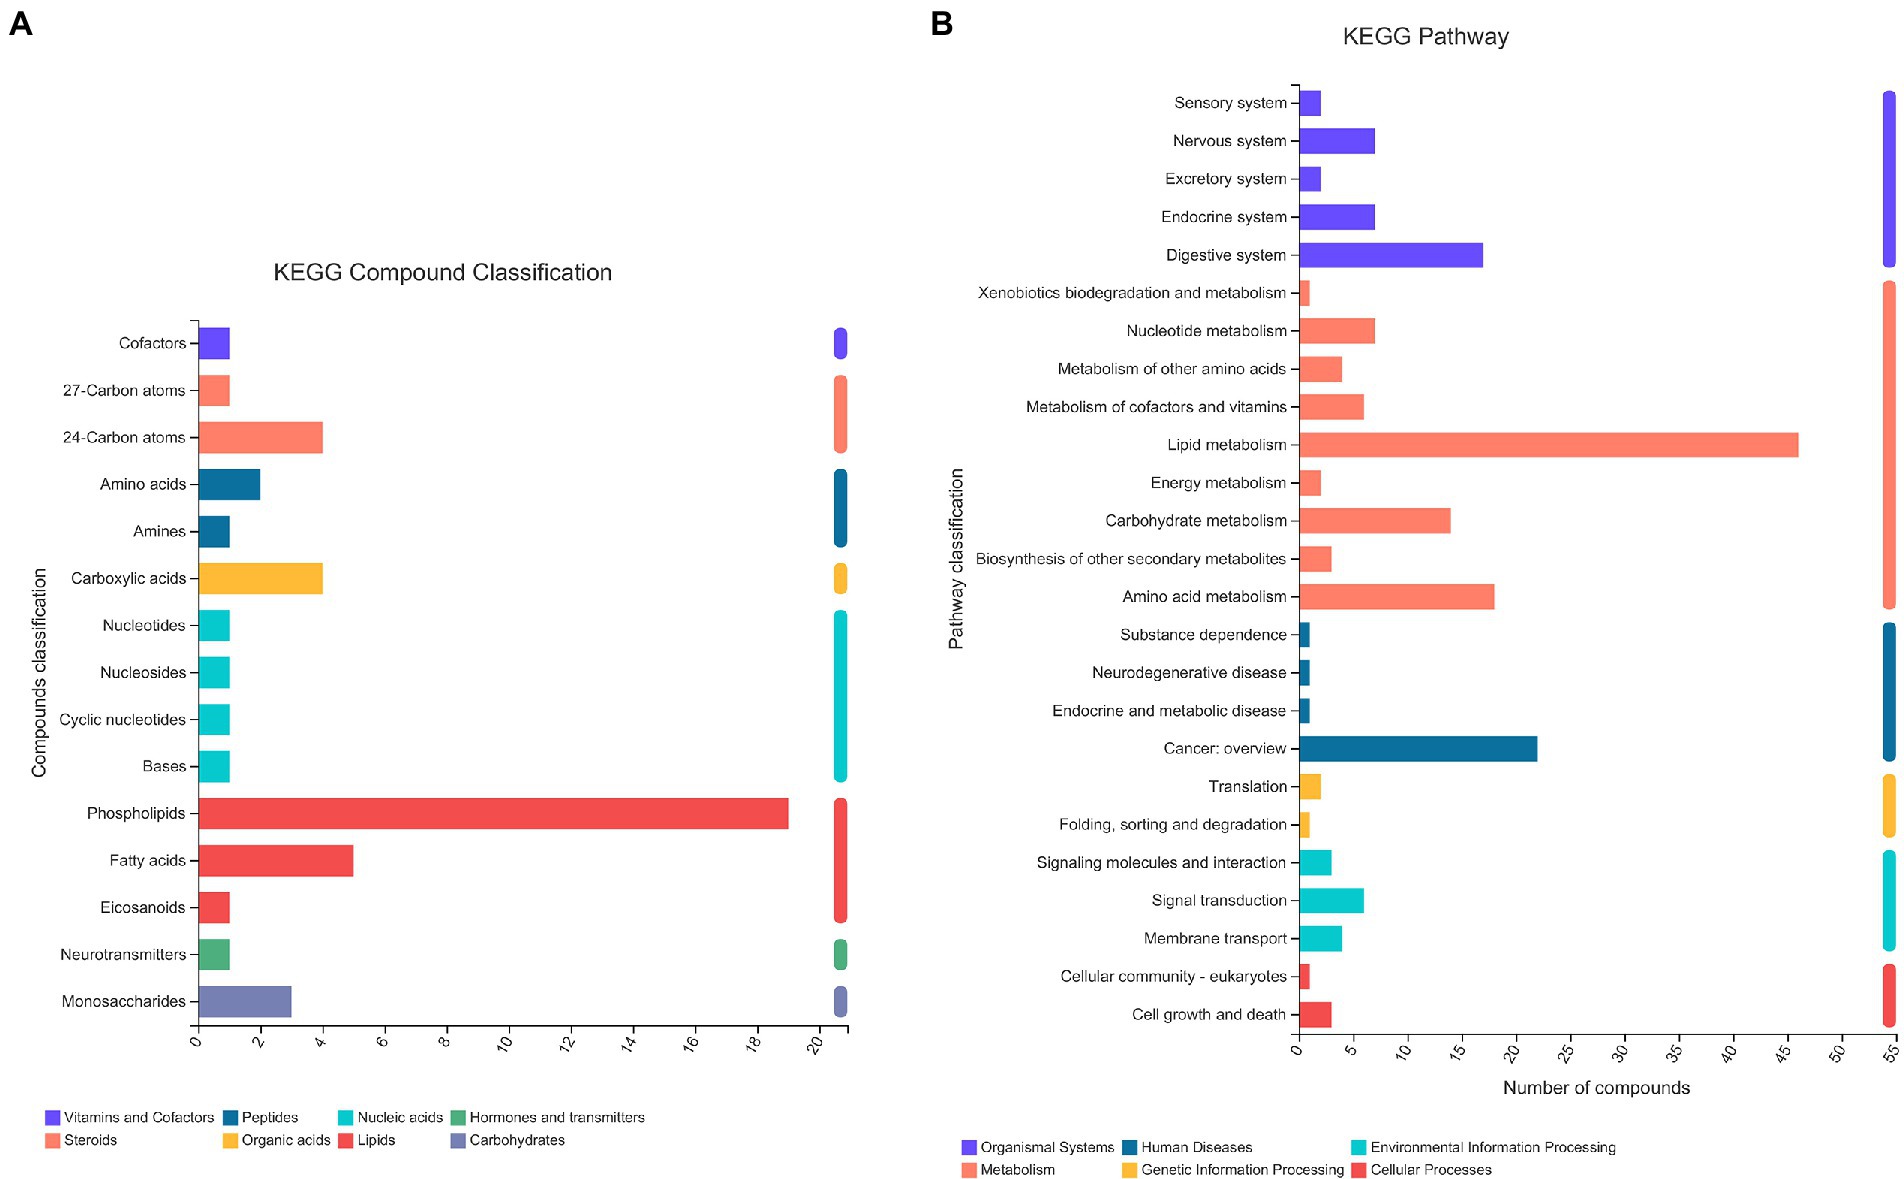
Figure 2. The KEGG classification of metabolites identified in all plasma samples. The classification criteria were: (A) KEGG Compound Classification; (B) KEGG Pathway.
According to the HMDB version 4.0 database, 431 selected metabolites belonged to 9 predominant super-classes (Figure 3A) and 21 subclasses (Figure 3B). The former included lipids and lipid-like molecules (63.03%), organic acids and derivatives (11.61%), organoheterocyclic compounds (7.21%), and organic oxygen compounds (6.98%). The latter includes glycerophosphocholines (10.00%), amino acids, peptides, and analo (9.07%), fatty acids and conjugat (8.14%), bile acids, alcohols and deves (6.98%), and glycerophosphoethanolamines (5%).
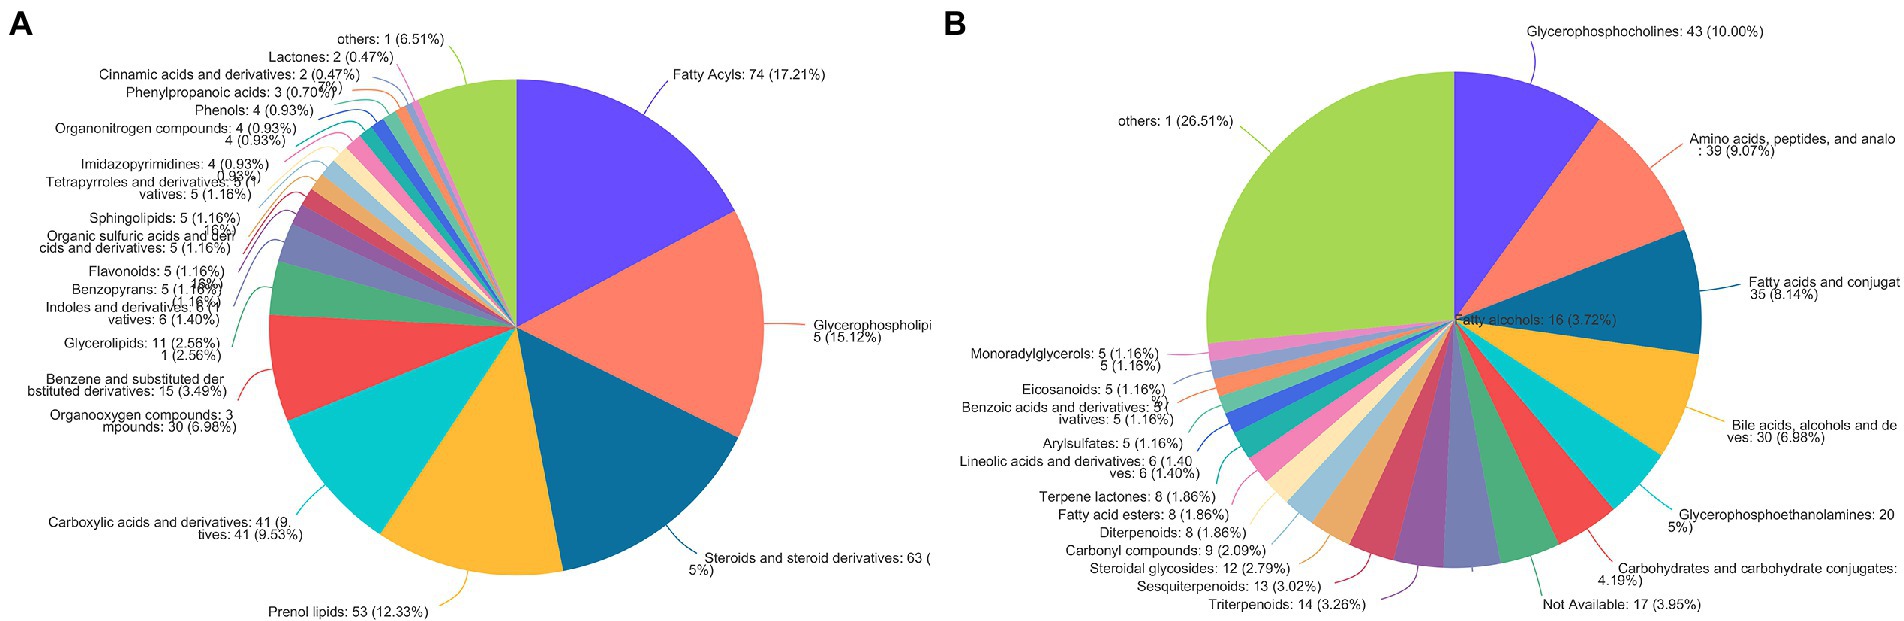
Figure 3. The HMDB classification of metabolites identified in all plasma samples. Pie chart illustrating the abundance ratio of different classes of plasma metabolites detected with untargeted metabolic profiling. The classification level was: (A) Superclass; (B) Subclass.
A total of 172 significant differential metabolites (FDR < 0.05) among the three groups were detected by analysis of variance (ANOVA). To further identify group differences in the metabolic profiles between groups, we performed OPLS-DA score plots; these identified notable separations between both the BA-ADP and HC group and between the NBA-ADP and HC group (Figure 4).
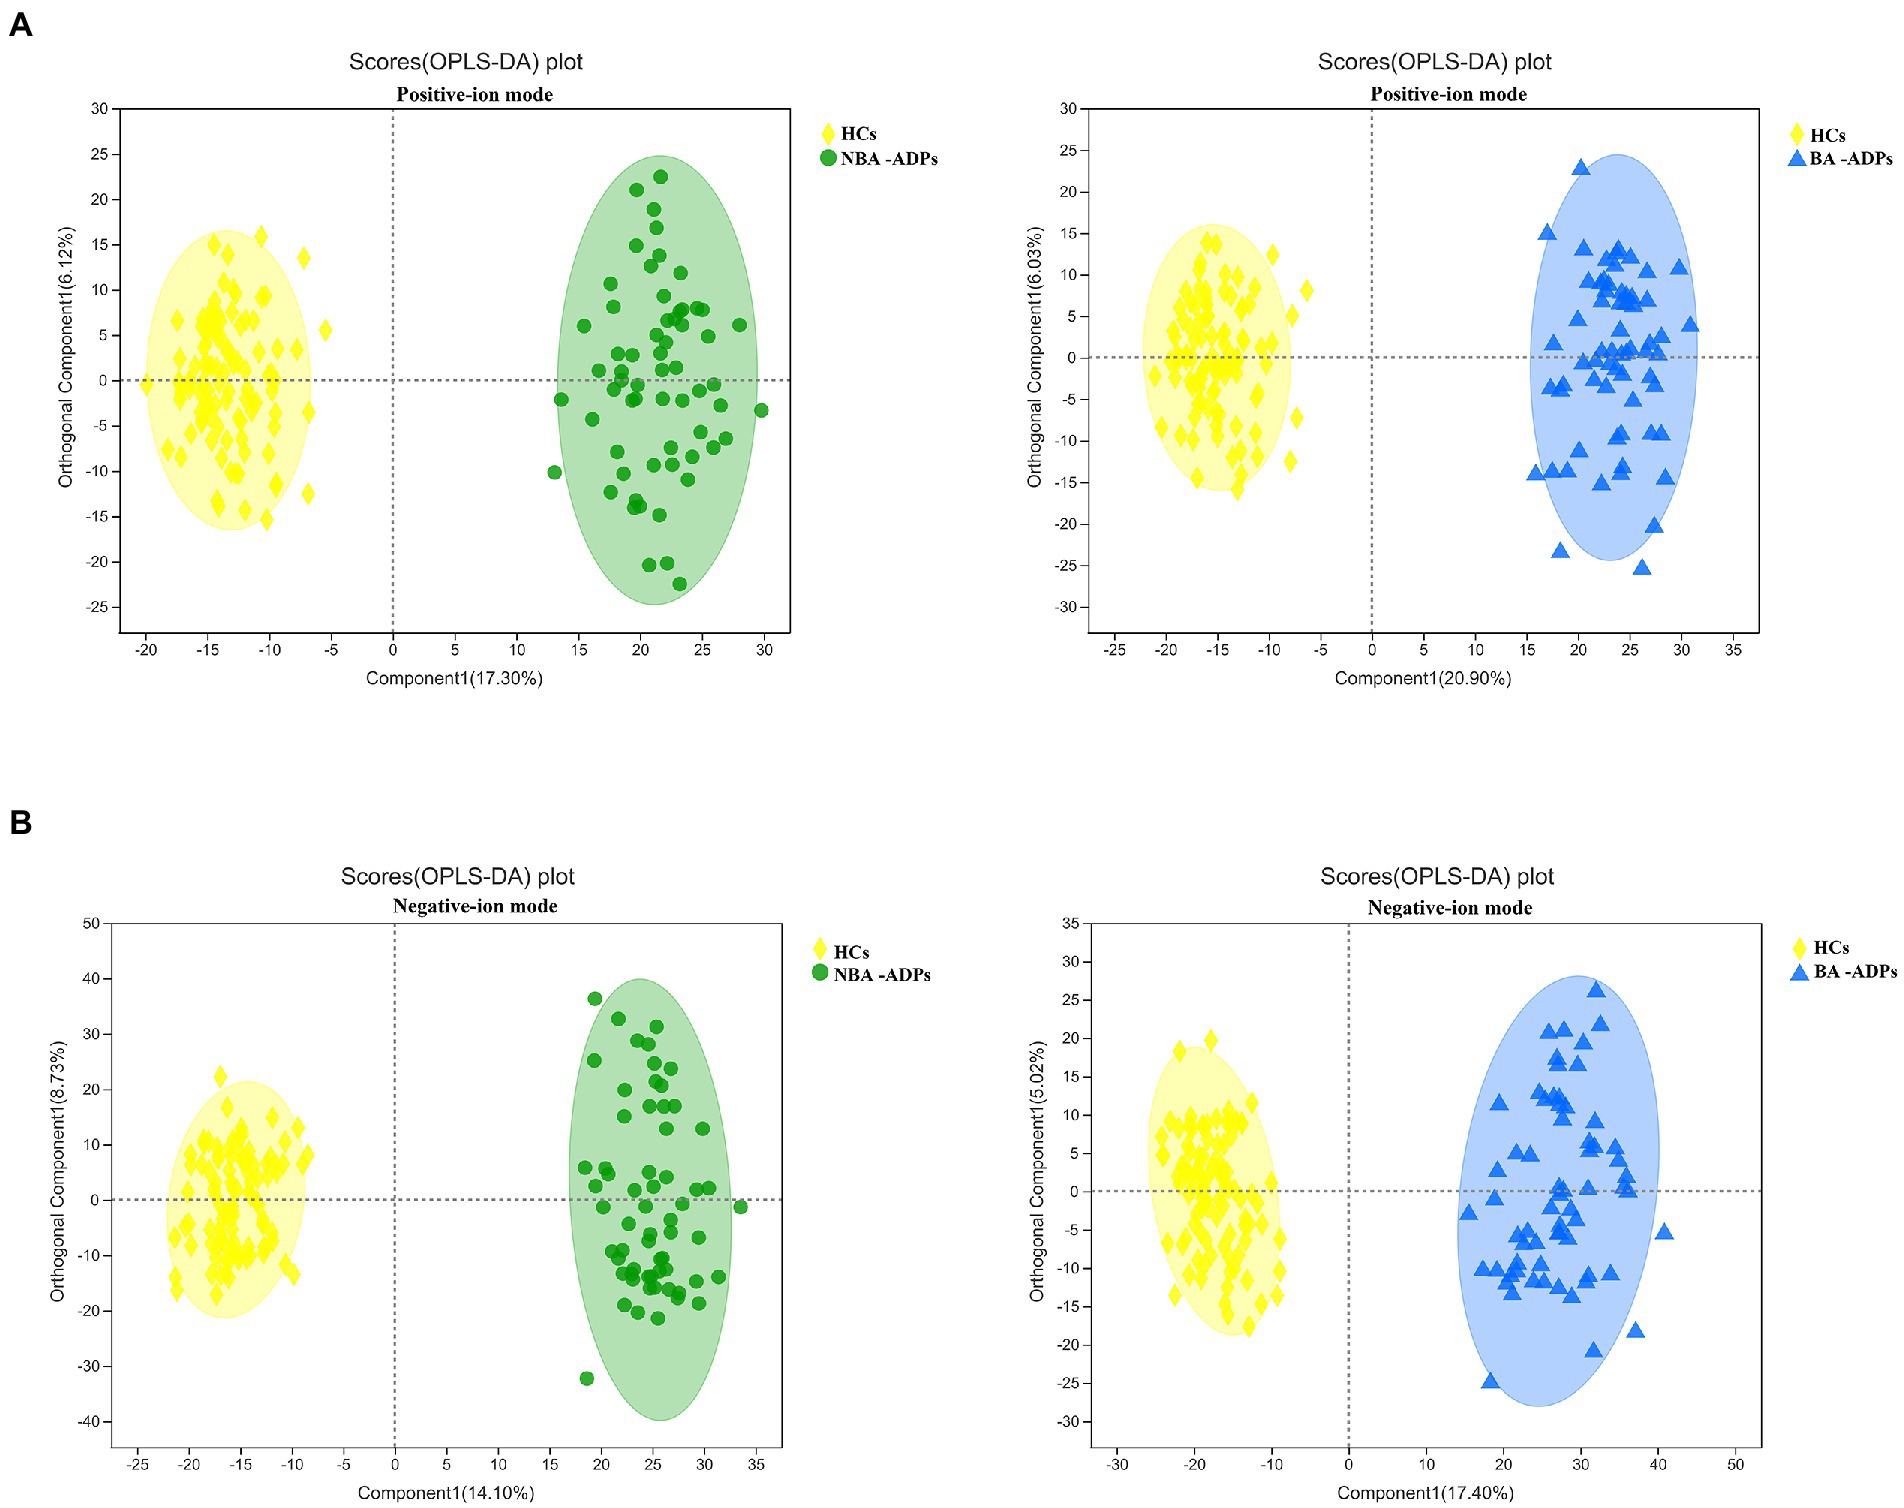
Figure 4. OPLS-DA score plots of alcohol-dependent patients (ADP) versus healthy controls. (A) OPLS-DA score plots of NBA-ADP vs. HC; (B) OPLS-DA score plots of BA-ADP vs. HC.
Differentially expressed metabolites were identified using multivariate and univariate statistical significance criteria (VIP > 1 and FDR < 0.05). In total, 139 metabolites were identified to be significantly different between the NBA-ADP and HC group and 26 metabolites between the BA-ADP and NBA-ADP group (Figure 5; Table 2).
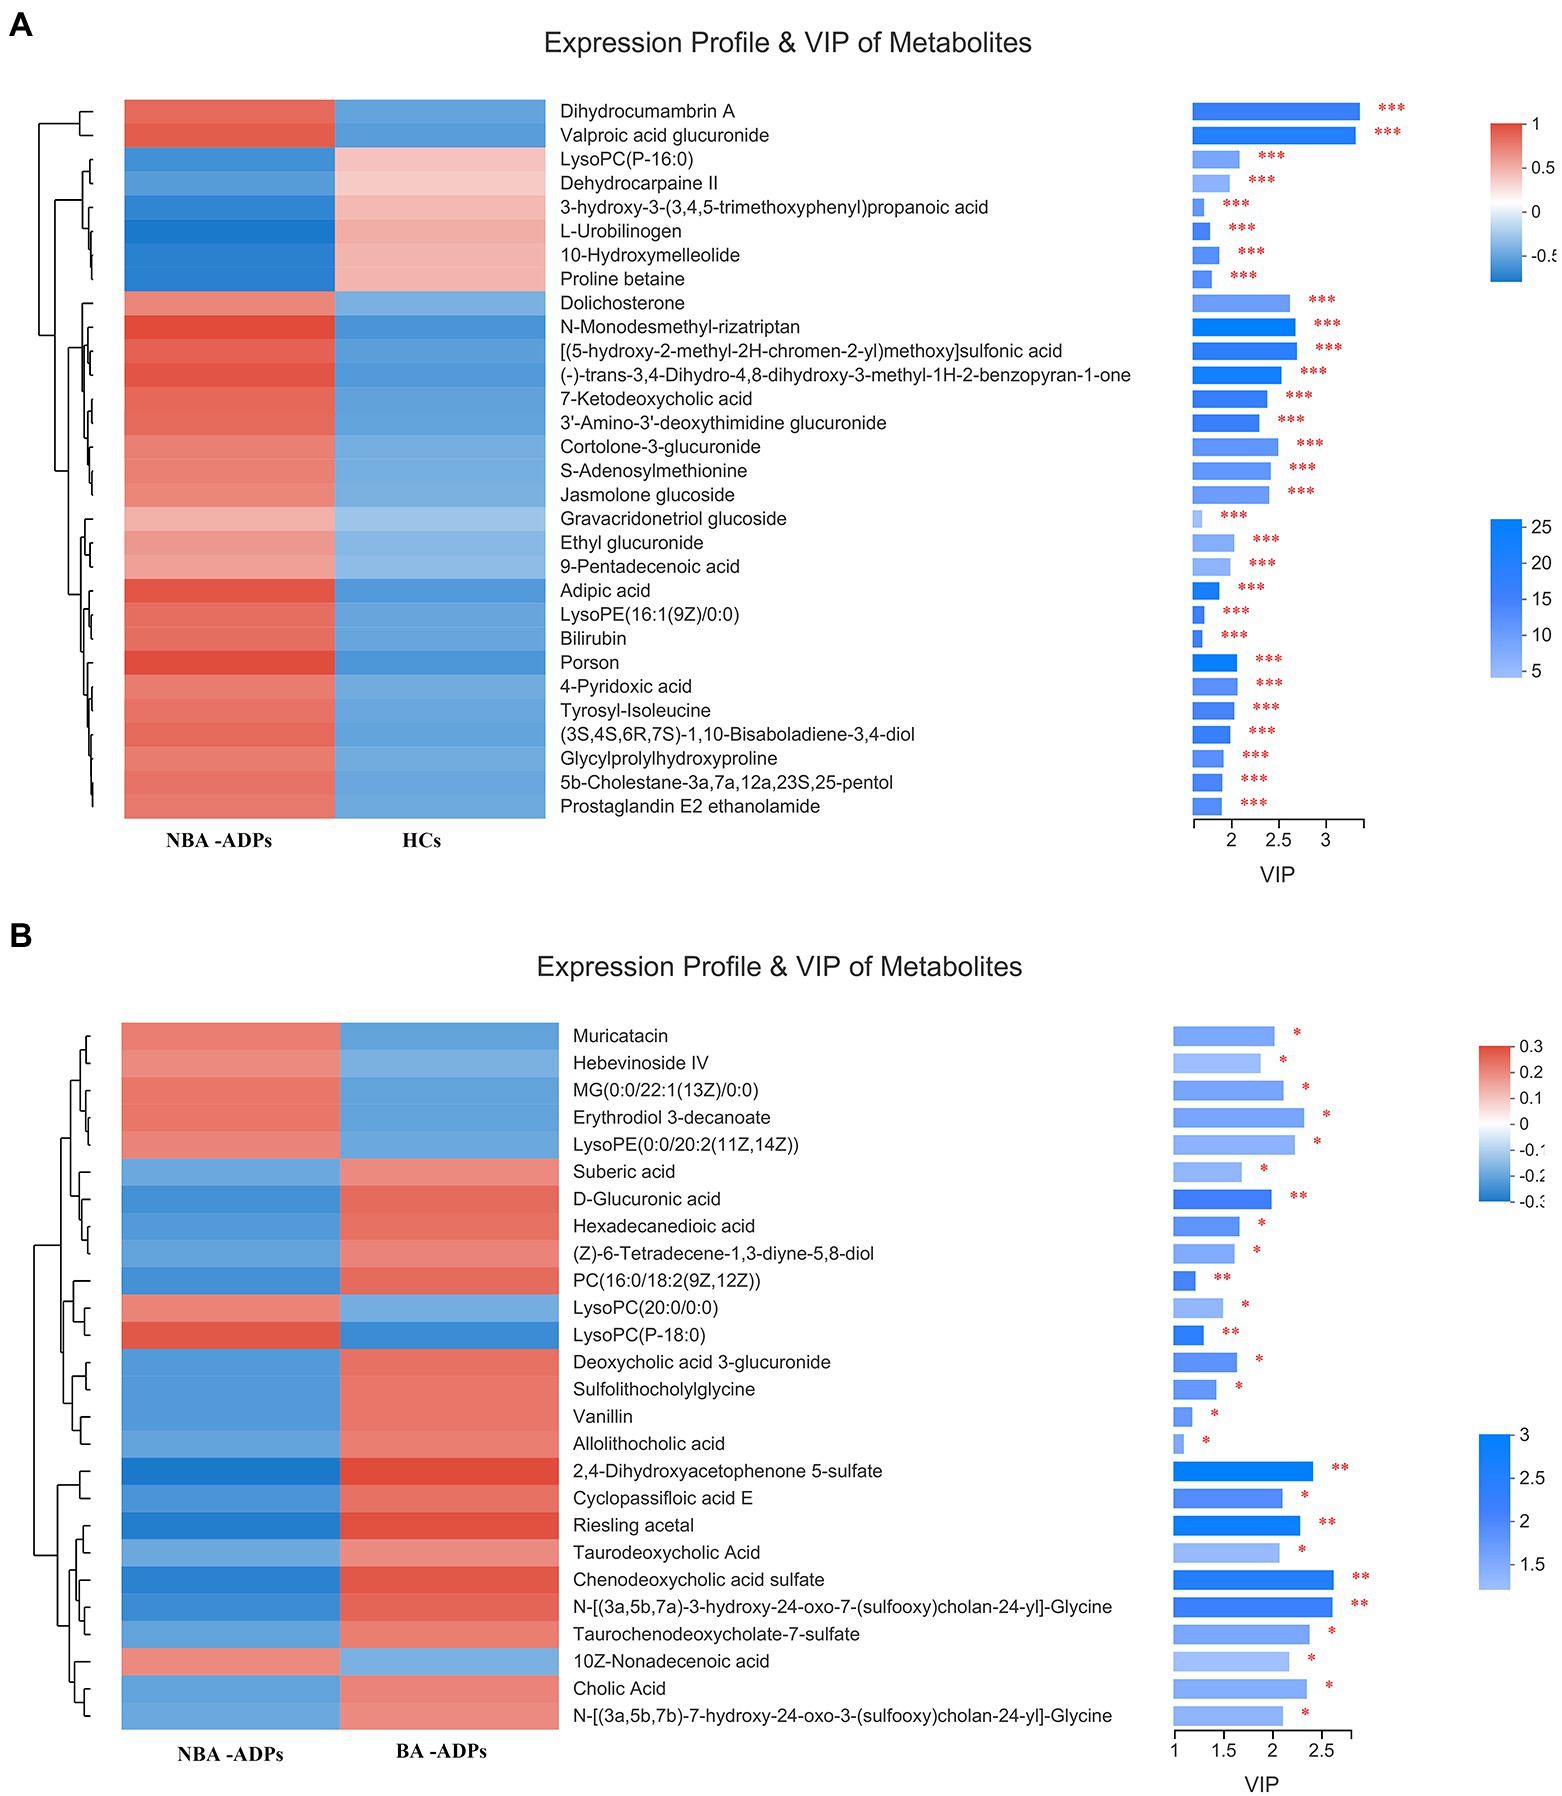
Figure 5. Differential plasma metabolic profiles of alcohol-dependent patients vs. healthy controls. The hierarchical clustering and heat map in the left panel shows the top 30 metabolites that were significantly differentially abundant between NBA-ADP and HC (A), and 26 metabolites that were significantly differentially abundant between BA-ADP and NBA-ADP (B). The histogram in the right panel represents variable importance in projection (VIP) scores derived from the OPLS-DA model for each metabolite. ∗∗∗ indicates P < 0.001.
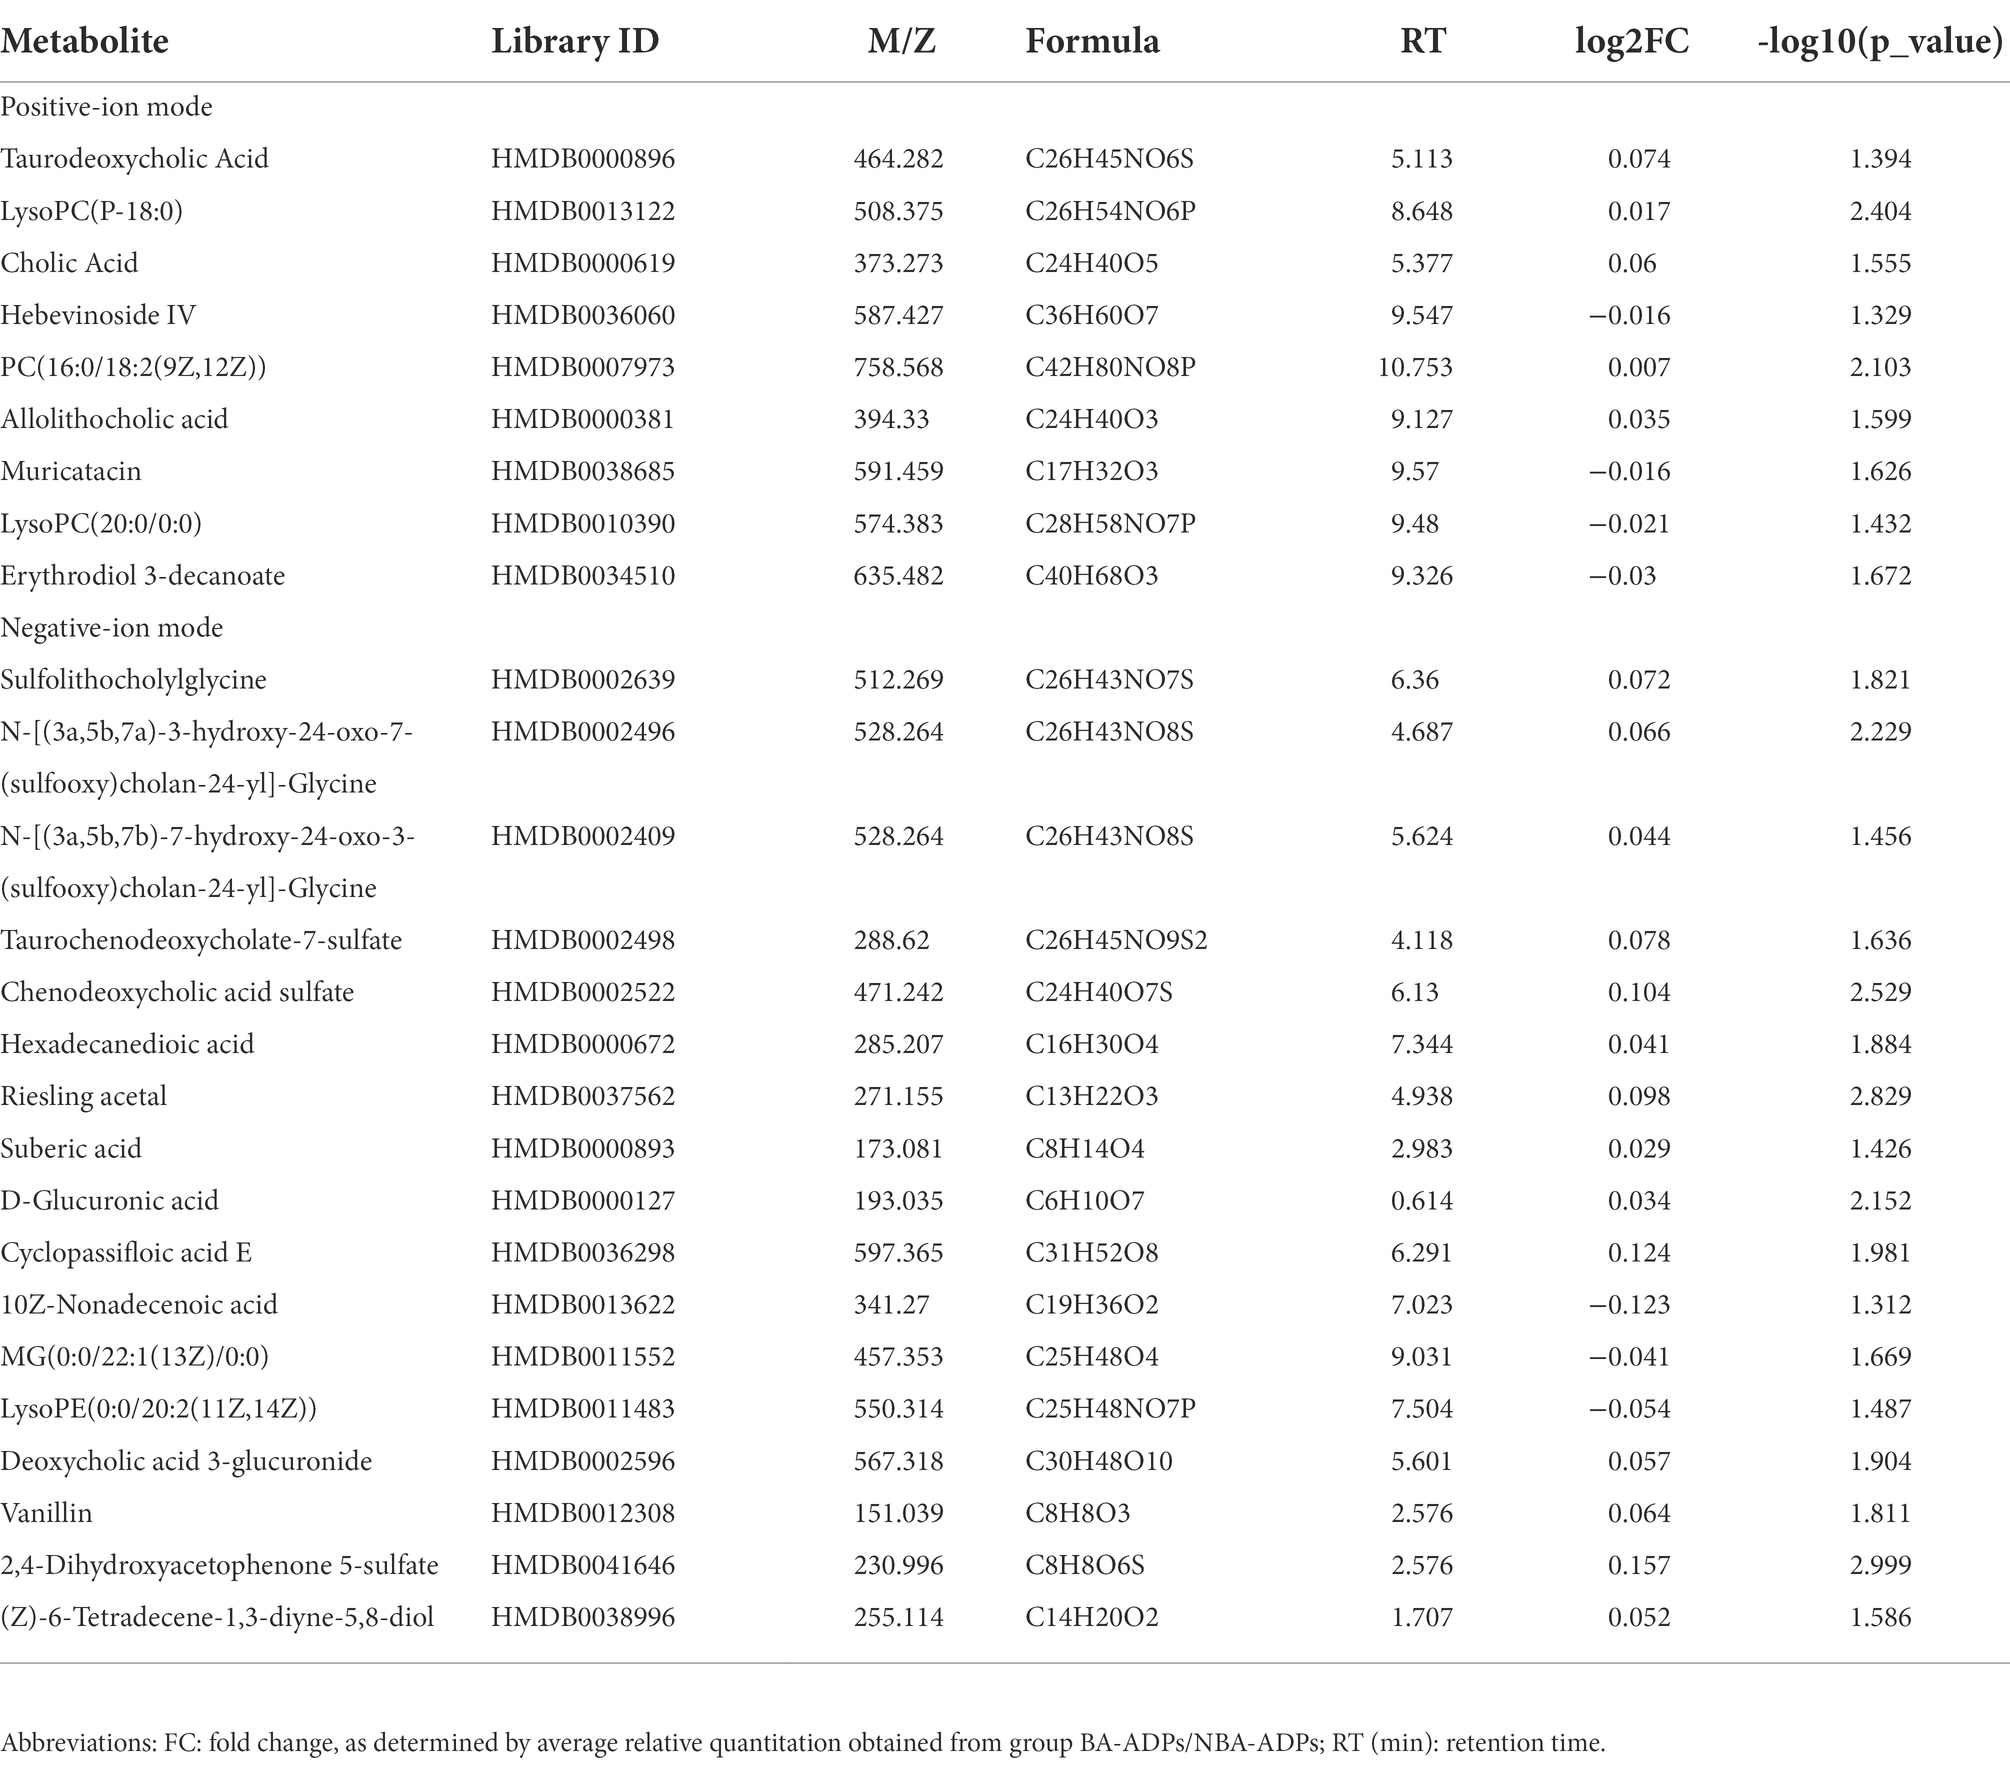
Table 2. Differentially expressed endogenous metabolites detected by UHPLC-QTOF/MS.
To gain a further understanding of the metabolic disturbances between the NBA-ADP and HC group and between the BA-ADP and NBA-ADP group, we performed KEGG pathway enrichment analysis; we also used MetaboAnalyst version 5.0 to perform a functional analysis of plasma metabolites.
As shown in Figure 6A, primary bile acid biosynthesis (map00120), taurine and hypotaurine metabolism (map00430) were the most important metabolic pathways that showed alterations in the alcohol-dependent patients (both the NBA-ADP group and the BA-ADP group) when compared with the HC group. In contrast, pentose and glucuronate interconversions (map00040) and glycerophospholipid metabolism (map00564) were detected in the BA-ADP group when compared with the NBA-ADP group (Figure 6B).
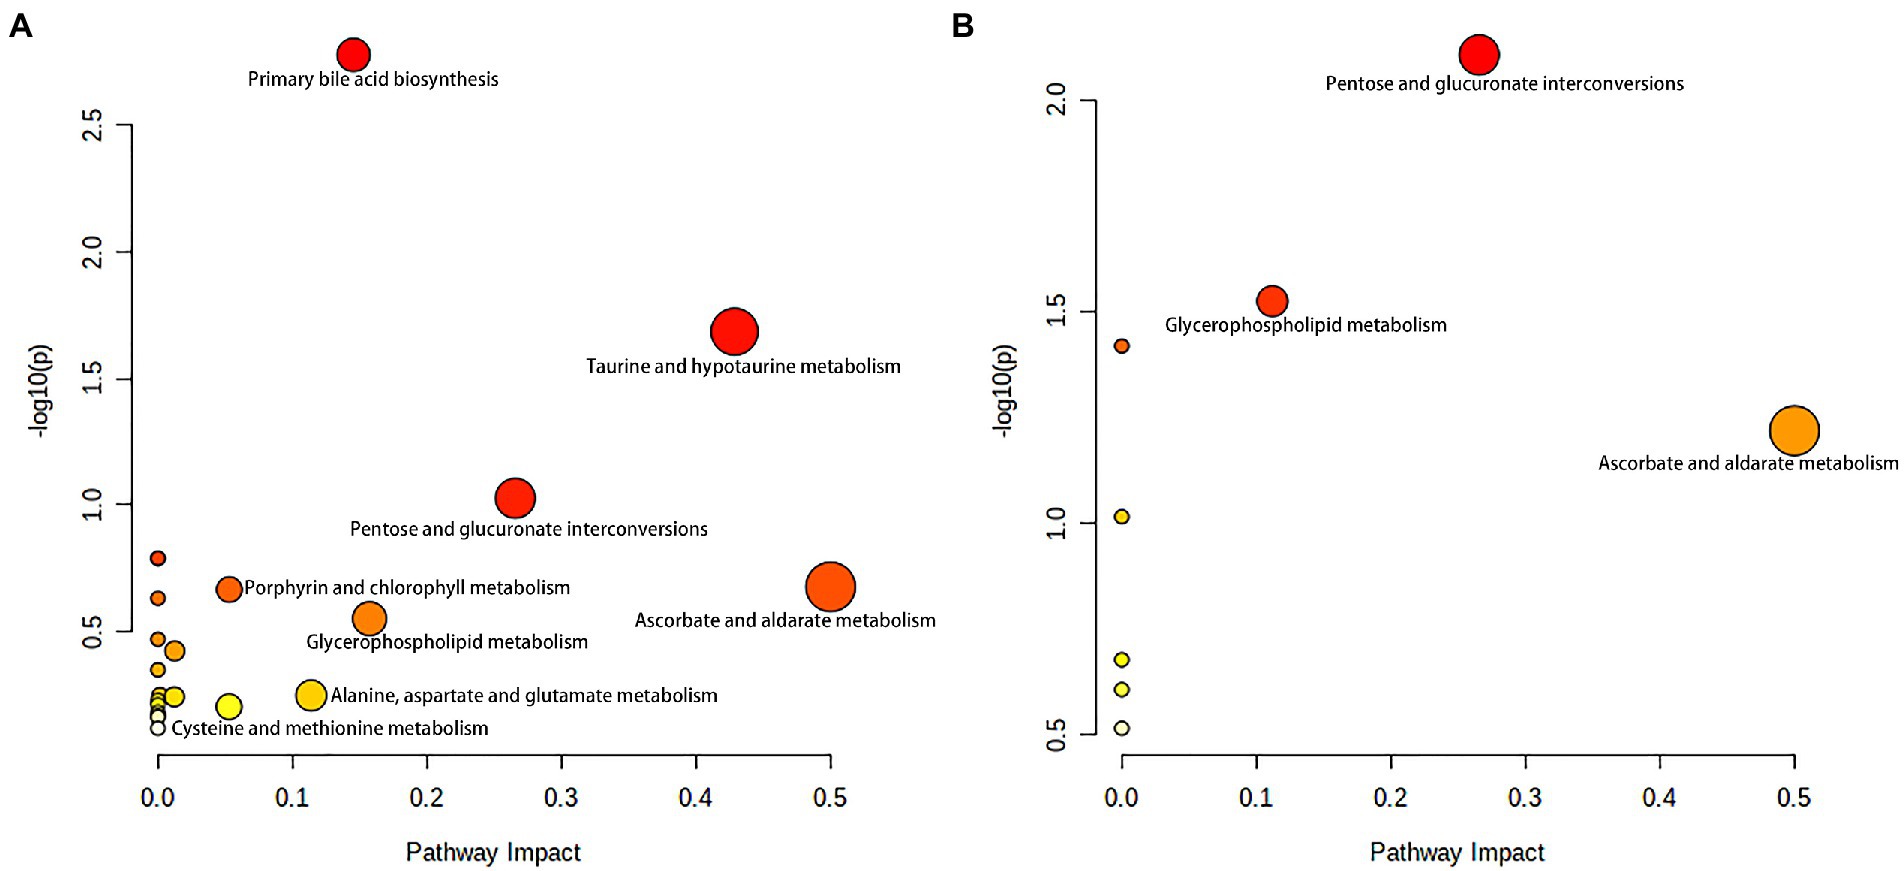
Figure 6. Metabolite pathway changes identified using MetaboAnalyst 5.0. Pathway analysis of the differential plasma metabolites between NBA-ADP vs. HC (A), and BA-ADP vs. NBA-ADP (B). The y axis shows the p-values and the x axis, representing pathway impact values; node color is based on its p-value and node size reflects the pathway impact values.
The five most important metabolites selected by AdBooST were Sulfolithocholylglycine PC (16:0/18:2(9Z,12Z)), Allolithocholic acid, MG(0:0/22:1(13Z)/0:0), and Cyclopassifloic acid E (Figure 7A). The five most important metabolites selected by Random forest were PC (16:0/18:2(9Z,12Z)), N-[(3a,5b,7a)-3-hydroxy-24-oxo-7-(sulfooxy)cholan-24-yl]-Glycine, Cyclopassifloic acid E, 2,4-Dihydroxyacetophenone 5-sulfate, and Allolithocholic acid (Figure 7B). The five most important metabolites selected by Naive Bayes were Deoxycholic acid 3-glucuronide, Sulfolithocholylglycine, Cholic Acid, N-[(3a,5b,7a)-3-hydroxy-24-oxo-7-(sulfooxy)cholan-24-yl]-Glycine, and 2,4-Dihydroxyacetophenone 5-sulfate (Figure 7C). Nine metabolites (Cholic Acid, PC (16:0/18:2(9Z,12Z)), allolithocholic acid, sulfolithocholylglycine, N-[(3a,5b,7a)-3-hydroxy-24-oxo-7-(sulfooxy)cholan-24-yl]-Glycine, cyclopassifloic acid E, MG(0:0/22:1(13Z)/0:0), deoxycholic acid 3-glucuronide, 2,4-Dihydroxyacetophenone 5-sulfate) were identified as potential metabolic biomarkers for alcohol-dependent patients with brain atrophy. As shown in Figure 7D, the AUC of the ROC curve reached was 0.7719 for distinguishing between BA-ADP and NBA-ADP patients.
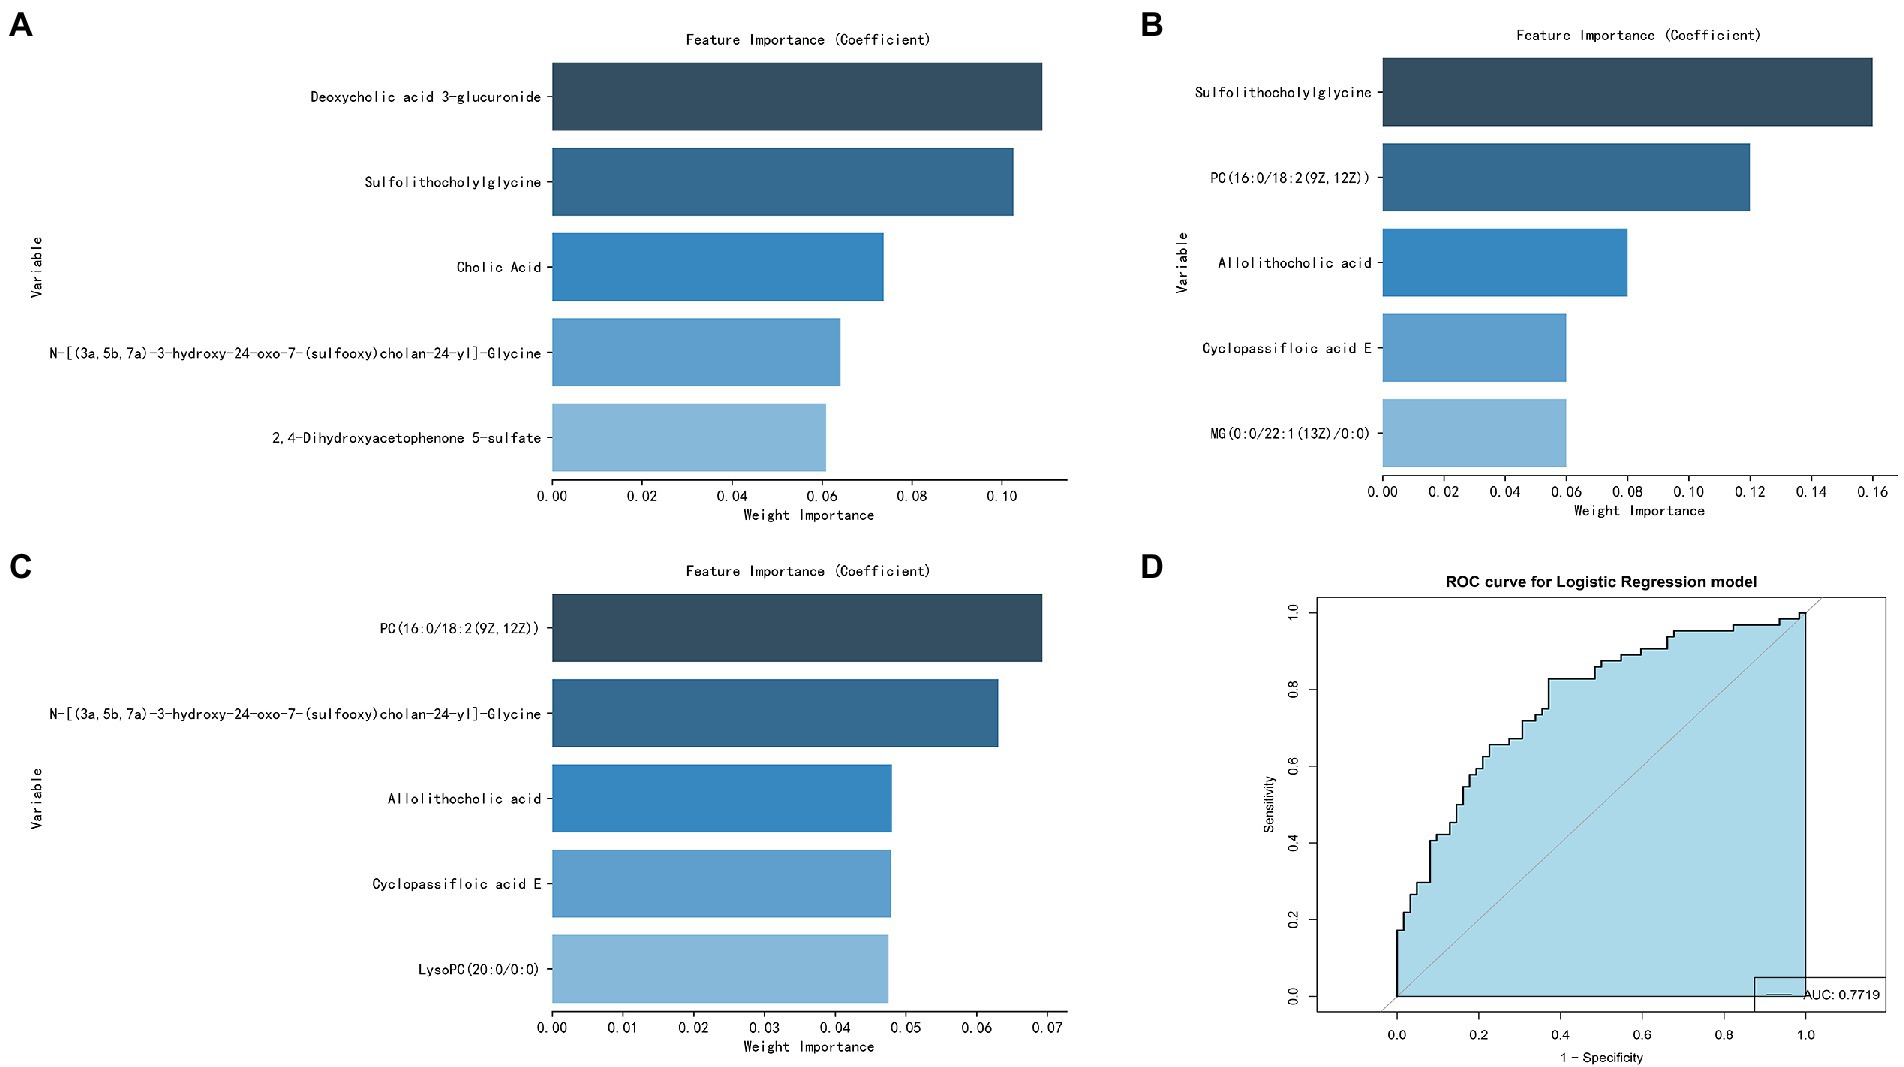
Figure 7. Screening of potential plasma metabolite biomarkers of alcohol-dependent patients with brain atrophy. The nine most important metabolites selected by Naive Bayes (A), AdaBoost (B), and Random Forest (C). The AUC value of the ROC curve of potential plasma metabolite biomarkers for distinguishing BA-ADP patients from NBA-ADP (D).
It is well-known that alcohol can causes serious health problems, long-term abuse, and irreversible alterations in the structure and function of the brain (Rehm et al., 2017; Kranzler and Soyka, 2018). However, to the best of our knowledge, this is the first study that sought to identify potential plasma biomarkers of alcohol-dependent patients who have brain atrophy by applying non-targeted metabolomics and machine learning.
In this study, a total of 26 metabolites were found to show significant changes between the BA-ADP and NBA-ADP group. Each of the identified metabolites were searched against synonyms in HMDB. These metabolites covered a range of chemical classes; lipids and lipid-like molecules were ranked highest and featured 22 of the metabolites. The obtained metabolites were classified based on the KEGG compound annotation database.3 Phospholipids and phospholipid metabolism were ranked first in the secondary classification category of KEGG compounds. As the main substance of the brain, lipids not only act as the building blocks of all membrane structures but also act as the repository for chemical energy and play a significant role in cellular signaling pathways (Holthuis and Menon, 2014; Van Deijk et al., 2017). Characteristic alterations in lipid—including structure, composition, or distribution—are thought account for alterations in neuronal function, synaptic signaling, and neurotransmitter transmission. A previous lipidomics study investigating the links between chronic alcohol infusion and whole brain lipid profile, demonstrated that specific lipid categories, mainly PS, PC and PE, appeared to be related to neuro-pathology (Wang et al., 2019). To further identify the potential metabolic biomarkers of BA-ADP, machine learning was used and nine metabolites ((Cholic Acid, PC (16:0/18:2(9Z,12Z)), Allolithocholic acid, Sulfolithocholylglycine, N-[(3a,5b,7a)-3-hydroxy-24-oxo-7-(sulfooxy) cholan-24-yl]-Glycine, Cyclopassifloic acid E, MG(0:0/22:1(13Z)/0:0), Deoxycholic acid 3-glucuronide, 2,4-Dihydroxyacetophenone 5-sulfate) were identified. The AUC of these metabolite biomarkers was 0.7719, thus indicating an acceptable correlation using metabolite biomarkers and an outstanding correlation using protein biomarkers.
Of the nine differential metabolites identified in this study, there were several different species of bile acids, including cholic acid, allolithocholic acid, and deoxycholic acid 3-glucuronide. Bile acids readily cross the blood–brain barrier and their receptors are expressed in central tissues, suggesting that they may have important functional roles (Romanazzi et al., 2021). The bile acid signaling pathway plays an extremely important role in diseases and is a target for drug intervention. Drugs related to bile acids include chenodeoxycholic acid and its derivatives, ursodeoxycholic acid and its derivatives, bile acid sequestrants (such as cholestyramine), and apical sodium-dependent bile acid transporter (ASBT) inhibitors. In the nervous system, ASBT-mediated bile acid reabsorption significantly increases the level of bile acid in the serum and brain tissue, reduces the acidity of the intestinal cavity, increases the pH of the intestine, and promotes the conversion of intestinal ammonium into ammonia, thus resulting in abnormally increased levels of neurotoxic ammonia and cytotoxic bile acid in the blood and brain. Previous studies have confirmed that changes in bile acid occur in patients who progress from cognitive impairment to Alzheimer’s disease, and the relationship between this change and cognitive decline is well documented. In addition, our study identified two metabolites related to bile acids. The expression of these two-acyl glycine and bile acid-glycine conjugates varied significantly between the BA-ADP and NBA-ADP group. Therefore, we assumed that bile acids may strongly associated with alcohol-related brain atrophy. And additional targeted absolute quantitative analyze of the bile acid spectrum in future studies may be helpful.
Interestingly, another class of potential metabolic biomarkers here we identified are lipid metabolites. It is widely documented that the homeostasis of lipid metabolism plays a significant role in the central nervous system. Many lipidomic-based studies have reported the relationship between the dysregulation of specific lipids and pathological conditions, including diabetes, Alzheimer’s disease, hypertension, and cancer. It has been reported that long-term alcohol exposure significantly modifies the serum lipid profile, especially the metabolic pathways involving glycerophospholipid, sphingolipid and glycerolipids. Alcohol exposure can dramatically influence the lipidome of both the prefrontal cortex and striatum, thus leading to alcohol-related neurotoxicity and neuroplasticity. In the present study, by applying metabolomics analysis, we found that some glycerophospholipid (GP) metabolites, such as PC(P-16:0/18:2(9Z,12Z)), were significantly altered in alcohol-dependent patients with brain atrophy. GPs are the main components of the membrane structure. Different cell types, organelles, and inner/outer membranes in mammalian mitochondria, are known to have distinct glycerophospholipid compositions; these differences relate to the specific biological functions of these structures (Klaming et al., 2019). As GPs provide neural membranes with stability, fluidity and permeability, they are necessary for the normal biological function of integral membrane proteins, receptors, and ion-channels. Our present results suggest that chronic alcohol exposure may lead to brain atrophy and affect brain functionality by altering the composition of GPs. Alterations of the GP composition in neural membranes could therefore be related to neurological disorders. In addition, we found that some glycerolipids, such as MG(0:0/22:1(13Z)/0:0), were significantly altered in alcohol-dependent patients with brain atrophy. Further research now needs to investigate the key metabolic enzymes that mediate alcohol-induced dysfunction of lipidome profiling in the brain.
Based on the identified metabolites, we further identified two significantly altered metabolic pathways (primary bile acid biosynthesis, and taurine and hypotaurine metabolism) that were most closely related to alcohol dependence irrespective of whether brain atrophy was involved or not. As endogenous signaling molecules, bile acids are synthesized in the liver and secreted into the gastrointestinal tract for postprandial nutrient absorption and to control the overgrowth of microbial growth. In addition, gut microbes metabolize bile acids and in doing so, determine the composition of the circulating bile acids, thus regulating host metabolism (Chiang and Ferrell, 2019). Patients with acute alcohol intake exhibit increased serum levels of bile acids and cholestatic liver injury; alcohol intake also increases bile acid pool size and reduces bile acid flow and fecal excretion (Donepudi et al., 2018). Wang et al. found that the abundance of firmicutes and clostridium was notably increased in alcohol-addicted mice, and the levels of secondary bile acids produced by firmicutes had increased (Wang et al., 2018). In conclusion, compared with healthy individuals, there are certain changes in the expression levels of bile acid metabolites (including tauroursodeoxycholic acid, cholic acid and allocholic acid) in alcohol-addicted patients. The analysis showed that regulation of bile acid biosynthesis is likely to contribute to the occurrence and development of alcohol-related diseases.
As for taurine and hypotaurine metabolism, taurine has already been shown to protect mice with alcoholic liver injury by reducing hepatic oxidative stress and interrupting the alcohol-induced renal inflammatory cycle (Tang et al., 2019). It is well known that taurine can also prevent and repair liver damage and balance liver lipid metabolism indicators in a mouse model of alcoholic liver disease. The mechanism involved in this protection may be related to the regulation of related enzymes and transcriptional regulators involved in lipid metabolism (Latchoumycandane et al., 2014). In another study, Xia et al. suggested that the metabolic pathways of ascorbic acid, taurine, and hypotaurine, may play an active role in the protection against Antrodin A secreted by Antrodia camphorata and thus protect against alcoholic liver injury (Yi et al., 2021). Our present study also found that the BA-ADP group showed an elevation in taurine, compared with the NBA-ADP group. Thus, those imply that the metabolic pathways of taurine and hypotaurine may be also associated with alcohol-related brain atrophy.
To further identify the potential pathways that may be associated with alcohol-related brain atrophy, the KEGG pathway analysis using difference metabolites between BA-ADP and NBA-ADP was performed. We found that glycerophospholipid metabolism, along with pentose and glucuronate interconversions, were significantly associated with alcohol-related brain atrophy. This finding is in line with previous studies that demonstrated the impact of glycerophospholipid metabolism on neurodegenerative changes (Frisardi et al., 2011). Previous studies have shown that the degradation products of glycerophospholipids have pro-inflammatory effects and that their production is often accompanied by the activation of astrocytes and microglia and the release of inflammatory cytokines; these changes lead to oxidative stress and neuroinflammation (Bonelli et al., 2020). Changes in glycerophospholipid metabolism have also been shown to lead to changes in cell membrane permeability and ion homeostasis, thus leading to oxidative stress and neurodegenerative changes (Fuller and Futerman, 2018). Increased small vascular disease load was linked to changes in glycerophospholipid metabolism, as seen by increased white matter hyperintensity volume, decreased mean diffusivity normalized peak height, increased brain atrophy, and decreased cognition (Harshfield et al., 2022). Previous report has found that pentose and glucuronate interconversions is associated with the cognitive impairment in Alzheimer disease (He et al., 2020). In the present study, we report, for the first time, that pentose and glucuronate interconversions are also associated with alcohol-related brain atrophy. However, the precise role of these two regulatory metabolic pathways in the pathophysiological mechanism of alcohol dependence-related brain atrophy requires further investigation.
This study has several limitations that need to be considered. First, the metabolomic analysis performed in the present study did not provide absolute quantification. If this model is to be applied clinically, more rigorous quantification and extensive validation of metabolites would be needed. Targeted metabolomics could be used to validate these specific plasma metabolomic biomarkers. Second, the sample size of this study was rather small, particularly in proteomic analysis; thus, additional patients are required for future analysis. Third, only XGBoost, RF, and AdaBoost Classifier were used to screen for potential biomarkers. Other machine learning methods, such as Support Vector Machine and Boruta could be used in future analyses. Fourth, due to the complex genetic and microenvironmental backgrounds of our patients, other biofluids, such as urine, serum, and cerebrospinal fluid, could also be used to identify additional novel biomarkers. This will provide a more to comprehensive understanding of the pathogenesis of brain atrophy in alcohol-dependent patients. Last, we failed to reveal any differences in cognitive tests between control patients and those identified as having brain atrophy in this study, more detailed cognitive tests may be help in future research.
This was the first attempt to conduct a metabolomic analysis of plasma samples from healthy control groups and alcohol-dependent patients. Our data showed that patients with alcohol-dependent brain atrophy had distinct metabolic profiles compared with healthy controls and alcohol-dependent patients who do not have brain atrophy. Furthermore, bioinformatic analysis suggested that alterations in the metabolome may be involved in disease pathogenesis. Although further research is needed, our results offer useful diagnostic and therapeutic clues for the management of alcohol-dependent patients with brain atrophy.
The original contributions presented in the study are included in the article/Results, and further inquiries can be directed to the corresponding author.
The studies involving human participants were reviewed and approved by The Ethics Committee of the Hunan Brain Hospital (Reference: 2016121). The patients/participants provided their written informed consent to participate in this study.
SZ and XHZ designed the study. XC, CH, ZL, XW, XL, QL, XZ, YG, HX, and TX managed the data collection. SZ, JH, ZZ, and XHZ undertook the statistical analysis. ZZ wrote the first draft of the manuscript. All authors contributed to the article and approved the submitted version.
This work was financially supported by the National Key Research and Development Program of China (No. 2018YFC1314401), Hunan Provincial Natural Science Foundation of China (Nos. 2018JJ3284, 2020JJ4803, 2022JJ2540, 2022JJ2615, 2021JJ70013, 2021JJ70089, and 2022JJ40728), The Scientific Research Project of the Hunan Health Commission (Nos. A202303096949, 20200620, and 202103092373), Special Project on Science and Technology Development and First-class Discipline Construction of Clinical Medicine Discipline of Hunan University of Chinese Medicine in the 13th Five-Year Plan Period (2091007), and Key Clinical Specialty Construction Project of the Hunan Health Commission (Improvement of Diagnosis and Treatment Ability of Severe Psychiatric Diseases in Hunan Province).
The authors declare that the research was conducted in the absence of any commercial or financial relationships that could be construed as a potential conflict of interest.
All claims expressed in this article are solely those of the authors and do not necessarily represent those of their affiliated organizations, or those of the publisher, the editors and the reviewers. Any product that may be evaluated in this article, or claim that may be made by its manufacturer, is not guaranteed or endorsed by the publisher.
Angebrandt, A., Abulseoud, O. A., Kisner, M., Diazgranados, N., Momenan, R., Yang, Y., et al. (2022). Dose-dependent relationship between social drinking and brain aging. Neurobiol. Aging 111, 71–81. doi: 10.1016/j.neurobiolaging.2021.11.008
Battle, D. E. (2013). Diagnostic and statistical manual of mental disorders (DSM). Codas 25, 191–192. doi: 10.1590/s2317-17822013000200017
Bonelli, R., Woods, S. M., Ansell, B. R. E., Heeren, T. F. C., Egan, C. A., Khan, K. N., et al. (2020). Systemic lipid dysregulation is a risk factor for macular neurodegenerative disease. Sci. Rep. 10:12165. doi: 10.1038/s41598-020-69164-y
Chiang, J. Y. L., and Ferrell, J. M. (2019). Bile acids as metabolic regulators and nutrient sensors. Annu. Rev. Nutr. 39, 175–200. doi: 10.1146/annurev-nutr-082018-124344
Daviet, R., Aydogan, G., Jagannathan, K., Spilka, N., Koellinger, P. D., Kranzler, H. R., et al. (2022). Associations between alcohol consumption and gray and white matter volumes in the UK Biobank. Nat. Commun. 13:1175. doi: 10.1038/s41467-022-28735-5
de la Monte, S. M., and Kril, J. J. (2014). Human alcohol-related neuropathology. Acta Neuropathol. 127, 71–90. doi: 10.1007/s00401-013-1233-3
Deo, R. C. (2015). Machine learning in medicine. Circulation 132, 1920–1930. doi: 10.1161/CIRCULATIONAHA.115.001593
Donepudi, A. C., Ferrell, J. M., Boehme, S., Choi, H. S., and Chiang, J. Y. L. (2018). Deficiency of cholesterol 7α-hydroxylase in bile acid synthesis exacerbates alcohol-induced liver injury in mice. Hepatol. Commun. 2, 99–112. doi: 10.1002/hep4.1129
Frisardi, V., Panza, F., Seripa, D., Farooqui, T., and Farooqui, A. A. (2011). Glycerophospholipids and glycerophospholipid-derived lipid mediators: a complex meshwork in Alzheimer's disease pathology. Prog. Lipid Res. 50, 313–330. doi: 10.1016/j.plipres.2011.06.001
Fuller, M., and Futerman, A. H. (2018). The brain lipidome in neurodegenerative lysosomal storage disorders. Biochem. Biophys. Res. Commun. 504, 623–628. doi: 10.1016/j.bbrc.2018.03.042
Godin, J., Armstrong, J. J., Wallace, L., Rockwood, K., and Andrew, M. K. (2019). The impact of frailty and cognitive impairment on quality of life: employment and social context matter. Int. Psychogeriatr. 31, 789–797. doi: 10.1017/S1041610218001710
Harshfield, E. L., Sands, C. J., Tuladhar, A. M., de Leeuw, F. E., Lewis, M. R., and Markus, H. S. (2022). Metabolomic profiling in small vessel disease identifies multiple associations with disease severity. Brain 145, 2461–2471. doi: 10.1093/brain/awac041
He, R., Liu, J., Huang, C., Liu, J., Cui, H., and Zhao, B. (2020). A urinary metabolomics analysis based on UPLC-MS and effects of Moxibustion in APP/PS1 mice. Curr. Alzheimer Res. 17, 753–765. doi: 10.2174/1567205017666201109091759
Holthuis, J., and Menon, A. K. (2014). Lipid landscapes and pipelines in membrane homeostasis. Nature 510, 48–57. doi: 10.1038/nature13474
Klaming, R., Spadoni, A. D., Veltman, D. J., and Simmons, A. N. (2019). Expansion of hippocampal and amygdala shape in posttraumatic stress and early life stress. NeuroImage Clin. 24:101982. doi: 10.1016/j.nicl.2019.101982
Kranzler, H. R., and Soyka, M. (2018). Diagnosis and pharmacotherapy of alcohol use disorder: a review. JAMA 320, 815–824. doi: 10.1001/jama.2018.11406
Latchoumycandane, C., Nagy, L. E., and McIntyre, T. M. (2014). Chronic ethanol ingestion induces oxidative kidney injury through taurine-inhibitable inflammation. Free Radic. Biol. Med. 69, 403–416. doi: 10.1016/j.freeradbiomed.2014.01.001
Liebal, U. W., Phan, A. N. T., Sudhakar, M., Raman, K., and Blank, L. M. (2020). Machine learning applications for mass spectrometry-based metabolomics. Meta 10:243. doi: 10.3390/metabo10060243
Liu, C., Tian, X., Ling, Y., Xu, J., and Zhou, X. (2020). Alterations of metabolites in the frontal cortex and amygdala are associated with cognitive impairment in alcohol dependent patients with aggressive behavior. Front. Psychol. 11:694. doi: 10.3389/fpsyt.2020.00694
Mirza, B., Wang, W., Wang, J., Choi, H., Chung, N. C., and Ping, P. (2019). Machine learning and integrative analysis of biomedical big data. Genes (Basel) 10:87. doi: 10.3390/genes10020087
Mittal, A., and Dabur, R. (2015). Detection of new human metabolic urinary markers in chronic alcoholism and their reversal by aqueous extract of Tinospora cordifolia stem. Alcohol Alcohol. 50, 271–281. doi: 10.1093/alcalc/agv012
Nicora, G., Vitali, F., Dagliati, A., Geifman, N., and Bellazzi, R. (2020). Integrated multi-omics analyses in oncology: a review of machine learning methods and tools. Front. Oncol. 10:1030. doi: 10.3389/fonc.2020.01030
Pasquier, F., Leys, D., Weerts, J. G., Mounier-Vehier, F., Barkhof, F., and Scheltens, P. (1996). Inter- and intraobserver reproducibility of cerebral atrophy assessment on MRI scans with hemispheric infarcts. Eur. Neurol. 36, 268–272.
Picard, M., Scott-Boyer, M. P., Bodein, A., Périn, O., and Droit, A. (2021). Integration strategies of multi-omics data for machine learning analysis. Comput. Struct. Biotechnol. J. 19, 3735–3746. doi: 10.1016/j.csbj.2021.06.030
Rehm, J., Gmel, G. E. Sr., Gmel, G., Hasan, O. S. M., Imtiaz, S., Popova, S., et al. (2017). The relationship between different dimensions of alcohol use and the burden of disease-an update. Addiction 112, 968–1001. doi: 10.1111/add.13757
Ribbenstedt, A., Ziarrusta, H., and Benskin, J. P. (2018). Development, characterization and comparisons of targeted and non-targeted metabolomics methods. PLoS One 13:e0207082. doi: 10.1371/journal.pone.0207082
Romanazzi, T., Zanella, D., Cheng, M. H., Smith, B., Carter, A. M., Galli, A., et al. (2021). Bile acids gate dopamine transporter mediated currents. Front. Chem. 9:753990. doi: 10.3389/fchem.2021.753990
Schrimpe-Rutledge, A. C., Codreanu, S. G., Sherrod, S. D., and McLean, J. A. (2016). Untargeted metabolomics strategies-challenges and emerging directions. J. Am. Soc. Mass Spectrom. 27, 1897–1905. doi: 10.1007/s13361-016-1469-y
Sutherland, G. T., Sheedy, D., and Kril, J. J. (2014). Neuropathology of alcoholism. Handb. Clin. Neurol. 125, 603–615. doi: 10.1016/B978-0-444-62619-6.00035-5
Tang, R., Yang, Q., Lin, S., Feng, Y., Yang, J., Lv, Q., et al. (2019). Preventive or curative Administration of Taurine Regulates Lipid Metabolism in the liver of rats with alcoholic liver disease. Adv. Exp. Med. Biol. 1155, 119–131. doi: 10.1007/978-981-13-8023-5_11
Van Deijk, A. L. F., Camargo, N., Timmerman, J., Heistek, T., Brouwers, J. F., Mogavero, F., et al. (2017). Astrocyte lipid metabolism is critical for synapse development and function in vivo. Glia 65, 670–682. doi: 10.1002/glia.23120
Vuckovic, D. (2018). Improving metabolome coverage and data quality: advancing metabolomics and lipidomics for biomarker discovery. Chem. Commun. (Camb.) 54, 6728–6749. doi: 10.1039/C8CC02592D
Wang, L., Li, M., Bu, Q., Li, H., Xu, W., Liu, C., et al. (2019). Chronic alcohol causes alteration of lipidome profiling in brain. Toxicol. Lett. 313, 19–29. doi: 10.1016/j.toxlet.2019.05.010
Wang, G., Liu, Q., Guo, L., Zeng, H., Ding, C., Zhang, W., et al. (2018). Gut microbiota and relevant metabolites analysis in alcohol dependent mice. Front. Microbiol. 9:1874. doi: 10.3389/fmicb.2018.01874
Yi, Z., Liu, X., Liang, L., Wang, G., Xiong, Z., Zhang, H., et al. (2021). Antrodin a from Antrodia camphorata modulates the gut microbiome and liver metabolome in mice exposed to acute alcohol intake. Food Funct. 12, 2925–2937. doi: 10.1039/D0FO03345F
Zahr, N. M., Kaufman, K. L., and Harper, C. G. (2011). Clinical and pathological features of alcohol-related brain damage. Nat. Rev. Neurol. 7, 284–294. doi: 10.1038/nrneurol.2011.42
Zhang, Z., Yi, P., Yang, J., Huang, J., Xu, P., Hu, M., et al. (2020). Integrated network pharmacology analysis and serum metabolomics to reveal the cognitive improvement effect of Bushen Tiansui formula on Alzheimer's disease. J. Ethnopharmacol. 249:112371. doi: 10.1016/j.jep.2019.112371
Zhu, X., Huang, J., Huang, S., Wen, Y., Lan, X., Wang, X., et al. (2021). Combining metabolomics and interpretable machine learning to reveal plasma metabolic profiling and biological correlates of alcohol-dependent inpatients: what about tryptophan metabolism regulation? Front. Mol. Biosci. 8:760669. doi: 10.3389/fmolb.2021.760669
Keywords: alcohol, brain atrophy, cognitive dysfunction, glycerophospholipid metabolism, metabolomic
Citation: Zhang Z, Zhang S, Huang J, Cao X, Hou C, Luo Z, Wang X, Liu X, Li Q, Zhang X, Guo Y, Xiao H, Xie T and Zhou X (2022) Association between abnormal plasma metabolism and brain atrophy in alcohol-dependent patients. Front. Mol. Neurosci. 15:999938. doi: 10.3389/fnmol.2022.999938
Edited by:
Giulia Abate, University of Brescia, ItalyReviewed by:
Vidhya Kumaresan, Boston University, United StatesCopyright © 2022 Zhang, Zhang, Huang, Cao, Hou, Luo, Wang, Liu, Li, Zhang, Guo, Xiao, Xie and Zhou. This is an open-access article distributed under the terms of the Creative Commons Attribution License (CC BY). The use, distribution or reproduction in other forums is permitted, provided the original author(s) and the copyright owner(s) are credited and that the original publication in this journal is cited, in accordance with accepted academic practice. No use, distribution or reproduction is permitted which does not comply with these terms.
*Correspondence: Xuhui Zhou, MzMwMTE1QGhudWNtLmVkdS5jbg==
†These authors have contributed equally to this work
Disclaimer: All claims expressed in this article are solely those of the authors and do not necessarily represent those of their affiliated organizations, or those of the publisher, the editors and the reviewers. Any product that may be evaluated in this article or claim that may be made by its manufacturer is not guaranteed or endorsed by the publisher.
Research integrity at Frontiers
Learn more about the work of our research integrity team to safeguard the quality of each article we publish.