 Rongjie Li1†Qiulan Jiang2†
 Chunhai Tang3†
 Liechun Chen4Deyan Kong4
 Chun Zou4
 Yan Lin5Jiefeng Luo4*
 Donghua Zou4*
- 1Department of Neurology, The Fifth Affiliated Hospital of Guangxi Medical University, Nanning, China
- 2Department of Radiation Oncology, The Affiliated Hospital of Youjiang Medical University for Nationalities, Baise, China
- 3Department of Neurosurgery, The Second Affiliated Hospital of Guangxi Medical University, Nanning, China
- 4Department of Neurology, The Second Affiliated Hospital of Guangxi Medical University, Nanning, China
- 5Department of Medical Oncology, Guangxi Medical University Cancer Hospital, Nanning, China
Background: Glioblastoma (GBM) is the most common malignant primary brain tumor, which associated with extremely poor prognosis.
Methods: Data from datasets GSE16011, GSE7696, GSE50161, GSE90598 and The Cancer Genome Atlas (TCGA) were analyzed to identify differentially expressed genes (DEGs) between patients and controls. DEGs common to all five datasets were analyzed for functional enrichment and for association with overall survival using Cox regression. Candidate genes were further screened using least absolute shrinkage and selection operator (LASSO) and random forest algorithms, and the effects of candidate genes on prognosis were explored using a Gaussian mixed model, a risk model, and concordance cluster analysis. We also characterized the GBM landscape of immune cell infiltration, methylation, and somatic mutations.
Results: We identified 3,139 common DEGs, which were associated mainly with PI3K-Akt signaling, focal adhesion, and Hippo signaling. Cox regression identified 106 common DEGs that were significantly associated with overall survival. LASSO and random forest algorithms identified six candidate genes (AEBP1, ANXA2R, MAP1LC3A, TMEM60, PRRG3 and RPS4X) that predicted overall survival and GBM recurrence. AEBP1 showed the best prognostic performance. We found that GBM tissues were heavily infiltrated by T helper cells and macrophages, which correlated with higher AEBP1 expression. Stratifying patients based on the six candidate genes led to two groups with significantly different overall survival. Somatic mutations in AEBP1 and modified methylation of MAP1LC3A were associated with GBM.
Conclusion: We have identified candidate genes, particularly AEBP1, strongly associated with GBM prognosis, which may help in efforts to understand and treat the disease.
Introduction
Glioblastoma (GBM) is an aggressive cancer and the most common malignant brain tumor in adults (Wei et al., 2022). GBM involves severe morbidity and it progresses rapidly, leading to extremely poor prognosis (Hassn Mesrati et al., 2020). Treatments include radical surgical resection, chemotherapy and radiation therapy, but they are relatively ineffective, such that GBM patients have the shortest survival among cancer patients (Louis et al., 2016). Indeed, GBM inevitably recurs after surgery and it becomes resistant to therapy, leading to a 5-year survival rate below 5% (Omuro and DeAngelis, 2013; Majc et al., 2021) and a mean survival time of 15 months from diagnosis (Lv et al., 2020).
Rapid and inexpensive gene sequencing has revolutionized our understanding of GBM (Jovcevska, 2020) by identifying, for example, the transcriptional inhibitor adipocyte enhancer binding protein 1 (AEBP1) (Kim et al., 2001) as a potential driver of GBM (Majdalawieh et al., 2020) and various other cancers associated with poor prognosis. Genome-wide association studies have validated 11 single-nucleotide polymorphisms as risk factors for the disease (Wen et al., 2020). At the same time, advances in immunotherapy against other cancers has stimulated research into the GBM immune microenvironment, which turns out to be highly immunosuppressive and a major obstacle to drug-induced killing of tumor cells (Pombo Antunes et al., 2020).
Together, these studies have highlighted the need for comprehensive analysis of genes, gene methylation, and tumor infiltration by immune cells for understanding GBM onset, progression, and treatment (Lukas et al., 2019; Hu et al., 2020; Qin et al., 2020). Therefore the present study examined these questions across five datasets from public databases.
Materials and Methods
Data Collection
The gene expression profiles of 145 GBM patients and 5 controls was obtained from The Cancer Genome Atlas (TCGA1). Gene expression profiles were also acquired from the datasets GSE16011, GSE7696, GSE50161 and GSE90598 in the Gene Expression Omnibus (GEO2). The GSE16011 dataset contains profiling of 276 GBM patients and 8 controls with survival information. The GSE7696 dataset includes profiles from 80 GBM patients and 4 non-tumoral brain samples with recurrence information. The GSE50161 dataset was generated from surgical tumor samples from 34 patients and 13 normal brain samples. The GSE90598 dataset included gene expression profiles from 16 GBM patients and 7 healthy brain tissues. The GSE36278 dataset included methylation profiles of brain tissue samples from 136 GBM patients and 6 controls. Oncomine database and TIMER database were used to identify the expression of genes.
Identification of Differentially Expressed Genes
The DEseq2 package in R (Love et al., 2014) was used to identify DEGs between GBM patients and controls in TCGA, while the corresponding analysis in the datasets GSE16011, GSE7696, GSE50161 and GSE90598 was performed using the limma package in R (Ritchie et al., 2015). DEGs whose expression differences were associated with P < 0.05 were considered significant and analyzed further. DEGs that were up- or downregulated across all five datasets were defined as common DEGs.
Functional Analysis of DEGs
The potential functions of common DEGs were explored by examining their enrichment in Gene Ontology (GO) biological processes and Kyoto Encyclopedia of Genes and Genomes (KEGG) pathways using the clusterProfiler package in R (Yu et al., 2012). P < 0.05 was set as the threshold of statistical significance.
Functions or pathways enriched in DEGs were assessed for activation or repression using gene set variation analysis (GSVA) with the GSVA package in R (Hanzelmann et al., 2013). Gene set enrichment analysis (GSEA) was also performed using the clusterProfiler package (Subramanian et al., 2005), and results were displayed using the fgsea package in R.
Association of DEGs With Overall Survival
DEGs identified in TCGA and the GSE16011 dataset were assessed for their association with overall survival of GBM patients using Kaplan-Meier curves. In addition, Cox regression was used to identify which genes previously linked to survival of GBM patients as well as common DEGs to obtain prognosis-related DEGs. The online tool Metascape3 was used to analyze the potential biological functions of prognosis-related DEGs.
Identification of Candidate Genes for a Prognostic Model
Using the glmnet package in R (Friedman et al., 2010), we performed binomial least absolute shrinkage and selection operator (LASSO) regression to identify common DEGs related to prognosis. This process can compress some coefficients to zero, and then only factors with non-zero coefficients are retained. We sequentially incorporated these factors into the Cox model, stopping inclusion when the area under the receiver operating characteristic curve (AUC) value peaked, at which point the model was considered optimal. AUC was calculated using the pROC package in R (Robin et al., 2011). Survival curves for both groups were plotted using the Kaplan–Meier method.
Survival data were dimensionally reduced using a random forest survival algorithm (Wang et al., 2020), ranked based on factor importance and then filtered for gene signatures. Forest plots were generated by univariate Cox regression analysis using the forestplot package in R. Genes with hazard ratio (HR) > 1 were considered risk factors, HR < 1 were protective factors. The Gene signatures overlapping between the LASSO analysis and random survival forest plots were defined as candidate genes.
Construction of the Risk Score-Based Prognostic Model
Candidate genes were classified using a Gaussian mixed model (GMM) based on their ability to predict recurrence in the GSE7696 dataset, following a previously described procedure (Hong et al., 2020). Briefly, genes were clustered into mixture models of genes with similar expression patterns. The optimal cluster was selected based on the AUC calculated for each model. Then candidate genes were selected to construct a risk score prognosis model, and GBM patients were divided into low- and high-risk groups based on the median risk score. A prognostic nomogram, constructed using Cox regression, was generated to predict overall survival at three and 5 years based on TCGA dataset. The predictive ability of the risk score prognostic model was assessed in terms of time-dependent AUC, calculated with the timeROC package in R (Blanche et al., 2013).
DNA Methylation and Somatic Mutations
The cAMP package in R was used to identify differences in methylation between GBM patients and controls in the GSE36278 dataset. Somatic mutations in GBM patients in the TCGA dataset were analyzed using the maftools package in R.
Immune Cell Infiltration
CIBERSORT4 and single—sample GSEA (ssGSEA) in the GSVA package in R were used to assess the levels of immune cell infiltration, and differences in infiltration between GBM patients and controls were calculated using the limma package in R. CIBERSORT were also used in immune cell infiltration for glioblastoma (Kesarwani et al., 2019). We also evaluated potential correlations between candidate genes and immune cell types using Pearson correlation analysis, with significance defined as P < 0.05.
Consensus Clustering, Clinical Characteristics and Drug Sensitivity of GBM Subtypes
The ConsensusClusterPlus package in R (Wilkerson and Hayes, 2010) was used to cluster GBM patients from the GSE16011 database, based on expression of candidate genes. Kaplan–Meier survival curves were compared between the resulting clusters. Potential correlations between patients’ cluster assignments and their clinical information were explored using Pearson correlation.
Drug sensitivity of genes in the clusters of GBM patients, in terms of IC50 values, was predicted using the Genomics of Drug Sensitivity in Cancer (GDSC) database5 using the pRophetic package in R. Significance was defined as P < 0.05. TIDE algorithm (Jiang et al., 2018) was used to predict the responsive to immunotherapy of GBM subtypes.
Results
Identification of GBM-Related Genes
The flowchart of this study is shown in Supplementary Figure 1. We identified DEGs between GBM and controls in the five datasets as follows: TCGA, 12040 DEGs; GSE16011, 9979 DEGs; GSE7696, 7730 DEGs; GSE50161, 9974 DEGs; and GSE90598, 9598 DEGs (Figures 1A,B). Common DEGs, which were dysregulated in the same direction across all five datasets, amounted to 1,641 upregulated DEGs (Figure 1C) and 1,498 downregulated DEGs (Figure 1D).
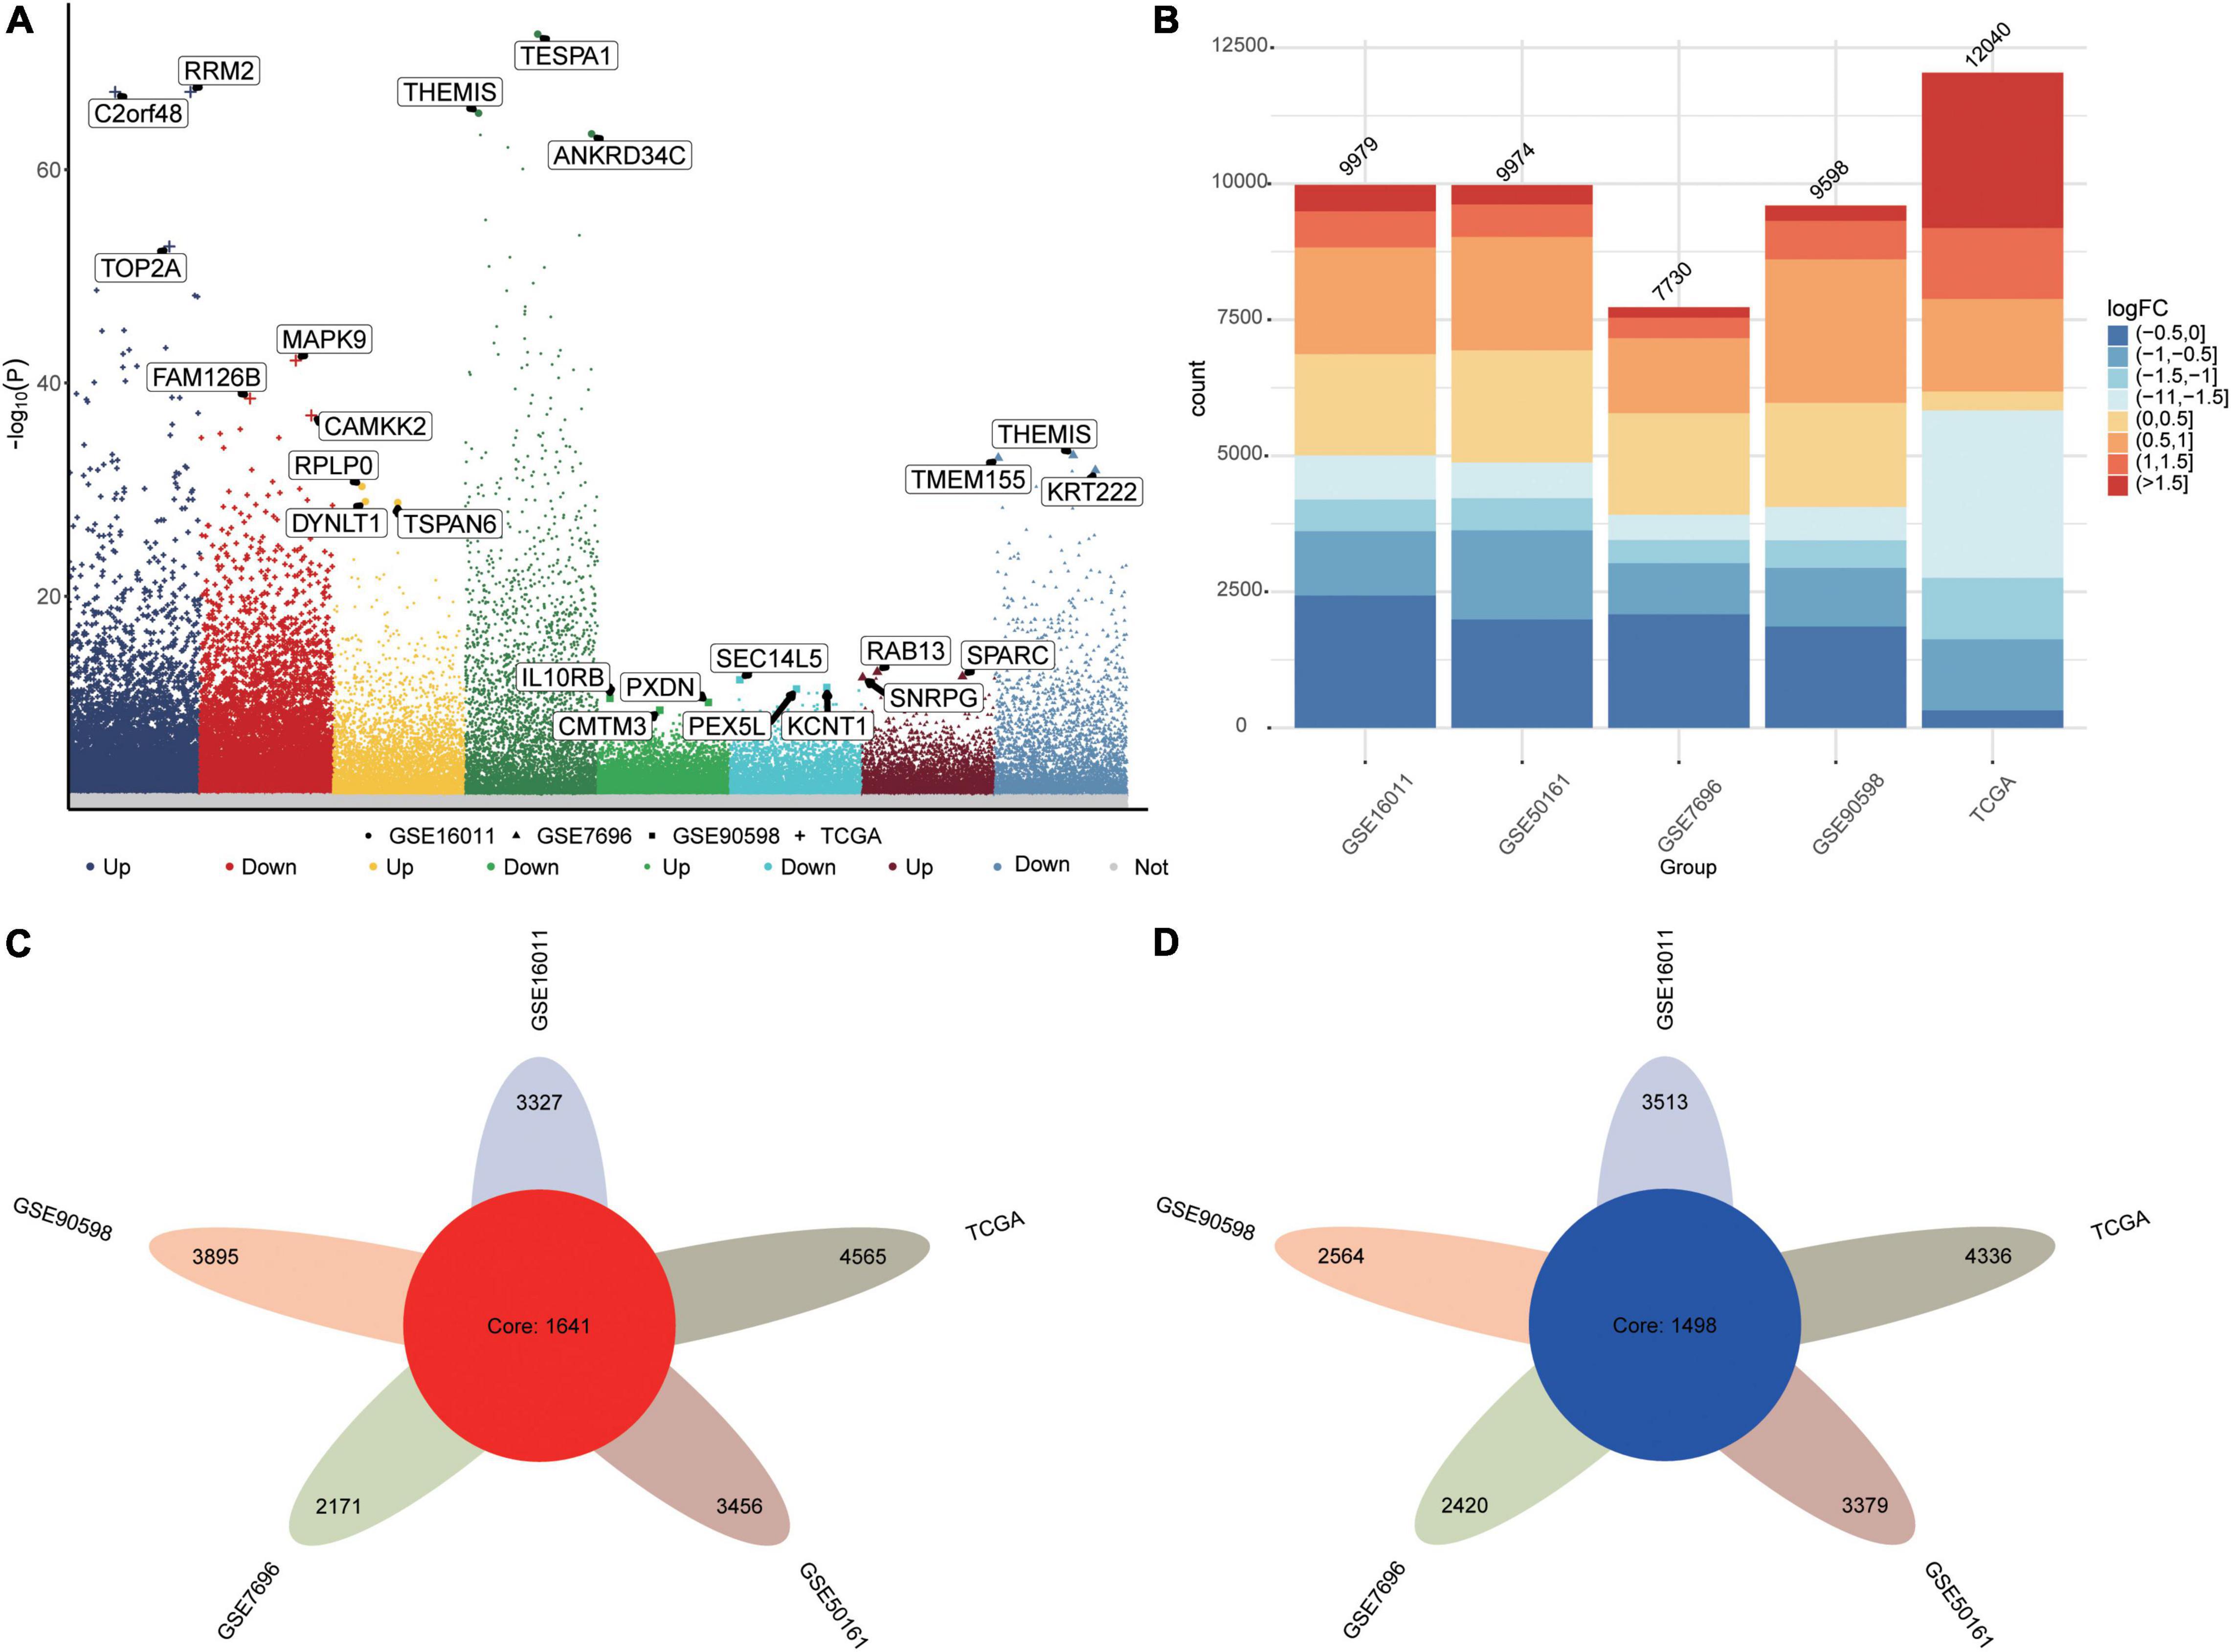
Figure 1. Differentially expressed genes (DEGs) between GBM patients and controls. (A) Manhattan plot of DEGs in the datasets TCGA, GSE16011, GSE7696, GSE50161 and GSE90598. (B) Statistical bar graph of DEGs in each group. (C) DEGs upregulated in GBM across all five datasets. (D) DEGs downregulated in GBM across all five datasets.
Biological Functions of Common DEGs
Several GO biological processes were enriched in common DEGs. The following processes were found to be activated in patients relative to controls: inflammatory response to wounding, response to type I interferon, and signal transduction by p53 class mediator (Figure 2A). Conversely, the following processes were inhibited in patients: calcium ion-regulated exocytosis, regulation of synaptic activity, and signal release from the synapse.
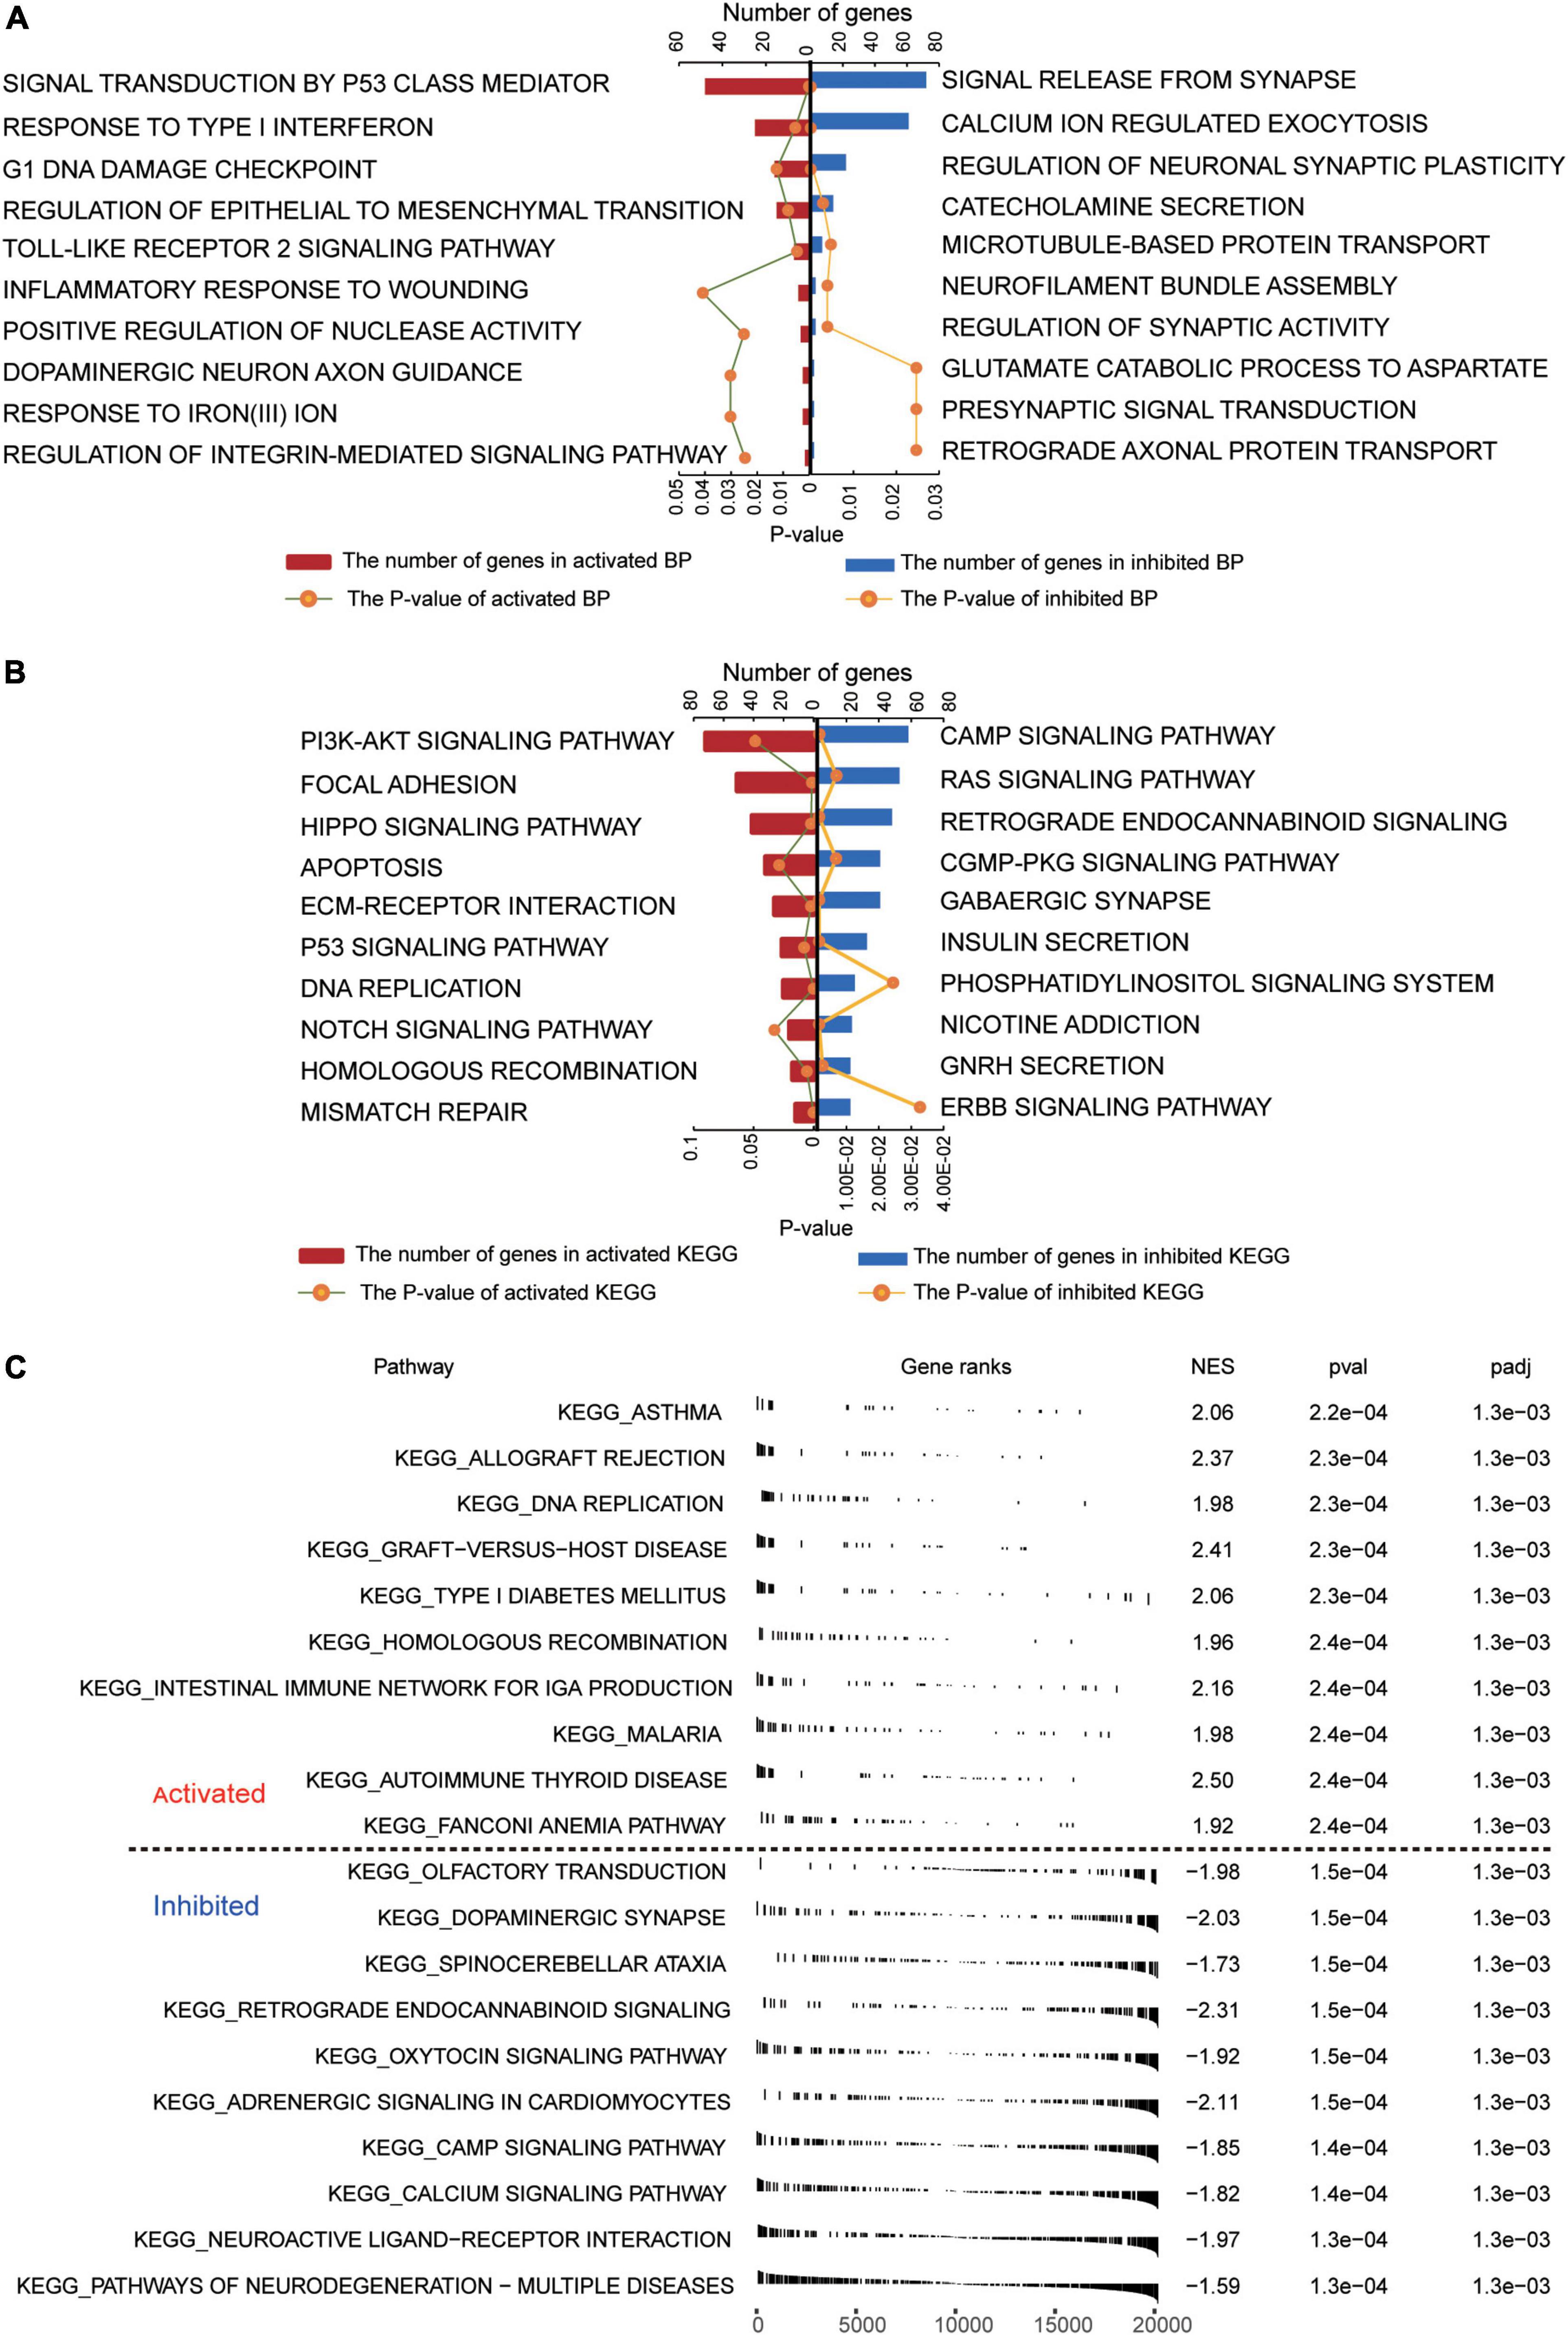
Figure 2. Functional enrichment of common DEGs in GBM. (A) Biological processes activated (red) or inhibited (blue) by common DEGs in GBM patients relative to controls. (B) KEGG pathways activated (red) or inhibited (blue) by common DEGs in GBM patients relative to controls. (C) Activated or inhibited processes in GBM patients relative to controls, based on gene set enrichment analysis.
Several KEGG pathways were enriched in common DEGs. The following were activated in patients relative to controls: PI3K-AKT signaling, focal adhesion, and Hippo signaling. Conversely, the following pathways were inhibited in patients: cAMP signaling, RAS signaling, and retrograde endocannabinoid signaling (Figure 2B). GSEA showed activation of asthma and allograft rejection pathways in patients, while it showed inhibition of pathways involving neurodegeneration-multiple diseases and neuroactive ligand-receptor interactions (Figure 2C).
Prognosis-Related Candidate Genes in GBM
Given the extremely poor 5-year overall survival of GBM patients in the GSE16011 dataset (Supplementary Figure 2A), we set out to identify genes associated with survival. Using Kaplan–Meier analysis and Cox regression analysis, we identified 106 common DEGs significantly associated with prognosis. These DEGs were enriched in wound healing, neutrophil degranulation, and extracellular matrix organization (Supplementary Figure 2B). The LASSO model based on 106 genes led to 19 gene signature that predicted GBM with the highest AUC of 0.906 (Figure 3A). A risk score was calculated for each patient using the 19 gene signatures, and the median score was used to stratify patients into low- and high-risk groups, which differed significantly in overall survival. We used univariate Cox regression and forest plots to visualize the distribution of gene signatures (Figure 3B), and we constructed a random forest survival model to select features with the 106 genes. The genes were ranked by relative importance based on the relationship between error rate and number of taxonomic trees, and the most important 15 genes were defined as the optimal signature (Figure 3C). Again, univariate Cox regression and forest plots were used to visualize the distribution of the gene signature (Figure 3D). Six genes overlapped between the 19-gene signature and the final 15-gene signature, and were therefore defined as candidate genes. Forest plots showed that AEBP1, ANXA2R, MAP1LC3A, TMEM60, and PRRG3 were risk factors for GBM, while RPS4X was a protective factor.
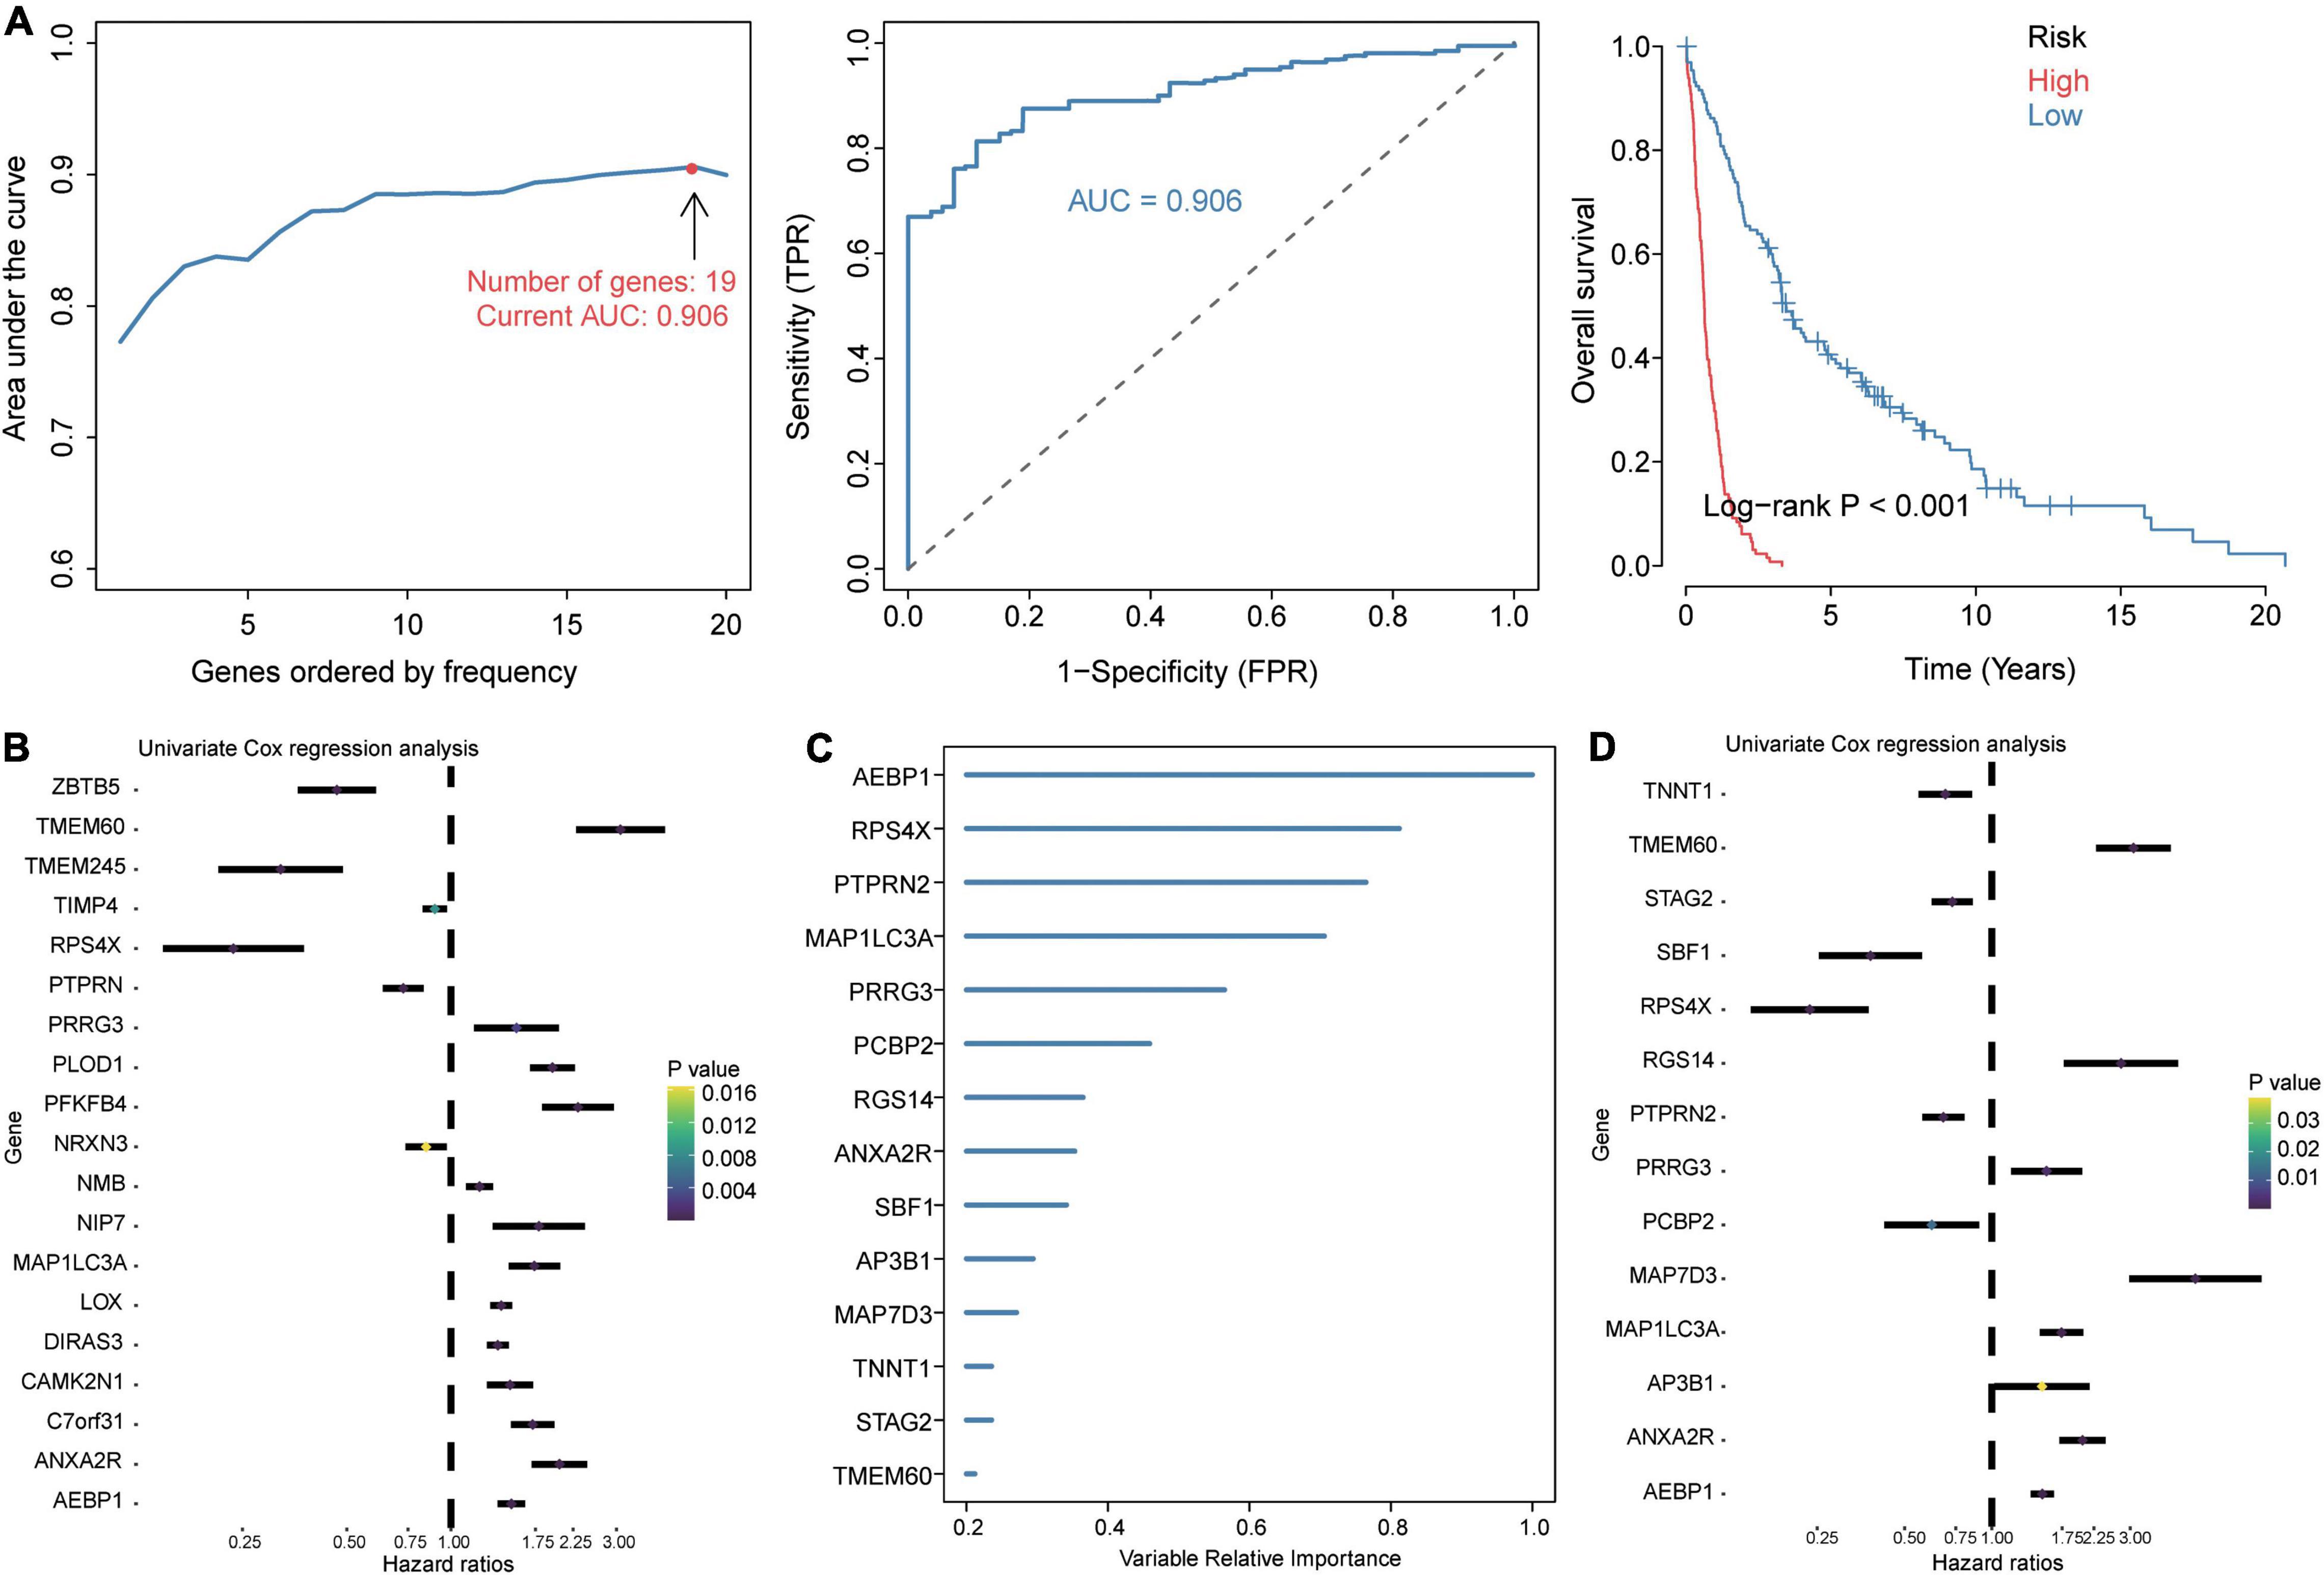
Figure 3. Identification of prognosis-related candidate genes in GBM. (A) The 19 gene signatures with the largest AUC values for diagnosing GBM. Signatures were identified using the least absolute shrinkage and selection operator (LASSO) algorithm, receiver operating characteristic curves, and Kaplan–Meier analysis of low- and high-risk groups. AUC, area under the receiver operating characteristic curve; FPR, false positive rate; TPR, true positive rate. (B) Forest plots of Cox regression analysis of gene signatures in the LASSO model. (C) Importance ranking of 15 gene signatures based on random forest survival modeling. (D) Forest plots of Cox regression analysis of gene signatures in the random forest survival model.
Evaluation of Candidate Genes
All six candidate genes had AUCs greater than 0.75 in all five datasets (Figure 4A), and GMM grouped the six candidate genes into three clusters based on their ability to predict GBM recurrence (Figure 4B). Cluster 2 (AEBP1, ANXA2R, MAP1LC3A, PRRG3, and RPS4X) showed the highest AUC for predicting recurrence. Patients were stratified into low- and high-risk groups based on median risk score for the candidate genes, and patients in the low-risk group showed higher recurrence-free survival (Figure 4C). Expression of AEBP1, ANXA2R, MAP1LC3A, TMEM60, and PRRG3 was high in the high-risk group, whereas RPS4X expression was low.
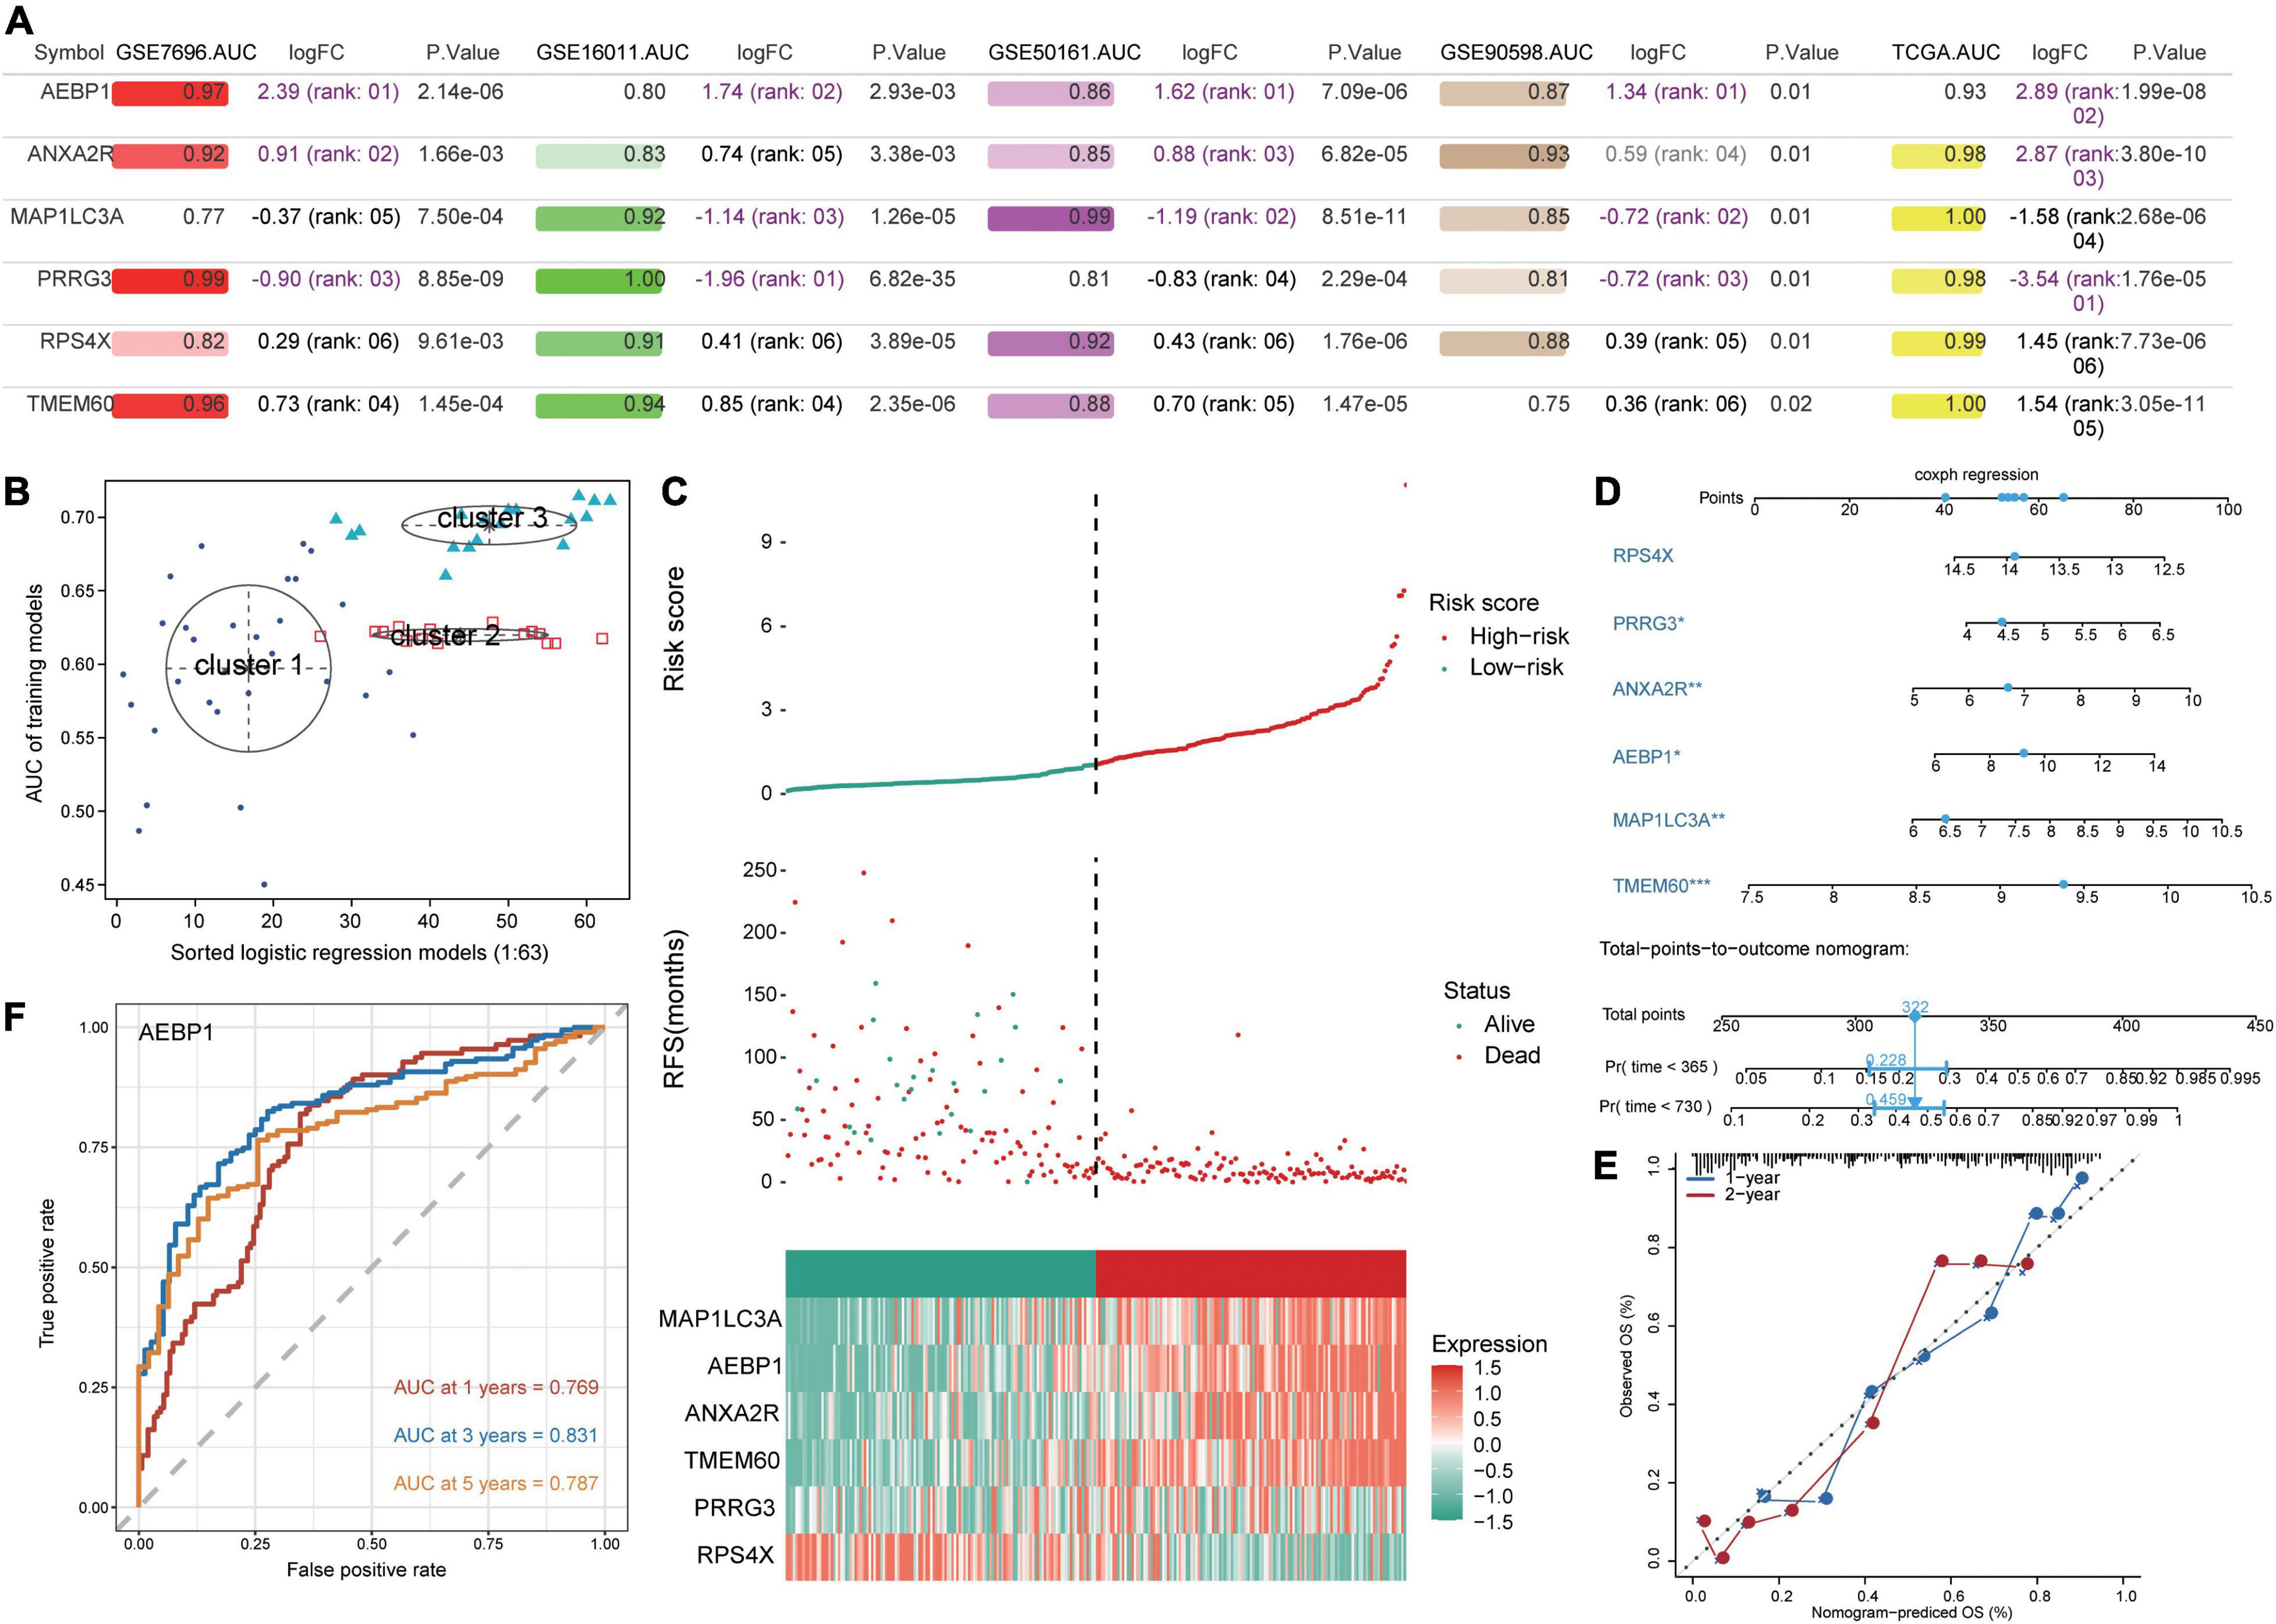
Figure 4. Prediction of GBM patient survival based on candidate genes. (A) Areas under the receiver operating characteristic curve (AUCs), fold change in differential expression, and P value associated with candidate genes based on the datasets GSE16011, GSE7696, GSE50161, GSE90598, and TCGA. (B) Correlation of AUCs with the logistic regression model was identified using a Gaussian mixed model. (C) Distribution of candidate gene-based risk scores, recurrence-free survival (RFS) and gene expression levels in the GSE16011 dataset. (D) A predictive nomogram was constructed based on candidate genes and the GSE16011 dataset. (E) Agreement between nomogram-predicted and observed overall survival (OS) at one and 2 years. (F) Receiver operating characteristic curve for AEBP1 to predict OS at one, three, and 5 years.
To develop a potentially more clinically useful tool for predicting overall survival in GBM patients, we built a nomogram using multivariate Cox regression (Figure 4D). Calibration plots showed that the nomogram performed well compared with an ideal model (Figure 4E), and the nomogram confirmed the above results about which candidate genes served as risk factors or protective factors.
Using the “timeROC” algorithm, we used the candidate genes to predict overall survival of GBM patients at one, three and five years. AEBP1 led to the highest AUCs (> 0.76) in all three cases (Figure 4F), while each of the other five candidate genes gave AUCs greater than 0.59 in all three cases (Supplementary Figure 3).
Immune Infiltration in GBM
CIBERSORT showed that M2 macrophages and monocytes were relatively abundant among immune cells in GBM patients in the GSE16011 dataset (Supplementary Figure 4A), while ssGSEA showed infiltration by Th2 cells, T helper cells, neutrophils, and macrophages to be significantly higher in patients than in controls in all five datasets (Supplementary Figure 4B). Conversely, infiltration by NK CD56bright cells was significantly lower in patients than in controls in the five datasets. Infiltrated immune cells fell into three clusters (Supplementary Figure 4C). The candidate genes, especially AEBP1, correlated significantly with T helper cells and macrophages (Supplementary Figure 4D).
Validation of AEBP1 as a Candidate Marker for GBM
Analysis of the Oncomine database showed AEBP1 to be upregulated in several types of tumors (Figure 5A), and similar results were found in the TIMER database (Supplementary Figure 5). In addition, according to the expression of AEBP1 and GSVA of functions or pathways, we performed correlation analysis. AEBP1 expression correlated positively with activated biological processes (Figure 5B) and negatively with inhibited processes (Figure 5C). Similarly, AEBP1 expression correlated positively with activated KEGG signaling pathways (Figure 5D) and negatively with inhibited KEGG signaling pathways (Figure 5E).
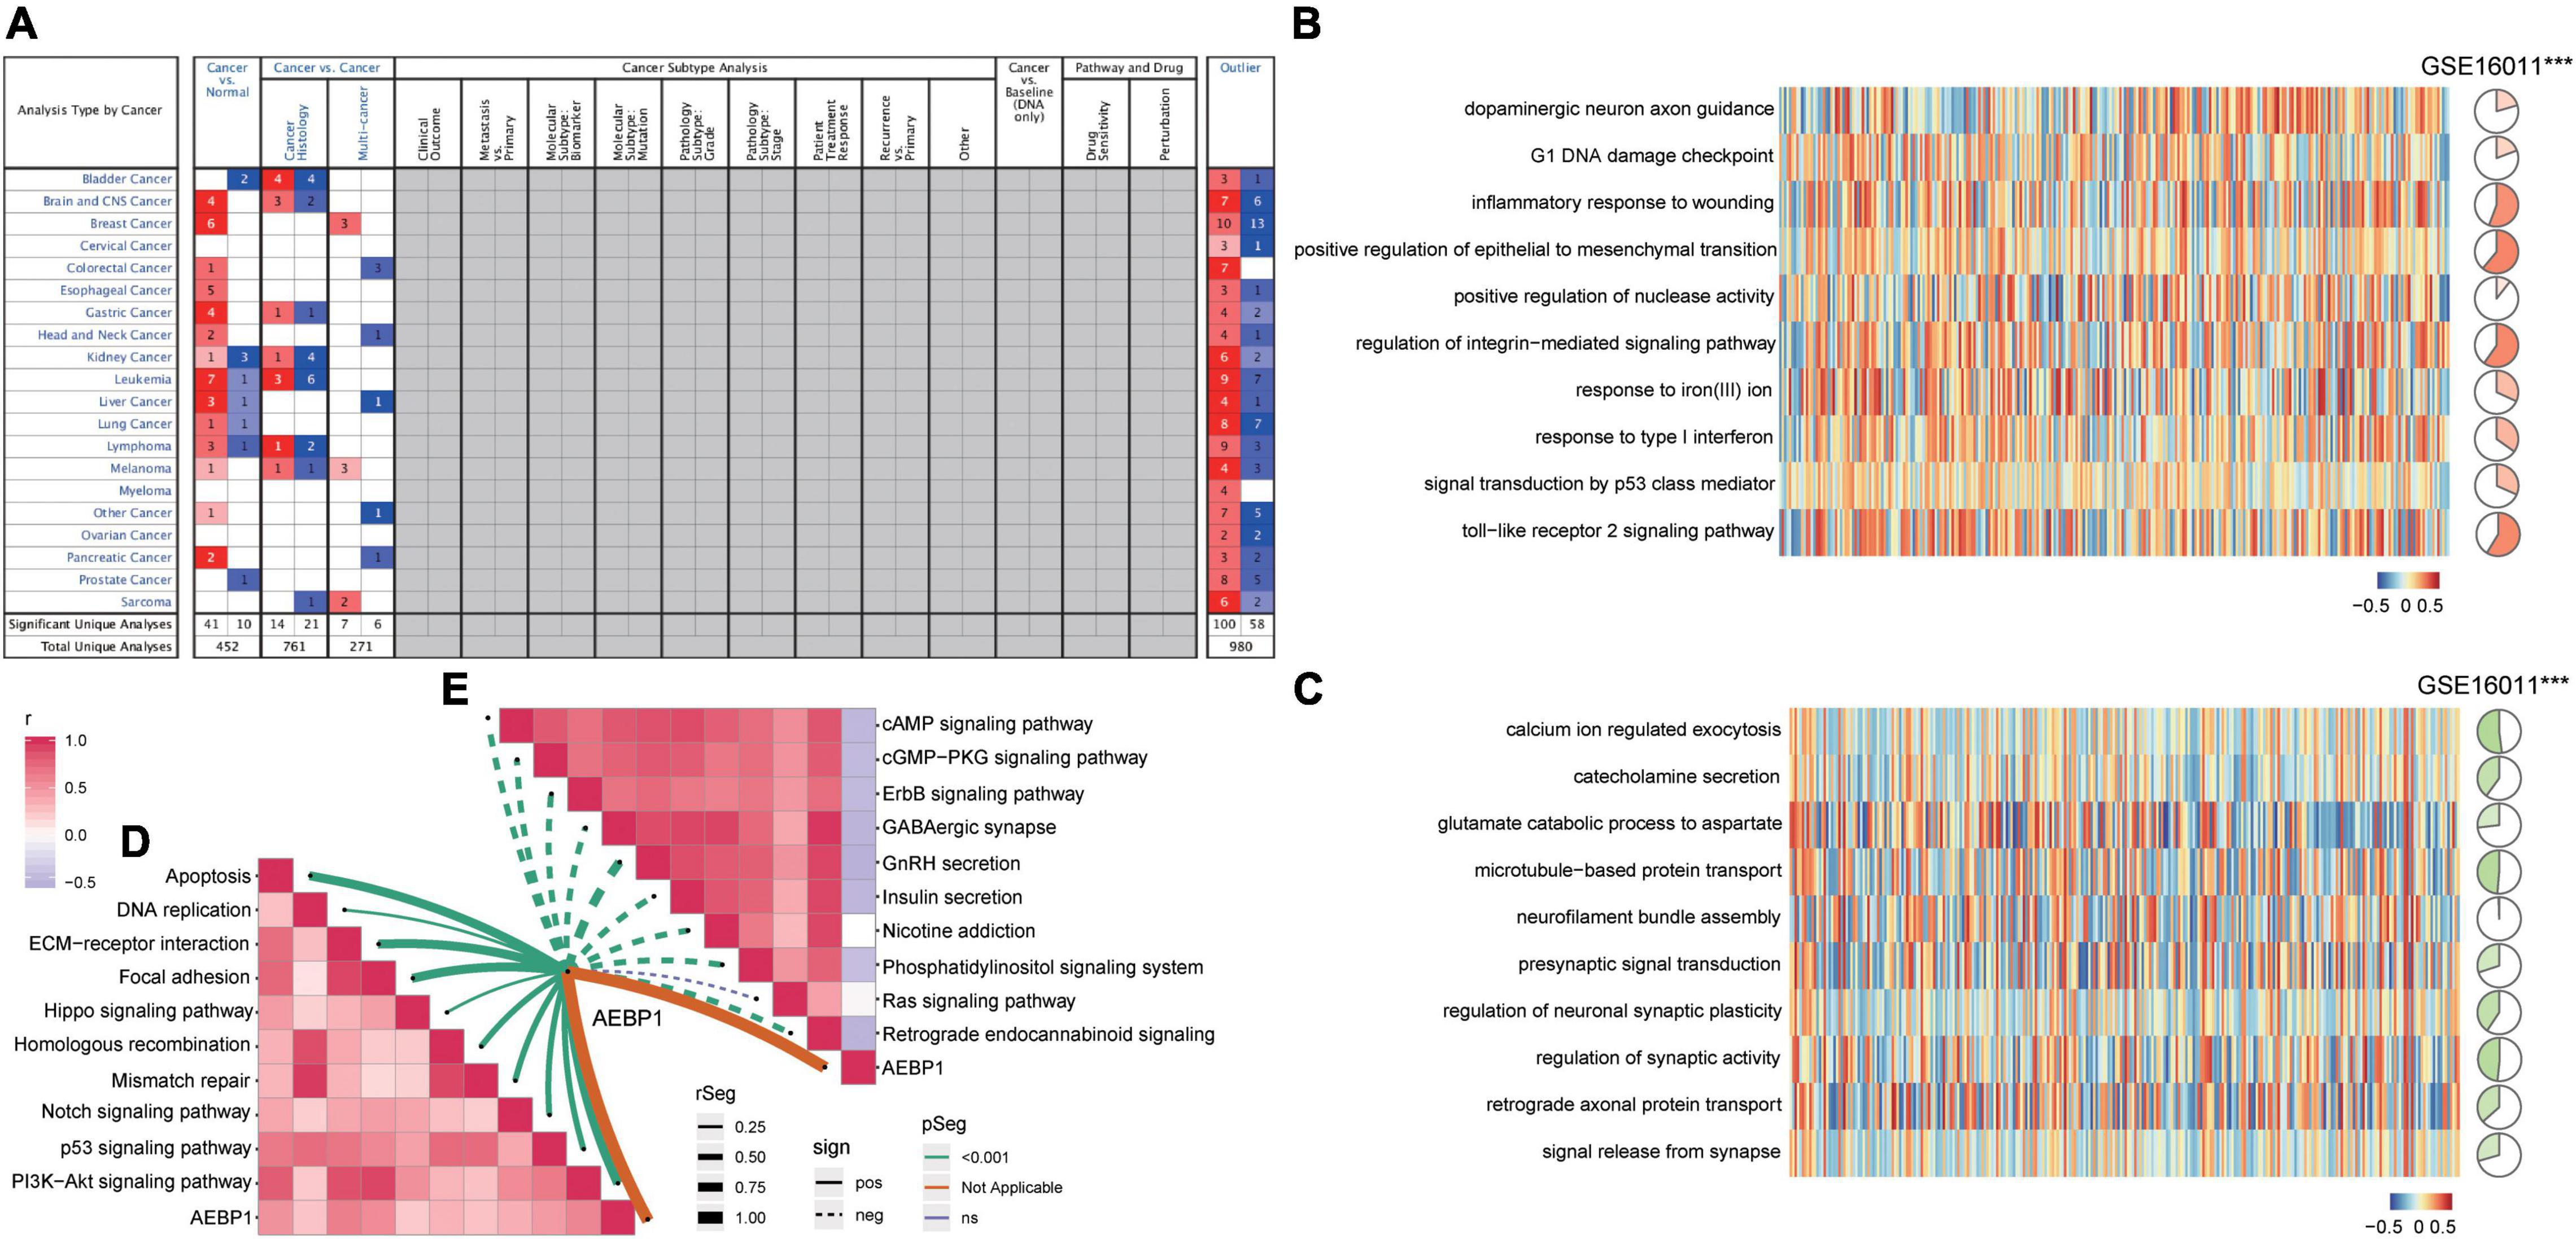
Figure 5. AEBP1 may be a candidate marker for GBM. (A) AEBP1 expression in the Oncomine database. Red is high expression and blue is low expression. Numbers represent the number of analyses when the fold change of expression was 2. (B) Correlation between AEBP1 and biological processes activated in GBM. (C) Correlation between AEBP1 and biological processes inhibited in GBM. (D) Correlation between AEBP1 and KEGG pathways activated in GBM. (E) Correlation between AEBP1 and KEGG pathways inhibited in GBM.
Construction of GBM Subtypes
Consistency clustering based on the six candidate genes split GBM samples into class 1 (C1) and class 2 (C2) (Figure 6A). Patients in C1 showed significantly better overall survival (Figure 6B), and the two classes differed significantly in cancer stage, age, and survival time (Figure 6C). The TIDE algorithm predicted that patients in C2 would be significantly more responsive to immunotherapy (P < 0.001). Indeed, we predicted C2 to be significantly more likely to respond to anti-PD-1 and anti-CTLA4 treatment when we compared expression profiles of C1 and C2 with those of melanoma patients who responded to immunotherapy (Figure 6D; Roh et al., 2017).
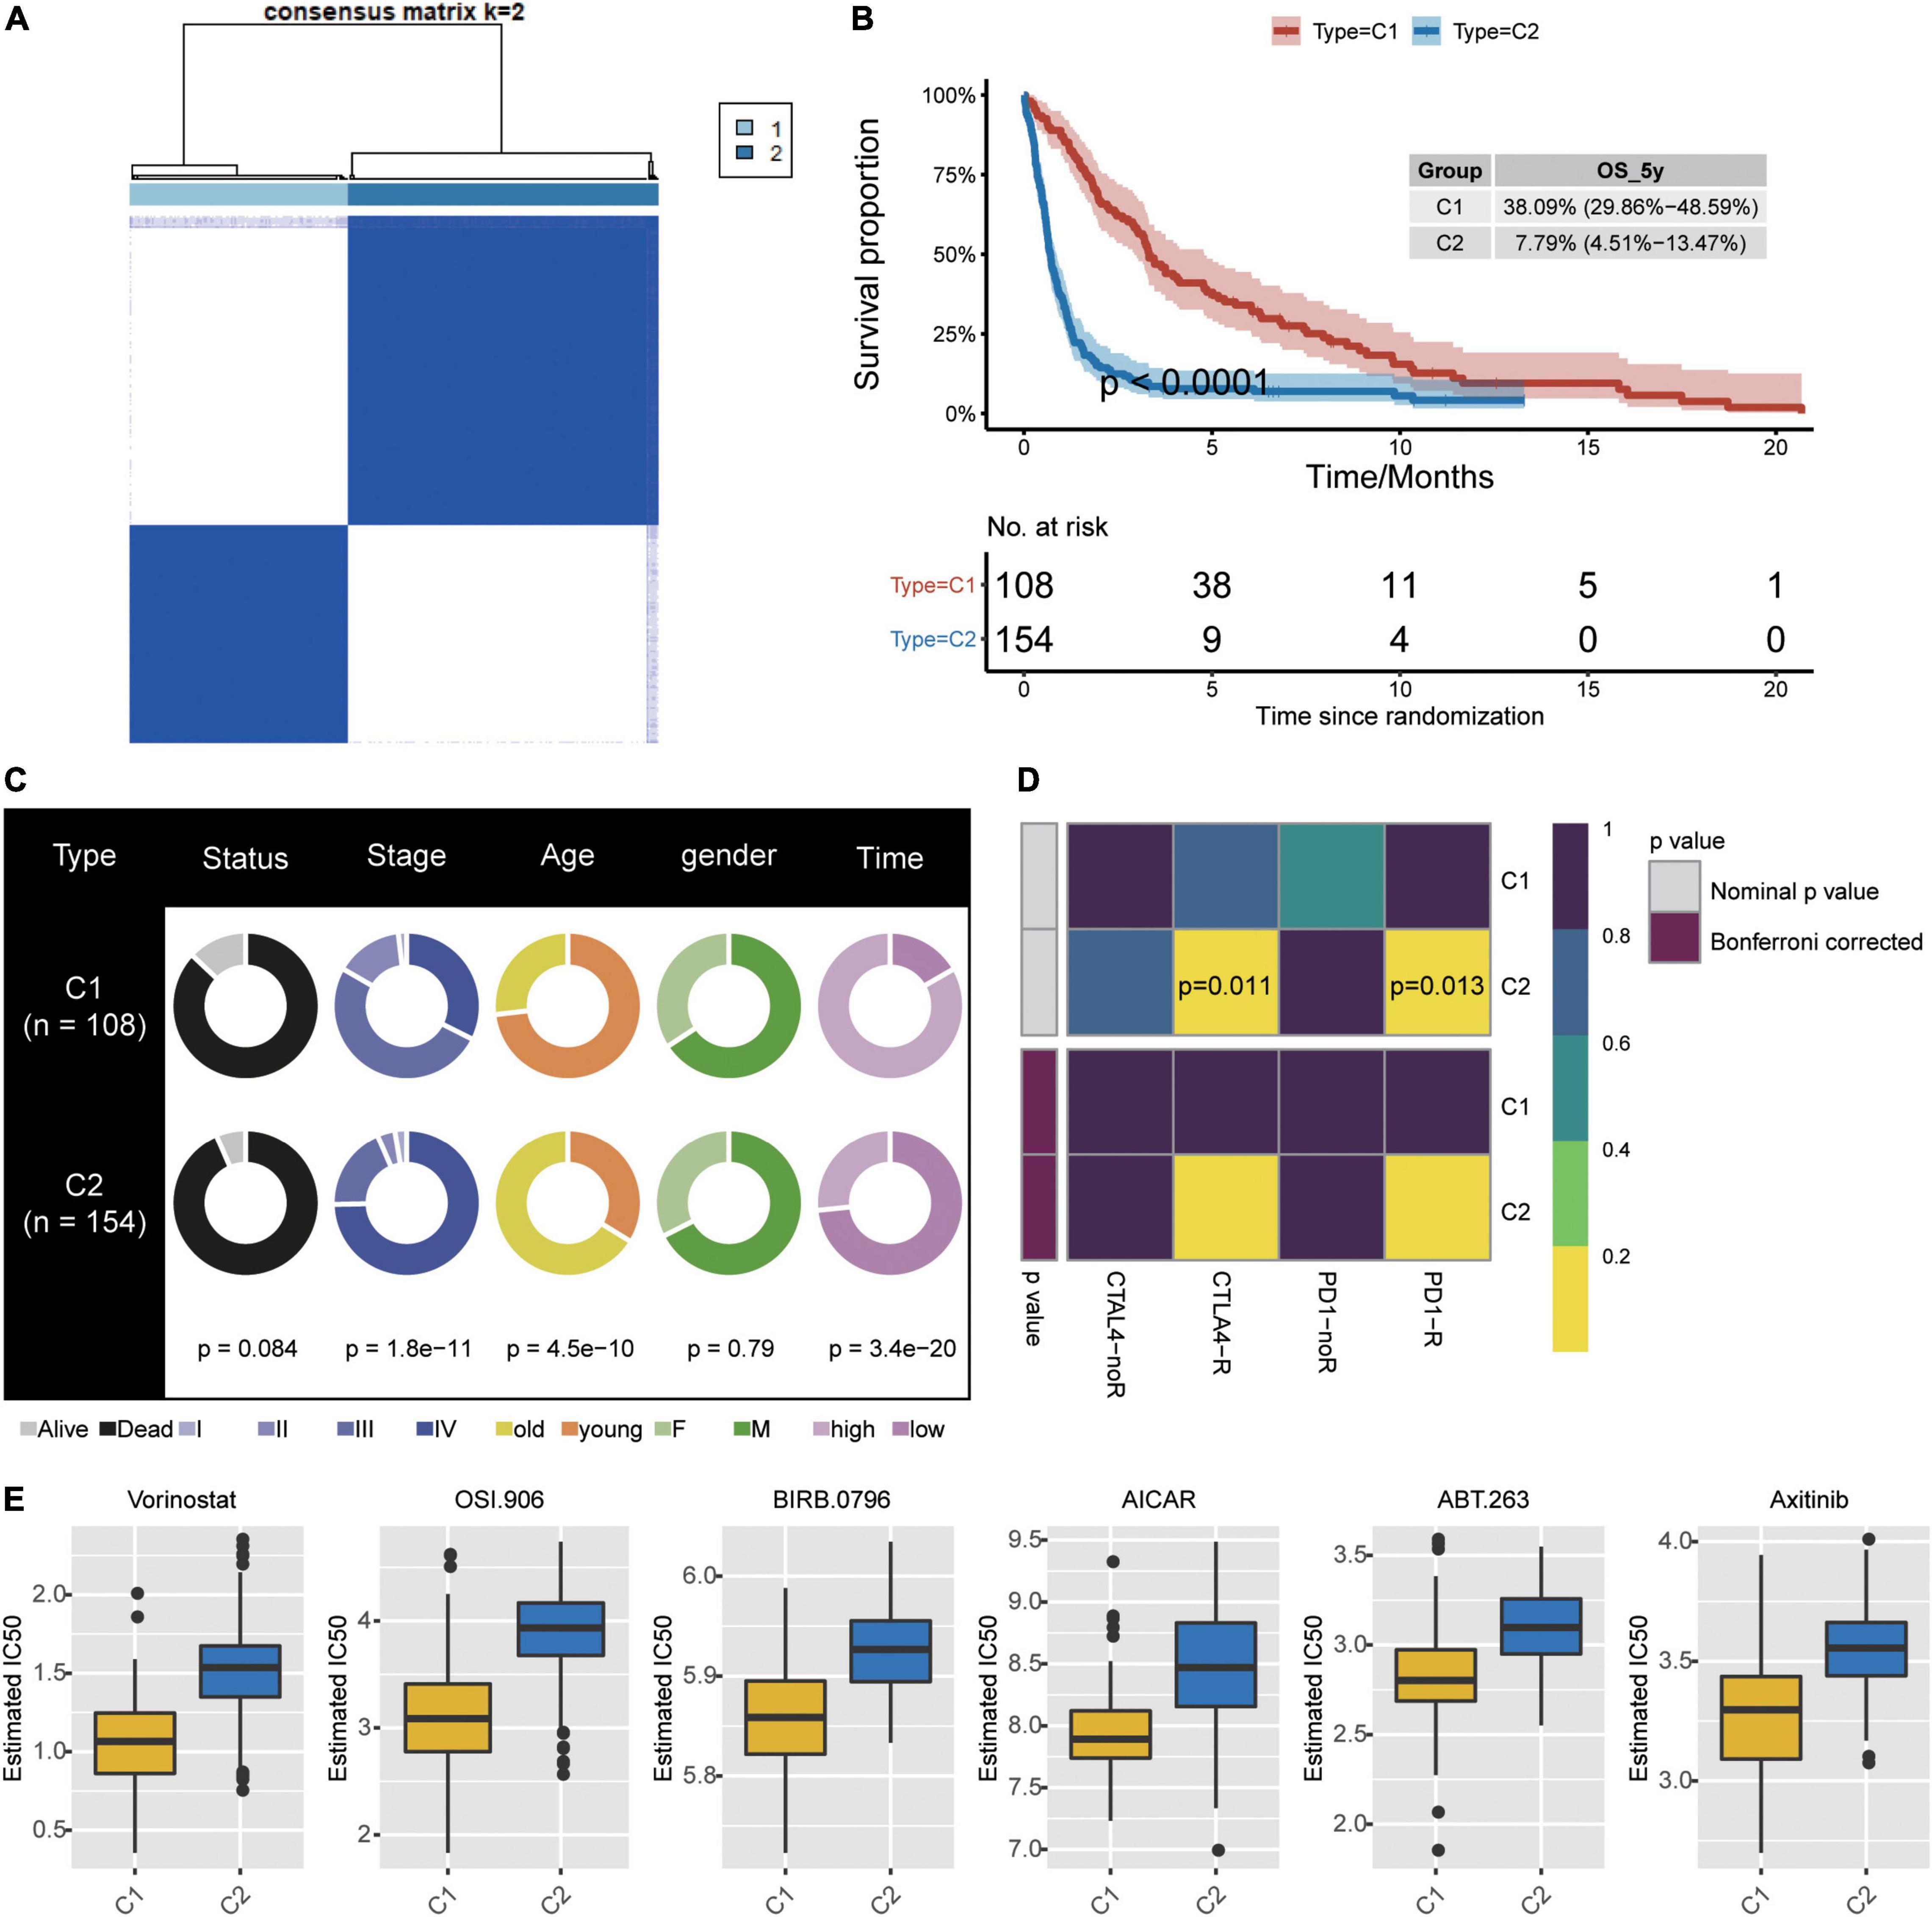
Figure 6. Identification of new subtypes of GBM. (A) Consistency clustering based on six candidate genes and GBM patients, generating clusters C1 and C2. (B) Kaplan–Meier overall survival (OS) curves for the two clusters. (C) Differences in clinical characteristics between the two clusters. (D) Differences in predicted response to immunotherapy between the two clusters. (E) Predicted drug IC50 values that differed the most between the two clusters.
To further explore treatment differences between the two classes of GBM patients, we trained a model with data from GDSC cells to predict IC50 for various chemotherapy drugs against patients in C1 or C2. We predicted that 45 drugs would affect the two patient classes differently, particularly the drugs Vorinostat, OSI.906, BIRB.0796, AICAR, ABT.263, and ABT.263 (Figure 6E).
Mutational and Methylation Landscape of GBM
GBM patients from TCGA showed hypermutated in the genes STAG2, ZBTB5, and NRXN3 (Supplementary Figure 6A), as well as AEBP1 (Supplementary Figure 6B). We screened the GSE36278 dataset for differentially methylated probes (DMPs) between GBM patients and controls (Supplementary Figure 6C), and we identified 61,448 DMPs involving 12,406 genes. When we focused on methylation modifications that affected gene expression in the opposite direction, we identified hypomethylated MAP1LC3A as altered in GBM (Supplementary Figure 6D).
Discussion
Recent studies have focused on identifying genes that promote or inhibit GBM (Hu et al., 2021; Lin et al., 2021), and we have extended that literature by identifying candidate DEGs associated with prognosis, based on publicly available data. Predicting the response to immunotherapy in patients with different clusters based on candidate genes provides a potential approach for screening immunotherapy patients in the future. The six candidate genes showed a significantly improved prognostic value for GBM patients. In particular, we identified AEBP1 as an oncogene in GBM and as a potential therapeutic and prognostic biomarker.
The DEGs in GBM that we identified appear to be involved in many biological processes and pathways related to nerve function, immune responses, and inflammation. This reflects that tumors act as “wounds that never heal,” hijacking proliferative pathways in wound healing in order to suppress immune responses and induce angiogenesis, all of which favors tumor spread (Dvorak, 1986; Hua and Bergers, 2019). The GO biological processes and KEGG pathways that we found to be activated in GBM concur with previous studies. GBM tumors infiltrate into dense synaptic networks, where they cause axon severing or edema, leading to neuronal degeneration (Lim et al., 2018). GBM progression seems to depend on the PI3K/Akt pathway, which promotes cell proliferation, angiogenesis, migration, invasion and metabolic reprogramming (Su et al., 2021), making it a potential therapeutic target (Lee et al., 2021). Stable focal adhesions, in which integrins connect the cytoskeleton to the extracellular matrix, are essential to maintain the invasive phenotype of GBM cells (Sun et al., 2016; Chen et al., 2018; de Semir et al., 2020). Hippo signaling is strongly associated with poor prognosis in GBM patients (Masliantsev et al., 2021). We found that GBM tissue is extensively infiltrated with neutrophils. Neutrophil infiltration is closely associated with tumor necrosis and predicts poor survival in GBM patients (Yee et al., 2020).
We identified six candidate genes by LASSO and random forest survival modeling that predicted overall survival with AUCs. Gene signatures may also be useful in other cancers, such as the 21-gene panel to evaluate breast cancer recurrence (Oncotype DX) (Wang et al., 2018) and the 18-gene signature to assess recurrence risk in stage II colon cancer patients (ColoPrint) (Kopetz et al., 2015). In addition, we also identified two clusters based on six candidate genes. There are differences between the two clusters in response to immunotherapy. Wang et al. (2021) predicted the clinical response of GBM patients to immunotherapy by TIDE algorithm using gene expression profiles of GBM samples. We also investigated the differences in sensitivity to drugs between patients with different clusters using the GDSC database. Studies exploring drug sensitivity in GBM patients with the GDSC database are also analyzed by Wang et al. (2022).
Five of the six candidate genes that the present work links to GBM have previously been associated with GBM or other cancers. AEBP1 expression has been associated with the poor prognosis of GBM patients (Kalya et al., 2021). Expression of ANXA2R has been shown to correlate inversely with prognosis of glioma patients (Stepniak et al., 2021). High MAP1LC3A expression has been linked to poor prognosis of GBM patients (Wang et al., 2019), perhaps because its upregulation impairs autophagy (Zhang et al., 2016). High expression of PRRG3 is associated with increased risk of prostate cancer (Zhang et al., 2020). Similarly, we are unaware of previous reports linking TMEM60 to GBM or other cancers. Our results identified RPS4X as a protective factor against GBM, which is interesting given that it has been reported to drive the development and metastasis of hepatocellular carcinoma (Zhou et al., 2020). The present study may help focus future research on genes most likely to play key roles in GBM, which may deepen our understanding of the disease and its treatment.
Nevertheless, our findings should be treated with caution in light of important limitations. The first is that our analyses were entirely bioinformatic, so experimental validation is needed. Second, we were unable to correlate gene expression with certain clinicodemographic characteristics of patients, or explore the possibility of clinicodemographic confounding in our analyses. This is because the necessary patient data were often missing from the public databases. In particular, we were unable to stratify patients by severity of GBM, which should be explored in future work.
Conclusion
We identified six candidate genes that may be prognostic and therapeutic targets for GBM, and we used those genes to build models to predict overall survival and recurrence. These genes and their predictive abilities may help clinicians individualize treatment for GBM patients.
Data Availability Statement
The original contributions presented in the study are included in the article/Supplementary Material, further inquiries can be directed to the corresponding author/s.
Ethics Statement
Ethical review and approval was not required for the study on human participants in accordance with the local legislation and institutional requirements. Written informed consent from the patients/participants or patients/participants’ legal guardian/next of kin was not required to participate in this study in accordance with the national legislation and the institutional requirements.
Author Contributions
RL, QJ, CT, DZ, and JL designed the study and contributed to drafting the manuscript. RL, QJ, CT, LC, CZ, DK, YL, DZ, and JL performed the experiments, and collated and analyzed the data. RL, QJ, CT, JL, and DZ wrote and revised the manuscript. All authors read and approved the final submitted manuscript.
Funding
This study was supported by the High-Level Medical Expert Training Program of the Guangxi “139” Plan (G201903049) and the Scientific Research Project of Guangxi Health Commission (Z20190376, Z2015285, Z20210933, and 20222039).
Conflict of Interest
The authors declare that the research was conducted in the absence of any commercial or financial relationships that could be construed as a potential conflict of interest.
Publisher’s Note
All claims expressed in this article are solely those of the authors and do not necessarily represent those of their affiliated organizations, or those of the publisher, the editors and the reviewers. Any product that may be evaluated in this article, or claim that may be made by its manufacturer, is not guaranteed or endorsed by the publisher.
Supplementary Material
The Supplementary Material for this article can be found online at: https://www.frontiersin.org/articles/10.3389/fnmol.2022.913328/full#supplementary-material
Footnotes
- ^ https://portal.gdc.cancer.gov/
- ^ https://www.ncbi.nlm.nih.gov/geo/
- ^ https://metascape.org/gp/index.html
- ^ https://cibersort.stanford.edu/
- ^ www.cancerRxgene.org
References
Blanche, P., Dartigues, J. F., and Jacqmin-Gadda, H. (2013). Estimating and comparing time-dependent areas under receiver operating characteristic curves for censored event times with competing risks. Stat. Med. 32, 5381–5397. doi: 10.1002/sim.5958
Chen, Z., Morales, J. E., Guerrero, P. A., Sun, H., and McCarty, J. H. (2018). PTPN12/PTP-PEST Regulates Phosphorylation-Dependent Ubiquitination and Stability of Focal Adhesion Substrates in Invasive Glioblastoma Cells. Cancer Res. 78, 3809–3822. doi: 10.1158/0008-5472.CAN-18-0085
de Semir, D., Bezrookove, V., Nosrati, M., Scanlon, K. R., Singer, E., Judkins, J., et al. (2020). PHIP drives glioblastoma motility and invasion by regulating the focal adhesion complex. Proc. Natl. Acad. Sci. U. S. A. 117, 9064–9073. doi: 10.1073/pnas.1914505117
Dvorak, H. F. (1986). Tumors: wounds that do not heal. Similarities between tumor stroma generation and wound healing. N Engl. J. Med. 315, 1650–1659. doi: 10.1056/NEJM198612253152606
Friedman, J., Hastie, T., and Tibshirani, R. (2010). Regularization Paths for Generalized Linear Models via Coordinate Descent. J. Stat. Softw. 33, 1–22.
Hanzelmann, S., Castelo, R., and Guinney, J. (2013). GSVA: gene set variation analysis for microarray and RNA-seq data. BMC Bioinform. 14:7. doi: 10.1186/1471-2105-14-7
Hassn Mesrati, M., Behrooz, A. B., Ya, A., and Syahir, A. (2020). Understanding Glioblastoma Biomarkers: Knocking a Mountain with a Hammer. Cells 9:1236. doi: 10.3390/cells9051236
Hong, H. C., Chuang, C. H., Huang, W. C., Weng, S. L., Chen, C. H., Chang, K. H., et al. (2020). A panel of eight microRNAs is a good predictive parameter for triple-negative breast cancer relapse. Theranostics 10, 8771–8789. doi: 10.7150/thno.46142
Hu, B., Qin, C., Li, L., Wei, L., Mo, X., Fan, H., et al. (2021). Midkine promotes glioblastoma progression via PI3K-Akt signaling. Cancer Cell Int. 21:509. doi: 10.1186/s12935-021-02212-3
Hu, B., Ruan, Y., Wei, F., Qin, G., Mo, X., Wang, X., et al. (2020). Identification of three glioblastoma subtypes and a six-gene prognostic risk index based on the expression of growth factors and cytokines. Am. J. Transl. Res. 12, 4669–4682.
Hua, Y., and Bergers, G. (2019). Tumors vs. Chronic Wounds: An Immune Cell’s Perspective. Front. Immunol. 10:2178. doi: 10.3389/fimmu.2019.02178
Jiang, P., Gu, S., Pan, D., Fu, J., Sahu, A., Hu, X., et al. (2018). Signatures of T cell dysfunction and exclusion predict cancer immunotherapy response. Nat. Med. 24, 1550–1558. doi: 10.1038/s41591-018-0136-1
Jovcevska, I. (2020). Next Generation Sequencing and Machine Learning Technologies Are Painting the Epigenetic Portrait of Glioblastoma. Front. Oncol. 10:798. doi: 10.3389/fonc.2020.00798
Kalya, M. P., Beisbarth, T., and Kel, A. (2021). [Master regulators associated with poor prognosis in glioblastoma multiforme]. Biomed. Khim. 67, 201–212. doi: 10.18097/PBMC20216703201
Kesarwani, P., Prabhu, A., Kant, S., and Chinnaiyan, P. (2019). Metabolic remodeling contributes towards an immune-suppressive phenotype in glioblastoma. Cancer Immunol. Immunother 68, 1107–1120. doi: 10.1007/s00262-019-02347-3
Kim, S. W., Muise, A. M., Lyons, P. J., and Ro, H. S. (2001). Regulation of adipogenesis by a transcriptional repressor that modulates MAPK activation. J. Biol. Chem. 276, 10199–10206. doi: 10.1074/jbc.M010640200
Kopetz, S., Tabernero, J., Rosenberg, R., Jiang, Z. Q., Moreno, V., Bachleitner-Hofmann, T., et al. (2015). Genomic classifier ColoPrint predicts recurrence in stage II colorectal cancer patients more accurately than clinical factors. Oncologist 20, 127–133. doi: 10.1634/theoncologist.2014-0325
Lee, Y. W., Cherng, Y. G., Yang, S. T., Liu, S. H., Chen, T. L., and Chen, R. M. (2021). Hypoxia Induced by Cobalt Chloride Triggers Autophagic Apoptosis of Human and Mouse Drug-Resistant Glioblastoma Cells through Targeting the PI3K-AKT-mTOR Signaling Pathway. Oxid. Med. Cell Longev. 2021:5558618. doi: 10.1155/2021/5558618
Lim, S., Kim, D., Ju, S., Shin, S., Cho, I. J., Park, S. H., et al. (2018). Glioblastoma-secreted soluble CD44 activates tau pathology in the brain. Exp. Mol. Med. 50, 1–11. doi: 10.1038/s12276-017-0008-7
Lin, Y., Wei, L., Hu, B., Zhang, J., Wei, J., Qian, Z., et al. (2021). RBM8A Promotes Glioblastoma Growth and Invasion Through the Notch/STAT3 Pathway. Front. Oncol. 11:736941. doi: 10.3389/fonc.2021.736941
Louis, D. N., Perry, A., Reifenberger, G., von Deimling, A., Figarella-Branger, D., Cavenee, W. K., et al. (2016). The 2016 World Health Organization Classification of Tumors of the Central Nervous System: a summary. Acta Neuropathol. 131, 803–820. doi: 10.1007/s00401-016-1545-1
Love, M. I., Huber, W., and Anders, S. (2014). Moderated estimation of fold change and dispersion for RNA-seq data with DESeq2. Genome Biol. 15:550. doi: 10.1186/s13059-014-0550-8
Lukas, R. V., Wainwright, D. A., Ladomersky, E., Sachdev, S., Sonabend, A. M., and Stupp, R. (2019). Newly Diagnosed Glioblastoma: A Review on Clinical Management. Oncology 33, 91–100.
Lv, T., Miao, Y., Xu, T., Sun, W., Sang, Y., Jia, F., et al. (2020). Circ-EPB41L5 regulates the host gene EPB41L5 via sponging miR-19a to repress glioblastoma tumorigenesis. Aging 12, 318–339. doi: 10.18632/aging.102617
Majc, B., Novak, M., Kopitar-Jerala, N., Jewett, A., and Breznik, B. (2021). Immunotherapy of Glioblastoma: Current Strategies and Challenges in Tumor Model Development. Cells 10:265. doi: 10.3390/cells10020265
Majdalawieh, A. F., Massri, M., and Ro, H. S. (2020). AEBP1 is a Novel Oncogene: Mechanisms of Action and Signaling Pathways. J. Oncol. 2020:8097872. doi: 10.1155/2020/8097872
Masliantsev, K., Karayan-Tapon, L., and Guichet, P. O. (2021). Hippo Signaling Pathway in Gliomas. Cells 10:184. doi: 10.3390/cells10010184
Omuro, A., and DeAngelis, L. M. (2013). Glioblastoma and other malignant gliomas: a clinical review. JAMA 310, 1842–1850.
Pombo Antunes, A. R., Scheyltjens, I., Duerinck, J., Neyns, B., Movahedi, K., and Van Ginderachter, J. A. (2020). Understanding the glioblastoma immune microenvironment as basis for the development of new immunotherapeutic strategies. Elife 9:e52176. doi: 10.7554/eLife.52176
Qin, G., Hu, B., Li, X., Li, R., Meng, Y., Wang, Y., et al. (2020). Identification of Key Differentially Expressed Transcription Factors in Glioblastoma. J. Oncol. 2020:9235101. doi: 10.1155/2020/9235101
Ritchie, M. E., Phipson, B., Wu, D., Hu, Y., Law, C. W., Shi, W., et al. (2015). limma powers differential expression analyses for RNA-sequencing and microarray studies. Nucleic Acids Res. 43:e47. doi: 10.1093/nar/gkv007
Robin, X., Turck, N., Hainard, A., Tiberti, N., Lisacek, F., Sanchez, J. C., et al. (2011). pROC: an open-source package for R and S+ to analyze and compare ROC curves. BMC Bioinform. 12:77. doi: 10.1186/1471-2105-12-77
Roh, W., Chen, P. L., Reuben, A., Spencer, C. N., Prieto, P. A., Miller, J. P., et al. (2017). Integrated molecular analysis of tumor biopsies on sequential CTLA-4 and PD-1 blockade reveals markers of response and resistance. Sci. Transl. Med. 9:eaah3560. doi: 10.1126/scitranslmed.aah3560
Stepniak, K., Machnicka, M. A., Mieczkowski, J., Macioszek, A., Wojtas, B., Gielniewski, B., et al. (2021). Mapping chromatin accessibility and active regulatory elements reveals pathological mechanisms in human gliomas. Nat. Commun. 12:3621.
Su, X., Yang, Y., Guo, C., Zhang, R., Sun, S., Wang, Y., et al. (2021). NOX4-Derived ROS Mediates TGF-beta1-Induced Metabolic Reprogramming during Epithelial-Mesenchymal Transition through the PI3K/AKT/HIF-1alpha Pathway in Glioblastoma. Oxid. Med. Cell Longev. 2021:5549047. doi: 10.1155/2021/5549047
Subramanian, A., Tamayo, P., Mootha, V. K., Mukherjee, S., Ebert, B. L., Gillette, M. A., et al. (2005). Gene set enrichment analysis: a knowledge-based approach for interpreting genome-wide expression profiles. Proc. Natl. Acad. Sci. U. S. A. 102, 15545–15550. doi: 10.1073/pnas.0506580102
Sun, Z., Guo, S. S., and Fassler, R. (2016). Integrin-mediated mechanotransduction. J. Cell Biol. 215, 445–456.
Wang, D., Jiang, Y., Wang, T., Wang, Z., and Zou, F. (2022). Identification of a novel autophagy-related prognostic signature and small molecule drugs for glioblastoma by bioinformatics. BMC Med. Genom. 15:111. doi: 10.1186/s12920-022-01261-5
Wang, J., Chen, X., Tian, Y., Zhu, G., Qin, Y., Chen, X., et al. (2020). Six-gene signature for predicting survival in patients with head and neck squamous cell carcinoma. Aging 12, 767–783. doi: 10.18632/aging.102655
Wang, S. Y., Dang, W., Richman, I., Mougalian, S. S., Evans, S. B., and Gross, C. P. (2018). Cost-Effectiveness Analyses of the 21-Gene Assay in Breast Cancer: Systematic Review and Critical Appraisal. J. Clin. Oncol. 36, 1619–1627. doi: 10.1200/JCO.2017.76.5941
Wang, Z., Gao, L., Guo, X., Feng, C., Lian, W., Deng, K., et al. (2019). Development and validation of a nomogram with an autophagy-related gene signature for predicting survival in patients with glioblastoma. Aging 11, 12246–12269. doi: 10.18632/aging.102566
Wang, Z., Wang, Y., Yang, T., Xing, H., Wang, Y., Gao, L., et al. (2021). Machine learning revealed stemness features and a novel stemness-based classification with appealing implications in discriminating the prognosis, immunotherapy and temozolomide responses of 906 glioblastoma patients. Brief Bioinform. 22:bbab032. doi: 10.1093/bib/bbab032
Wei, L., Zou, C., Chen, L., Lin, Y., Liang, L., Hu, B., et al. (2022). Molecular Insights and Prognosis Associated With RBM8A in Glioblastoma. Front. Mol. Biosci. 9:876603. doi: 10.3389/fmolb.2022.876603
Wen, P. Y., Weller, M., Lee, E. Q., Alexander, B. M., Barnholtz-Sloan, J. S., Barthel, F. P., et al. (2020). Glioblastoma in adults: a Society for Neuro-Oncology (SNO) and European Society of Neuro-Oncology (EANO) consensus review on current management and future directions. Neuro Oncol. 22, 1073–1113.
Wilkerson, M. D., and Hayes, D. N. (2010). ConsensusClusterPlus: a class discovery tool with confidence assessments and item tracking. Bioinformatics 26, 1572–1573. doi: 10.1093/bioinformatics/btq170
Yee, P. P., Wei, Y., Kim, S. Y., Lu, T., Chih, S. Y., Lawson, C., et al. (2020). Neutrophil-induced ferroptosis promotes tumor necrosis in glioblastoma progression. Nat. Commun. 11:5424. doi: 10.1038/s41467-020-19193-y
Yu, G., Wang, L. G., Han, Y., and He, Q. Y. (2012). clusterProfiler: an R package for comparing biological themes among gene clusters. OMICS 16, 284–287. doi: 10.1089/omi.2011.0118
Zhang, E., He, J., Zhang, H., Shan, L., Wu, H., Zhang, M., et al. (2020). Immune-Related Gene-Based Novel Subtypes to Establish a Model Predicting the Risk of Prostate Cancer. Front. Genet. 11:595657. doi: 10.3389/fgene.2020.595657
Zhang, H., Zhu, Y., Sun, X., He, X., Wang, M., Wang, Z., et al. (2016). Curcumin-Loaded Layered Double Hydroxide Nanoparticles-Induced Autophagy for Reducing Glioma Cell Migration and Invasion. J. Biomed. Nanotechnol. 12, 2051–2062. doi: 10.1166/jbn.2016.2291
Keywords: glioblastoma, AEBP1, Cox regression, overall survival, consensus cluster
Citation: Li R, Jiang Q, Tang C, Chen L, Kong D, Zou C, Lin Y, Luo J and Zou D (2022) Identification of Candidate Genes Associated With Prognosis in Glioblastoma. Front. Mol. Neurosci. 15:913328. doi: 10.3389/fnmol.2022.913328
Received: 05 April 2022; Accepted: 09 June 2022;
Published: 07 July 2022.
Edited by:
Fabrizio Michetti, Catholic University of the Sacred Heart, ItalyReviewed by:
Xuan Ye, Novartis Institutes for BioMedical Research, United StatesMeiyan Wang, Salk Institute for Biological Studies, United States
Jinling Liu, Missouri University of Science and Technology, United States
Copyright © 2022 Li, Jiang, Tang, Chen, Kong, Zou, Lin, Luo and Zou. This is an open-access article distributed under the terms of the Creative Commons Attribution License (CC BY). The use, distribution or reproduction in other forums is permitted, provided the original author(s) and the copyright owner(s) are credited and that the original publication in this journal is cited, in accordance with accepted academic practice. No use, distribution or reproduction is permitted which does not comply with these terms.
*Correspondence: Jiefeng Luo, ZHJsamY5OEAxNjMuY29t; Donghua Zou, em91ZG9uZ2h1YUBneG11LmVkdS5jbg==
†These authors have contributed equally to this work and share first authorship