 Phillip Rieder1†‡
 Davide Gobbo1†‡
 Gebhard Stopper1†
 Anna Welle2†
 Elisa Damo1,3†
 Frank Kirchhoff1†
 Anja Scheller1*†
- 1Department of Molecular Physiology, Center for Integrative Physiology and Molecular Medicine (CIPMM), University of Saarland, Homburg, Germany
- 2Department of Genetics and Epigenetics, University of Saarland, Saarbrücken, Germany
- 3Institute of Pharmacology, Medical Faculty Heidelberg, Heidelberg University, Heidelberg, Germany
The spinal cord is the main pathway connecting brain and peripheral nervous system. Its functionality relies on the orchestrated activity of both neurons and glial cells. To date, most advancement in understanding the spinal cord inner mechanisms has been made either by in vivo exposure of its dorsal surface through laminectomy or by acute ex vivo slice preparation, likely affecting spinal cord physiology in virtue of the necessary extensive manipulation of the spinal cord tissue. This is especially true of cells immediately responding to alterations of the surrounding environment, such as microglia and astrocytes, reacting within seconds or minutes and for up to several days after the original insult. Ca2+ signaling is considered one of the most immediate, versatile, and yet elusive cellular responses of glia. Here, we induced the cell-specific expression of the genetically encoded Ca2+ indicator GCaMP3 to evaluate spontaneous intracellular Ca2+ signaling in astrocytes and microglia. Ca2+ signals were then characterized in acute ex vivo (both gray and white matter) as well as in chronic in vivo (white matter) preparations using MSparkles, a MATLAB-based software for automatic detection and analysis of fluorescence events. As a result, we were able to segregate distinct astroglial and microglial Ca2+ signaling patterns along with method-specific Ca2+ signaling alterations, which must be taken into consideration in the reliable evaluation of any result obtained in physiological as well as pathological conditions. Our study revealed a high degree of Ca2+ signaling diversity in glial cells of the murine spinal cord, thus adding to the current knowledge of the astonishing glial heterogeneity and cell-specific Ca2+ dynamics in non-neuronal networks.
Introduction
The spinal cord is a highly sophisticated structure required for correct and rapid information transmission and processing (Bican et al., 2013; DeSai et al., 2021; Harrow-Mortelliti et al., 2021). In transverse sections, the spinal cord displays a distinct compartmentalization into white matter tracts containing neuronal fibers and a central gray matter region containing most of the neuronal cell bodies (Anderson et al., 2009). In both regions glial cells ensure alongside neurons reliable spinal network function and response upon physiological (such as somatosensory inputs) or pathological (such as neuropathic pain, inflammation, and spinal cord injury) stimuli. The attribution of glial cells to the correct functioning central nervous system has recently led to the comprehensive concept of an active milieu to point at the dynamic and reciprocal interactions between neuronal and glial compartments as well as extracellular space, extracellular matrix and vasculature that occur at any time within the nervous tissue (Semyanov and Verkhratsky, 2021). In particular, spinal cord injury induces robust alterations in both astroglial and microglial cellular phenotypes and activity around the lesion (Gaudet and Fonken, 2018; Hassanzadeh et al., 2021). Acute and sub-acute triggered, astroglial response fully develops in the range of days after the insult (Silver and Miller, 2004; Okada et al., 2006; Sofroniew and Vinters, 2010; Cregg et al., 2014; Fan et al., 2016; Liddelow et al., 2017; Li et al., 2019, 2020), whereas microglia can react in the scale of seconds or minutes (Prewitt et al., 1997; Dibaj et al., 2010; David and Kroner, 2011; Kopper and Gensel, 2018; Bellver-Landete et al., 2019; Kolos and Korzhevskii, 2020).
It is known since decades that glial cells undergo complex changes of internal Ca2+ concentration ([Ca2+]i), which represent a key read-out of glial activity and reactivity (Verkhratsky et al., 1998; Verkhratsky, 2006). In particular, astroglia exhibit highly dynamic intra- as well as intercellular Ca2+ signaling (Khakh and McCarthy, 2015; Caudal et al., 2020), both spontaneously (Araque et al., 1999; Parri et al., 2001; Nett et al., 2002; Haustein et al., 2014; Bindocci et al., 2017) as well as in response to extracellular inputs (Bazargani and Attwell, 2016; Panatier and Robitaille, 2016; Perea et al., 2016; Mariotti et al., 2018; Nagai et al., 2019; Kofuji and Araque, 2020). Importantly, neuropathological conditions (Bezzi et al., 2001; Rossi et al., 2005; Kuchibhotla et al., 2009; Carmignoto and Haydon, 2012; Hamby et al., 2012; Lee et al., 2013; Jiang et al., 2016; Mizuno et al., 2018; Shigetomi et al., 2019) as well as mechanical and biochemical insults (Shigetomi et al., 2019) perturb astroglial Ca2+ signaling, which in turn can mediate the cellular response and reactive phenotype. Microglia also display fast [Ca2+]i changes (from a millisecond and up to minute range) due to the presence of Ca2+-permeable membrane ion channels (Möller, 2002; Kettenmann et al., 2011) as well as in response to a plethora of extracellular ligands (Ferrari et al., 1996; Nolte et al., 1996; Möller et al., 1997; Toescu et al., 1998; Biber et al., 1999; Visentin et al., 1999; Noda et al., 2000; Kuhn et al., 2004; Bianco et al., 2005; Light et al., 2006). Microglial Ca2+ signals correlate in situ with microglial reactive phenotype (Hoffmann et al., 2003; Färber and Kettenmann, 2006; Haynes et al., 2006; Ikeda et al., 2013; Heo et al., 2015; Michaelis et al., 2015; Korvers et al., 2016) and were recorded in vivo at low frequency, in response to damage-induced ATP release (Eichhoff et al., 2011; Pozner et al., 2015; Brawek et al., 2017). Notably, hypoactive shifts in neuronal activity (Brawek et al., 2014; Umpierre et al., 2020) as well as neuronal hyperactivity during kainate induced-status epilepticus and after chemogenetic artificial activation (Umpierre et al., 2020) increase the frequency of microglial Ca2+ signals in vivo. Nevertheless, as for astroglia, the microglial reactive phenotype and subsequent inflammatory response involve [Ca2+]i variations, which may add to different extents on the microglial contribution to several pathophysiological conditions (Glass et al., 2010; Perry et al., 2010; Kettenmann et al., 2011; Brawek and Garaschuk, 2013; Ransohoff and El Khoury, 2015).
To date, the detailed characterization of glial Ca2+ signaling in the spinal cord has been facing up to its limited accessibility and the extensive manipulation required to either obtain acute slice preparations or perform acute and chronic in vivo imaging (Cupido et al., 2014; Cartarozzi et al., 2018; Nelson et al., 2019). In comparison to spinal cord neuronal Ca2+ signaling (Johannssen and Helmchen, 2010; Nishida et al., 2014; Sekiguchi et al., 2016), little is known about astroglial Ca2+ activity (Cirillo et al., 2012; Sekiguchi et al., 2016) and none, to our knowledge, about spinal microglial Ca2+ activity. It is therefore unknown if under physiological conditions these glial cell types display similar Ca2+ changes to other CNS regions or whether they exhibit distinct specifications. In addition, it needs to be elucidated to which extent their activity is affected by the experimental procedure required to access them, i.e., acute slice preparation (ex vivo) and chronic window implantation for in vivo imaging. Here, we provide a comprehensive analysis of Ca2+ signals in astroglia and microglia of the murine spinal cord using transgenic mice with cell-type specific expression of a genetically encoded Ca2+ indicator (GCaMP3), thus adding on the long-lasting and still ongoing research on the heterogeneity of glial Ca2+ signaling.
Materials and Methods
Animals
Mice were maintained in the animal facility of the Center for Integrative Physiology and Molecular Medicine (CIPMM, University of Saarland, Homburg). Humidity and temperature were maintained at 45–65% and 20–24°C and the facility was kept under a 12 h light-dark cycle. All mice received food ad libitum (standard autoclaved rodent diet, Ssniff Spezialdiäten, Soest, Germany) and autoclaved tap water. Transgenic hGFAP-CreERT2 mice [Tg(GFAP-cre/ERT2)1Fki, MGI:4418665] (Hirrlinger et al., 2006) and knock-in CX3CR1-CreERT2 mice [Cx3cr1tm2.1(cre/ERT2)Jung, MGI: 5467985] (Yona et al., 2013) were crossbred to mice with Rosa26 reporter mice [Gt(ROSA)26Sortm1(CAG–GCaMP3)Dbe, MGI: 5659933] (Paukert et al., 2014). To induce GCaMP3 expression, tamoxifen was administered intraperitoneally for three consecutive days (once per day, 100 mg/kg body weight) (Jahn et al., 2018) at 10 weeks of age. Spinal cord laminectomy, acute slice preparation, 2P-LSM and IHC were performed at 12–13 weeks of age.
Laminectomy and Spinal Window Implantation
All surgical sections were realized in animals under inhalational anesthesia (1.5–2% isoflurane, 66% O2 and 33% N2O) and the animal’s eyes were covered by Bepanthen (Bayer, Leverkusen, Germany). Surgeries were adapted and modified from Fenrich et al. (2012) to get access to T12-L2 vertebrae and by laminectomy approach, L4-S1 spinal segments could be exposed. For chronic observations, a modified coverslip was fit on the spinal cord and animals were postoperatively injected subcutaneously with analgesic and antiphlogistic agents for two consecutive days (Cupido et al., 2014).
Acute Spinal Cord Slice Preparation
After cervical dislocation, spinal T13-L1 segments were dissected and further processed in ice-cold artificial cerebrospinal fluid [aCSF; in mM, 125 NaCl, 2.5 KCl, 2 CaCl2, 1 MgCl2, 1.25 NaH2PO4, 25 NaHCO3, and 25 D-glucose, 330 mOsm/l, pH 7.4; adapted from Hirrlinger et al. (2005)] and purged by carbogen. Afterward, longitudinal sections were cut by a vibratome (VT1200 S) (Leica, Nußloch, Germany) with 250 μm thickness, primarily maintained at 37°C for 30 min and subsequently stored at room temperature for further 30 min and during 2P-LSM.
Two-Photon Laser-Scanning Microscopy
To perform in vivo and ex vivo recordings, a custom-made two-photon laser-scanning microscope (2P-LSM), equipped with a mode-locked Ti:sapphire femto second pulsed laser, Vision II (Coherent, St. Clara, United States) (Dibaj et al., 2010), in combination with ScanImage software (Pologruto et al., 2003) was used. For transgenic GCaMP3 excitation, the laser wavelength was set to 890 nm and the power was adjusted from 8 to 60 mW, depending on the imaging depth in the tissue. 2P-LSM was performed on the white matter of the dorsal funiculus for in vivo and ex vivo preparations as well as on the dorsal horn gray matter for ex vivo preparations up to a 100–150 μm depth (laminae IV and V) by using a long-distance W Plan-Apochromat 20 × 1.0 NA DIC objective (Zeiss, Oberkochen, Germany). Areas of white and gray matter were recorded as uniformly spaced planes of field of views with 256 × 256 pixel per image, 1.4 μs pixel dwell time and GCaMP3 emission was acquired using a 500/24 nm band pass filter, detected by a photomultiplier tube H10770PB-40 (Hamamatsu Photonics, Hamamatsu, Japan). During 2P-LSM ex vivo spinal cord slices were continuously perfused with carbogenated aCSF.
Automated ROA-Based Detection and Analysis of Ca2+ Events
Ca2+-event analysis was performed using a custom-made analysis software, developed in MATLAB (MSparkles, unpublished). Fluorescence fluctuations at basal Ca2+ concentrations (F0) were computed along the temporal axes of each individual pixel, by fitting a polynomial of user-defined degree in a least-squares sense. Prior to polynomial fitting, potential Ca2+ signals were removed for the purpose of F0 estimation. The range projection of ΔF/F0 was then used to identify local fluorescence maxima, serving as seed points for simultaneous, correlation-based region growing. Therefore, the correlation of a candidate pixel’s fluorescence profile with the fluorescence profile of its corresponding seed point was computed, using Pearsons’s linear correlation coefficient. A user-definable correlation threshold was used to stop the region growing process as soon as the temporal evolution of a candidate pixel deviated from its respective seed point (minimum ROA area, 5 μm2; temporal correlation threshold, 0.2). Pixels belonging to two adjacent regions were marked as boundary pixels. Prior to F0 estimation, image stacks were denoised using the PURE-LET algorithm (Luisier et al., 2011) as well as a temporal median filter to correct small motion artifacts and simultaneously retain sharp transient edges. Based on the pre-processed data (F), Ca2+ event detection and analysis were performed on the normalized dataset (ΔF/F0) (Table 1). MSparkles automatically computed Ca2+ signal parameters, such as peak amplitude, duration, Ca2+ signal start and end time, ROA area and per-ROA signal frequency. The fluorescence profiles of each ROA were obtained by computing the mean fluorescence among the ROA pixels per recorded time point. ROA areas were obtained by reading the pixel sizes from the image metadata and multiplying them with the individual number of pixels per ROA. Signal durations were computed at full-width at half-maximum (FWHM) of a signal’s peak amplitude. Start and end times of a signal were computed as the intersection points of the FWHM with the transient curve. Per ROA signal frequency was computed only if more than one signal was detected within a ROA as the mean signal frequency.
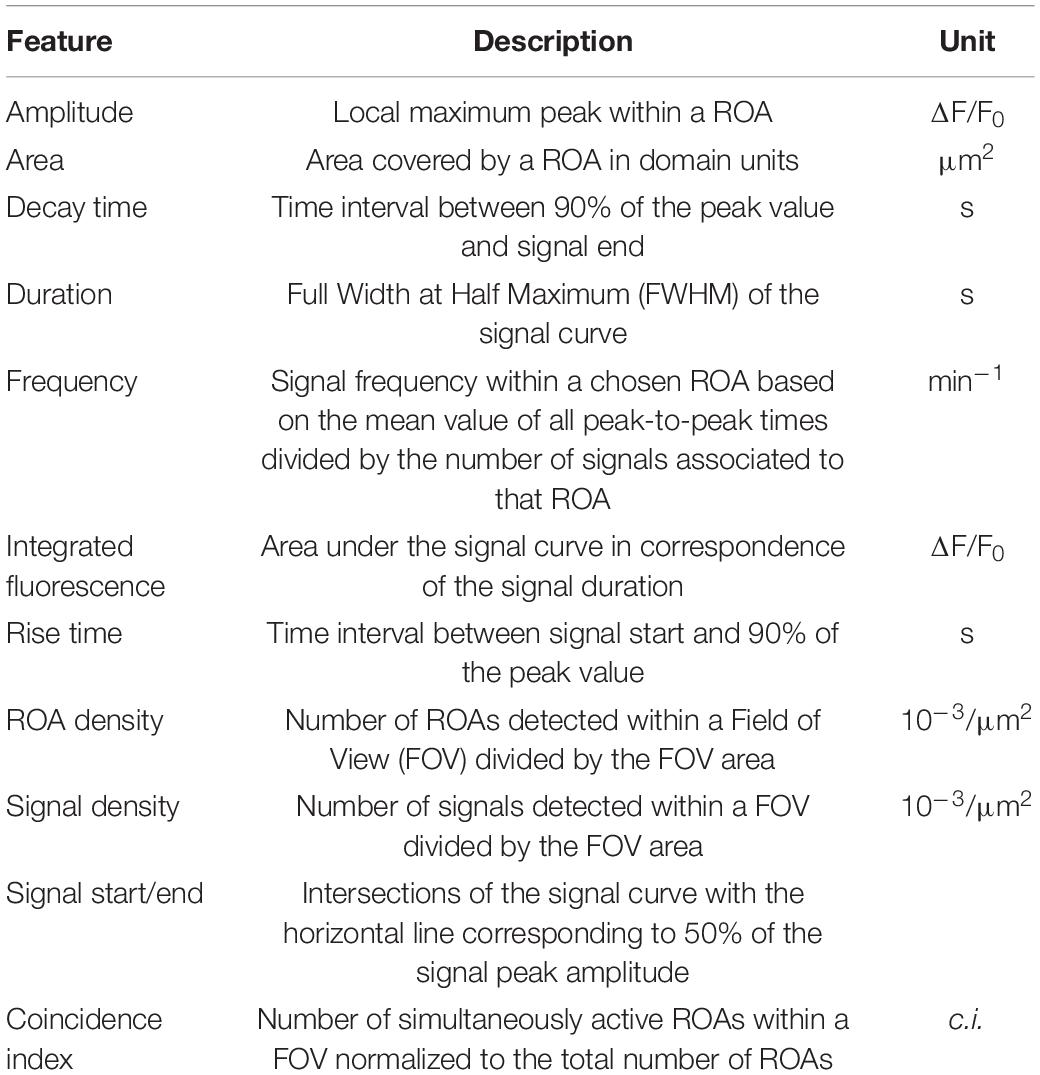
Table 1. Description of parameters used for Ca2+ characterization.
Immunohistochemistry
Anesthetized animals were transcardially perfused with phosphate-buffered saline (PBS) and tissue was fixed by 4% formaldehyde perfusion. After 24 h post fixation in 4% formaldehyde, T13-L1 spinal cord segments were dissected and detached from meninges. The spinal cord tissue was maintained in PBS and cut in transversal or longitudinal sections (40 μm) by vibratome (VT1000 S) (Leica, Nußloch, Germany). Free floating slices were processed for immunohistochemistry (IHC) as described before (Huang et al., 2020). Briefly, incubation in blocking solution (Triton X-100, horse serum and PBS) at RT was followed by primary antibody solution incubation overnight at 4°C for detection of the following glial markers: monoclonal mouse: anti-GFAP (1:500, Novacostra, NCL-GFAP-GA5), anti-GFP (1:500, Abcam, ab1218), polyclonal goat: anti-GFAP (1:1,000, Abcam, ab53554), anti-Iba1 (1:1,000, Abcam, ab5076), polyclonal rabbit: anti-GFP (1:1,000, Clontech, 632593), anti-Iba1 (1:1,000, Wako, 019-19741). Detection of the secondary antibodies (donkey anti-mouse, goat and rabbit secondary antibodies conjugated with Alexa488, Alexa555, Alexa633 and Alexa647; 1:2.000 in PBS; Invitrogen, Grand Island, NY, United States) was executed with the fully automated epifluorescence slide scanner microscope AxioScan.Z1 using the Colibri 7 LED system and appropriate filters (Zeiss, Oberkochen, Germany). Image stacks (5 μm, variance projection) were recorded and analyzed with ZEN blue (Zeiss, Oberkochen, Germany).
Software
For 2P-LSM acquisition, the open-source MATLAB-based software application ScanImage® (Vidrio Technologies, Ashburn, VA, United States) (Pologruto et al., 2003) was used. The custom-made MATLAB-based software MSparkles, GraphPad Prism 8 and Microsoft Office Excel 2016 were used for data analysis. Immunohistochemical data were visualized and modified using the ZEN blue imaging software (Zeiss, Oberkochen, Germany) and the ImageJ collection Fiji. For figure layout, the Adobe Creative Suite 2021 was used (Adobe InDesign®, Adobe Illustrator®, Adobe Photoshop®).
Unsupervised Clustering Analysis
Clustering analysis was performed using MSparkles output as medians of all signals at Field of View (FOV) level. The data was imported into R Studio R Studio Team (2020). RStudio: Integrated Development for R. RStudio, PBC, Boston, MA URL1. Heatmaps of scaled values were generated using the R package pheatmap()2.
Statistics
Unless otherwise stated, data are represented as mean ± SEM of single FOVs. Single datasets were analyzed using a Shapiro–Wilk normality test and represented as FOV medians. Data were compared using an ordinary one-way ANOVA with Bonferroni’s multiple comparisons test. Non-linear fitting of the data was performed using a Least-Squares fitting with no weighting method and compared using the extra-sum-of-squares F test. F ratios and relative p-values of single curve comparisons are schematically represented as a polygonal diagram and gray-scaled color-coded. For paired comparisons, a Wilcoxon matched pairs signed rank test was used. For statistical analysis, following p-values were used: *p < 0.05; **p < 0.01; ***p < 0.001, ****p < 0.0001.
Ethics Statement
All animal experiments were performed at the University of Saarland, Center for Integrative Physiology and Molecular Medicine (CIPMM), in strict accordance with the recommendations to European and German guidelines for the welfare of experimental animals and approved by the “Landesamt für Gesundheit und Verbraucherschutz” of the state of Saarland (animal license number 34/2016, 36/2016, 03/2021 and 08/2021). For 2P-LSM N ≥ 4 animals were used for each ex vivo or in vivo experiment (total 20 animals), for immunohistochemical analysis 24 animals were used in total.
Results
Tamoxifen-Induced GCaMP3 Expression in Adult Spinal Cord Astro- and Microglia and Acquisition of Ca2+ Signals
In order to record astroglial and microglial Ca2+ variations, we took advantage of the inducible DNA recombinase CreERT2 to achieve time-controlled and cell type-specific expression of the genetically-encoded Ca2+indicator GCaMP3 (Paukert et al., 2014) in astroglia under the control of the human glial fibrillary acidic protein promoter (GFAP) and in C-X3-C motif chemokine receptor 1 (CX3CR1)-expressing microglia (Figure 1A; Hirrlinger et al., 2006; Yona et al., 2013). 10 weeks-old mice with C57BL6/N background were treated with tamoxifen (100 mg/kg body weight, i.p., three times, once per day) to induce the reporter expression in astroglia (for simplicity we will refer to these animals as hGFAPGCaMP3 mice) and microglia (CX3CR1GCaMP3 mice, Figure 1B). The cellular specificity of the recombination in both gray (gm) and white matter (wm) of the lumbar spinal cord was confirmed by immunohistochemistry and colocalization with GFAP (Figures 1C,D) and Iba1 (Figures 1C,E) in longitudinal spinal cord slices. Astroglia displayed the typical protoplasmic and fibrous morphology in gm and wm, with high recombination efficiencies (78% in gm and 87% in wm for GFAP+ cells). On the other hand, microglial population appeared morphologically homogeneous throughout the tissue with 99% recombination efficiency in gm and wm for Iba1+ cells. To visualize Ca2+ changes, 12 weeks-old animals were sacrificed for acute slice preparation and ex vivo two-photon laser-scanning microscopy (2P-LSM). Alternatively, they underwent a laminectomy surgery (T13 and L1 vertebrae) in order to expose the spinal cord segments L5 and L6 for chronic in vivo 2P-LSM one (d1), two (d2) and 7 days (d7) after surgery (Supplementary Figures 1A,B). The absence of an excessive and abnormal cellular reaction after spinal cord surgery was monitored by immunohistochemistry of GFAP and Iba1 in both hGFAPGCaMP3 and CX3CR1GCaMP3 mice at each time point of investigation (Supplementary Figure 1C).
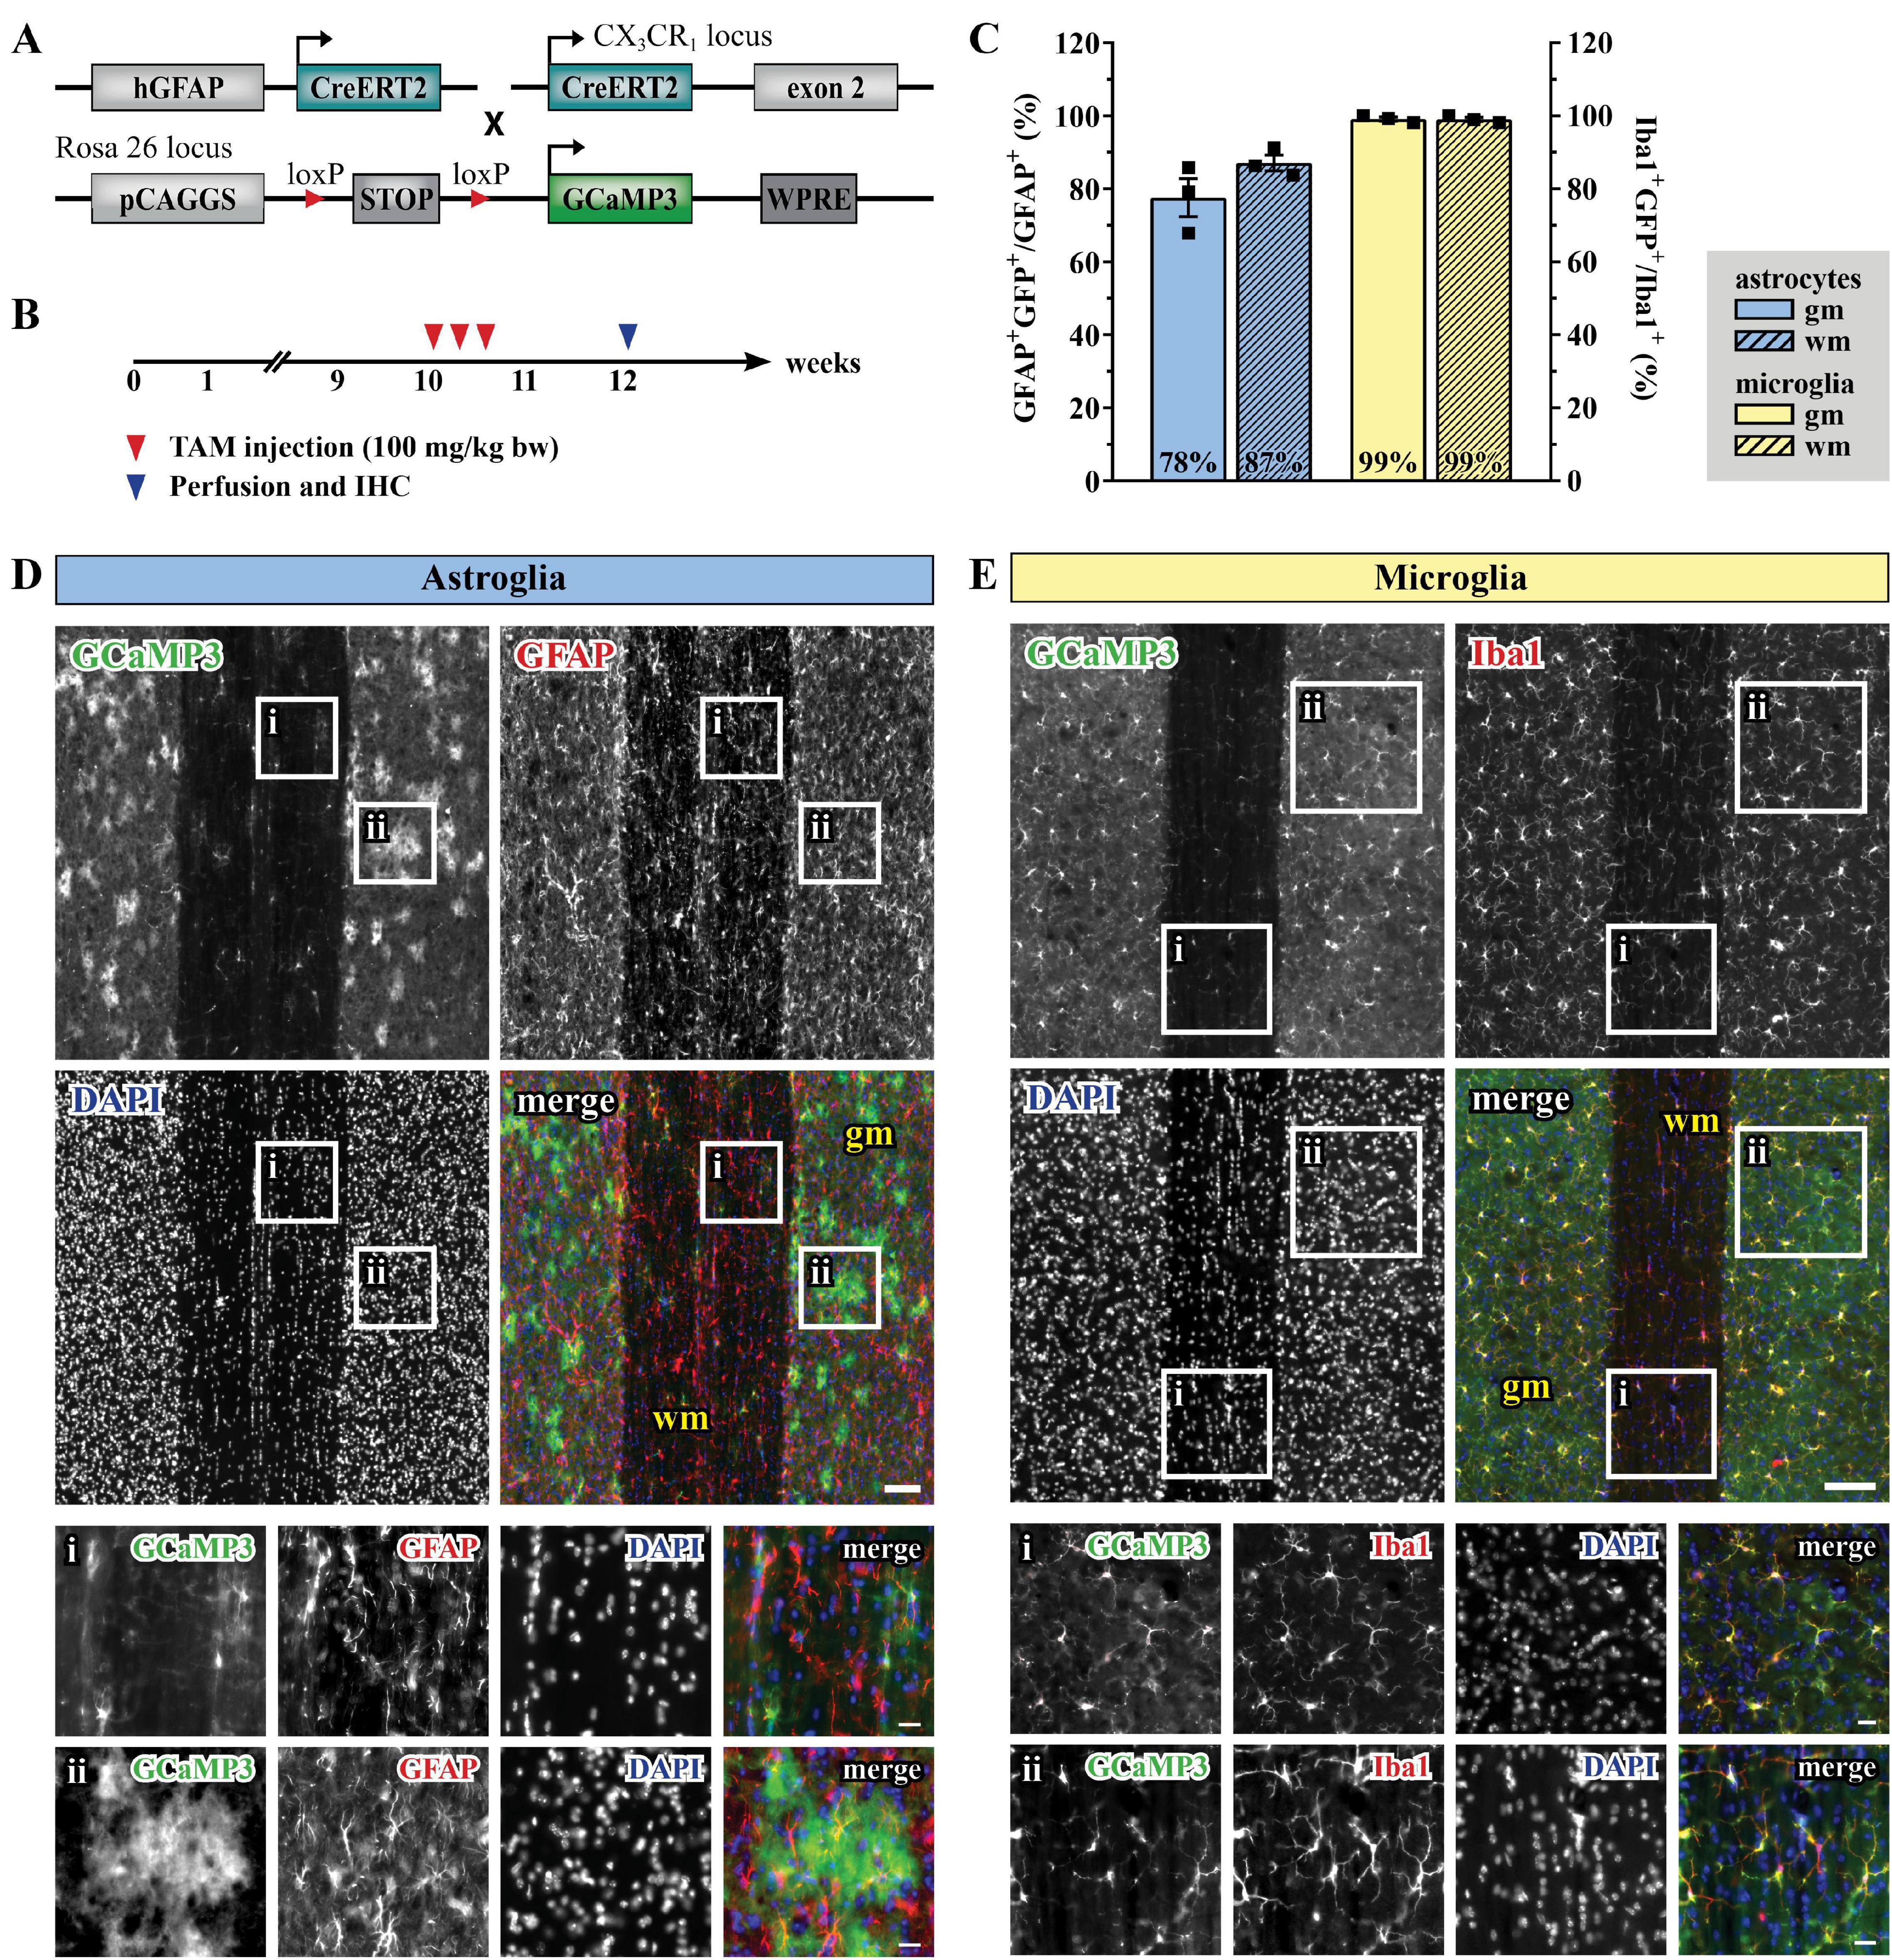
Figure 1. Tamoxifen- induced GCaMP3 expression in astrocytes and microglia. (A) Scheme of transgenic constructs carrying CreERT2 and GCaMP3. (B) Experimental design for the GCaMP3 induction in 10-weeks old mice injected with TAM (tamoxifen). (C) Recombination efficiency for hGFAPGCaMP3 (blue, left Y-axis) and CX3CR1GCaMP3 animals (yellow, right Y-axis) in gray (gm; solid) and white matter (wm, dashed), respectively. (D) Evaluation of longitudinal spinal cord slices for cell-specific GCaMP3 (green) expression in astroglia (GFAP, red) and (E) microglia (Iba1, red) with nucleic staining (DAPI, blue). Neither Iba1+GCaMP3+ nor GFAP+ GCaMP3+ cells were detected in the hGFAPCreERT2 or CX3CR1-CreERT2 animals, respectively. (Di,Ei) wm, magnified view; (Dii,Eii) gm, magnified view. Scale bar, 100 μm (overviews) and 20 μm (magnified views).
Astroglial Ca2+ Signals Appear at Higher Densities Than Microglia in Acute Slice Preparations
Acute longitudinal slice preparations enabled access to both gm and wm of the spinal cord. In this work, we recorded glial Ca2+ signals from the dorsal wm and the dorsal horn gm and compared them with in vivo data collected in the dorsal spinal cord. Astro- and microglial Ca2+ data were processed and analyzed using the MATLAB-based analysis software MSparkles (Table 1 and see section “Materials and Methods” for details), which performed automatic and unbiased detection of regions of activity (ROAs) based on the range projection of ΔF/F0 and a temporal correlation based region detection algorithm. This approach enabled the detection of stationary ROAs associated with time-dependent fluorescence fluctuations, in contrast to other approaches based on dynamic events with different occurrence, extension and location over time (Cornell-Bell et al., 1990; Jung et al., 1998; Wu et al., 2014; Semyanov et al., 2020). For simplification and a comparison at a glance we collected all numeric values in Table 2. Throughout this work we will focus on the parameters that enable a clearer segregation of glial Ca2+ signals, namely signal and ROA density, ROA area, signal frequency and coincidence (in bold in Table 2).
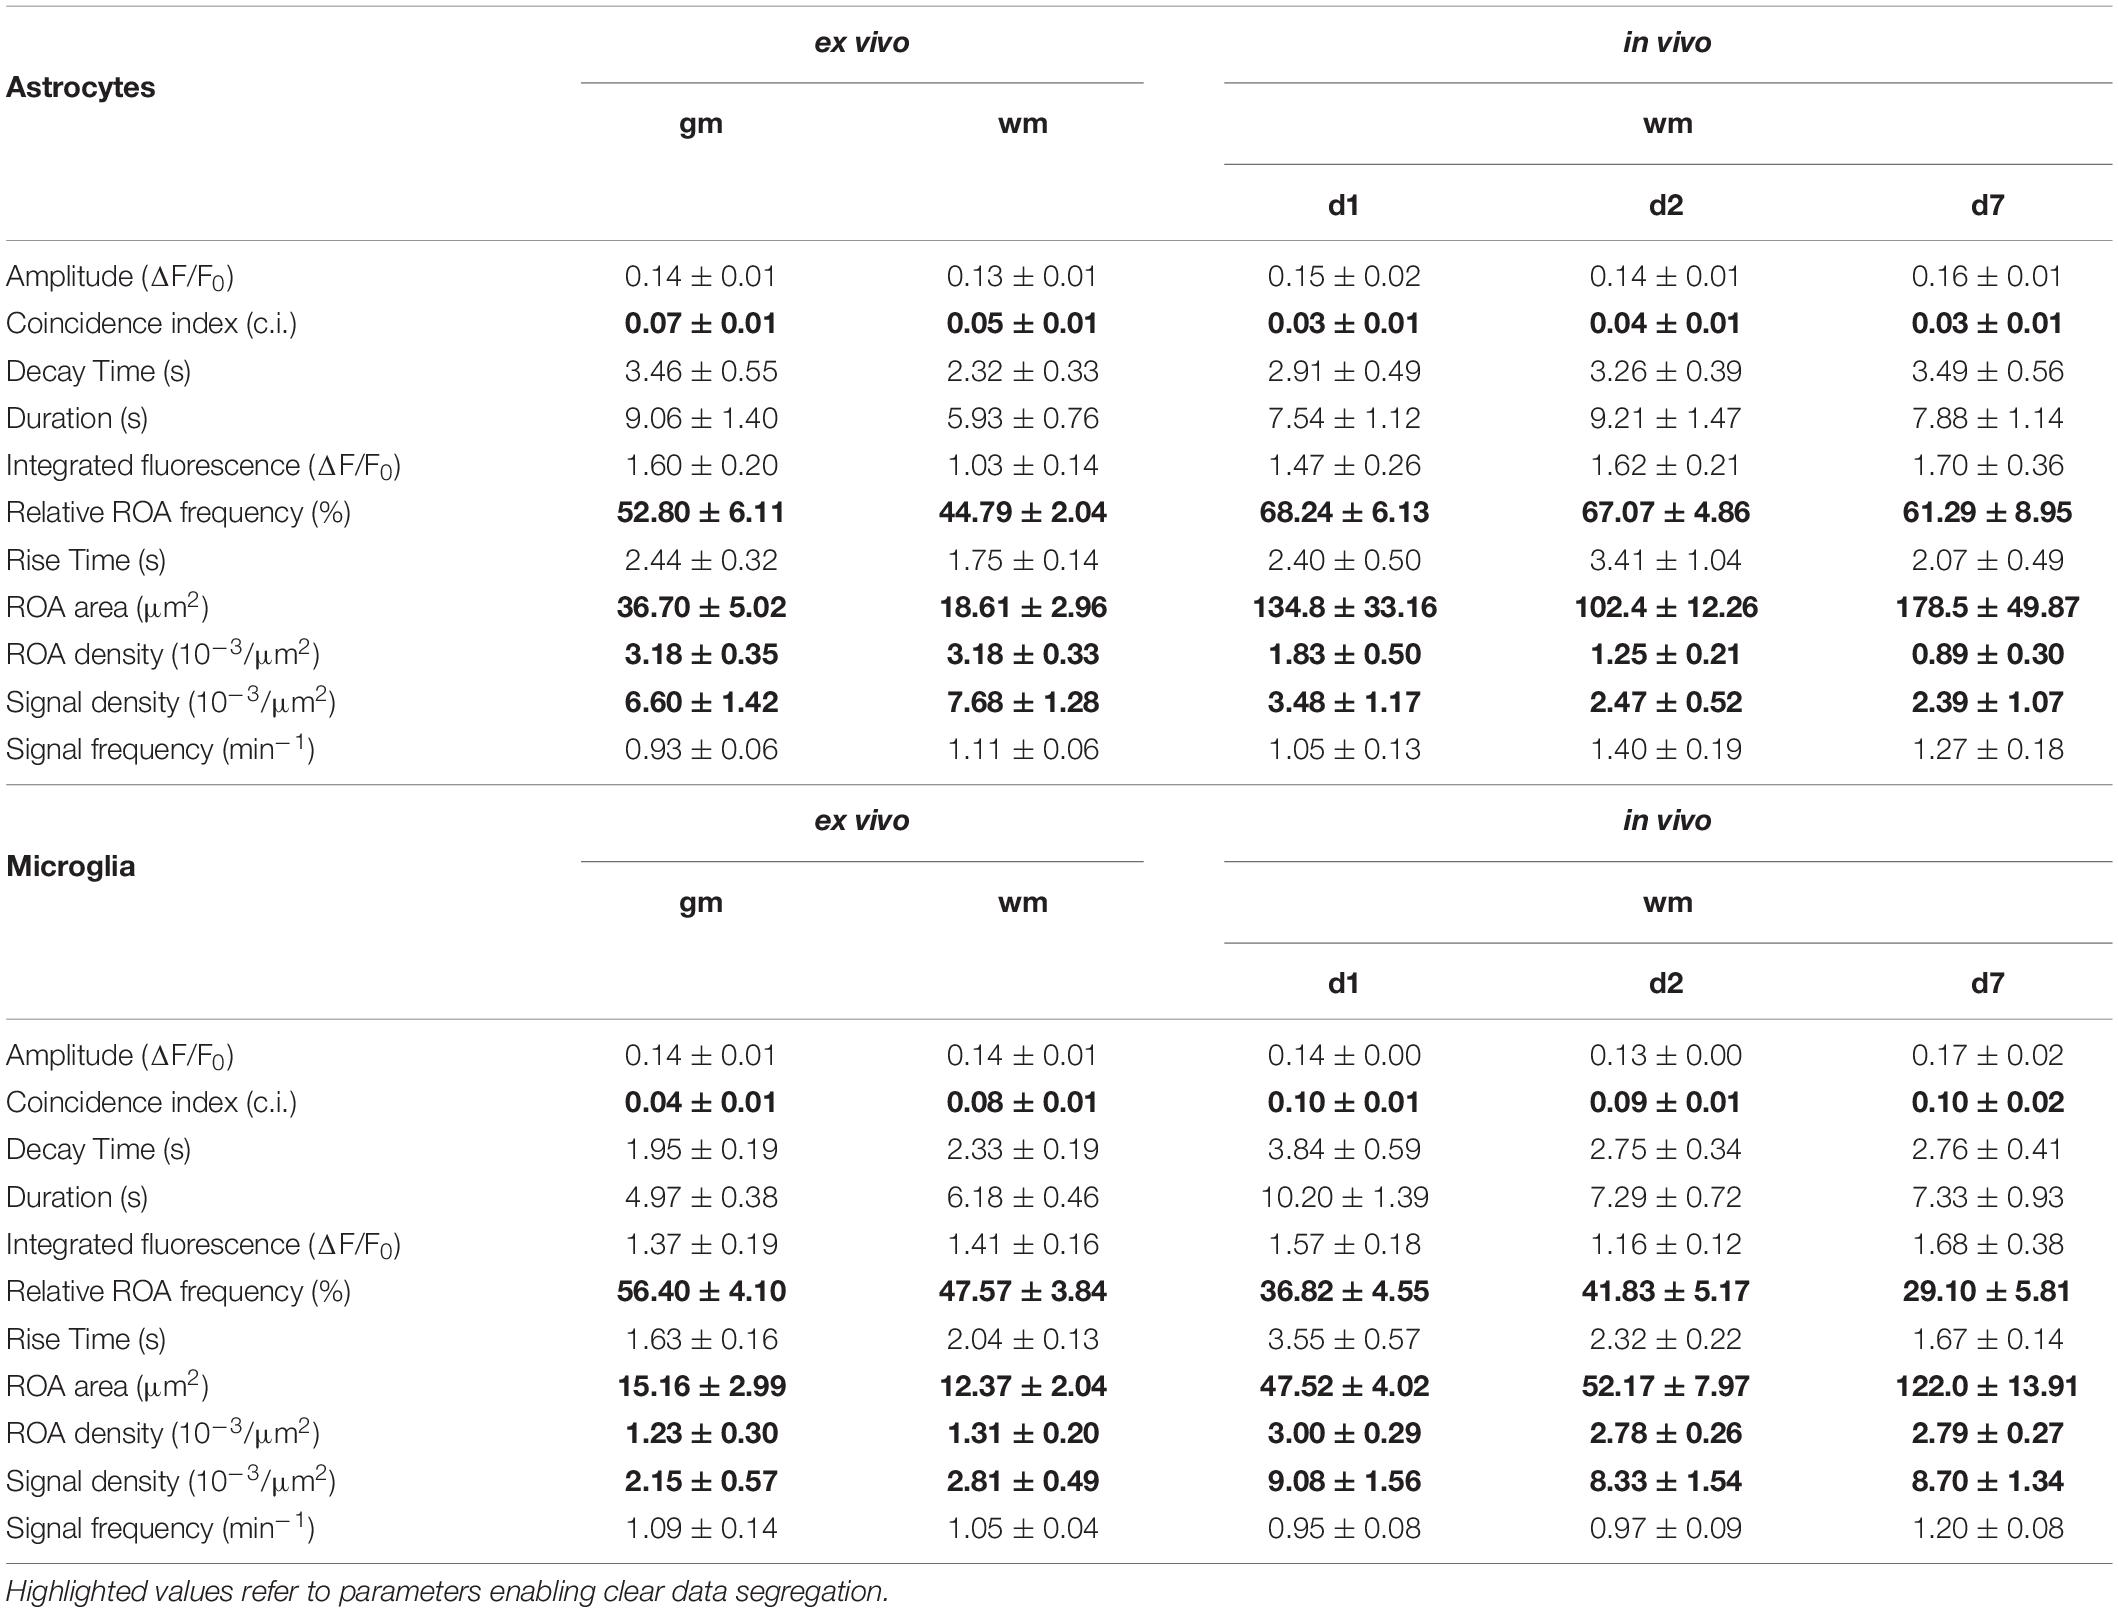
Table 2. Numeric values of Ca2+ data in terms of morphology, spatial and temporal distribution (mean ± SEM).
Ex vivo astroglial Ca2+ imaging confirmed the morphological differences between gm and wm astrocytes observed in fixed tissue preparations and the expression of GCaMP3 in the entire cellular cytoplasm (Figures 2A,C and Supplementary Videos 1, 2). Although similar between wm and gm, microglia exhibited morphological changes typical of their reactive phenotype with shorter and thicker processes and in some cases even an amoeboid cell body (Figures 2B,D and Supplementary Videos 3, 4). Notably, the majority of microglia shared this phenotype irrespective of the imaging depth. Both gm and wm astrocytes displayed highly dynamic Ca2+ oscillations mainly restricted to the gliapil but occasionally involving the somatic compartment, whereas microglia were mostly silent or displayed changes at a lower frequency and were often restricted to single branches. In line with this, the automatic ROA detection analysis revealed different signal density (10–3/μm2) between astroglia and microglia in both gm (p < 0.01) and wm (p < 0.001) with a ∼3-fold increase in signal density in astroglia compared to microglia (Figures 3A–C). No difference was detected within each cell-type between gm and wm. In parallel to that, both astroglia and microglia did not display any difference in ROA density (10–3/μm2) between gm and wm, whereas in both regions astroglia showed a ∼2.5-fold increase in ROA density (gm: p < 0.001; wm: p < 0.0001; Figure 3D). A closer look at the signal distribution among the detected ROAs revealed that around half of the ROAs were active only once during the recording time, irrespectively of the total number of active ROAs (Figure 3E). Also, the signal frequency for ROAs associated with more than one signal did not differ between regions and cell types and ranged between ∼0.50 and ∼1.50 min–1 for astroglia and ∼0.6 and ∼2.5 min–1 for microglia (Table 2).
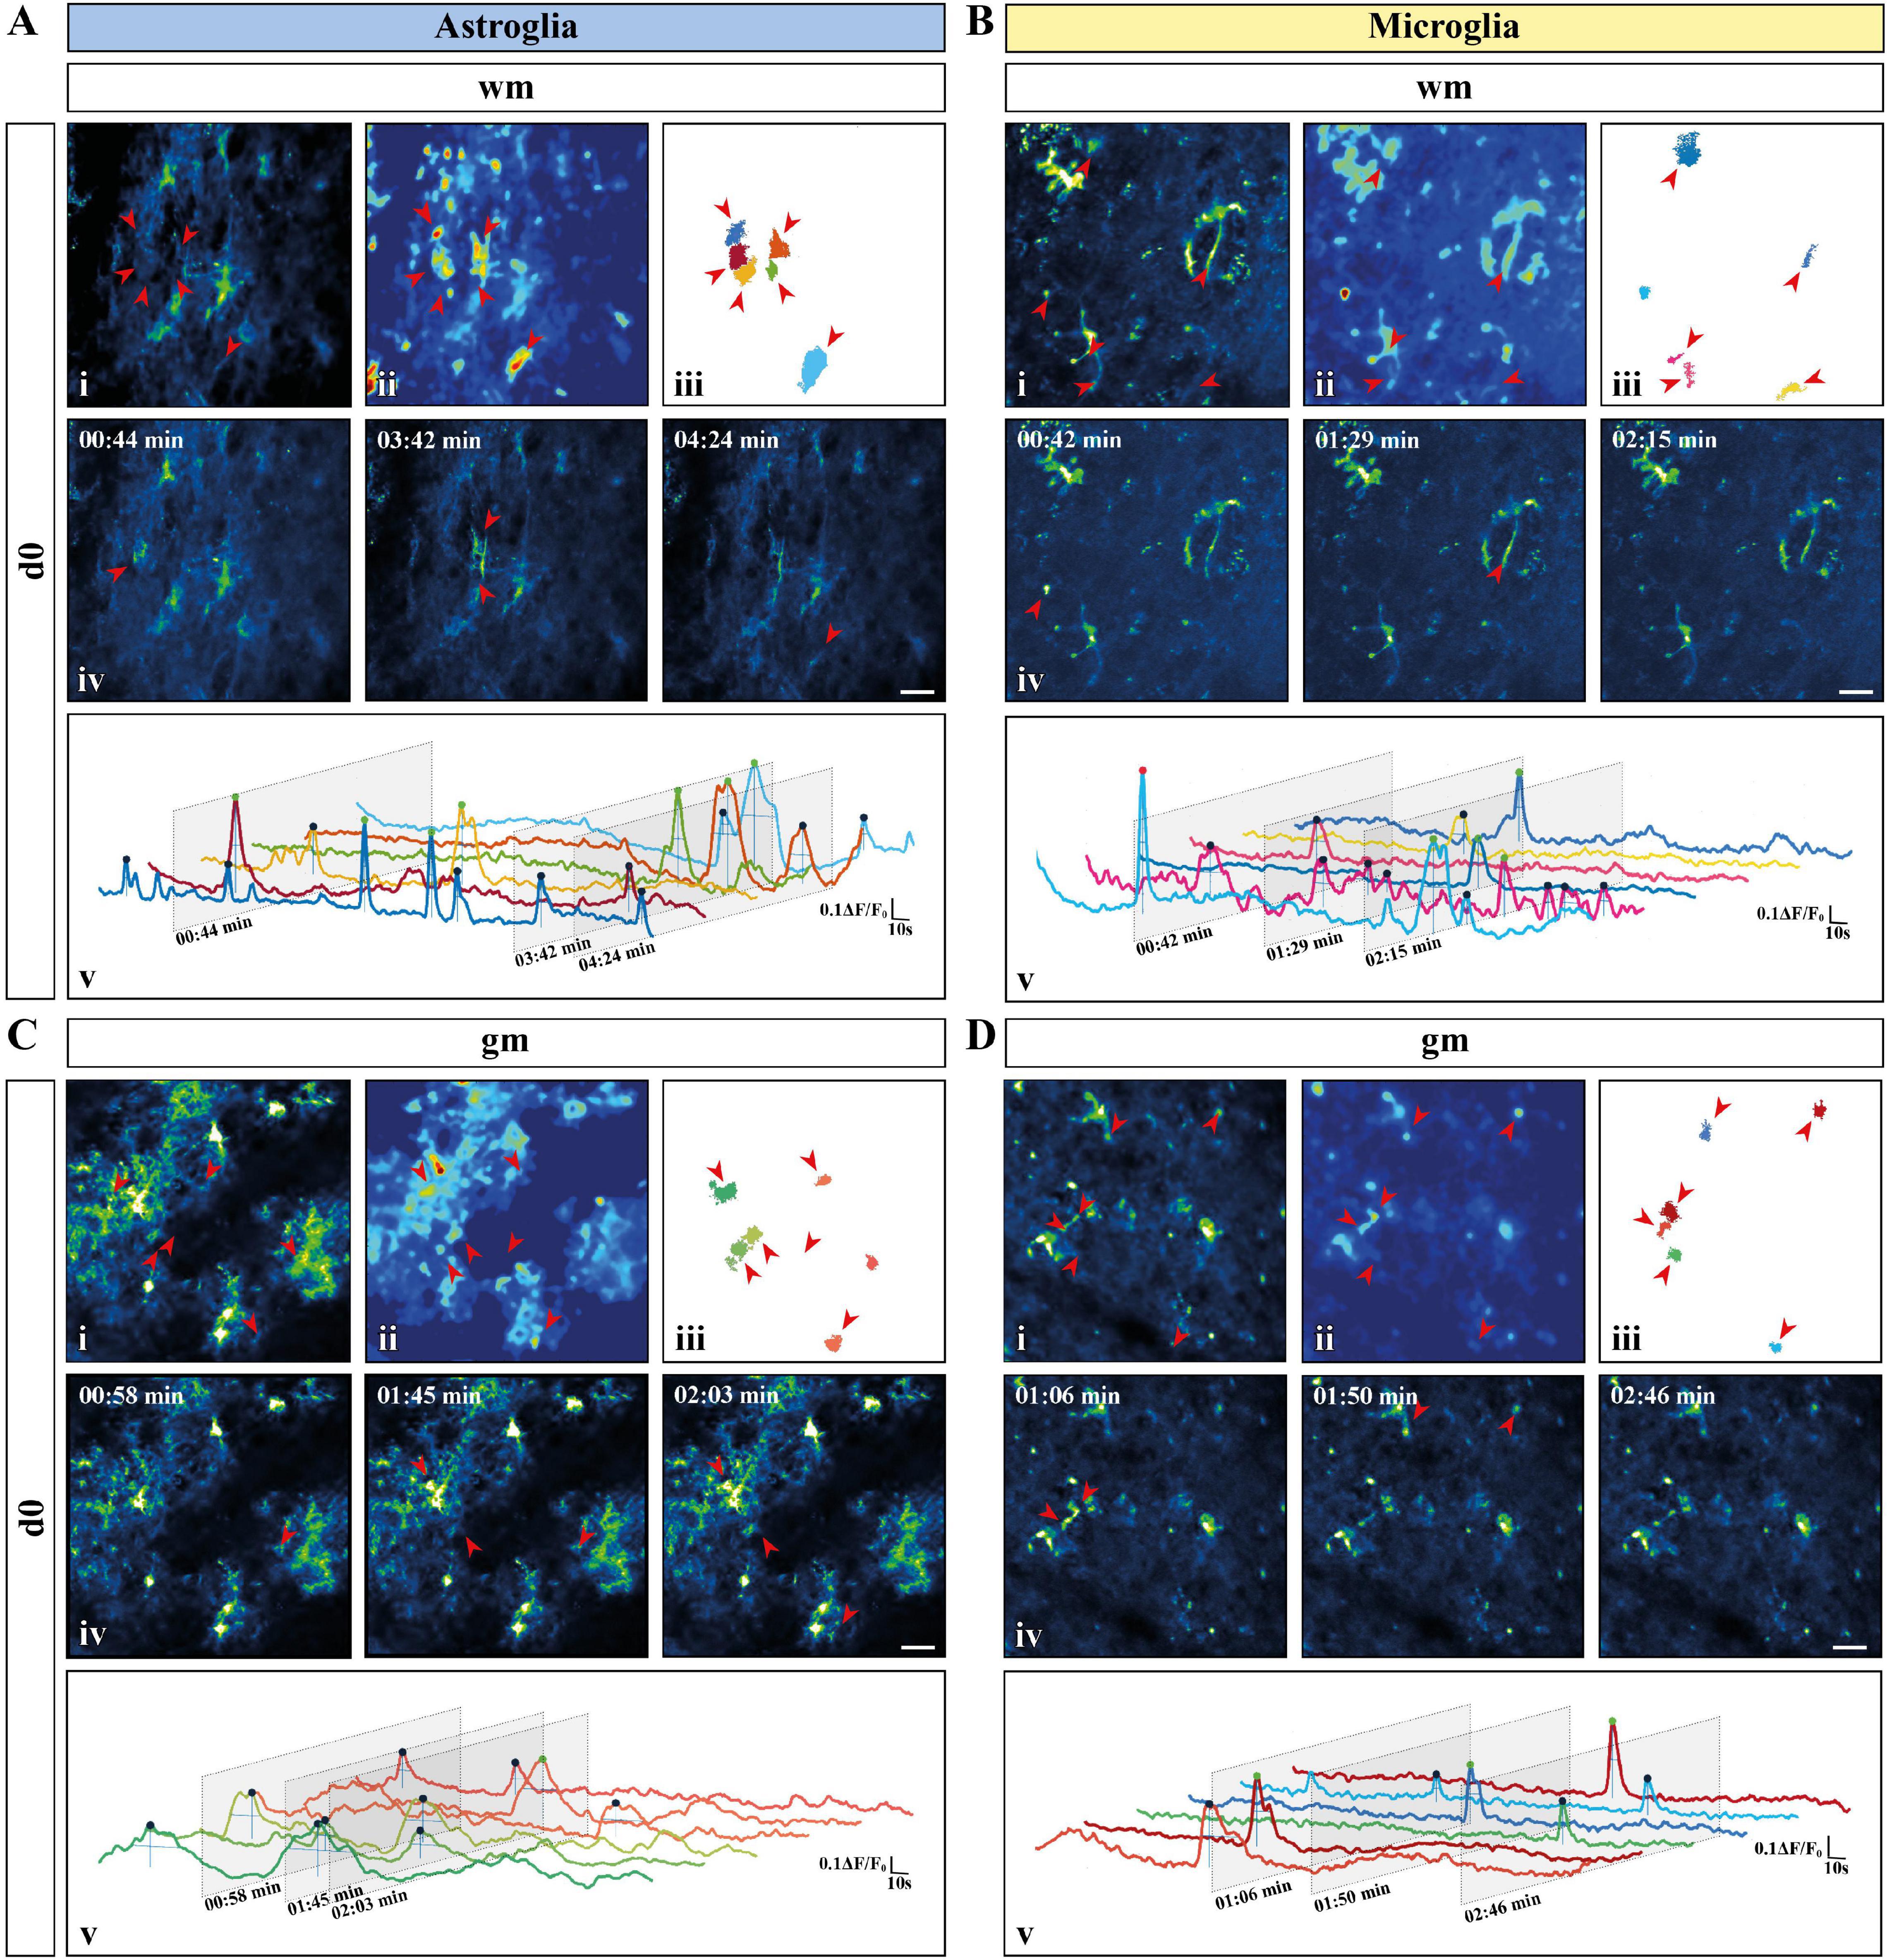
Figure 2. Activity-based Ca2+ signaling analysis for astroglia and microglia from acute preparations. (A–D) Representative Ca2+ signaling analysis for astroglia [(A) white matter (wm); (C) gray matter (gm)] and microglia [(B) wm; (D) gm] in acute slice preparations using the custom-made MATLAB-based software MSparkles. Maximum-intensity projection of the GCaMP3 signal for representative Fields of View [FOV; scale bar, 20 μm; (i)] over the entire recording time (up to 5 min), absolute intensity projection (ii) and selected regions of activity [ROAs; (iii)] automatically detected using variations in absolute intensity. Red arrows indicate the locations of selected ROAs. Representative time frames from the selected recordings [scale bar, 20 μm; (iv)] with red arrows indicating location of the selected ROAs if active in the displayed time frame. Normalized relative fluorescence intensity traces over time (ΔF/F0) for the selected ROAs (v) with trace colors matching colors of the selected ROAs. Oblique sections indicate time points chosen for display. Automatically detected signals were pinpointed and color coded based on signal strength (μ + σ ≤ ΔF/F0 ≤ μ + 2σ, blue; μ + 2σ < ΔF/F0 ≤ μ + 3σ, green; ΔF/F0 > μ + 3σ, red) calculated on the mean value (μ) and the corresponding standard deviation (σ) over all ROAs.
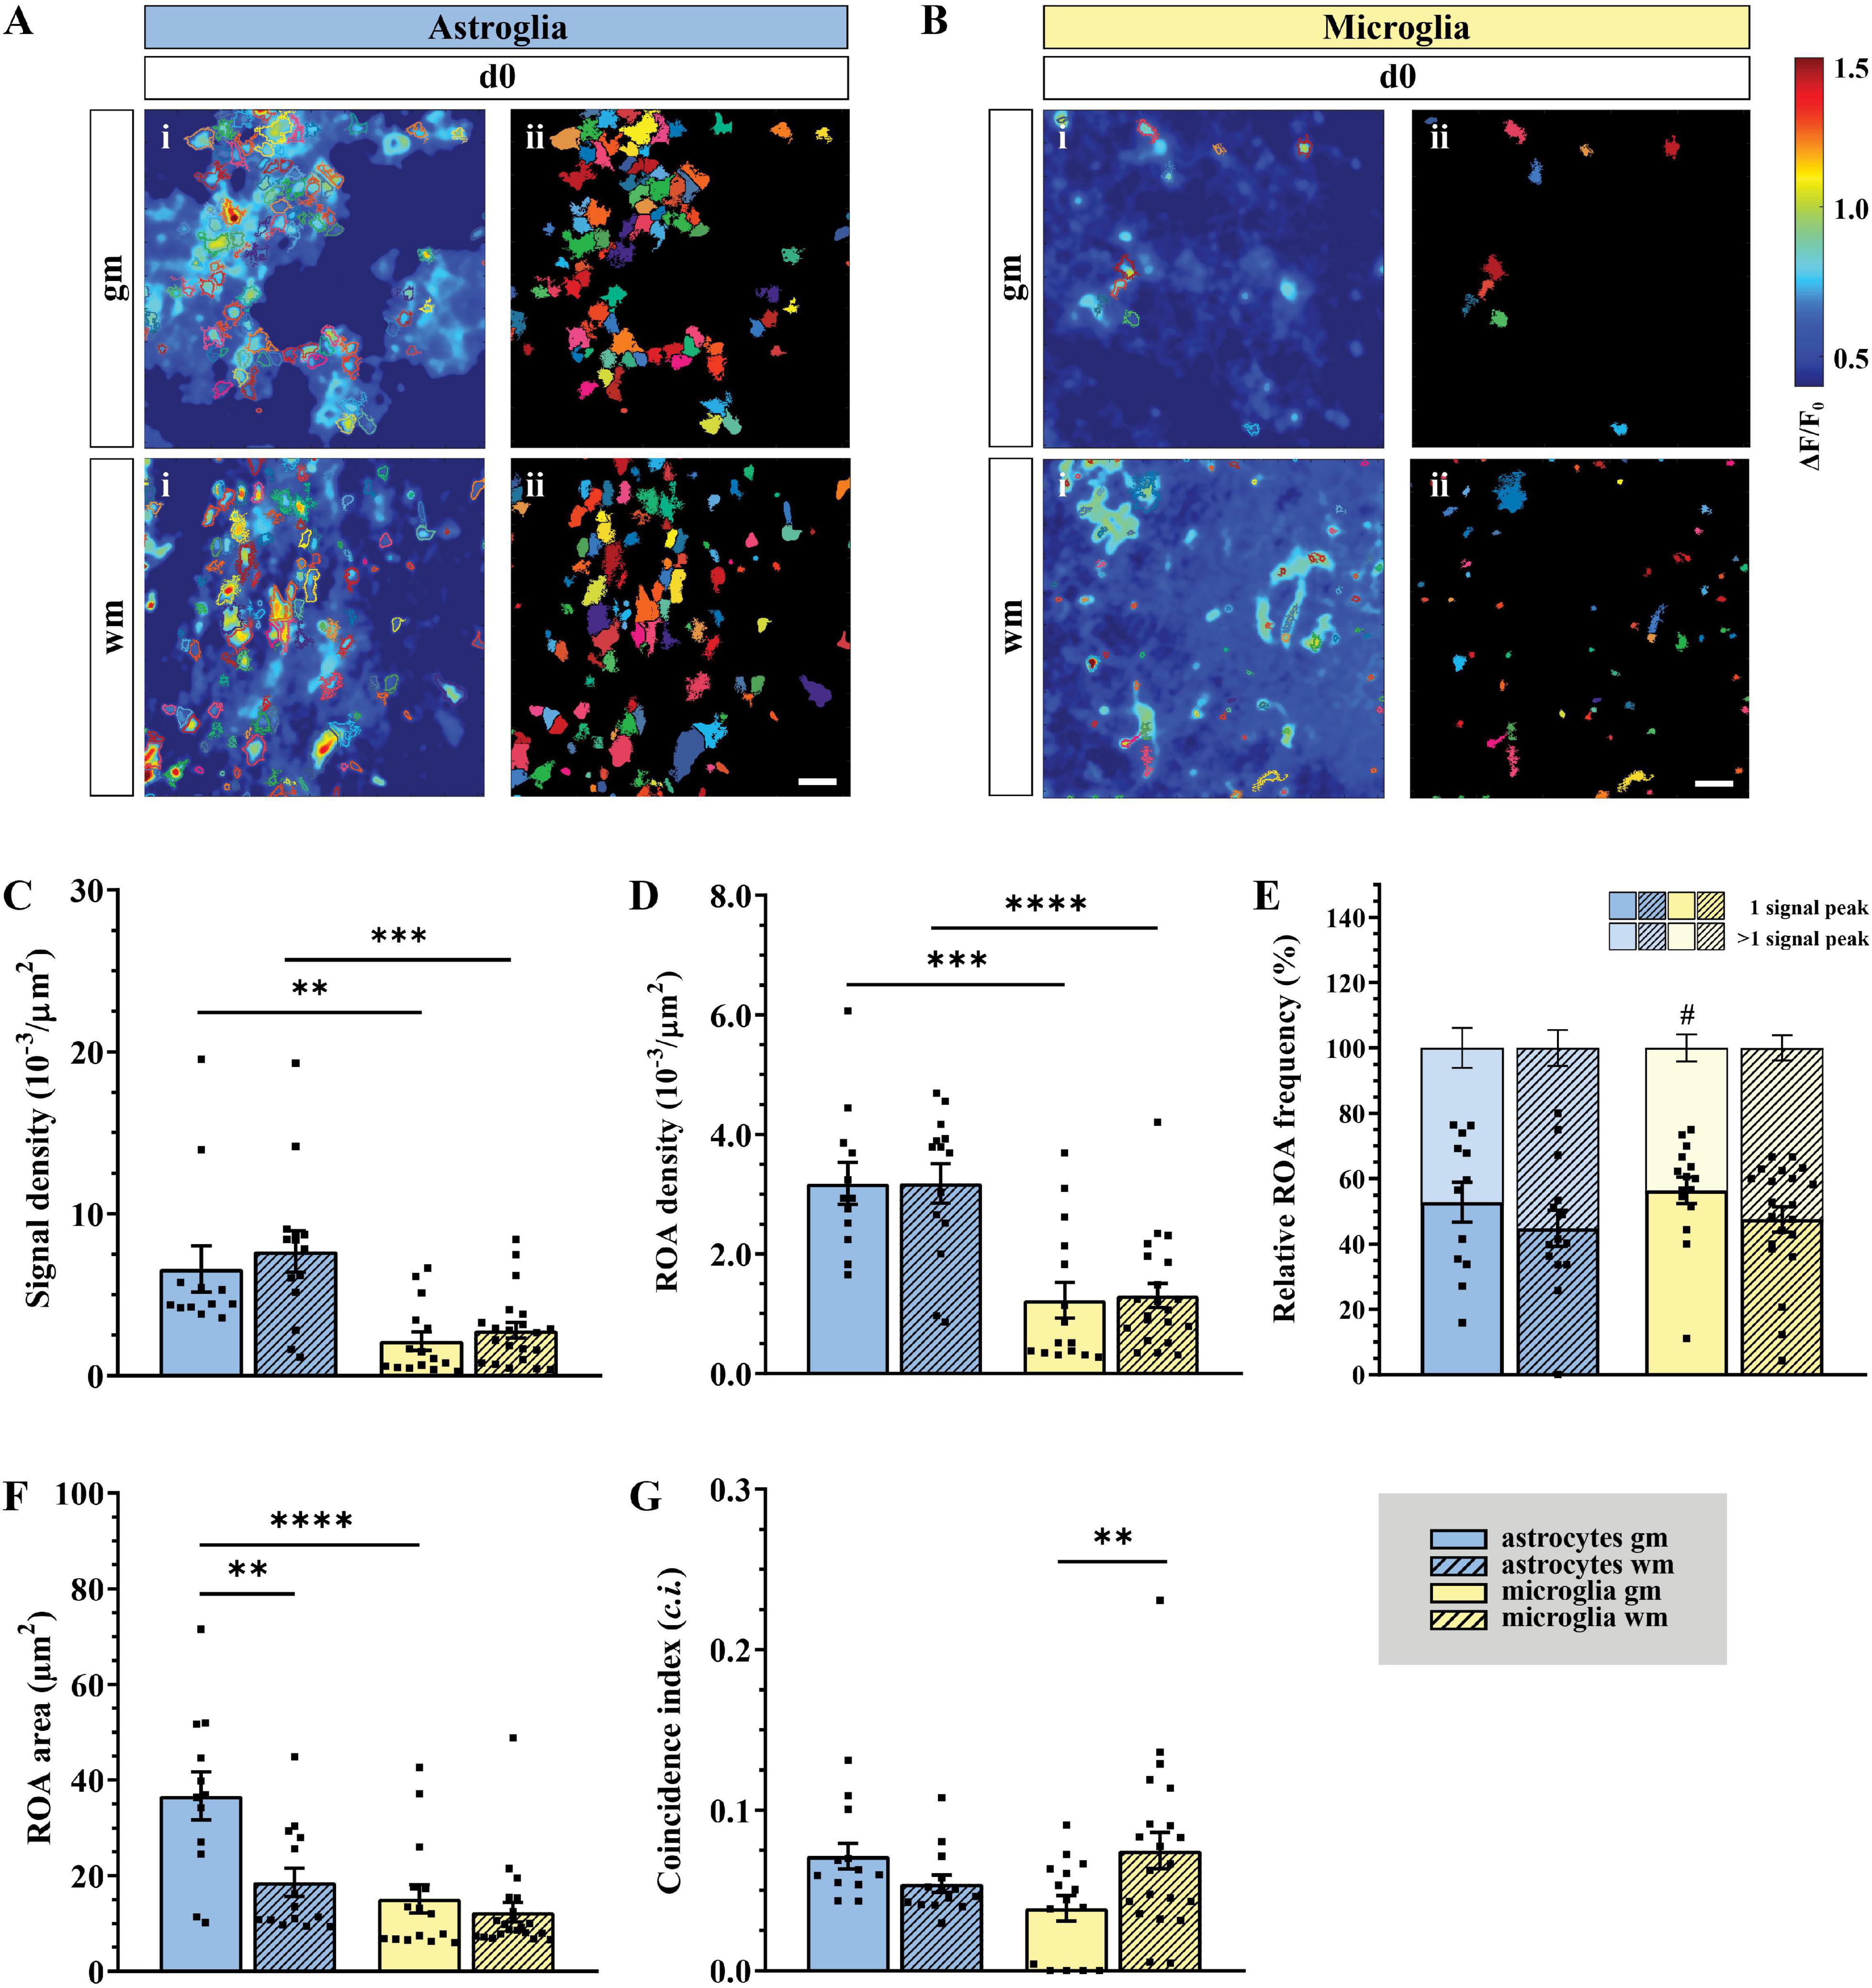
Figure 3. Higher astroglial signal and ROA density in gray and white matter of acute slice preparations (ex vivo). (A,B) Automatic analysis of detected regions of activity (ROAs) based on absolute fluorescence projection along the temporal axis for astroglia [(A) blue] and microglia [(B) yellow] in gm and wm of acute slice preparations (d0) with absolute fluorescence projections (i) overlapped with the edges of the detected ROAs [depicted as solid areas in panel (ii)]. (C) Signal and (D) ROA density in gm (solid) and wm (dashed). (E) Relative frequency of ROAs active once (lower bars) or more than once (upper bars) over the recording time. (F) ROA area and (G) mean relative number of simultaneously active ROAs over the total recording time calculated as coincidence index (c.i.). Data represented as mean ± SEM of single FOVs. Single datasets were analyzed using a Shapiro–Wilk normality test and represented as FOV medians. (C–G) Data were compared using an Ordinary one-way ANOVA with Bonferroni’s multiple comparisons test. For each group in panel (E), the relative numbers of ROAs presenting one or more signal peaks were analyzed using a Wilcoxon matched pairs signed rank test. N (animals) = 4 (astroglia), 5 (microglia, gm), 6 (microglia, wm). n (FOVs) = 12 (astroglia, gm), 14 (astroglia, wm), 15 (microglia, gm), 22 (microglia, wm)., #p < 0.05; **p < 0.01; ***p < 0.001; ****p < 0.0001.
In terms of the signal most obvious kinetic properties, namely the amplitude at their maximum peak (ΔF/F0) and the signal duration, defined as full-width at half maximum (FWHM), most astroglial and microglial signals displayed amplitudes ranging from ∼110 to ∼120% of the baseline fluorescence level with no difference between cell-types or regions. Astroglial Ca2+ signals lasted longer in gm than in wm (p < 0.05) as well as microglial gm signals (p < 0.01, Table 2). Additionally, we evaluated the distribution of the signal amplitudes and durations by sorting the signals according to their amplitude (Supplementary Figure 2A) or duration (Supplementary Figure 2B) and plotting their relative frequency. Next, we fitted the data with a lognormal distribution using a Least-Squares fitting and compared them using the extra-sum-of-squares F test. The relative frequency curve of the amplitudes of the Ca2+ changes recorded ex vivo was similar among different regions and between astroglia and microglia. With respect to the signal duration distribution, the oscillations of Ca2+ signals displayed higher variations between cell-types than between gm and wm (p < 0.0001). We also provide further analysis of the signal morphology in a two-dimensional space, namely the signal profile along the time axis, by evaluating the signal integrated fluorescence (ΔF/F0) as well as the rise and decay time (s) (Table 2). In line with the signal duration, astroglial gm changes displayed a higher integrated fluorescence as well as longer rise and decay times compared to astroglial signals in the wm, whereas microglial integrated fluorescence did not differ between the two regions.
In terms of spatial distribution of the Ca2+ elevations, microglial ROAs had the same area (μm2) in the dorsal gm and wm, whereas astroglial ROAs displayed a ∼2-fold increase in their extension in the gm (p < 0.01; Figure 3F). In line with this, the comparison of the relative frequency distributions of the ROA areas (Supplementary Figure 2C) confirmed that active astroglial ROAs in the gm were larger than in the wm (p < 0.0001) and microglial ROAs in the same region (p < 0.0001). Notably, microglia in the gm had a higher relative number of smaller ROAs compared to the wm (p < 0.0001). Finally, we analyzed the signals based on their coincident appearance and calculated the relative number of ROAs active at a given time point (coincidence index, c.i., Figure 3G). We found that astroglial Ca2+ changes were similarly active between gm and wm, whereas microglial changes were less coincident in gm (p < 0.05).
In vivo Microglial Ca2+ Changes Are Characterized by a Higher Density and Coincidence but Smaller Areas
To provide a comprehensive study of astroglial and microglial Ca2+ events in vivo we used chronic 2P-LSM of the dorsal spinal cord wm tracts and compared them with the Ca2+ dynamics recorded in acute wm slice preparations (ex vivo). Following chronic spinal cord window implantation, hGFAPGCaMP3 and CX3CR1GCaMP3 mice were analyzed in slightly anesthetized conditions (1.5% isoflurane, 66% O2 and 33% N2O) at three different time points (d1, d2, and d7, Figure 4 and Supplementary Figure 1A). The cytosolic GCaMP3 expression confirmed the absence of any obvious structural reactive phenotype as previously shown by immunohistochemistry (Figures 4, 5A and Supplementary Videos 5–10). The quantification of spontaneous Ca2+ events revealed higher signal densities (10–3/μm2) for wm microglia in vivo (d1: p < 0.001; d2: p < 0.01; d7: p < 0.01) compared to acute slice preparations (d0). In contrast to that, astrocytes showed lower signal numbers in vivo at d2 (p < 0.01) and d7 (p < 0.05) compared to ex vivo preparations (d0), and for each time point compared to microglia in vivo (p < 0.01) (Figures 5A–C). In line with this, we found that astrocytes displayed a ∼2-fold reduction in ROA density (10–3/μm2) in vivo (d1: p < 0.05; d2: p < 0.0001; d7: p < 0.0001) compared to ex vivo. Notably, the astroglial ROA density decreased over time from acute (d1) to the chronic phase (d7) in vivo. Contrarily, in vivo microglia (d1: p < 0.001; d2: p < 0.01; d7: p < 0.05) displayed a twofold increase in ROA density compared to ex vivo recordings as well as to astrocytes from d2 (d2: p < 0.0001; d7: p < 0.0001). This finding showed an opposite trend from the ex vivo slice preparations, where we found lower ROA density for microglia compared to astroglia (Figure 5D). When we looked at the relative number of ROAs (%) associated with either one or more peaks during the acquisition, we found, in contrast to their equal distribution in ex vivo recordings, an almost twofold higher percentage of ROAs with only one peak compared to the ROAs with more than one peak for astrocyte recordings in vivo. On the other hand, microglial Ca2+ signals displayed an opposite phenotype with a higher percentage of ROAs characterized by more than one peak (Figure 5E). The signal frequency (min–1) of the active ROAs (>1 signal peak) did not display any difference for in vivo or ex vivo recordings or between the cell-types (Table 2).
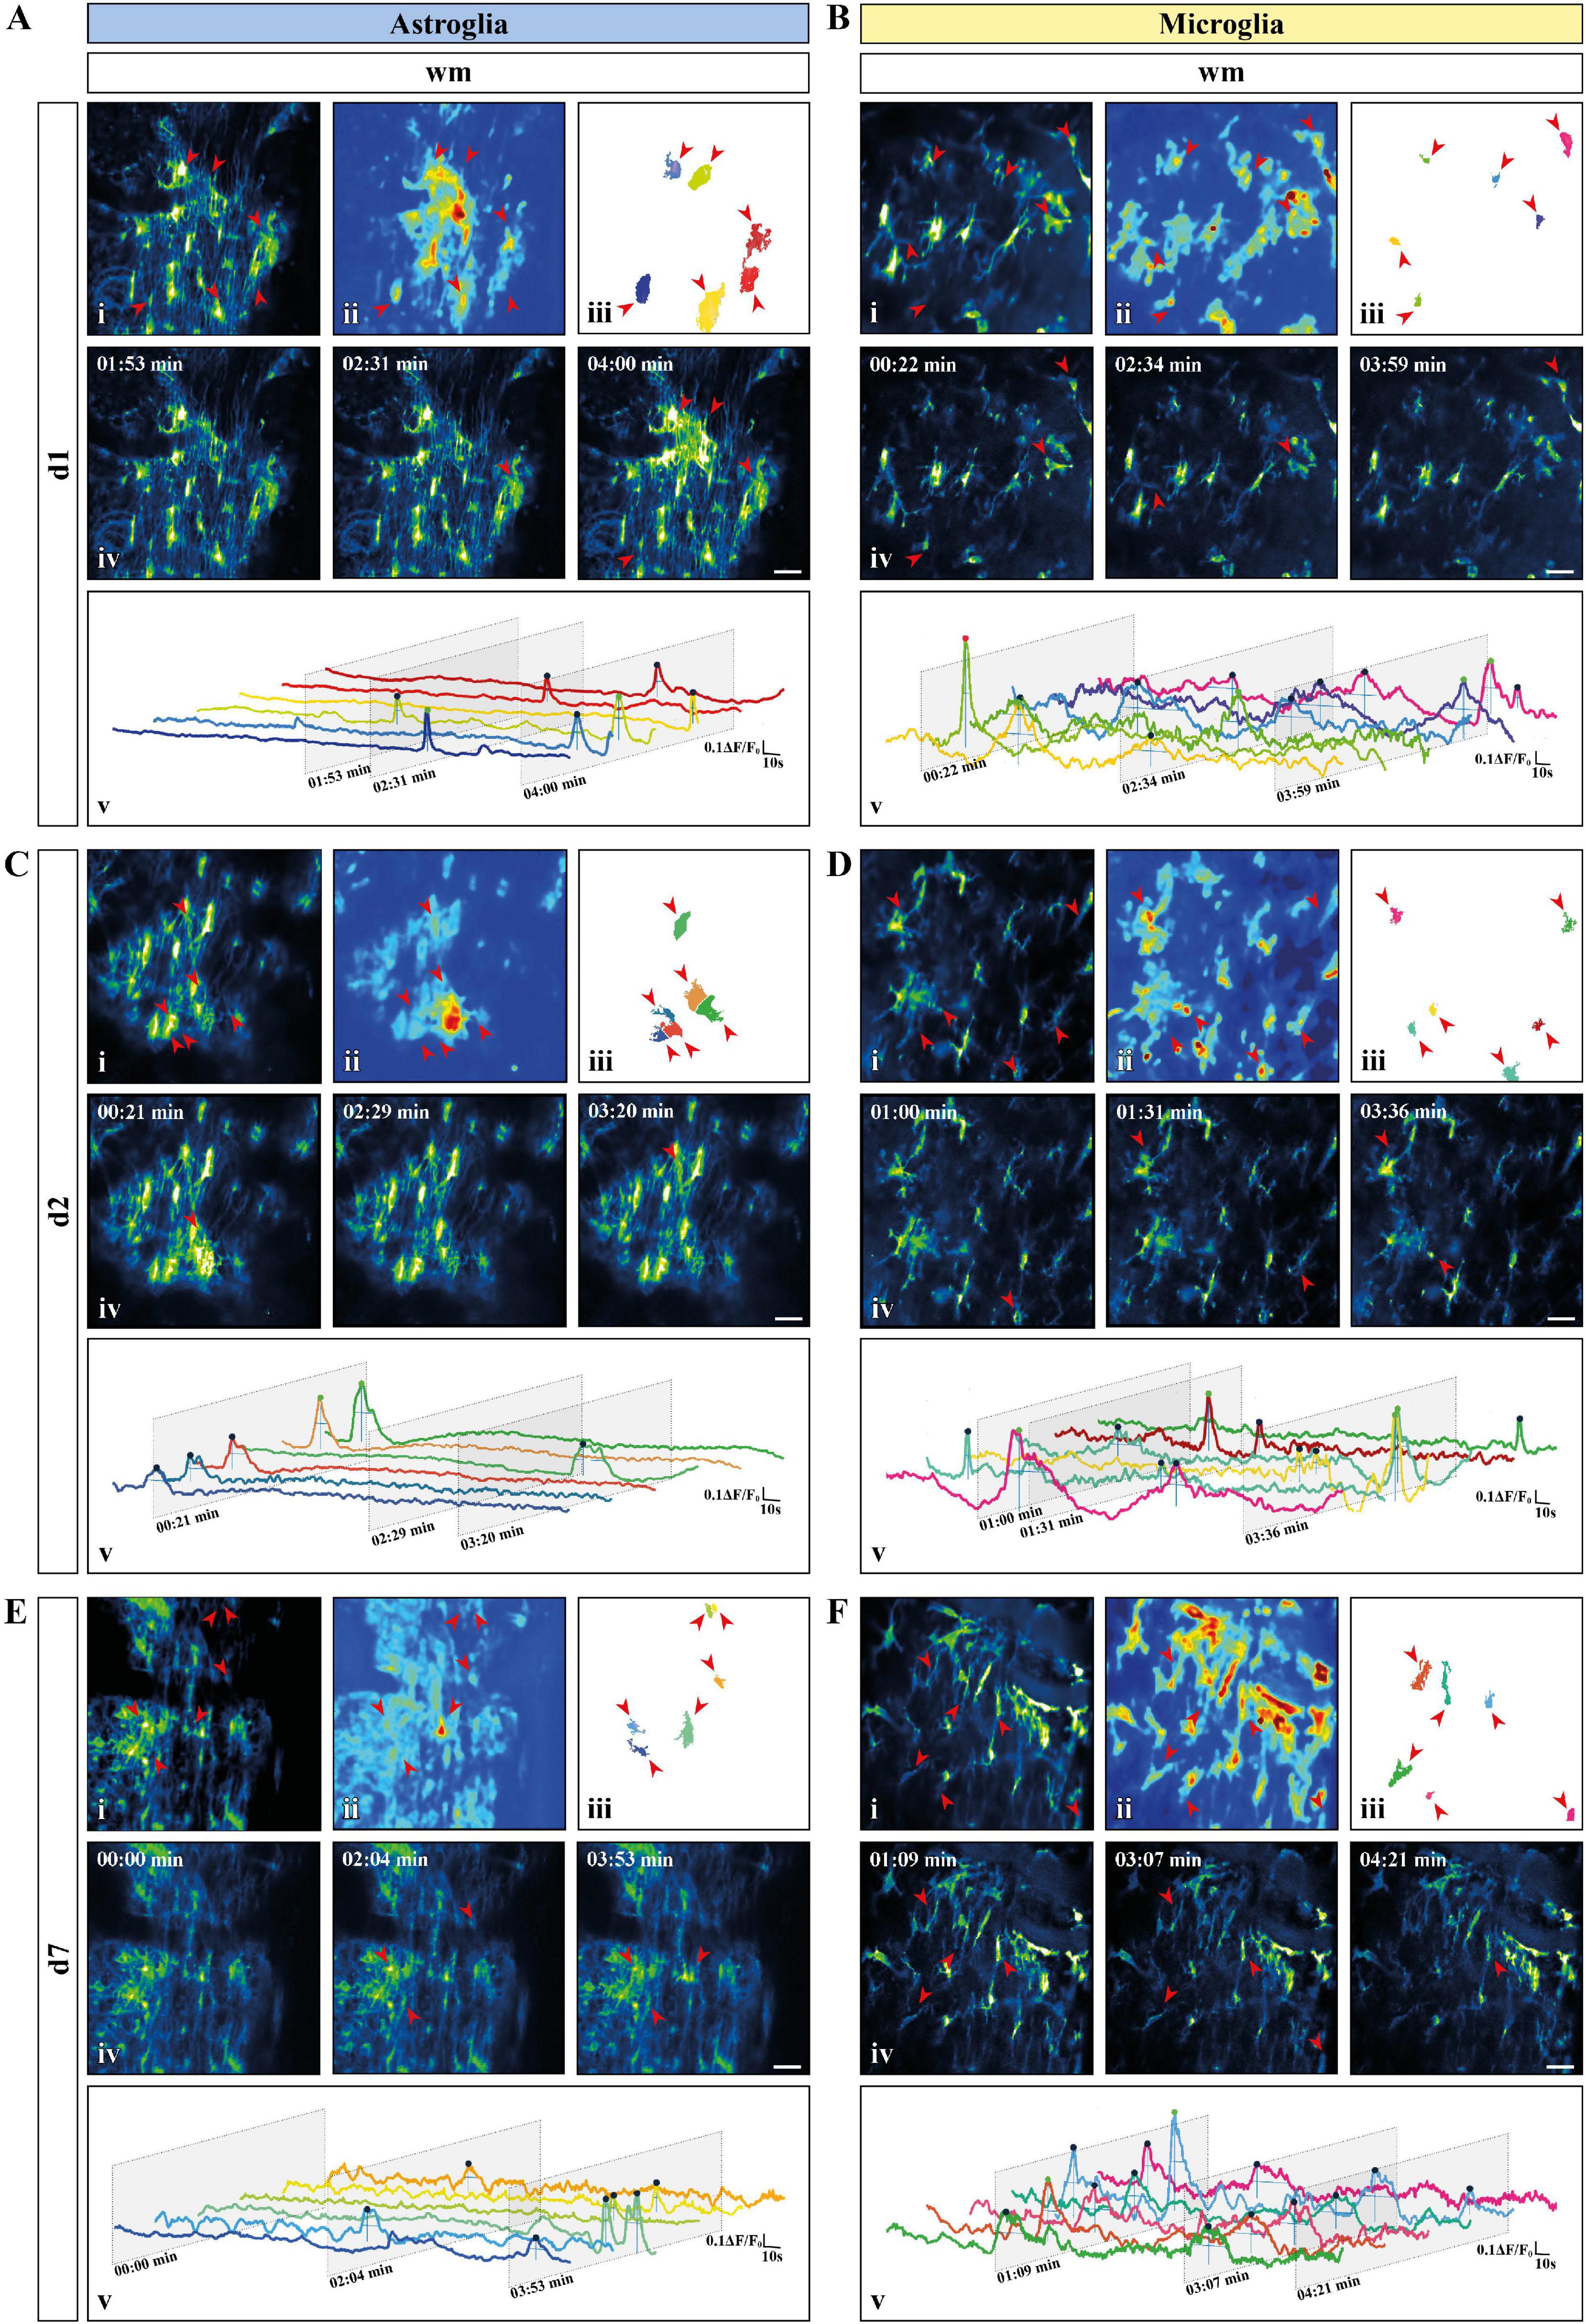
Figure 4. Activity-based in vivo Ca2+ signaling analysis for astro- and microglia after chronic window implantation. (A–F) Representative Ca2+ signaling analysis for (A,C,E) astroglia and (B,D,F) microglia monitored in vivo [(A,B) day one (d1); (C,D) day two (d2); (E,F) day 7 (d7)] using the custom-made MATLAB-based software MSparkles. Maximum-intensity projection of GCaMP3 signals for representative FOV [scale bar, 20 μm; (i)] over the entire recording time (up to 5 min), absolute intensity projection (ii) and selected regions of activity [ROAs; (iii)] automatically detected using variations in the absolute intensity. Red arrows indicate location of the selected ROAs with representative time frames from the selected recordings [scale bar, 20 μm; (iv)]. Red arrows indicate the location of the selected ROAs if active in the displayed time frame. Normalized relative fluorescence intensity traces over time (ΔF/F0) for the selected ROAs (v) with trace colors matching the colors of the selected ROAs and oblique sections indicating the time points chosen for display. Automatically detected signals were pinpointed and color coded based on signal strength (μ + σ ≤ ΔF/F0 ≤ μ + 2σ, blue; μ + 2σ < ΔF/F0 ≤ μ + 3σ, green; ΔF/F0 > μ + 3σ, red) calculated on the mean value (μ) and the corresponding standard deviation (σ) over all ROAs.
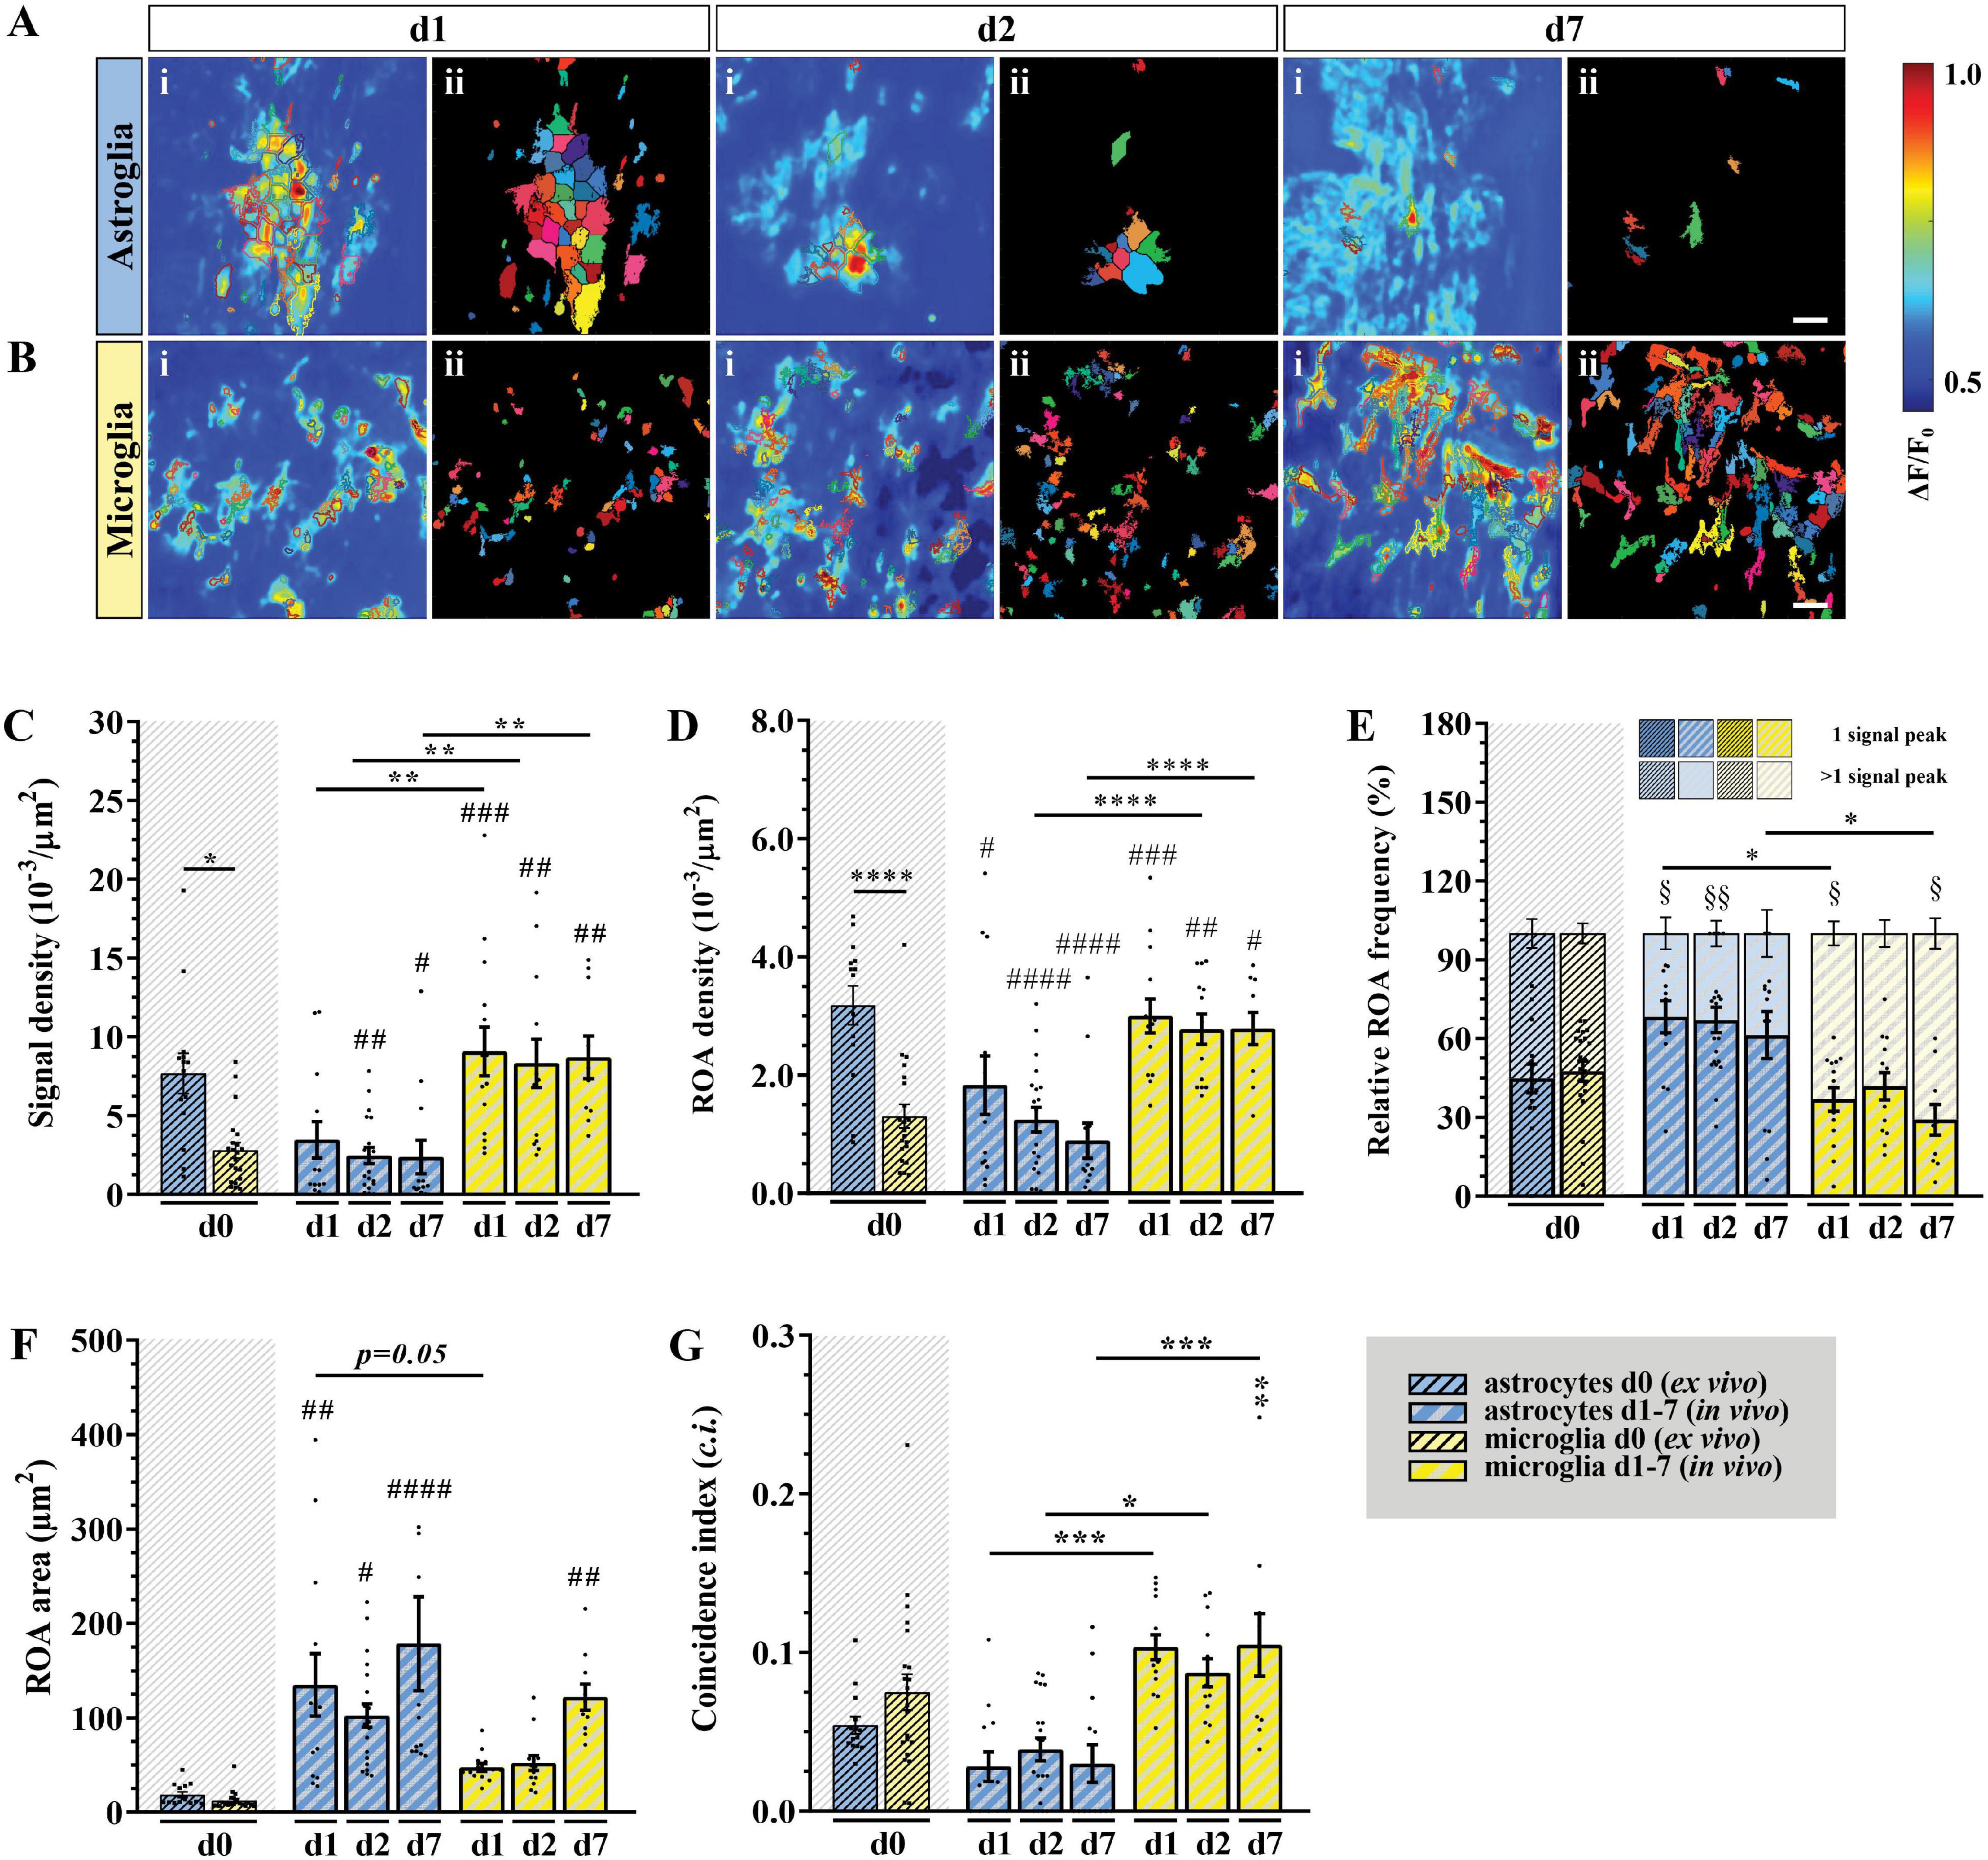
Figure 5. In vivo microglial Ca2+ signals showed higher signal and ROA densities as well as smaller areas and a higher temporal coincidence. (A,B) Automatic detected ROAs based on absolute fluorescence projections along the temporal axis for astroglia (blue) and microglia (yellow) in vivo (d1, d2 and d7, wm). Absolute fluorescence projections (i) were overlapped with the edges of the detected ROAs [depicted as solid areas in panel (ii)]. (C) Signal and (D) ROA density. (E) Relative frequency of ROAs active once (lower bars) or more than once (upper bars) over the recording time. (F) ROA area and (G) mean relative number of simultaneously active ROAs over the total recording time calculated as coincidence index (c.i.). Ex vivo (d0) wm data were placed next to the in vivo data for direct comparison. (C–G) Data were represented as mean ± SEM of single FOVs. Single datasets were analyzed using a Shapiro–Wilk normality test and represented as FOV medians. Data were compared using an Ordinary one-way ANOVA with Bonferroni’s multiple comparisons test. Comparisons between in vivo and ex vivo data were displayed on top of the single bars. For each group in panel (E), the relative numbers of ROAs presenting one or more signal peaks were analyzed using a Wilcoxon matched pairs signed rank test. N (animals) = 4 (astroglia, d0), 4-6-4 (astroglia, in vivo, d1-d7), 6 (microglia, d0), 4 (microglia, in vivo, d1-d7). n (FOVs) = 14 (astroglia, d0), 13-20-13 (astroglia, in vivo, d1-d7), 22 (microglia, d0), 14-13-10 (microglia, in vivo, d1-d7). *, #, $p < 0.05; **, ##, $$p < 0.01; ***, ###p < 0.001; ***p < 0.0001.
No difference was detected in terms of signal amplitude as well as signal duration (Table 2). In line with this, the relative frequency distribution of glial signal amplitudes displayed only minor or no differences for astroglia (d1∼d2∼d7) and compared to microglia. In contrast to astrocytes, the signal amplitudes of microglia varied among chronic recordings (p < 0.0001) and compared to ex vivo slice recordings (d1: p < 0.001; d2: p < 0.0001; d7: p < 0.0001). Notably, the difference of microglial amplitude frequency distributions between in vivo and ex vivo conditions increased over time from d1 to d7 (Supplementary Figure 3A). The signal durations of astrocytes were longer in vivo than ex vivo but became more similar along the investigated time points (d1: p < 0.0001; d2: p < 0.0001; d7: p < 0.0001). Furthermore, microglia displayed the longest signal durations at d1 in comparison to d2 (p < 0.0001) and d7 (p < 0.001) but also to acute ex vivo slice preparations (p < 0.0001) and regarding to astroglia (d1, p < 0.0001, Supplementary Figure 3B). As it was the case for the acute slice preparations, the integrated fluorescence of the Ca2+ signals as well as their rise and decay time did not display any difference either between in vivo and ex vivo recordings or between the two cell types (Table 2). The area (μm2) of in vivo Ca2+ signals was more than five times larger than ex vivo for astrocytes (d1: p < 0.01; d2: p < 0.05; d7: p < 0.0001) and at least four times larger for microglia. In particular, we found that both astroglia and microglia displayed a larger ROA area 1 week after the window implantation (d7), whereas in the acute phase (d1-d2) only astroglial signals were associated with larger ROA areas (Figure 5F). The relative frequency distribution of the ROA areas also showed that in vivo astrocytes (p < 0.0001) and microglia (p < 0.0001) were highly different to ex vivo recordings. On the other hand, there were only minor differences among the astroglial datasets in vivo and between the early in vivo recordings of microglia (d1-d2). We found no difference between astroglia and microglia at d7, but the ROA area was strongly reduced in microglia compared to astrocytes at d1 and d2 (p < 0.0001, Supplementary Figure 3C). We then assessed the relative number of simultaneously active ROAs in the FOV space, revealing two to three times more coincidently active ROAs in in vivo recordings in microglia compared to astroglia (Figure 5G).
To finalize our comparison, we performed a cluster analysis on all parameters provided by MSparkles, aiming at identifying specific segregation patterns within the presented data (Supplementary Figure 4). Since we could not clearly distinguish microglia and astrocytes (Supplementary Figure 4A), we separated the two cell types and could find only a partial segregation of the microglial data between ex and in vivo recordings (Supplementary Figures 4B,C).
Discussion
In this work, we determined the characteristics of physiological Ca2+ dynamics of astrocytes and microglia in the murine spinal cord employing in vivo and ex vivo two-photon laser-scanning microscopy (2P-LSM) of transgenic mice expressing the genetically encoded Ca2+ indicator GCaMP3. To compare glial Ca2+ dynamics, we took advantage of a custom-made MATLAB-based analysis software (MSparkles) that identifies fluorescence changes in an unbiased and morphology independent manner and determines signal peak as well as region of activity (ROA) associated parameters. Our analysis revealed that microglia have a strongly reduced signal as well as ROA density in ex vivo preparations compared to astroglia (Figures 3C,D). Notably, this is not associated with overall differences in astro- and microglial signal frequency within each active ROA (Figure 3E and Table 2). In contrast to this, in vivo microglia show higher signal and ROA density than astrocytes (Figures 5C,D). This opposite findings between ex vivo and in vivo recordings may be due to an activation of astrocytes and microglia resulting from the excessive manipulation required for spinal cord extraction and acute slice preparation resulting in an excessively high (astrocytes) or excessively low (microglia) Ca2+ activity in line with the change of microglia morphology to a more amoeboid appearance in slices. It was recently shown for the brain that astroglial Ca2+ dynamics differ between ex vivo and in vivo (as well as in situ) recordings (Müller et al., 2021) supporting our results. Astroglial ROA densities decrease in vivo along the imaging sessions, possibly hinting that higher ROA densities are associated with an alteration of astroglial signaling in the acute phase after laminectomy non-detectable by reactive markers. Also, glial Ca2+ signaling is differentially affected by anesthesia used during the in vivo recording. In line with our observations, previous work shows a reduced Ca2+ activity in astroglia both in brain and spinal cord (Thrane et al., 2012; Poskanzer and Yuste, 2016; Sekiguchi et al., 2016; Schweigmann et al., 2021) and an increased Ca2+ activity in microglia in the brain under anesthesia (Umpierre et al., 2020). Although microglial ROA density is higher in vivo, the ROA area itself is smaller than for astrocytes both ex vivo and in vivo in the early phase (d1 and d2) after the window implantation (Figures 3F, 5F), suggesting that activated microglial Ca2+ dynamics are reduced compared to physiological conditions. In line with this, our recordings showed that astroglia display concerted Ca2+ waves beyond the extension of single cells, whereas microglial Ca2+ signaling is mainly restricted to single processes in acute slices and directly after spinal cord window surgery.
In terms of 3D structural properties of the single Ca2+ changes (amplitude, duration, integrated fluorescence, rise and decay time), we found no substantial differences between astrocytes and microglia as well as between ex vivo and in vivo recordings (Table 2). We conclude that the characterization of spontaneous Ca2+ changes in terms of commonly assessed parameters (as amplitude and duration) or even more sophisticated geometrical descriptive parameters (such as integrated fluorescence, rise and decay time) cannot enable a successful segregation of glial Ca2+ dynamics even if collectively assessed as we did using a clustering analysis (Supplementary Figure 4). This suggests that glial cells may share some common mechanisms underlying Ca2+ signaling or that cell-specific pathways originate similar cytosolic Ca2+ elevations and that the different glial Ca2+ dynamics arise from the temporal and spatial control of otherwise similar signals at the cellular or network level. Indeed, it is known since decades that glial cells share some common mechanisms at the basis of intracellular Ca2+ mobilization (Verkhratsky and Kettenmann, 1996; Deitmer et al., 1998). Nevertheless, pharmacological as well as genetic approaches aiming at interfering with putative molecular mechanisms underlying Ca2+ fluctuations are required to draw any conclusion on this point.
In acute spinal cord preparations, microglia display similar Ca2+ signaling properties between gray (gm) and white matter (wm; Figure 3) whereas astroglial Ca2+ signals last longer (Table 2) and have a larger extension (Figure 3F) in gm compared to wm. This finding suggests that diverse Ca2+ dynamics might be due to the morphological heterogeneity of astroglia that can be clearly observed between gm and wm (Figure 1) in line with previous evidence obtained in the brain showing less coupling of wm fibrous astrocytes (mainly though connexin 43) compared to gm protoplasmic astroglia (through connexins 43 and 30) (Lee et al., 1994; Haas et al., 2006). In addition, astroglial Ca2+ waves in wm, in contrast to the neocortical gm, mainly propagate through ATP release (Schipke et al., 2002; Hamilton et al., 2008). Also, gm and wm astroglia receive different glutamatergic inputs given their close proximity with the neuronal synapses in the gm and the relatively lower level of glutamate release from neuronal axons in the wm (Kukley et al., 2007; Ziskin et al., 2007; Wake et al., 2011). Taken together, these data point at the existence of a regional specificity for astroglial Ca2+ signaling which reflects the cellular heterogeneity between gm and wm (Köhler et al., 2021). On the other hand, microglial Ca2+ dynamics display a substantial uniformity between gm and wm, in line with the absence of morphological regional differences.
The monitoring of astroglial and microglial Ca2+ dynamics for up to 7 days after laminectomy and chronic window implantation enabled the evaluation of putative specific glial responses to the manipulation required for in vivo imaging (Figure 5). In particular, microglia display a more differential phenotype between the acute phase (d1 and d2) after laminectomy and the later chronic phase (d7) than astroglia. Microglia signals are characterized by higher duration and smaller area in the acute phase and with higher amplitude, lower duration and larger area in the chronic phase. Moreover, a closer look at the relative signal frequency distributions revealed higher similarities for astroglia in terms of amplitude as well as duration, whereas microglial signal distribution displayed a high heterogeneity along the recording time points. Notably, signal amplitude and duration distribution of astroglia and microglia become more and more similar with time. Similar findings were obtained from the analysis of the distribution of the ROA areas, thus suggesting that in vivo glial cell are similar in the chronic phase but differ after acute activation following the perturbation of the surrounding environment. This is in line with evidence supporting the different response kinetics of spinal cord microglia (Prewitt et al., 1997; Dibaj et al., 2010; Bellver-Landete et al., 2019) and astrocytes (Okada et al., 2006; Fan et al., 2016; Li et al., 2019, 2020) in response to external stimuli. This may also underline the differences observed between astroglia and microglia in acute slice preparations, since the experimental procedure required to collect the tissue constitutes a significant challenge to the physiology of the spinal cord. In line with this, microglial signal amplitude distribution becomes progressively more different than the signal distribution from ex vivo recordings along the experimental time points, suggesting a progressive restoration of the physiological status disrupted after spinal cord slice collection or window implantation. To test the nature of glial Ca2+ reactive phenotype, we propose to acutely challenge glial Ca2+ dynamics in vivo by means of focal application of mechanical (e.g., laser induced) as well as chemical (e.g., DAMPs such as ATP) perturbative stimuli to trigger event-based Ca2+ signaling.
Finally, with respect to the temporal dynamics of astro- and microglial Ca2+ signaling, we showed that both glial cell populations are associated with the same signal frequency but different activity (i.e., relative number of ROAs active once or more than once during the recording time) (Figure 5E) as well as a different extent of coincident activity (Figure 5G). In particular, the relative frequency of astroglial ROAs with more than one peak in vivo is higher compared to microglial ROAs, while the signal frequency is not changed between the two cell types. In parallel to that, astroglia display a lower coincidence index compared to microglia. The enhanced microglial coincidence in vivo is likely due to their constant dynamic scanning of the surrounding environment since microglial Ca2+ changes were shown to precede cell motility in the brain (Umpierre et al., 2020). In addition to that, glial Ca2+ dynamics might be the result of a differential cell responsivity to their neuronal counterpart. This study was conceptualized minimizing the interference of the neuronal network in vivo by means of isoflurane anesthesia, thus avoiding the superimposition of a further level of complexity arising from motor as well as sensory stimuli. Nevertheless, the evaluation of glial Ca2+ dynamics in awake animals is required to fully elucidate glial heterogeneity and we strongly believe that the evaluation of event triggered Ca2+ signaling (like in response to the induction of reflex circuits) will enable the identification of a further layer of glial specificity in terms of Ca2+ dynamics.
Conclusion
In summary, we performed two-photon laser-scanning microscopy in acute slice preparations and chronic in vivo recordings of the mouse spinal cord to simultaneously characterize and compare cell-specific properties of Ca2+ signals in astro- and microglia. To this aim, we used specific user-defined parameters and a novel analysis tool to evaluate common and distinct features of spinal glial cells with respect to their physiological Ca2+ changes. Accordingly, we conclude that signal and ROA density, ROA area, signal frequency and coincidence are key parameters for the differentiation of glial Ca2+ dynamics and are therefore valuable candidates for understanding the highly developed function of astrocytes and microglia in the environment of the mammalian spinal cord. Acute slice preparation as well as the spinal cord surgery influence both astro- and microglial Ca2+ dynamics and we found that microglia, as predictable given their surveillance activity, are more susceptible to the experimental manipulation. Nevertheless, the reliable and standardized analysis of Ca2+ dynamics remains an open challenge to be addressed in the near future to fully elucidate the role of spinal glial cells in physiology and pathology.
Data Availability Statement
The raw data supporting the conclusions of this article will be made available by the authors, without undue reservation.
Ethics Statement
The animal study was reviewed and approved by Saarländisches Landesamt für Gesundheit und Verbraucherschutz.
Author Contributions
PR and DG equally contributed to the manuscript, conceptualized the project, performed the experiments, analyzed the data, wrote the first draft, and generated the figures. PR performed laminectomy and spinal cord window implantation and prepared the spinal cord tissue for further processing. DG obtained and handled the spinal cord acute preparations. GS developed the ROA-based automatic analysis for image processing. AW contributed to the data analysis and visualization. ED contributed to the data acquisition. FK provided the structural and financial support for the project. AS conceptualized and supervised the project, reviewed and finalized the manuscript and figures. All authors approved on the final version of the manuscript.
Funding
This project has received funding from the European Union’s Horizon 2020 research and innovation programme under the Marie Skłodowska-Curie Grant Agreement No 722053 and the European Commission Horizon 2020-EU FET Proactive-01-2016 Neurofibres and from the Deutsche Forschungsgemeinschaft DFG (FOR 2289 and SFB 894 and 1158) and Fondation pour l’Aide à la Recherche sur la Sclérose En Plaques et Association Française contre les Myopathies (ARSEP-AFM).
Conflict of Interest
The authors declare that the research was conducted in the absence of any commercial or financial relationships that could be construed as a potential conflict of interest.
Publisher’s Note
All claims expressed in this article are solely those of the authors and do not necessarily represent those of their affiliated organizations, or those of the publisher, the editors and the reviewers. Any product that may be evaluated in this article, or claim that may be made by its manufacturer, is not guaranteed or endorsed by the publisher.
Acknowledgments
We would like to thank Wenhui Huang, Xianshu Bai, Bogdan Cǎtǎlin and Laura C. Caudal for intellectual input. We would also like to thank Daniel Schauenburg and colleagues for expert mouse maintenance and tamoxifen treatment and Frank Rhode for technical assistance.
Supplementary Material
The Supplementary Material for this article can be found online at: https://www.frontiersin.org/articles/10.3389/fnmol.2022.840948/full#supplementary-material
Supplementary Figure 1 | Chronic spinal cord window implantation induced no abnormal glial cell reactivity. (A) Experimental design for the evaluation of the chronic glial cell reactivity after laminectomy and spinal cord window implantation with 10-weeks old mice injected with tamoxifen (TAM) and processed 2 weeks later for either immunohistochemistry (IHC, d0) or laminectomy surgery for chronic spinal cord window implantation and subsequently perfusion after 1, 2, or 7 days (d1, d2, and d7). (B) Bright field overview of spinal cord tissue exposed through laminectomy and monitored for up to 7 days and relative magnification of the selected areas (i–iii). The regions in correspondence of the removed spinal vertebrae (T13 and L1, left) and the underlying spinal cord segments (L4-L6, S1; right) are indicated. Scale bar, 1 mm (overviews) and 200 μm (magnified views). (C) Evaluation of astroglial and microglial reactivity in mice expressing GCaMP3 in astrocytes (blue) or microglia (yellow) stained for GFAP (glial fibrillary acidic protein, red) and Iba1 (green) for astroglial and microglial reactivity, respectively. Cell nuclei were stained with DAPI (blue). Scale bar, 200 μm.
Supplementary Figure 2 | Ex vivo distribution of glial signal amplitudes, durations and ROA areas. (A) Relative frequency of signal amplitude (divided into 0.1 ΔF/F0 bins), (B) signal duration, divided 2 s bins) and (C) ROA area (divided into 5 μm2 bins) for astroglia (blue) and microglia (yellow) in gm (solid) and wm (dashed) of acute slice preparations. Data with peak amplitudes greater than 0.7 ΔF/F0 (0.7 ± 0.5%), durations longer than 40 s (0.1 ± 0.1%) and ROA area greater than 120 μm2 (0.6 ± 0.2%) were excluded from the representation for easier display. Data were represented as mean ± SEM, fitted with a lognormal curve using a Least-Squares fitting with no weighting method and compared using the extra-sum-of-squares F test. F ratios and relative p-values of single curve comparisons were schematically represented as a squared diagram and gray-scaled color-coded. Smaller insets represent magnified views of the fitting curves. N (animals) = 4 (astroglia), 5 (microglia, gm), 6 (microglia, wm). n (FOVs) = 12 (astroglia, gm), 14 (astroglia, wm), 15 (microglia, gm), 22 (microglia, wm). ****p < 0.0001.
Supplementary Figure 3 | In vivo distribution of glial signal amplitudes, durations and ROA areas. (A) Relative frequency of signal amplitude (divided into 0.15 ΔF/F0 bins), (B) signal duration (divided into 2 s bins) and (C) ROA area (divided into 25 μm2 bins) for astroglia (blue) and microglia (yellow) in vivo (d1, d2 and d7, wm) and ex vivo (d0, wm). Data with peak amplitude greater than 0.5 ΔF/F0 (3.3 ± 1.3%), duration longer than 40 s (0.4 ± 0.3%) and ROA areas larger than 400 μm2 (5.3 ± 1.8%) were excluded from the representation for easier display. Data were represented as mean ± SEM, fitted with a lognormal curve using a Least-Squares fitting with no weighting method and compared using the extra-sum-of-squares F test. F ratios and relative p-values of single curve comparisons were schematically represented as a triangle diagram and gray-scaled color-coded. Non-significantly different curves were plotted as a shared curve (d1∼d2∼d7). Smaller insets represent magnified views of the fitting curves. N (animals) = 4 (astroglia, d0), 4-6-4 (astroglia, in vivo, d1-d7), 6 (microglia, d0), 4 (microglia, in vivo, d1-d7). n (FOVs) = 14 (astroglia, d0), 13-20-13 (astroglia, in vivo, d1-d7), 22 (microglia, d0), 14-13-10 (microglia, in vivo, d1-d7). *p < 0.05; **p < 0.01; ***p < 0.001; ****p < 0.0001.
Supplementary Figure 4 | Hierarchical clustering of Ca2+ signalling data. (A) Heatmap of the unsupervised hierarchical clustering of Ca2+ signaling data represented as medians of single FOVs and color-coded based on the row z-scores for both cell-types, (B) astroglia or (C) microglia. Datasets were color coded based on cell-type (astroglia, blue; microglia, yellow), experimental procedure (ex vivo, light blue; in vivo, orange) or spinal cord region (gm, gray; wm, white).
Footnotes
References
Anderson, C. R., Ashwell, K. W., Collewijn, H., Conta, A., Harvey, A., Heise, C., et al. (2009). The Spinal Cord. London: Elsevier Ltd.
Araque, A., Parpura, V., Sanzgiri, R. P., and Haydon, P. G. (1999). Tripartite synapses: glia, the unacknowledged partner. Trends Neurosci. 22, 208–215. doi: 10.1016/s0166-2236(98)01349-6
Bazargani, N., and Attwell, D. (2016). Astrocyte calcium signaling: the third wave. Nat. Neurosci. 19, 182–189. doi: 10.1038/nn.4201
Bellver-Landete, V., Bretheau, F., Mailhot, B., Vallières, N., Lessard, M., Janelle, M. E., et al. (2019). Microglia are an essential component of the neuroprotective scar that forms after spinal cord injury. Nat. Commun. 10:518. doi: 10.1038/s41467-019-08446-0
Bezzi, P., Domercq, M., Brambilla, L., Galli, R., Schols, D., De Clercq, E., et al. (2001). CXCR4-activated astrocyte glutamate release via TNFalpha: amplification by microglia triggers neurotoxicity. Nat. Neurosci. 4, 702–710. doi: 10.1038/89490
Bianco, F., Fumagalli, M., Pravettoni, E., D’Ambrosi, N., Volonte, C., Matteoli, M., et al. (2005). Pathophysiological roles of extracellular nucleotides in glial cells: differential expression of purinergic receptors in resting and activated microglia. Brain Res. Brain Res. Rev. 48, 144–156. doi: 10.1016/j.brainresrev.2004.12.004
Biber, K., Laurie, D. J., Berthele, A., Sommer, B., Tölle, T. R., Gebicke-Härter, P. J., et al. (1999). Expression and signaling of group I metabotropic glutamate receptors in astrocytes and microglia. J. Neurochem. 72, 1671–1680. doi: 10.1046/j.1471-4159.1999.721671.x
Bican, O., Minagar, A., and Pruitt, A. A. (2013). The spinal cord: a review of functional neuroanatomy. Neurol. Clin. 31, 1–18. doi: 10.1016/j.ncl.2012.09.009
Bindocci, E., Savtchouk, I., Liaudet, N., Becker, D., Carriero, G., and Volterra, A. (2017). Three-dimensional Ca(2+) imaging advances understanding of astrocyte biology. Science 356:eaai8185. doi: 10.1126/science.aai8185
Brawek, B., and Garaschuk, O. (2013). Microglial calcium signaling in the adult, aged and diseased brain. Cell Calcium 53, 159–169. doi: 10.1016/j.ceca.2012.12.003
Brawek, B., Liang, Y., Savitska, D., Li, K., Fomin-Thunemann, N., Kovalchuk, Y., et al. (2017). A new approach for ratiometric in vivo calcium imaging of microglia. Sci. Rep. 7:6030. doi: 10.1038/s41598-017-05952-3
Brawek, B., Schwendele, B., Riester, K., Kohsaka, S., Lerdkrai, C., Liang, Y., et al. (2014). Impairment of in vivo calcium signaling in amyloid plaque-associated microglia. Acta Neuropathol. 127, 495–505. doi: 10.1007/s00401-013-1242-2
Carmignoto, G., and Haydon, P. G. (2012). Astrocyte calcium signaling and epilepsy. Glia 60, 1227–1233. doi: 10.1002/glia.22318
Cartarozzi, L. P., Rieder, P., Bai, X., Scheller, A., Oliveira, A. L. R., and Kirchhoff, F. (2018). In vivo two-photon imaging of motoneurons and adjacent glia in the ventral spinal cord. J. Neurosci. Methods 299, 8–15. doi: 10.1016/j.jneumeth.2018.01.005
Caudal, L. C., Gobbo, D., Scheller, A., and Kirchhoff, F. (2020). The paradox of astroglial Ca2 + signals at the interface of excitation and inhibition. Front. Cell. Neurosci. 14:609947. doi: 10.3389/fncel.2020.609947
Cirillo, G., De Luca, D., and Papa, M. (2012). Calcium imaging of living astrocytes in the mouse spinal cord following sensory stimulation. Neural Plast. 2012:425818. doi: 10.1155/2012/425818
Cornell-Bell, A. H., Finkbeiner, S. M., Cooper, M. S., and Smith, S. J. (1990). Glutamate induces calcium waves in cultured astrocytes: long-range glial signaling. Science 247, 470–473. doi: 10.1126/science.1967852
Cregg, J. M., DePaul, M. A., Filous, A. R., Lang, B. T., Tran, A., and Silver, J. (2014). Functional regeneration beyond the glial scar. Exp. Neurol. 253, 197–207. doi: 10.1016/j.expneurol.2013.12.024
Cupido, A., Catalin, B., Steffens, H., and Kirchhoff, F. (2014). “Surgical procedures to study microglial motility in the brain and in the spinal cord by in vivo two-photon laser-scanning microcopy,” in Confocal and Multiphoton Laser-Scanning Microscopy of Neuronal Tissue: Applications and Quantitative Image Analysis, eds L. Bakota and R. Brandt (Berlin: Springer), 37–50. doi: 10.1007/978-1-4939-0381-8_2
David, S., and Kroner, A. (2011). Repertoire of microglial and macrophage responses after spinal cord injury. Nat. Rev. Neurosci. 12, 388–399. doi: 10.1038/nrn3053
Deitmer, J. W., Verkhratsky, A. J., and Lohr, C. (1998). Calcium signalling in glial cells. Cell Calcium 24, 405–416.
DeSai, C., Reddy, V., and Agarwal, A. (2021). Anatomy, Back, Vertebral Column. Treasure Island, FL: StatPearls.
Dibaj, P., Nadrigny, F., Steffens, H., Scheller, A., Hirrlinger, J., Schomburg, E. D., et al. (2010). NO mediates microglial response to acute spinal cord injury under ATP control in vivo. Glia 58, 1133–1144. doi: 10.1002/glia.20993
Eichhoff, G., Brawek, B., and Garaschuk, O. (2011). Microglial calcium signal acts as a rapid sensor of single neuron damage in vivo. Biochim. Biophys. Acta 1813, 1014–1024. doi: 10.1016/j.bbamcr.2010.10.018
Fan, H., Zhang, K., Shan, L., Kuang, F., Chen, K., Zhu, K., et al. (2016). Reactive astrocytes undergo M1 microglia/macrohpages-induced necroptosis in spinal cord injury. Mol. Neurodegener. 11:14. doi: 10.1186/s13024-016-0081-8
Färber, K., and Kettenmann, H. (2006). Functional role of calcium signals for microglial function. Glia 54, 656–665. doi: 10.1002/glia.20412
Fenrich, K. K., Weber, P., Hocine, M., Zalc, M., Rougon, G., and Debarbieux, F. (2012). Long-term in vivo imaging of normal and pathological mouse spinal cord with subcellular resolution using implanted glass windows. J. Physiol. 590, 3665–3675. doi: 10.1113/jphysiol.2012.230532
Ferrari, D., Villalba, M., Chiozzi, P., Falzoni, S., Ricciardi-Castagnoli, P., and Di Virgilio, F. (1996). Mouse microglial cells express a plasma membrane pore gated by extracellular ATP. J. Immunol. 156, 1531–1539.
Gaudet, A. D., and Fonken, L. K. (2018). Glial cells shape pathology and repair after spinal cord injury. Neurotherapeutics 15, 554–577. doi: 10.1007/s13311-018-0630-7
Glass, C. K., Saijo, K., Winner, B., Marchetto, M. C., and Gage, F. H. (2010). Mechanisms underlying inflammation in neurodegeneration. Cell 140, 918–934. doi: 10.1016/j.cell.2010.02.016
Haas, B., Schipke, C. G., Peters, O., Söhl, G., Willecke, K., and Kettenmann, H. (2006). Activity-dependent ATP-waves in the mouse neocortex are independent from astrocytic calcium waves. Cereb. Cortex 16, 237–246. doi: 10.1093/cercor/bhi101
Hamby, M. E., Coppola, G., Ao, Y., Geschwind, D. H., Khakh, B. S., and Sofroniew, M. V. (2012). Inflammatory mediators alter the astrocyte transcriptome and calcium signaling elicited by multiple G-protein-coupled receptors. J. Neurosci. 32, 14489–14510. doi: 10.1523/JNEUROSCI.1256-12.2012
Hamilton, N., Vayro, S., Kirchhoff, F., Verkhratsky, A., Robbins, J., Gorecki, D. C., et al. (2008). Mechanisms of ATP- and glutamate-mediated calcium signaling in white matter astrocytes. Glia 56, 734–749. doi: 10.1002/glia.20649
Harrow-Mortelliti, M., Reddy, V., and Jimsheleishvili, G. (2021). Physiology, Spinal Cord. Treasure Island, FL: StatPearls.
Hassanzadeh, S., Jalessi, M., Jameie, S. B., Khanmohammadi, M., Bagher, Z., Namjoo, Z., et al. (2021). More attention on glial cells to have better recovery after spinal cord injury. Biochem. Biophys. Rep. 25:100905. doi: 10.1016/j.bbrep.2020.100905
Haustein, M. D., Kracun, S., Lu, X. H., Shih, T., Jackson-Weaver, O., Tong, X., et al. (2014). Conditions and constraints for astrocyte calcium signaling in the hippocampal mossy fiber pathway. Neuron 82, 413–429. doi: 10.1016/j.neuron.2014.02.041
Haynes, S. E., Hollopeter, G., Yang, G., Kurpius, D., Dailey, M. E., Gan, W. B., et al. (2006). The P2Y12 receptor regulates microglial activation by extracellular nucleotides. Nat. Neurosci. 9, 1512–1519. doi: 10.1038/nn1805
Heo, D. K., Lim, H. M., Nam, J. H., Lee, M. G., and Kim, J. Y. (2015). Regulation of phagocytosis and cytokine secretion by store-operated calcium entry in primary isolated murine microglia. Cell. Signal. 27, 177–186. doi: 10.1016/j.cellsig.2014.11.003
Hirrlinger, P. G., Scheller, A., Braun, C., Hirrlinger, J., and Kirchhoff, F. (2006). Temporal control of gene recombination in astrocytes by transgenic expression of the tamoxifen-inducible DNA recombinase variant CreERT2. Glia 54, 11–20. doi: 10.1002/glia.20342
Hirrlinger, P. G., Scheller, A., Braun, C., Quintela-Schneider, M., Fuss, B., Hirrlinger, J., et al. (2005). Expression of reef coral fluorescent proteins in the central nervous system of transgenic mice. Mol. Cell. Neurosci. 30, 291–303. doi: 10.1016/j.mcn.2005.08.011
Hoffmann, A., Kann, O., Ohlemeyer, C., Hanisch, U. K., and Kettenmann, H. (2003). Elevation of basal intracellular calcium as a central element in the activation of brain macrophages (microglia): suppression of receptor-evoked calcium signaling and control of release function. J. Neurosci. 23, 4410–4419. doi: 10.1523/JNEUROSCI.23-11-04410.2003
Huang, W., Bai, X., Meyer, E., and Scheller, A. (2020). Acute brain injuries trigger microglia as an additional source of the proteoglycan NG2. Acta Neuropathol. Commun. 8:146. doi: 10.1186/s40478-020-01016-2
Ikeda, M., Tsuno, S., Sugiyama, T., Hashimoto, A., Yamoto, K., Takeuchi, K., et al. (2013). Ca(2+) spiking activity caused by the activation of store-operated Ca(2+) channels mediates TNF-α release from microglial cells under chronic purinergic stimulation. Biochim. Biophys. Acta 1833, 2573–2585. doi: 10.1016/j.bbamcr.2013.06.022
Jahn, H. M., Kasakow, C. V., Helfer, A., Michely, J., Verkhratsky, A., Maurer, H. H., et al. (2018). Refined protocols of tamoxifen injection for inducible DNA recombination in mouse astroglia. Sci. Rep. 8:5913. doi: 10.1038/s41598-018-24085-9
Jiang, R., Diaz-Castro, B., Looger, L. L., and Khakh, B. S. (2016). Dysfunctional calcium and glutamate signaling in striatal astrocytes from Huntington’s disease model mice. J. Neurosci. 36, 3453–3470. doi: 10.1523/JNEUROSCI.3693-15.2016
Johannssen, H. C., and Helmchen, F. (2010). In vivo Ca2+ imaging of dorsal horn neuronal populations in mouse spinal cord. J. Physiol. 588, 3397–3402. doi: 10.1113/jphysiol.2010.191833
Jung, P., Cornell-Bell, A., Madden, K. S., and Moss, F. (1998). Noise-induced spiral waves in astrocyte syncytia show evidence of self-organized criticality. J. Neurophysiol. 79, 1098–1101. doi: 10.1152/jn.1998.79.2.1098
Kettenmann, H., Hanisch, U. K., Noda, M., and Verkhratsky, A. (2011). Physiology of microglia. Physiol. Rev. 91, 461–553.
Khakh, B. S., and McCarthy, K. D. (2015). Astrocyte calcium signaling: from observations to functions and the challenges therein. Cold Spring Harb. Perspect. Biol. 7:a020404. doi: 10.1101/cshperspect.a020404
Kofuji, P., and Araque, A. (2020). G-protein-coupled receptors in astrocyte-neuron communication. Neuroscience 456, 71–84. doi: 10.1016/j.neuroscience.2020.03.025
Köhler, S., Winkler, U., and Hirrlinger, J. (2021). Heterogeneity of astrocytes in grey and white matter. Neurochem. Res. 46, 3–14.
Kolos, E. A., and Korzhevskii, D. E. (2020). Spinal cord microglia in health and disease. Acta Naturae 12, 4–17. doi: 10.32607/actanaturae.10934
Kopper, T. J., and Gensel, J. C. (2018). Myelin as an inflammatory mediator: myelin interactions with complement, macrophages, and microglia in spinal cord injury. J. Neurosci. Res. 96, 969–977. doi: 10.1002/jnr.24114
Korvers, L., de Andrade Costa, A., Mersch, M., Matyash, V., Kettenmann, H., and Semtner, M. (2016). Spontaneous Ca2+ transients in mouse microglia. Cell Calcium 60, 396–406. doi: 10.1016/j.ceca.2016.09.004
Kuchibhotla, K. V., Lattarulo, C. R., Hyman, B. T., and Bacskai, B. J. (2009). Synchronous hyperactivity and intercellular calcium waves in astrocytes in Alzheimer mice. Science 323, 1211–1215. doi: 10.1126/science.1169096
Kuhn, S. A., van Landeghem, F. K., Zacharias, R., Färber, K., Rappert, A., Pavlovic, S., et al. (2004). Microglia express GABA(B) receptors to modulate interleukin release. Mol. Cell. Neurosci. 25, 312–322. doi: 10.1016/j.mcn.2003.10.023
Kukley, M., Capetillo-Zarate, E., and Dietrich, D. (2007). Vesicular glutamate release from axons in white matter. Nat. Neurosci. 10, 311–320.
Lee, S. H., Kim, W. T., Cornell-Bell, A. H., and Sontheimer, H. (1994). Astrocytes exhibit regional specificity in gap-junction coupling. Glia 11, 315–325. doi: 10.1002/glia.440110404
Lee, W., Reyes, R. C., Gottipati, M. K., Lewis, K., Lesort, M., Parpura, V., et al. (2013). Enhanced Ca(2+)-dependent glutamate release from astrocytes of the BACHD Huntington’s disease mouse model. Neurobiol. Dis. 58, 192–199. doi: 10.1016/j.nbd.2013.06.002
Li, L., Ni, L., Eugenin, E. A., Heary, R. F., and Elkabes, S. (2019). Toll-like receptor 9 antagonism modulates astrocyte function and preserves proximal axons following spinal cord injury. Brain Behav. Immun. 80, 328–343. doi: 10.1016/j.bbi.2019.04.010
Li, X., Li, M., Tian, L., Chen, J., Liu, R., and Ning, B. (2020). Reactive astrogliosis: implications in spinal cord injury progression and therapy. Oxid. Med. Cell. Longev. 2020:9494352. doi: 10.1155/2020/9494352
Liddelow, S. A., Guttenplan, K. A., Clarke, L. E., Bennett, F. C., Bohlen, C. J., Schirmer, L., et al. (2017). Neurotoxic reactive astrocytes are induced by activated microglia. Nature 541, 481–487. doi: 10.1038/nature21029
Light, A. R., Wu, Y., Hughen, R. W., and Guthrie, P. B. (2006). Purinergic receptors activating rapid intracellular Ca increases in microglia. Neuron Glia Biol. 2, 125–138. doi: 10.1017/S1740925X05000323
Luisier, F., Blu, T., and Unser, M. (2011). Image denoising in mixed poisson-gaussian noise. IEEE Trans. Image Process. 20, 696–708. doi: 10.1109/tip.2010.2073477
Mariotti, L., Losi, G., Lia, A., Melone, M., Chiavegato, A., Gómez-Gonzalo, M., et al. (2018). Interneuron-specific signaling evokes distinctive somatostatin-mediated responses in adult cortical astrocytes. Nat. Commun. 9:82. doi: 10.1038/s41467-017-02642-6
Michaelis, M., Nieswandt, B., Stegner, D., Eilers, J., and Kraft, R. (2015). STIM1, STIM2, and Orai1 regulate store-operated calcium entry and purinergic activation of microglia. Glia 63, 652–663. doi: 10.1002/glia.22775
Mizuno, G. O., Wang, Y., Shi, G., Sun, J., Papadopoulos, S., Broussard, G. J., et al. (2018). Aberrant calcium signaling in astrocytes inhibits neuronal excitability in a human down syndrome stem cell model. Cell Rep. 24, 355–365. doi: 10.1016/j.celrep.2018.06.033
Möller, T., Nolte, C., Burger, R., Verkhratsky, A., and Kettenmann, H. (1997). Mechanisms of C5a and C3a complement fragment-induced [Ca2+]i signaling in mouse microglia. J. Neurosci. 17, 615–624. doi: 10.1523/JNEUROSCI.17-02-00615.1997
Müller, F. E., Cherkas, V., Stopper, G., Caudal, L. C., Stopper, L., Kirchhoff, F., et al. (2021). Elucidating regulators of astrocytic Ca2+ signaling via multi-threshold event detection (MTED). Glia 69, 2798–2811. doi: 10.1002/glia.24070
Nagai, J., Rajbhandari, A. K., Gangwani, M. R., Hachisuka, A., Coppola, G., Masmanidis, S. C., et al. (2019). Hyperactivity with disrupted attention by activation of an astrocyte synaptogenic cue. Cell 177, 1280–1292.e20. doi: 10.1016/j.cell.2019.03.019
Nelson, N. A., Wang, X., Cook, D., Carey, E. M., and Nimmerjahn, A. (2019). Imaging spinal cord activity in behaving animals. Exp. Neurol. 320:112974. doi: 10.1016/j.expneurol.2019.112974
Nett, W. J., Oloff, S. H., and McCarthy, K. D. (2002). Hippocampal astrocytes in situ exhibit calcium oscillations that occur independent of neuronal activity. J. Neurophysiol. 87, 528–537. doi: 10.1152/jn.00268.2001
Nishida, K., Matsumura, S., Taniguchi, W., Uta, D., Furue, H., and Ito, S. (2014). Three-dimensional distribution of sensory stimulation-evoked neuronal activity of spinal dorsal horn neurons analyzed by in vivo calcium imaging. PLoS One 9:e103321. doi: 10.1371/journal.pone.0103321
Noda, M., Nakanishi, H., Nabekura, J., and Akaike, N. (2000). AMPA-kainate subtypes of glutamate receptor in rat cerebral microglia. J. Neurosci. 20, 251–258. doi: 10.1523/JNEUROSCI.20-01-00251.2000
Nolte, C., Möller, T., Walter, T., and Kettenmann, H. (1996). Complement 5a controls motility of murine microglial cells in vitro via activation of an inhibitory G-protein and the rearrangement of the actin cytoskeleton. Neuroscience 73, 1091–1107. doi: 10.1016/0306-4522(96)00106-6
Okada, S., Nakamura, M., Katoh, H., Miyao, T., Shimazaki, T., Ishii, K., et al. (2006). Conditional ablation of Stat3 or Socs3 discloses a dual role for reactive astrocytes after spinal cord injury. Nat. Med. 12, 829–834. doi: 10.1038/nm1425
Panatier, A., and Robitaille, R. (2016). Astrocytic mGluR5 and the tripartite synapse. Neuroscience 323, 29–34. doi: 10.1016/j.neuroscience.2015.03.063
Parri, H. R., Gould, T. M., and Crunelli, V. (2001). Spontaneous astrocytic Ca2+ oscillations in situ drive NMDAR-mediated neuronal excitation. Nat. Neurosci. 4, 803–812. doi: 10.1038/90507
Paukert, M., Agarwal, A., Cha, J., Doze, V. A., Kang, J. U., and Bergles, D. E. (2014). Norepinephrine controls astroglial responsiveness to local circuit activity. Neuron 82, 1263–1270. doi: 10.1016/j.neuron.2014.04.038
Perea, G., Gómez, R., Mederos, S., Covelo, A., Ballesteros, J. J., Schlosser, L., et al. (2016). Activity-dependent switch of GABAergic inhibition into glutamatergic excitation in astrocyte-neuron networks. eLife 5:e20362. doi: 10.7554/eLife.20362
Perry, V. H., Nicoll, J. A., and Holmes, C. (2010). Microglia in neurodegenerative disease. Nat. Rev. Neurol. 6, 193–201.
Pologruto, T. A., Sabatini, B. L., and Svoboda, K. (2003). ScanImage: flexible software for operating laser scanning microscopes. Biomed. Eng. Online 2:13. doi: 10.1186/1475-925X-2-13
Poskanzer, K. E., and Yuste, R. (2016). Astrocytes regulate cortical state switching in vivo. Proc. Natl. Acad. Sci. U.S.A. 113, E2675–E2684. doi: 10.1073/pnas.1520759113
Pozner, A., Xu, B., Palumbos, S., Gee, J. M., Tvrdik, P., and Capecchi, M. R. (2015). Intracellular calcium dynamics in cortical microglia responding to focal laser injury in the PC::G5-tdT reporter mouse. Front. Mol. Neurosci. 8:12. doi: 10.3389/fnmol.2015.00012
Prewitt, C. M., Niesman, I. R., Kane, C. J., and Houlé, J. D. (1997). Activated macrophage/microglial cells can promote the regeneration of sensory axons into the injured spinal cord. Exp. Neurol. 148, 433–443. doi: 10.1006/exnr.1997.6694
Ransohoff, R. M., and El Khoury, J. (2015). Microglia in health and disease. Cold Spring Harb. Perspect. Biol. 8:a020560.
Rossi, D., Brambilla, L., Valori, C. F., Crugnola, A., Giaccone, G., Capobianco, R., et al. (2005). Defective tumor necrosis factor-alpha-dependent control of astrocyte glutamate release in a transgenic mouse model of Alzheimer disease. J. Biol. Chem. 280, 42088–42096. doi: 10.1074/jbc.M504124200
Schipke, C. G., Boucsein, C., Ohlemeyer, C., Kirchhoff, F., and Kettenmann, H. (2002). Astrocyte Ca2+ waves trigger responses in microglial cells in brain slices. FASEB J. 16, 255–257. doi: 10.1096/fj.01-0514fje
Schweigmann, M., Caudal, L. C., Stopper, G., Scheller, A., Koch, K. P., and Kirchhoff, F. (2021). Versatile surface electrodes for combined electrophysiology and two-photon imaging of the mouse central nervous system. Front. Cell. Neurosci. 15:720675. doi: 10.3389/fncel.2021.720675
Sekiguchi, K. J., Shekhtmeyster, P., Merten, K., Arena, A., Cook, D., Hoffman, E., et al. (2016). Imaging large-scale cellular activity in spinal cord of freely behaving mice. Nat. Commun. 7:11450. doi: 10.1038/ncomms11450
Semyanov, A., Henneberger, C., and Agarwal, A. (2020). Making sense of astrocytic calcium signals - from acquisition to interpretation. Nat. Rev. Neurosci. 21, 551–564. doi: 10.1038/s41583-020-0361-8
Semyanov, A., and Verkhratsky, A. (2021). Astrocytic processes: from tripartite synapses to the active milieu. Trends Neurosci. 44, 781–792. doi: 10.1016/j.tins.2021.07.006
Shigetomi, E., Saito, K., Sano, F., and Koizumi, S. (2019). Aberrant calcium signals in reactive astrocytes: a key process in neurological disorders. Int. J. Mol. Sci. 20:996. doi: 10.3390/ijms20040996
Silver, J., and Miller, J. H. (2004). Regeneration beyond the glial scar. Nat. Rev. Neurosci. 5, 146–156.
Sofroniew, M. V., and Vinters, H. V. (2010). Astrocytes: biology and pathology. Acta Neuropathol. 119, 7–35. doi: 10.1007/s00401-009-0619-8
Thrane, A. S., Rangroo Thrane, V., Zeppenfeld, D., Lou, N., Xu, Q., Nagelhus, E. A., et al. (2012). General anesthesia selectively disrupts astrocyte calcium signaling in the awake mouse cortex. Proc. Natl. Acad. Sci. U.S.A. 109, 18974–18979. doi: 10.1073/pnas.1209448109
Toescu, E. C., Möller, T., Kettenmann, H., and Verkhratsky, A. (1998). Long-term activation of capacitative Ca2+ entry in mouse microglial cells. Neuroscience 86, 925–935. doi: 10.1016/s0306-4522(98)00123-7
Umpierre, A. D., Bystrom, L. L., Ying, Y., Liu, Y. U., Worrell, G., and Wu, L. J. (2020). Microglial calcium signaling is attuned to neuronal activity in awake mice. eLife 9:e56502. doi: 10.7554/eLife.56502
Verkhratsky, A. (2006). Glial calcium signaling in physiology and pathophysiology. Acta Pharmacol. Sin. 27, 773–780. doi: 10.1111/j.1745-7254.2006.00396.x
Verkhratsky, A., and Kettenmann, H. (1996). Calcium signalling in glial cells. Trends Neurosci. 19, 346–352.
Verkhratsky, A., Orkand, R. K., and Kettenmann, H. (1998). Glial calcium: homeostasis and signaling function. Physiol. Rev. 78, 99–141. doi: 10.1152/physrev.1998.78.1.99
Visentin, S., Renzi, M., Frank, C., Greco, A., and Levi, G. (1999). Two different ionotropic receptors are activated by ATP in rat microglia. J. Physiol. 519(Pt 3), 723–736. doi: 10.1111/j.1469-7793.1999.0723n.x
Wake, H., Lee, P. R., and Fields, R. D. (2011). Control of local protein synthesis and initial events in myelination by action potentials. Science 333, 1647–1651. doi: 10.1126/science.1206998
Wu, Y. W., Tang, X., Arizono, M., Bannai, H., Shih, P. Y., Dembitskaya, Y., et al. (2014). Spatiotemporal calcium dynamics in single astrocytes and its modulation by neuronal activity. Cell Calcium 55, 119–129. doi: 10.1016/j.ceca.2013.12.006
Yona, S., Kim, K. W., Wolf, Y., Mildner, A., Varol, D., Breker, M., et al. (2013). Fate mapping reveals origins and dynamics of monocytes and tissue macrophages under homeostasis. Immunity 38, 79–91. doi: 10.1016/j.immuni.2012.12.001
Keywords: spinal cord, astrocytes, microglia, Ca2+, laminectomy, slice preparation, in vivo, 2-photon laser-scanning microscopy
Citation: Rieder P, Gobbo D, Stopper G, Welle A, Damo E, Kirchhoff F and Scheller A (2022) Astrocytes and Microglia Exhibit Cell-Specific Ca2+ Signaling Dynamics in the Murine Spinal Cord. Front. Mol. Neurosci. 15:840948. doi: 10.3389/fnmol.2022.840948
Received: 21 December 2021; Accepted: 22 February 2022;
Published: 30 March 2022.
Edited by:
Stella Elkabes, Rutgers Biomedical and Health Sciences, United StatesReviewed by:
Eric Newman, University of Minnesota Twin Cities, United StatesAlexey Semyanov, Institute of Bioorganic Chemistry (RAS), Russia
Joshua R. Berlin, Rutgers Biomedical and Health Sciences, United States
Copyright © 2022 Rieder, Gobbo, Stopper, Welle, Damo, Kirchhoff and Scheller. This is an open-access article distributed under the terms of the Creative Commons Attribution License (CC BY). The use, distribution or reproduction in other forums is permitted, provided the original author(s) and the copyright owner(s) are credited and that the original publication in this journal is cited, in accordance with accepted academic practice. No use, distribution or reproduction is permitted which does not comply with these terms.
*Correspondence: Anja Scheller, YW5qYS5zY2hlbGxlckB1a3MuZXU=
‡These authors have contributed equally to this work
†ORCID: Phillip Rieder, orcid.org/0000-0002-0786-574X; Davide Gobbo, orcid.org/0000-0002-4076-2697; Gebhard Stopper, orcid.org/0000-0003-2496-4755; Anna Welle, orcid.org/0000-0001-9915-2845; Elisa Damo, orcid.org/0000-0002-1205-1097; Frank Kirchhoff, orcid.org/0000-0002-2324-2761; Anja Scheller, orcid.org/0000-0001-8955-2634
‡These authors have contributed equally to this work