
94% of researchers rate our articles as excellent or good
Learn more about the work of our research integrity team to safeguard the quality of each article we publish.
Find out more
ORIGINAL RESEARCH article
Front. Mol. Biosci., 30 July 2024
Sec. Molecular Diagnostics and Therapeutics
Volume 11 - 2024 | https://doi.org/10.3389/fmolb.2024.1449197
This article is part of the Research TopicExperimental and Computational Methods in the Development of Diagnostics and Therapeutics for Colon CancerView all 10 articles
 Federica Tambaro1†
 Giovanni Imbimbo1†
 Valentina Pace1
 Maria Ida Amabile2
 Veronica Rizzo3
 Simona Orlando1
 Giulia Lauteri4Cesarina Ramaccini1Carlo Catalano3
 Giuseppe Nigri4
 Maurizio Muscaritoli1
 Alessio Molfino1*
Background: Adipose tissue (AT) wasting in cancer is an early catabolic event with negative impact on outcomes. Circulating miRNAs may promote body weight loss and cachexia. We measured circulating miRNAs linked to AT alterations and compared their levels between i) gastrointestinal (GI) cancer patients and controls, ii) cachectic and non-cachectic cancer patients, and iii) according to adiposity level and its distribution.
Methods: Patients with GI cancer and subjects with benign diseases as controls were considered. Cachexia was assessed and adiposity evaluated by CT-scan for subcutaneous AT area (SAT), visceral AT area and the total AT area (TAT). MiRNAs involved were measured in plasma by RT-qPCR.
Results: 37 naïve GI cancer patients and 14 controls were enrolled. Patients with cachexia presented with lower SAT compared to non-cachectic (p < 0.05). In cancer patients, we found higher levels of miR-26a, miR-128, miR-155 and miR-181a vs. controls (p < 0.05). Cancer patients with BMI
Conclusion: Our data confirm a modulation of specific and different miRNAs involved in AT metabolism in cancer and cachexia. MiR-155 levels were higher in patients presenting with cachexia and low adiposity with implications in the pathogenic mechanisms and clinical consequences of GI cancer patients.
In the last years, adipose tissue derangements were indicated as active promoters of cachexia in cancer patients, with potential negative impact on patient’s survival (Al-Sawaf et al., 2023). Strong evidence showed that adipose tissue wasting often precedes the clinical diagnosis of cancer representing an early event during the disease (Babic et al., 2023). Importantly, adipose tissue has several functions other than energy storing, including release of endocrine hormones, promoting inflammation and regulating the expression of different genes, as well as energy expenditure (Cypess, 2022). In parallel, modifications in terms of quantity and quality of adipose tissue were found in the cancer cachexia phenotype (Molfino et al., 2023a). Recently, data showed that patients with gastrointestinal cancer undergoing surgery for cancer resection presented deep histomorphological alterations of adipose tissue, as well as changes in molecular markers of browning and lipolysis (Molfino et al., 2022a; Molfino et al., 2023a; Tambaro et al., 2024). Also, Taylor J et al. (2023) evaluated the cancer capacity to manipulate the endothelium in white adipose tissue and found that the intracellular pathway signaling promoting adipose tissue wasting was modulated. In this light, cancer-released factors are promising agents to target for the treatment of cancer cachexia. Among them, miRNAs were extensively studied for their capacity to modulate gene expression. Also, miRNAs may act distally being transported in exosomes as endocrine factors and possibly serving as biomarkers in some clinical settings, including cancer (Belli et al., 2021). Importantly, Tomou T et al. showed that adipose tissue represents an important source of circulating exosomal miRNAs, acting as adipokines (Thomou et al., 2017).
In cancer, some miRNAs were found to be potentially implicated in adipose tissue metabolism and wasting. Recently, among others, miR-26a-5p, miR-128, miR-144, miR-181a-5p, and miR-155 were identified as potential regulator of adipose tissue metabolism, such as lipolysis, browning of WAT, and adipogenesis (Tao et al., 2015; Chen et al., 2018; Kim et al., 2020; Hongfang et al., 2023), all phenomena deeply involved in the development of cancer cachexia and therefore of interest in the setting of gastrointestinal cancer.
However, data on the association between these miRNAs and cancer cachexia and adipose tissue wasting in humans are still scanty or lacking.
For this reason, by this study we aimed to evaluate differences in specific circulating miRNAs profile, linked to adipose tissue alterations between i) cancer patients and controls, ii) cachectic and non-cachectic cancer patients, and iii) according to adiposity level (low or high) and distribution assessed by CT-scan.
We conducted a cross-sectional study on patients with a new diagnosis of gastrointestinal cancer (gastric, colon and pancreatic cancer), known to be frequently associated with cachexia (Baracos et al., 2018), eligible for surgical tumor resection, and controls undergoing surgery for non-malignant diseases. The enrollment was carried out at the Department of Medical and Surgical Science of Sapienza University of Rome, Italy. The experiments were conducted at the Department of Translational and Precision Medicine of Sapienza University of Rome, Italy.
The inclusion criteria of this study were age ≥18 years; recent diagnosis of cancer (≤4 weeks); not having received anticancer or anti-inflammatory treatments before surgery; the ability to provide signed informed consent. Exclusion criteria were the presence of coexisting conditions inducing malnutrition such as infections, liver failure, renal failure, heart failure, rheumatologic disorders, clear signs of malabsorption or intestinal occlusion, as well as dysphagia. The study was conducted according to the Declaration of Helsinki and approved by the local Ethics Committee (Sapienza University, Azienda Sant’Andrea Hospital, Rome, Italy—prot. n. 167_2017). Written informed consent was obtained by all the participants enrolled in the study.
At first study visit, we collected demographic information and patient’s medical history, as well as data on the staging and histology of the cancer. We registered body weight (kg) and height (m), calculated the body mass index (BMI, kg/m2) and asked for usual weight and unvoluntary body weight loss in the previous 6 months. Cachexia was diagnosed according to the Fearon’s criteria (Fearon et al., 2011).
In fasting condition, we obtained blood samples in EDTA tubes to measure inflammatory and nutritional biomarkers, such as serum C-reactive protein (CRP) and albumin with standard laboratory techniques.
Using CT scans, we measured the abdominal fat area at the level of the third lumbar vertebra (L3), quantifying both the total adipose tissue (TAT) and visceral adipose tissue (VAT), as previously shown (Erdem et al., 2019; Molfino et al., 2022b). The SAT area at the same level was calculated, subtracting VAT from TAT. We defined high or low level of adiposity based on the median values of SAT, VAT and TAT (over the median: high; below the median: low). This approach was previously implemented in the setting of adipose tissue wasting (Abdallah et al., 2023).
OsiriX Lite (v11.0.3, Bernex, Switzerland) was used for the abdominal fat composition analysis.
To analyze circulating miRNAs profiles, fasting blood samples were collected prior to the surgical procedure in EDTA Vacutainer® tubes and centrifuged at 3,000 rpm for 15 min at 4°C. Supernatant plasma was immediately aliquoted into cryovials and stored at −80°C until further analysis.
Total RNA was extracted from plasma samples (250 μL/sample) using miRNeasy Serum/Plasma Kit (Qiagen, Germantown, MD, United States) according to the manufacturer’s instructions. RNA quantification was performed using Multiskan Sky spectrophotometer (Thermo Fisher Scientific, Waltham, MA, United States). cDNA was synthetized from 10 ng of total RNA using the TaqMan Advanced miRNA cDNA Synthesis kit (Applied Biosystems, Thermo Fisher Scientific, Waltham, MA, United States) following the manufacturer’s instructions.
Quantitative real-time PCR was performed with TaqMan Fast Advanced Master Mix (Applied Biosystems, Thermo Fisher Scientific, Waltham, MA, United States), using the QuantStudio® Real Time PCR (Applied Biosystems, Thermo Fisher Scientific, Waltham, MA, United States). Quantification was performed using the following specific TaqMan miRNA Assay (Applied Biosystems, Thermo Fisher Scientific, Waltham, MA, United States) probes: hsa-miR-26a-5p (478926_mir); hsa-miR-128-3p (477892_mir); hsa-miR-144-3p (477913_mir); has-miR-155-3p (477926_mir); hsa-miR-181a-5p (477857_mir). Data were normalized to hsa-miR-16-5p (477860_mir) used as the internal control. Resulting data were analyzed using SDS2.4 Software (Applied Biosystems, Bedford, MA, United States), and fold-change was determined by using the 2−ΔΔCT, as previously described (Schmittgen and Livak, 2008). All reactions were performed using three biological replicates and all the experiments were performed in duplicate.
Data are presented as the mean ± standard deviation (SD) or standard error of the mean (SEM) and median with interquartile range (25th and 75th percentile) for continuous normally and non-normally distributed variables, as appropriate. The normal/non-normal distribution was assessed by Shapiro-Wilk test. Student’s t-test and One-way ANOVA test or Mann–Whitney test and Kruskal–Wallis test were used for normally distributed data or non-normally distributed data, respectively. The Spearman’s coefficient was used to determine the correlation between miRNA expression and BMI. A p-value <0.05 was considered statistically significant. IBM® SPSS Statistics version 26 and Graphpad Prism 5.0 (San Diego, California, United States) were employed in the calculation.
We enrolled a total of 37 gastrointestinal cancer patients (23 male), affected by colorectal (n = 32; 21 male), gastric (n = 4; 1 male) and pancreatic cancers (n = 1, male). The mean age was 71.6 ± 11.9 years, and BMI (kg/m2) was 24.1 ± 3.8.
Control group included 14 patients undergoing surgery for benign diseases (including cholecystectomy, abdominal hernia and cysts), with a mean age of 58.1 ± 14.2 years and a BMI of 25.0 ± 3.3.
Cancer patients were older than controls (p = 0.001) and BMI was not different between the two groups. The participant’s characteristics are shown in Table 1.
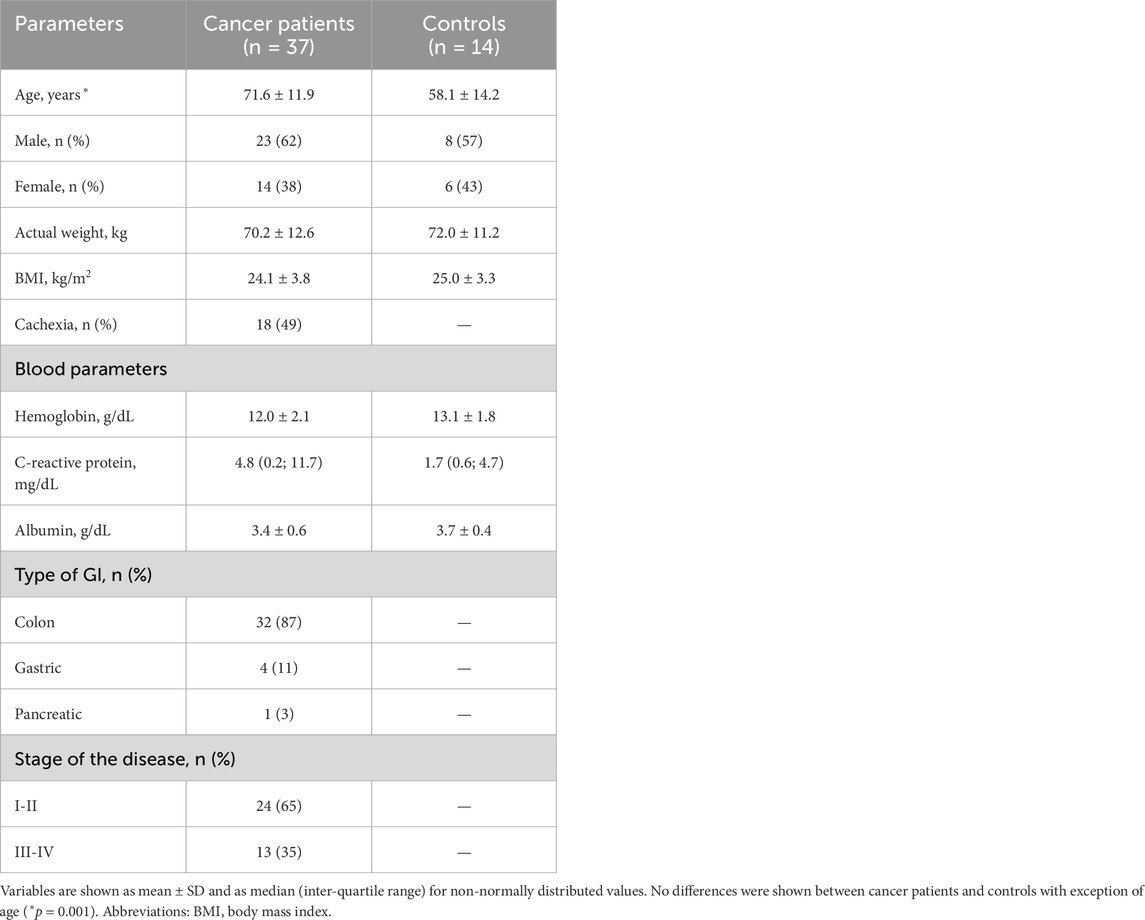
Table 1. Participant’s characteristics.
In cancer patients, cachexia was diagnosed in 18 out of 37 cancer patients (49%). Patients with cachexia compared to non-cachectic presented with a decreased BMI (22.8 ± 3.8 vs. 25.3 ± 3.6, p = 0.044).
The mean values (cm2) of SAT, VAT and TAT in cancer patients were 182.6 ± 72.3, 152.8 ± 86.7 and 335.5 ± 145.2, respectively.
In cachectic patients, we observed lower SAT compared to non-cachectic (157.6 ± 63.7 vs. 206.2 ± 73.5, p = 0.039) (Table 2), but no difference was seen in VAT and TAT (Table 2).
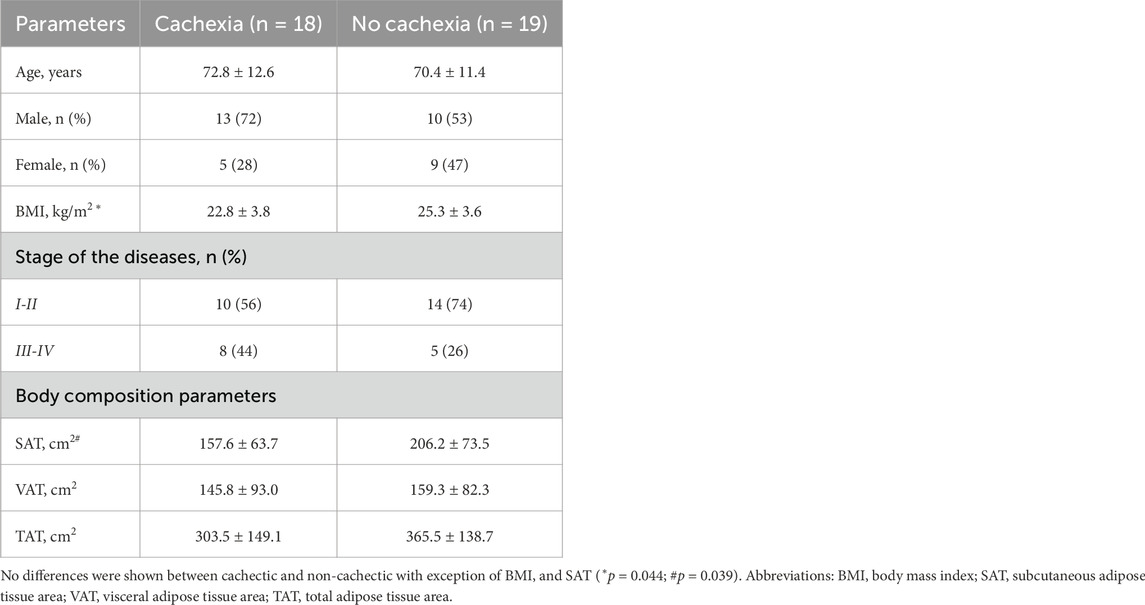
Table 2. Differences between cachectic and non-cachectic cancer patients in clinical and adiposity parameters.
In all cancer patients, BMI strongly and positively correlated with SAT (r = 0.77, p < 0.001), VAT (r = 0.64, p < 0.001) and TAT (r = 0.74, p < 0.001). Other clinical characteristics are shown in Table 2.
In Figure 1, we show the differences in plasma miRNAs between cancer patients and controls. In particular, in patients with cancer we found higher levels of miR-26a, miR-128, miR-155 and miR-181a with respect to controls (p < 0.05) (Figure 1). No differences were observed in miR-144 between the two groups (Figure 1). In addition, in cancer patients miR-128 negatively correlated with BMI (rho = −0.380, p = 0.022) (Figure 2), whereas no significant correlations were present between BMI and other miRNAs tested (Figure 2). No differences were observed in the miRNAs levels according to cancer stage (data not shown).
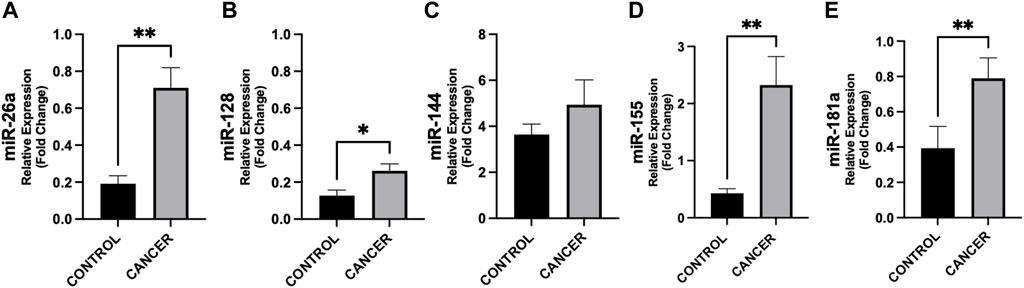
Figure 1. Differences in circulating miRNAs between cancer patients and controls. Circulating miRNAs levels were analyzed by quantitative Real Time PCR from gastrointestinal cancer patients (n = 37) and control group (n = 14). Data show higher expression of miR-26a (p = 0.002) (A), −128 (p = 0.047) (B), −155 (p = 0.004) (D), and −181a (p = 0.007) (E) in cancer with respect to controls. No difference was observed in miR-144 levels in cancer patients vs. controls (C). Data were normalized against the miR-16 from two biological replicates. *p < 0.05, **p ≤ 0.01, ***p ≤ 0.001.
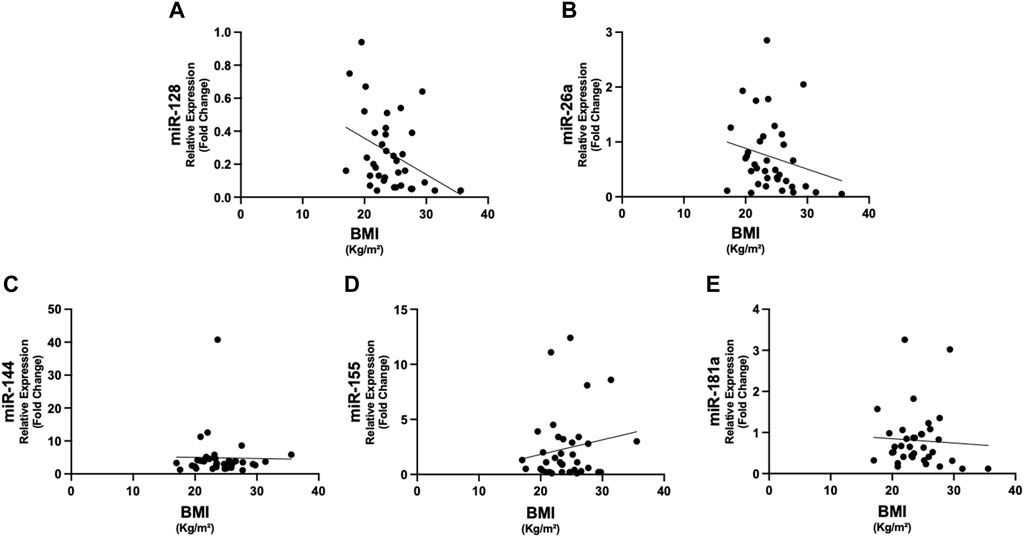
Figure 2. Correlations between circulating miRNAs and BMI in cancer patients. The expression of miR-128 showed negative correlation with BMI (rho = −0.380, p = 0.022) (A). No significant correlations were present between the other miRNAs and BMI (B–E). Abbreviations: BMI, body mass index.
According to BMI classes, patients with BMI < 25 presented with higher plasma levels of miR-26a with respect to cancer patients with BMI
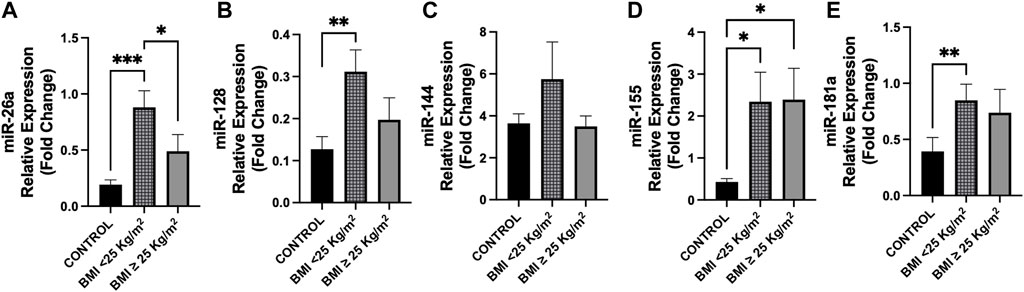
Figure 3. Differences in circulating miRNAs between cancer patients and controls according to BMI classes. Circulating miRNAs levels were analyzed in cancer patients according to BMI (kg/m2) classes (BMI < 25, n = 22; BMI ≥ 25, n = 14) compared to control group (n = 14). (A) Expression levels of miR-26a were higher in cancer patients with BMI < 25 with respect to those with BMI ≥ 25 (p = 0.035) and vs. controls (p < 0.001). (B) MiR-128 showed overexpression in cancer patients with BMI < 25 vs. controls (p = 0.008), whereas no difference was observed with respect to those with BMI ≥ 25 (p = 0.071). (D,E) MiR-155 and miR-181a levels were higher in cancer patients with BMI < 25 compared to controls (p = 0.010 and p = 0.003, respectively), whereas miR-155 levels were higher in cancer patients with BMI ≥ 25 vs. controls (p = 0.017). (C) No differences were observed in miR-144 levels between groups. *p < 0.05, **p ≤ 0.01, ***p ≤ 0.001. Abbreviations: BMI, body mass index.
In Figure 4, we show the differences in plasma miRNAs between cancer patients with and without cachexia and controls. In particular, plasma levels of miR-26a resulted higher in cachectic patients (p = 0.007), as well as in non-cachectic (p = 0.005) vs. controls; this was also observed for miR-181a (p < 0.05) (Figure 4).
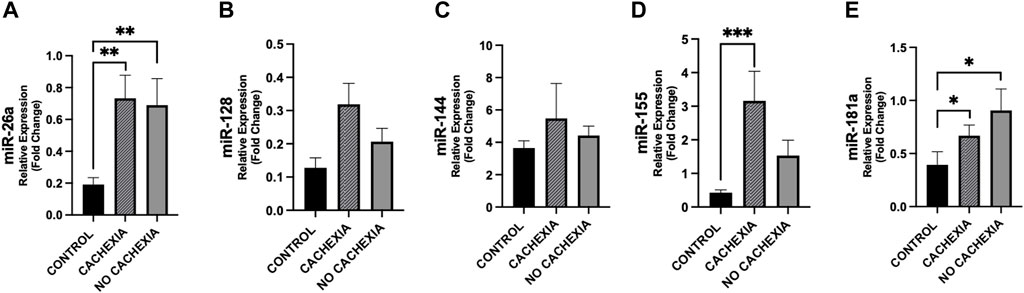
Figure 4. Differences in circulating miRNAs among cachectic and non-cachectic cancer patients and controls. Circulating miRNAs levels were analyzed in cancer patients with cachexia (n = 18), without cachexia (n = 19) and controls (n = 14). Data show higher expression of miR-26a (A), miR-155 (D) and miR-181 (E) in patients with cachexia (p = 0.005, p = 0.001 and p = 0.023, respectively) with respect to controls and higher expression of miR-26a (A), and miR-181 (E) in cancer patients without cachexia (p = 0.007 and p = 0.012, respectively) with respect to controls. For miR-128, we observed a trend of increased expression in cachectic patients vs. controls (p = 0.057) (B). No difference was observed in miR-144 levels in cancer patients with/without cachexia vs. controls (C). *p < 0.05, **p ≤ 0.01, ***p ≤ 0.001.
Differences between cachectic patients and controls were also found for miR-155 (p < 0.001) and did not reach the significance between non-cachectic and controls (p = 0.072) (Figure 4). Also, miR-155 showed a trend of increase in cachectic compared to non-cachectic patients (p = 0.087) (Figure 4). No significant differences were seen in miR-128 and miR-144 between groups (Figure 4).
According to adiposity level (low vs. high median values of VAT, SAT, and TAT, resulting as follows: 130.70, 167.57 and 322.56 cm2), we observed for some miRNAs significant differences between cancer patients and controls (Figure 5). No differences were found between cancer patients with low vs. high adiposity (Figure 5).

Figure 5. Differences in circulating miRNAs according to adiposity level among cancer patients and in controls. We analyzed the data according to the median level of adiposity, as follows: low (n = 19) vs. high (n = 18) of VAT (median: 130.70 cm2), SAT (median: 167.57 cm2), and TAT (median: 322.56 cm2) and in controls (n = 14). [(A), from left to right] Data show higher expression of miR-26a (p = 0.003), miR-155 (p = 0.004) and miR-181 (p = 0.023) in cancer patients with low VAT vs. controls and higher expression of these miRs in cancer patients with high VAT vs. controls (p = 0.011, p = 0.024, p = 0.012, respectively) [(B), from left to right] Expression levels of miR-26a, miR-155 and miR-181 were higher in cancer patients with low SAT vs. controls (p = 0.004, p = 0.006 and p = 0.016, respectively) and were also significantly higher in cancer patients with high SAT vs. controls (p = 0.010, p = 0.019 and p = 0.018, respectively). [(C), from left to right] Considering TAT, we observed that miR-26a, miR-155 and miR-181 were higher in cancer patients with low TAT vs. controls (p = 0.008, p = 0.001 and p = 0.022, respectively) and that miR-26a and miR-181a were higher in cancer patients with high TAT vs. controls (p = 0.004 and p = 0.012, respectively). *p < 0.05, **p ≤ 0.01, ***p ≤ 0.001. Abbreviations: VAT, visceral adipose tissue; SAT, subcutaneous adipose tissue; TAT, total adipose tissue.
Analyzing the differences between cachexia/no-cachexia groups with low or high TAT, we observed that miR-155 was higher in cachectic patients with low TAT compared to those without cachexia and high TAT (p = 0.036) (Figure 6). Finally, miR-155 was higher in cachectic patients, regardless of low or high TAT, when compared to controls (Figure 6). Moreover, miR-155 expression was increased in cancer patients without cachexia with low TAT compared to those non-cachectic with high TAT (Figure 6). These differences were not present for the other miRNAs (Figure 6).
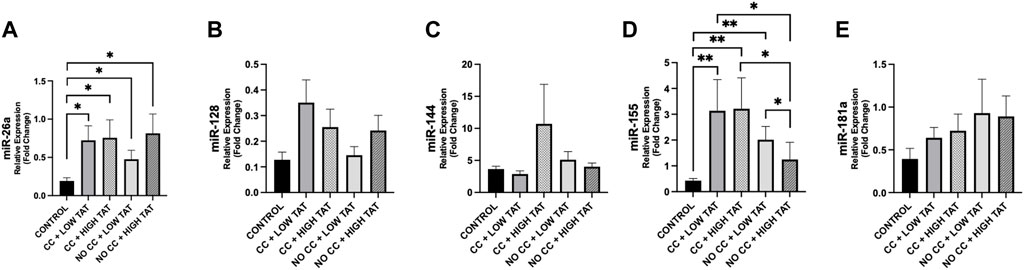
Figure 6. Differences in circulating miRNAs according to TAT in cachectic and non-cachectic cancer patients. We analyzed the circulating miRNAs according to the presence/absence of cancer cachexia and low/high levels of TAT (based on median value of 322.56 cm2) in cancer patients vs. controls. Groups are the following: cancer patients with cachexia and low TAT (n = 12); cancer patients with cachexia and high TAT (n = 6); cancer patients without cachexia and low TAT (n = 7); cancer patients without cachexia and high TAT (n = 12); controls (n = 14). (A) MiR-26a showed different modulation in cancer groups vs. controls (p < 0.05). (D) MiR-155 showed different levels between cancer groups and controls (p < 0.05) and we observed a significant downregulation of this miRNAs between cancer patients with cachexia and high TAT vs. cancer patients without cachexia and high TAT (p = 0.031) and higher levels in cancer patients without cachexia and low TAT compared to those with high TAT (p = 0.036). (B,C,E) No significance was observed in other miRNAs. *p < 0.05, **p ≤ 0.01, ***p ≤ 0.001. Abbreviations: TAT, total adipose tissue; CC, cancer cachexia; NO CC, no cancer cachexia.
Our study confirms the presence of clinical and nutritional changes in patients with gastrointestinal cancer undergoing surgery for cancer resection. In fact, although the main nutritional (anthropometric) parameter routinely used in clinic - BMI - was not different between cancer patients and controls, the presence of cachexia was highly prevalent (49%) in cancer patients. This is of particular interest taking into account that the patients of the present cohort were at their first cancer diagnosis, eligible to surgery and did not yet receive anticancer treatments. Our results indicate that patients satisfying the Fearon’s criteria for cachexia (Fearon et al., 2011) showed reduced SAT, suggesting the presence of adipose tissue metabolic derangements since the early phase of cancer disease. Interestingly, the phenomenon of adipose atrophy occurring in cancer was described even preceding the clinical diagnosis of pancreatic cancer (Babic et al., 2023). In another study, during the early phase of cancer disease, we described several histological alterations in SAT, including decreased adipocyte size, increased fibrosis and increased inflammatory infiltration in cachectic patients (Molfino et al., 2022b). Moreover, several evidence support that an increased lipolysis and browning of WAT are crucial in promoting cancer cachexia (Baracos et al., 2018; Hu et al., 2023; Geppert and Rohm, 2024).
Regarding the complex pathophysiology of adipose tissue changes and atrophy in cancer, the implication of circulating miRNAs has been recently supported by different studies (Di et al., 2021; Li et al., 2022; Hu et al., 2023). In our analyses, we found higher circulating levels of miR-26a, miR-128, miR-155 and miR-181a in cancer group compared to controls, and when observing the modulation of these miRNAs according to BMI classes, we found in patients with BMI < 25 kg/m2 that miR-26a was overexpressed compared to those defined as overweight or obese based on BMI
In line with our results, a recent study investigating circulating and visceral adipose miRNAs showed a downregulation of miR-26a in both plasma and VAT in patients with obesity compared with patients with normal weight, suggesting a potential role of this miRNA in regulating adiposity (Kim et al., 2020). However, in another study miR-128 overexpression was shown to play a regulatory role in adipose tissue metabolism, in particular by controlling adipogenesis and lipolysis (Chen et al., 2018). However, conclusive data on these miRNAs are still lacking in the literature.
In addition, we observed significant differences of miR-26 and miR-181a according to the presence of cachexia compared to controls, although the difference was also significant between non-cachectic and control groups. For this reason, at this time it is not possible to indicate a clear implication of these miRNAs in the pathophysiology of cancer cachexia. However, miR-155 showing a similar behavior of miR-26a and miR-181a tended to be modulated in cachectic when compared to non-cachectic patients, although this result should be verified in larger sample.
MiR-155 appears of particular interest in adipose tissue wasting based on the data showing a potential role in promoting derangements of adipose tissue metabolism, by the suppression of adipogenesis and promotion of browning process in gastrointestinal and breast cancers (Liu et al., 2022; Sun et al., 2023). Also, Yehia et al., showed upregulation of miR-155 in cachectic patients with lung and pancreatic cancer (Yehia et al., 2021).
Body composition analysis, specifically addressing the level of adiposity in our cancer group, revealed a significant reduction in terms of SAT between cachectic and non-cachectic cancer patients. The absence of difference in VAT is likely due to the early stage of cancer disease. Our observation appears interesting considering that other authors found that SAT is implicated in wasting condition during the early phase of catabolic status. In fact, Sah et al. observed in patients with pancreatic cancer a loss of SAT that started 18 months before the cancer diagnosis, anticipating visceral adipose tissue and skeletal muscle atrophy (Sah et al., 2019). Atrophy of SAT was at least in part associated with an increased expression of UCP1 in SAT representing a potential biomarker of early adipose tissue metabolic derangements (Sah et al., 2019), but no information on miRNA profiling in this setting was available.
In our study, when assessing the differences between cachectic patients with low or high TAT, we found that only miR-155 was higher in those with low TAT compared to patients without cachexia and high adiposity. This may suggest an implication of miR-155 in patients with high catabolic status.
Our study has limitations, including the type of gastrointestinal cancer patients, mainly represented by colorectal cancer. Cancer group was older than controls and this difference in age may affect adipose tissue distribution. The inclusion of other gastrointestinal tract cancer, in particular stomach and pancreas, may reveal additional miRNAs modulation that may occur in cancer and in cachexia. The level of adiposity was not assessed in control group and this information may be clinically relevant when comparing adipose tissue changes and its distribution and miRNAs profile in non-catabolic/non cancer conditions. However, CT scan for body composition analysis was not possible for ethical reasons in our controls. We selected specific miRNAs for adipose tissue metabolism, but Next-generation Sequencing (NGS) panel may allow for the identification of a larger number of miRNAs potentially involved in changes in adipose tissue. However, our methodological approach based on analyzing specific miRNAs known to be implicated in biological processes was previously implemented (Lin et al., 2022; Molfino et al., 2023b). The analysis in the subgroups (e.g., cachectic with low or high adiposity) was conducted in small number of participants and need further verification.
In the present study, we observed modulations in specific miRNAs involved in adipose tissue metabolism and cachexia in plasma of cancer patients, according to the presence of cachexia and low adiposity. Among others, miR-155 was shown to be modulated according to the presence of both cachexia and low adiposity evaluated by CT scan. To unveil the involvement of miRNAs in the pathophysiology of cachexia may allow for a prompt and early diagnosis of nutritional and metabolic alterations in cancer providing the rationale for innovative treatments.
The raw data supporting the conclusions of this article will be made available by the authors, without undue reservation.
The studies involving humans were approved by Sapienza University of Rome - Azienda Policlinico Umberto I - Ospedale Sant’Andrea- Rome, Italy. The studies were conducted in accordance with the local legislation and institutional requirements. Written informed consent for participation in this study was provided by the participants’ legal guardians/next of kin.
FT: Conceptualization, Data curation, Formal Analysis, Funding acquisition, Investigation, Methodology, Writing–original draft. GI: Data curation, Formal Analysis, Investigation, Software, Writing–original draft. VP: Formal Analysis, Investigation, Methodology, Writing–original draft. MA: Conceptualization, Data curation, Writing–original draft. VR: Formal Analysis, Software, Writing–original draft. SO: Methodology, Writing–original draft. GL: Investigation, Writing–original draft. CR: Methodology, Writing–original draft. CC: Software, Writing–original draft. GN: Investigation, Writing–review and editing. MM: Conceptualization, Supervision, Writing–review and editing. AM: Conceptualization, Formal Analysis, Funding acquisition, Investigation, Methodology, Resources, Supervision, Writing–original draft, Writing–review and editing.
The author(s) declare that financial support was received for the research, authorship, and/or publication of this article. This study was supported by intramural research grants from Sapienza University of Rome, Italy, received by AM (Grant n. RG120172B8DFB08E; Grant n. RG11816427B021CF; Grant n. RG1221816C673852) and Initial Grant Project received by FT (Grant n. AR1221816C72B9CD).
FT and SO contributed to this study as a recipient of the PhD program in Innovative Biomedical Technologies in Clinical Medicine, at Sapienza University of Rome, Italy. VP contributed as recipient of research scholarship from Sapienza University of Rome (PI: AM).
The authors declare that the research was conducted in the absence of any commercial or financial relationships that could be construed as a potential conflict of interest.
The author(s) declared that they were an editorial board member of Frontiers, at the time of submission. This had no impact on the peer review process and the final decision.
All claims expressed in this article are solely those of the authors and do not necessarily represent those of their affiliated organizations, or those of the publisher, the editors and the reviewers. Any product that may be evaluated in this article, or claim that may be made by its manufacturer, is not guaranteed or endorsed by the publisher.
Abdallah, N. H., Nagayama, H., Takahashi, N., Gonsalves, W., Fonder, A., Dispenzieri, A., et al. (2023). Muscle and fat composition in patients with newly diagnosed multiple myeloma. Blood Cancer J. 13, 185. doi:10.1038/s41408-023-00934-3
Al-Sawaf, O., Weiss, J., Skrzypski, M., Lam, J. M., Karasaki, T., Zambrana, F., et al. (2023). Body composition and lung cancer-associated cachexia in TRACERx. Nat. Med. 29, 846–858. doi:10.1038/s41591-023-02232-8
Babic, A., Rosenthal, M. H., Sundaresan, T. K., Khalaf, N., Lee, V., Brais, L. K., et al. (2023). Adipose tissue and skeletal muscle wasting precede clinical diagnosis of pancreatic cancer. Nat. Commun. 14, 4317. doi:10.1038/s41467-023-40024-3
Baracos, V. E., Martin, L., Korc, M., Guttridge, D. C., and Fearon, K. C. H. (2018). Cancer-associated cachexia. Nat. Rev. Dis. Primer 4, 17105. doi:10.1038/nrdp.2017.105
Belli, R., Ferraro, E., Molfino, A., Carletti, R., Tambaro, F., Costelli, P., et al. (2021). Liquid biopsy for cancer cachexia: focus on muscle-derived microRNAs. Int. J. Mol. Sci. 22, 9007. doi:10.3390/ijms22169007
Chen, C., Deng, Y., Hu, X., Ren, H., Zhu, J., Fu, S., et al. (2018). miR-128-3p regulates 3T3-L1 adipogenesis and lipolysis by targeting Pparg and Sertad2. J. Physiol. Biochem. 74, 381–393. doi:10.1007/s13105-018-0625-1
Cypess, A. M. (2022). Reassessing human adipose tissue. N. Engl. J. Med. 386, 768–779. doi:10.1056/NEJMra2032804
Di, W., Zhang, W., Zhu, B., Li, X., Tang, Q., and Zhou, Y. (2021). Colorectal cancer prompted adipose tissue browning and cancer cachexia through transferring exosomal miR-146b-5p. J. Cell Physiol. 236, 5399–5410. doi:10.1002/jcp.30245
Erdem, M., Möckel, D., Jumpertz, S., John, C., Fragoulis, A., Rudolph, I., et al. (2019). Macrophages protect against loss of adipose tissue during cancer cachexia. J. Cachexia Sarcopenia Muscle 10, 1128–1142. doi:10.1002/jcsm.12450
Fearon, K., Strasser, F., Anker, S. D., Bosaeus, I., Bruera, E., Fainsinger, R. L., et al. (2011). Definition and classification of cancer cachexia: an international consensus. Lancet Oncol. 12, 489–495. doi:10.1016/S1470-2045(10)70218-7
Geppert, J., and Rohm, M. (2024). Cancer cachexia: biomarkers and the influence of age. Mol. Oncol. doi:10.1002/1878-0261.13590
Hongfang, G., Khan, R., and El-Mansi, A. A. (2023). Bioinformatics analysis of miR-181a and its role in adipogenesis, obesity, and lipid metabolism through review of literature. Mol. Biotechnol. doi:10.1007/s12033-023-00894-w
Hu, Y., Liu, L., Chen, Y., Zhang, X., Zhou, H., Hu, S., et al. (2023). Cancer-cell-secreted miR-204-5p induces leptin signalling pathway in white adipose tissue to promote cancer-associated cachexia. Nat. Commun. 14, 5179. doi:10.1038/s41467-023-40571-9
Kim, N. H., Ahn, J., Choi, Y. M., Son, H. J., Choi, W. H., Cho, H. J., et al. (2020). Differential circulating and visceral fat microRNA expression of non-obese and obese subjects. Clin. Nutr. Edinb Scotl 39, 910–916. doi:10.1016/j.clnu.2019.03.033
Li, X., Du, L., Liu, Q., and Lu, Z. (2022). MicroRNAs: novel players in the diagnosis and treatment of cancer cachexia (Review). Exp. Ther. Med. 24, 446. doi:10.3892/etm.2022.11373
Lin, W., Wen, X., Li, X., Chen, L., Wei, W., Zhang, L., et al. (2022). MiR-144 regulates adipogenesis by mediating formation of C/EBPα-FOXO1 protein complex. Biochem. Biophys. Res. Commun. 612, 126–133. doi:10.1016/j.bbrc.2022.04.093
Liu, Y., Wang, M., Deng, T., Liu, R., Ning, T., Bai, M., et al. (2022). Exosomal miR-155 from gastric cancer induces cancer-associated cachexia by suppressing adipogenesis and promoting brown adipose differentiation via C/EPBβ. Cancer Biol. Med. 19, 1301–1314. doi:10.20892/j.issn.2095-3941.2021.0220
Molfino, A., Belli, R., Imbimbo, G., Carletti, R., Amabile, M. I., Tambaro, F., et al. (2022a). Evaluation of browning markers in subcutaneous adipose tissue of newly diagnosed gastrointestinal cancer patients with and without cachexia. Cancers 14, 1948. doi:10.3390/cancers14081948
Molfino, A., Beltrà, M., Amabile, M. I., Belli, R., Birolo, G., Belloni, E., et al. (2023b). Small non-coding RNA profiling in patients with gastrointestinal cancer. J. Cachexia Sarcopenia Muscle 14, 2692–2702. doi:10.1002/jcsm.13343
Molfino, A., Carletti, R., Imbimbo, G., Amabile, M. I., Belli, R., di Gioia, C. R. T., et al. (2022b). Histomorphological and inflammatory changes of white adipose tissue in gastrointestinal cancer patients with and without cachexia. J. Cachexia Sarcopenia Muscle 13, 333–342. doi:10.1002/jcsm.12893
Molfino, A., Imbimbo, G., and Muscaritoli, M. (2023a). Metabolic and histomorphological changes of adipose tissue in cachexia. Curr. Opin. Clin. Nutr. Metab. Care 26, 235–242. doi:10.1097/MCO.0000000000000923
Sah, R. P., Sharma, A., Nagpal, S., Patlolla, S. H., Sharma, A., Kandlakunta, H., et al. (2019). Phases of metabolic and soft tissue changes in months preceding a diagnosis of pancreatic ductal adenocarcinoma. Gastroenterology 156, 1742–1752. doi:10.1053/j.gastro.2019.01.039
Schmittgen, T. D., and Livak, K. J. (2008). Analyzing real-time PCR data by the comparative C(T) method. Nat. Protoc. 3, 1101–1108. doi:10.1038/nprot.2008.73
Sun, S., Wang, Z., Yao, F., Sun, K., Li, Z., Sun, S., et al. (2023). Breast cancer cell-derived exosome-delivered microRNA-155 targets UBQLN1 in adipocytes and facilitates cancer cachexia-related fat loss. Hum. Mol. Genet. 32, 2219–2228. doi:10.1093/hmg/ddad055
Tambaro, F., Imbimbo, G., Ferraro, E., Andreini, M., Belli, R., Amabile, M. I., et al. (2024). Assessment of lipolysis biomarkers in adipose tissue of patients with gastrointestinal cancer. Cancer Metab. 12, 1. doi:10.1186/s40170-023-00329-9
Tao, C., Huang, S., Wang, Y., Wei, G., Zhang, Y., Qi, D., et al. (2015). Changes in white and brown adipose tissue microRNA expression in cold-induced mice. Biochem. Biophys. Res. Commun. 463, 193–199. doi:10.1016/j.bbrc.2015.05.014
Taylor, J., Uhl, L., Moll, I., Hasan, S. S., Wiedmann, L., Morgenstern, J., et al. (2023). Endothelial Notch1 signaling in white adipose tissue promotes cancer cachexia. Nat. Cancer 4, 1544–1560. doi:10.1038/s43018-023-00622-y
Thomou, T., Mori, M. A., Dreyfuss, J. M., Konishi, M., Sakaguchi, M., Wolfrum, C., et al. (2017). Adipose-derived circulating miRNAs regulate gene expression in other tissues. Nature 542, 450–455. doi:10.1038/nature21365
Yehia, R., Schaalan, M., Abdallah, D. M., Saad, A. S., Sarhan, N., and Saleh, S. (2021). Impact of TNF-α gene polymorphisms on pancreatic and non-small cell lung cancer-induced cachexia in adult Egyptian patients: a focus on pathogenic trajectories. Front. Oncol. 11, 783231. doi:10.3389/fonc.2021.783231
Keywords: adiposity, miRNAs, cachexia, cancer, CT-scan, body composition
Citation: Tambaro F, Imbimbo G, Pace V, Amabile MI, Rizzo V, Orlando S, Lauteri G, Ramaccini C, Catalano C, Nigri G, Muscaritoli M and Molfino A (2024) Circulating adipose-tissue miRNAs in gastrointestinal cancer patients and their association with the level and type of adiposity at body composition analysis. Front. Mol. Biosci. 11:1449197. doi: 10.3389/fmolb.2024.1449197
Received: 14 June 2024; Accepted: 12 July 2024;
Published: 30 July 2024.
Edited by:
Valeria Guglielmi, University of Rome Tor Vergata; Unit of Internal Medicine and Obesity Center, ItalyReviewed by:
Jolanta Dardzińska, Medical University of Gdańsk, PolandCopyright © 2024 Tambaro, Imbimbo, Pace, Amabile, Rizzo, Orlando, Lauteri, Ramaccini, Catalano, Nigri, Muscaritoli and Molfino. This is an open-access article distributed under the terms of the Creative Commons Attribution License (CC BY). The use, distribution or reproduction in other forums is permitted, provided the original author(s) and the copyright owner(s) are credited and that the original publication in this journal is cited, in accordance with accepted academic practice. No use, distribution or reproduction is permitted which does not comply with these terms.
*Correspondence: Alessio Molfino, YWxlc3Npby5tb2xmaW5vQHVuaXJvbWExLml0
†These authors have contributed equally to this work and share first authorship
Disclaimer: All claims expressed in this article are solely those of the authors and do not necessarily represent those of their affiliated organizations, or those of the publisher, the editors and the reviewers. Any product that may be evaluated in this article or claim that may be made by its manufacturer is not guaranteed or endorsed by the publisher.
Research integrity at Frontiers
Learn more about the work of our research integrity team to safeguard the quality of each article we publish.