
95% of researchers rate our articles as excellent or good
Learn more about the work of our research integrity team to safeguard the quality of each article we publish.
Find out more
ORIGINAL RESEARCH article
Front. Mol. Biosci. , 30 November 2023
Sec. Molecular Diagnostics and Therapeutics
Volume 10 - 2023 | https://doi.org/10.3389/fmolb.2023.1279854
This article is part of the Research Topic Liquid Biopsy in Oncology: Opportunity and Challenges View all 6 articles
 Agnese Brokāne1
 Cristina Bajo-Santos1
 Pawel Zayakin1Alberts Belovs2Juris Jansons2Vilnis Lietuvietis2
 Elena S. Martens-Uzunova3
 Guido W. Jenster3
 Aija Linē1*
Introduction: Prostate cancer (PCa), one of the most prevalent malignancies affecting men worldwide, presents significant challenges in terms of early detection, risk stratification, and active surveillance. In recent years, liquid biopsies have emerged as a promising non-invasive approach to complement or even replace traditional tissue biopsies. Extracellular vesicles (EVs), nanosized membranous structures released by various cells into body fluids, have gained substantial attention as a source of cancer biomarkers due to their ability to encapsulate and transport a wide range of biological molecules, including RNA. In this study, we aimed to validate 15 potential RNA biomarkers, identified in a previous EV RNA sequencing study, using droplet digital PCR.
Methods: The candidate biomarkers were tested in plasma and urinary EVs collected before and after radical prostatectomy from 30 PCa patients and their diagnostic potential was evaluated in a test cohort consisting of 20 benign prostate hyperplasia (BPH) and 20 PCa patients’ plasma and urinary EVs. Next, the results were validated in an independent cohort of plasma EVs from 31 PCa and 31 BPH patients.
Results: We found that the levels of NKX3-1 (p = 0.0008) in plasma EVs, and tRF-Phe-GAA-3b (p < 0.0001) tRF-Lys-CTT-5c (p < 0.0327), piR-28004 (p = 0.0081) and miR-375-3p (p < 0.0001) in urinary EVs significantly decreased after radical prostatectomy suggesting that the main tissue source of these RNAs is prostate and/or PCa. Two mRNA biomarkers—GLO1 and NKX3-1 showed promising diagnostic potential in distinguishing between PCa and BPH with AUC of 0.68 and 0.82, respectively, in the test cohort and AUC of 0.73 and 0.65, respectively, in the validation cohort, when tested in plasma EVs. Combining these markers in a biomarker model yielded AUC of 0.85 and 0.71 in the test and validation cohorts, respectively. Although the PSA levels in the blood could not distinguish PCa from BPH in our cohort, adding PSA to the mRNA biomarker model increased AUC from 0.71 to 0.76.
Conclusion: This study identified two novel EV-enclosed RNA biomarkers–NKX3-1 and GLO1–for the detection of PCa, and highlights the complementary nature of GLO1, NKX3-1 and PSA as combined biomarkers in liquid biopsies of PCa.
PCa is the second leading cause of cancer in men, with over 1.4 million newly diagnosed cases in 2020 (Sung et al., 2021). Due to its highly heterogenous nature, the course of the disease tends to vary between patients, with some developing aggressive forms of cancer with a high risk of metastasis and some having a slowly progressing disease without the need for active treatment (Flores-Téllez and Baena, 2022). Currently, diagnostic examinations include the measurement of PSA levels in the blood, digital rectal examination, and histological analysis of transrectal ultrasound scan (TRUS)-guided biopsies (Descotes, 2019; Lomas and Ahmed, 2020). However, these tests are known to pose some detrimental issues - PSA tests have low specificity and are unable to differentiate PCa from benign prostate hyperplasia (BPH), whereas histological analysis of biopsy material tends to be subjective and has a high risk of infection at the puncture site (Loeb et al., 2013; Ahmed et al., 2017; Ilic et al., 2018). Furthermore, a new problem has arisen in recent decades - overdiagnosis and overtreatment of PCa, since the current diagnostic approaches cannot reliably differentiate between fast-progressing cancer requiring aggressive treatment and indolent forms of the disease that can be managed by active surveillance (Loeb et al., 2014). Therefore, more precise and less invasive tools for the detection and monitoring of PCa still represent unmet clinical needs in the management of PCa.
In recent years, liquid biopsies have emerged as a popular, non-invasive alternative to tissue biopsies. The term refers to the analysis of cancer-derived molecules in any biofluid to gain information about a potential or existing malignancy (Lu et al., 2019). Recently, extracellular vesicles (EVs) have gained distinct recognition as a potential source of biomarkers in PCa patients’ blood and urine (Hessvik et al., 2013; Li et al., 2014; Ramirez-Garrastacho et al., 2022a). EVs are heterogenous membrane-bound particles with diverse roles in cellular communication and biomolecule transport that are secreted by virtually all cell types into the extracellular space (Yáñez-Mó et al., 2015; van Niel et al., 2018). They contain proteins, lipids, nucleic acids, and various metabolites, depicting the contents of cells from which they originate (Abels and Breakefield, 2016). Furthermore, cancer-derived EVs have been shown to contain altered cargo and play a significant role in tumor development, proliferation, metastasis, and resistance to treatment (Cocks et al., 2021; Hell et al., 2021). Several studies have been carried out identifying specific PCa RNA biomarkers in plasma and urinary EVs (Nilsson et al., 2009; Samsonov et al., 2016; Foj et al., 2017; Matsuzaki et al., 2021), however, only a few of them have been validated in independent studies (Yu et al., 2021; Ramirez-Garrastacho et al., 2022a).
In a previous study, we carried out RNA sequencing analysis of plasma and urinary EVs collected before and after radical prostatectomy, and matched tumor and normal prostate tissues from 10 PCa patients to identify PCa-derived RNA biomarkers (Bajo-Santos et al., 2023). We hypothesized that the levels of PCa-derived RNA biomarkers would decrease in post-operation samples compared to pre-operation samples if a substantial fraction of the given RNA in the given biofluid comes from PCa and/or prostate, therefore we searched for EV RNAs that are overexpressed in tumor tissues, present in the pre-operation EVs above the set threshold and decrease after prostatectomy. In the current study, we aimed to validate the biomarker candidates by RT-ddPCR in independent cohorts of plasma and urine samples from PCa and BPH patients and establish their diagnostic values.
A total of 52 patients diagnosed with PCa and 51 patients diagnosed with BPH were enrolled in this study at Riga East University Hospital between October 2018 and January 2020. The patients were followed up until September 2021. The inclusion criteria for PCa patients were as follows: (1) recent diagnosis of resectable PCa confirmed through histopathological analysis TRUS-guided biopsy, (2) scheduled prostatectomy, and (3) age over 18. PCa patients were excluded if they had: (1) other concurrent oncological conditions, (2) undergone chemotherapy, radiation, or hormonal treatment prior to the study, (3) urinary tract infection during sample collection, (4) received a blood transfusion within the past 4 months, (5) long-term catheter use, or (6) inability to provide informed consent. The inclusion criteria for BPH patients were: (1) recent diagnosis of BPH confirmed through histopathological analysis TRUS-guided biopsy and (2) blood PSA level >2.5 ng/mL and <50 ng/mL. Further clinical characteristics of the patients included in this study are provided in Table 1.
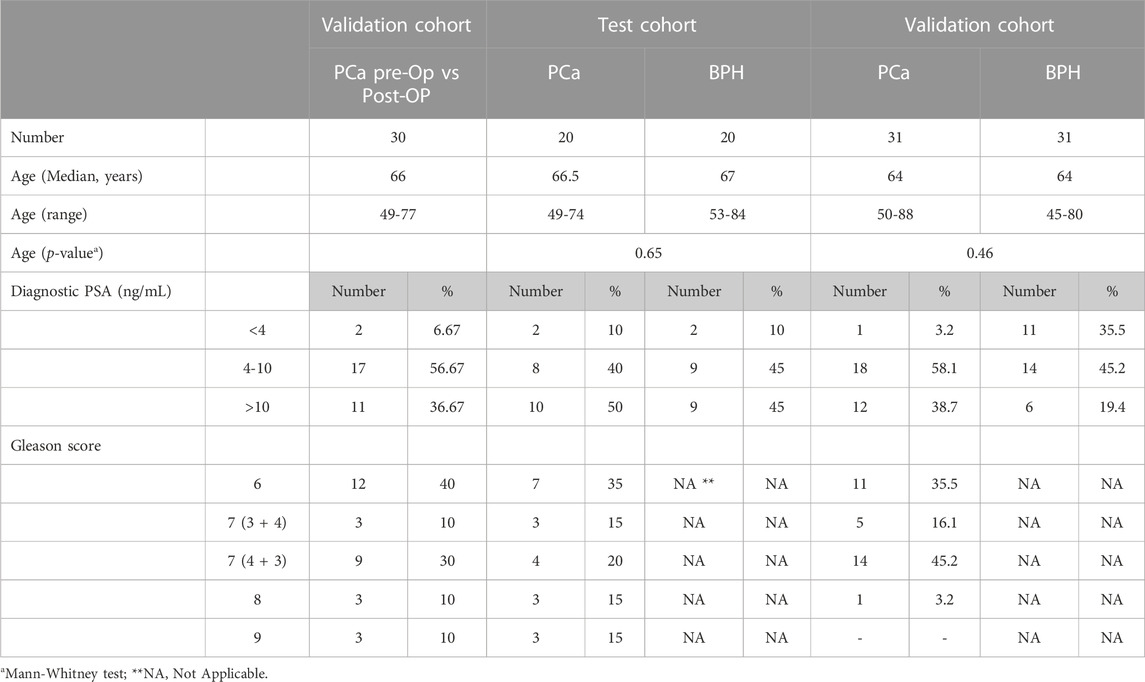
TABLE 1. Patient characteristics.
Patient samples were collected at two time points: before and 3–4 months after radical prostatectomy, denoted as Pre-Op and Post-Op, respectively. Approximately 60 mL of the first morning urine were collected from each patient and centrifuged at 2000 g for 15 min at room temperature. The resulting aliquots were stored at −80°C. Blood samples were collected in EDTA-coated tubes and processed at room temperature within 2 h after the blood draw. A two-step plasma isolation process was performed on the blood samples by 2x centrifugation at 3000 g for 10 min at room temperature. The plasma samples were aliquoted and stored at −80°C.
A uropathologist obtained tumor and normal tissue samples immediately following radical prostatectomy. One portion of the tissue samples underwent a histopathological evaluation to determine the presence or absence of tumor cells and to assess the Gleason score. The remaining portion was preserved in RNALater solution (QIAGEN) and stored at −20°C.
The study was conducted in accordance with the principles outlined in the Declaration of Helsinki. The clinical samples and information was collected after obtaining informed written consent from the patients, ensuring their anonymity. The study protocol was approved by the Latvian Central Medical Ethics Committee (decision No. 01-29.1/488).
EVs were isolated from patient plasma and urine samples using size exclusion chromatography (SEC). In a water bath, frozen urine (20 mL) and plasma (1 mL) samples were thawed at +37°C. Urine samples were centrifuged at 10 000 g for 15 min at +4°C to remove larger debris and uromodulin and concentrated up to 1 mL using 100 kDa centrifugal filters (Merck Millipore, USA). Following this, urine and plasma samples were loaded onto Sepharose CL2B 10 mL columns and the eluate was collected in 15 0.5 mL fractions. Each fraction was measured with Zetasizer Nano ZS (Malvern, UK) and fractions containing at least 70% of particles larger than 30 nm in diameter were combined and concentrated up to 100 µL using 3 kDa centrifugal filters (Merck Millipore, USA). EV samples were treated with Proteinase K (1 mg/mL) (ThermoFisher Scientific, USA) for 60 min at RT followed by treatment with RNAse A (100 ng/μL) (ThermoFisher Scientific, USA) treatment for 15 min at RT. Nanoparticle tracking analysis (NTA) using Nanosight NS500 instrument (Malvern, UK) was performed on each sample to determine the approximate size and concentration of EVs as described before (Endzeliņš et al., 2017).
RNA was extracted from EV samples using miRNeasy Micro Kit (Qiagen, Germany) following the manufacturer’s protocol. Additionally, DNase treatment was performed on the column according to the manufacturer’s instructions. The concentration of EV-RNA was measured using Agilent 2100 Bioanalyzer and RNA 6000 Pico Kit (Agilent Technologies, USA).
cDNA was synthesized using miRCURY LNA RT kit according to the manufacturer’s instructions (Qiagen, Germany). Nine µl (half of the entire yield) of RNA was used for cDNA synthesis and further diluted 1:2 in nuclease-free water (ThermoFisher Scientific, USA). Each droplet digital PCR (ddPCR) reaction containing 2 µL of diluted cDNA, 10 µL of 2x QX200 ddPCR EvaGreen Supermix (Bio-Rad, USA), 7 µL of nuclease-free water (ThermoFisher Scientific, USA) and 1 µL of primer mix (Qiagen, Germany (Supplementary Table S1) was loaded onto a DG8 cartridge (Bio-Rad, USA). Then, 70 µL of QX200 Droplet Generation Oil for EvaGreen (Bio-Rad, USA) were added to the cartridge and a DG8 gasket (Bio-Rad, USA) was hooked over the cartridge, followed by the insertion of the cartridge into a QX200 Droplet Generator (Bio-Rad, USA). 40 μL of the generated droplets were then loaded onto a clear 96-well semi-skirted PCR plate (Bio-Rad, USA) and the plate was heat sealed with a pierceable foil (Bio-Rad, USA) using ALPS 25 manual heat sealer (ThermoFisher Scientific, USA). The PCR reaction was carried out using a T100 Thermal Cycler (Bio-Rad, USA) under the following conditions: 95°C for 5 min; 40 cycles at 95°C for 30 s followed by specific primer annealing temperature (Supplementary Table S1); 4°C for 5 min; 90°C for 5 min and indefinite hold at 4°C. The program was run at a 2°C/sec rampage rate. After PCR, the plate was allowed to cool for at least 2 h at +4°C and then was read using a QX200 Droplet Reader (Bio-Rad, USA). Results were analyzed using QuantaSoft Software (Bio-Rad, USA). Before performing RT-ddPCR experiments, the optimal annealing temperature for each primer pair was determined by running PCR reactions on a temperature gradient (50°C-60°C).
Statistical analyses were performed using GraphPad Prism 9.0 (GraphPad, USA) and RStudio 4.2 (RStudio Team, USA). Comparison between PCa Pre-Op vs. Post-Op data was assessed using Wilcoxon matched-pairs signed rank test. Mann-Whitney test was used for comparing the biomarker levels in independent groups. RNA biomarker models were constructed with glm package (Venables and Ripley, 2002) by fitting generalized linear models based on Gaussian identity function. To assess NKX3-1 expression level in the datasets available at The Cancer Genome Atlas (TCGA), normalized gene expression values (TPM) were obtained from the Gene Expression Omnibus (accession number GSE62944) (Rahman et al., 2015). We selected the Prostate Adenocarcinoma (PRAD) NKX3-1 subset of data and tested it by Mann–Whitney test.
EVs were isolated from PCa and BPH patients’ plasma and urine samples following a previously established protocol (Endzeliņš et al., 2017). All samples were categorized into the following groups: (1) RNASeq validation cohort (30 PCa Pre-Op vs Post-Op; plasma and urine), aimed to validate the results of the previous EV-RNA sequencing study (Bajo-Santos et al., 2023); (2) test cohort (20 PCa Pre-Op vs 20 BPH; plasma and urine), aimed to assess potential RNA biomarker ability to discriminate between PCa and BPH; (3) validation cohort (31 PCa Pre-Op vs 31 BPH, plasma), aimed to confirm RNA biomarker diagnostic value. The quality of the obtained EV preps was checked by transmission electron microscopy for urine (Figure 1A) and plasma (Figure 1B) as well as Western blot analysis with antibodies against typical EV markers ALIX, TSG101 and CD63, and calnexin as a negative control of plasma and urinary EVs from randomly selected 3 patients (Figure 1C) and the results are published before (Bajo-Santos et al., 2023). Routinely, EV yields in all samples were assessed by NTA. Results show that the number of particles ranges from 8.60 × 10⁹ to 1.67 × 10¹¹ in Pre-Op and 5.6 × 10⁹ to 1.50 × 10¹¹ particles per ml of plasma in Post-Op plasma samples in the RNAseq validation cohort (Figure 1D) and 2.60 × 10⁷ to 7.89 × 10⁹ in Pre-Op and 3.19 × 10⁷ to 5.45 × 10⁹ particles per ml of urine in Post-Op urine samples (Figure 1E). In the test cohort, EV numbers ranged from 8.6 × 10⁹ to 1.67 × 10¹¹ in PCa and 7.62 × 10⁹ to 1.93 × 10¹¹ in BPH plasma samples (Figure 1F) and 2.6 × 10⁷ to 6.51 × 10⁹ in PCa and 1.94 × 10⁷ to 8.97 × 10⁹ in BPH urine samples (Figure 1G). In the validation cohort, EV concentration per ml ranged from 1.57 × 10¹⁰ to 1.16 × 10¹¹ in PCa and 1.69 × 10¹⁰ to 4.05 × 10¹¹ in BPH plasma samples (Figure 1H). No statistically significant differences between the groups of samples were found.
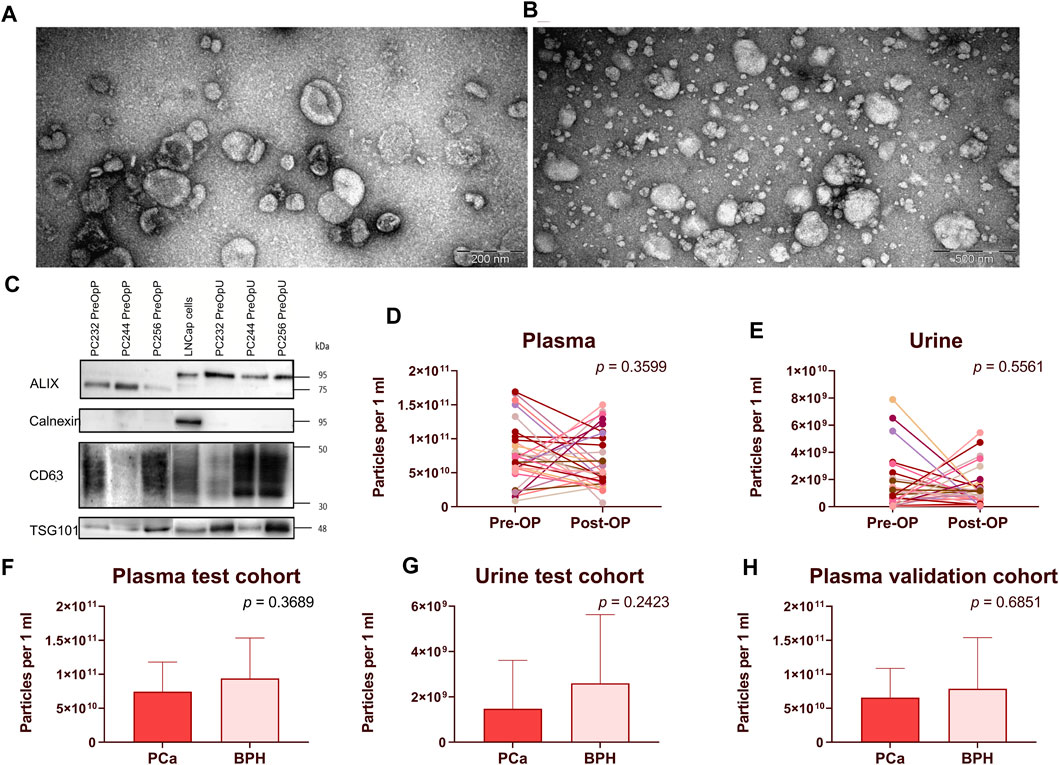
FIGURE 1. EV isolation and quality control. (A,B) Transmission electron microscopy images showing EVs isolated from urine (A) and plasma (B). Western blot analysis of ALIX, Calnexin, CD63 and TSG101 in plasma and urinary EVs from 3 randomly selected patients as well as LNCap prostate cancer cells (C). Paired dot plots showing EV concentration per ml of plasma (D) and urine (E) samples before and after radical prostatectomy. Wilcoxon matched-pairs signed rank test was used to assess the statistical significance of the differences between groups. (F–H) Box plots showing EV concentration per ml of plasma (F–H) and urine (G) in patients with PCa and BPH. Figures 1F, 1G represent patients in the test cohort and Figure 1H represents patients in the validation cohort. Mann-Whitney test was used to assess the statistical significance of the differences between groups. p-value < 0.05 was considered significant.
A total of 11 potential RNA biomarker candidates representing various RNA biotypes were selected for this study based on their overexpression in tumor tissues, relatively high levels in PreOp EVs and decreased levels in PostOp EVs in our previous RNA sequencing study (Bajo-Santos et al., 2023). Additionally, 4 RNA biomarker candidates were included (PCA3, PCAT14, tRNA-Phe-GAA-1-1/2/3/4/5/6-3b (tRF-Phe-GAA-3b) and tRNA-Lys-CTT-(1-1/2)/(4-1)-5c (tRF-Lys-CTT-5c)) based on previously reported diagnostic and/or prognostic values. Further information on each of the RNA candidates is provided in Table 2. For each of the candidates, LNA-based primers were designed (utilizing either QuantiNova LNA PCR custom assays or miRCURY LNA miRNA PCR assays, depending on the target length and RNA biotype), employing the GeneGlobe platform from Qiagen, Germany. PCR assay numbers are provided in Supplementary Table S1.
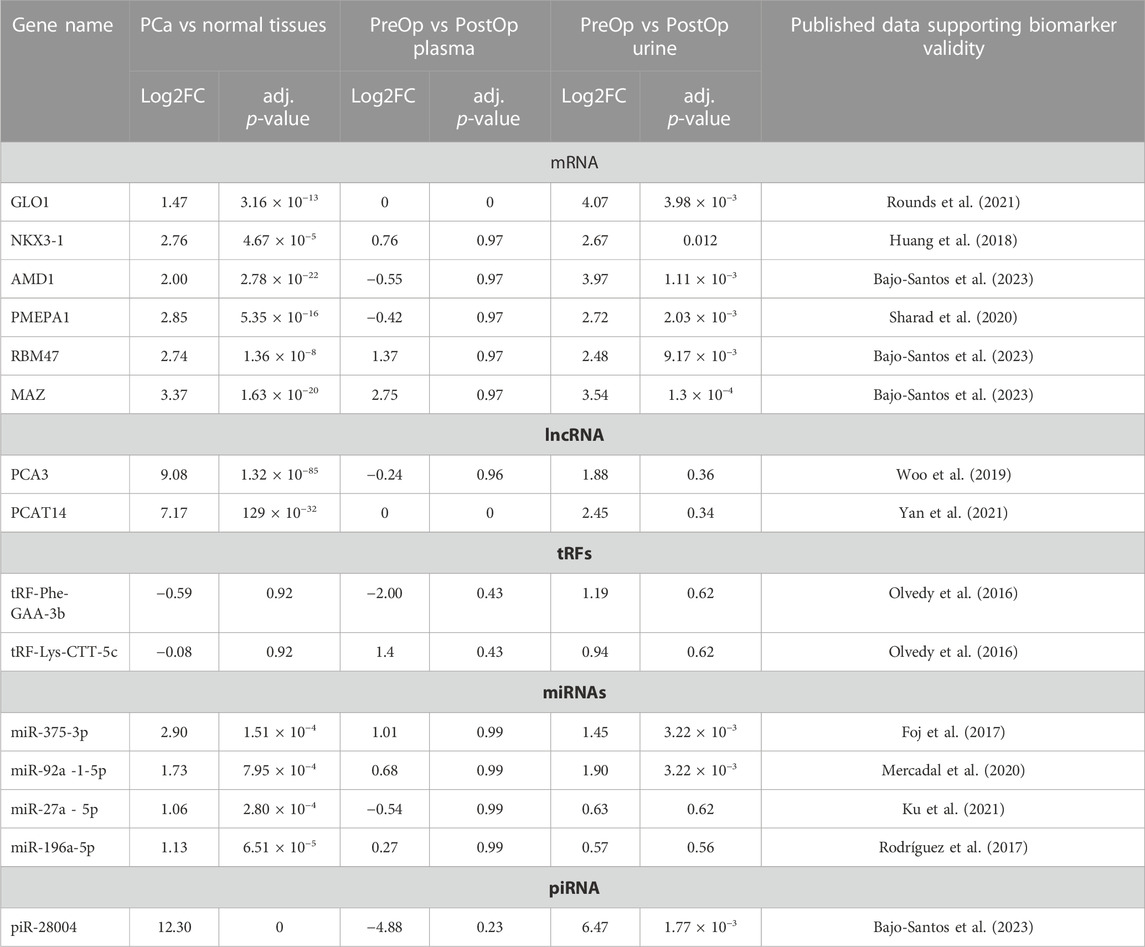
TABLE 2. Selected biomarker candidates.
Given the present lack of established PCR data normalization methodologies for the analysis of urinary EVs, we adopted a triad of distinct normalization strategies. The first approach involved data normalization relative to 1 mL of the biofluid from which the EVs were extracted. The second strategy entailed data normalization against the total EV count, as quantified through NTA. The third method encompassed data normalization with respect to two candidate internal control miRNAs, namely, let-7f-5p and miR-26a-5p, as discerned in a preceding sequencing study (Bajo-Santos et al., 2023) and published by others (Tonge and Gant, 2013; Gouin et al., 2017). These miRNAs were detected across all EV samples and exhibited minimal variance, thereby facilitating the reduction of data variability in pursuit of enhanced consistency. These strategies were devised with the primary objective of minimizing data variance within our dataset.
For each normalization variant, variation coefficients for each RNA biomarker were calculated from the raw PCR data as shown in Table 3. It was concluded that on average, normalizing data against 1 mL of biofluid from which EVs were isolated showed the least variation among the datasets. All further analyses were conducted based on this normalization method.
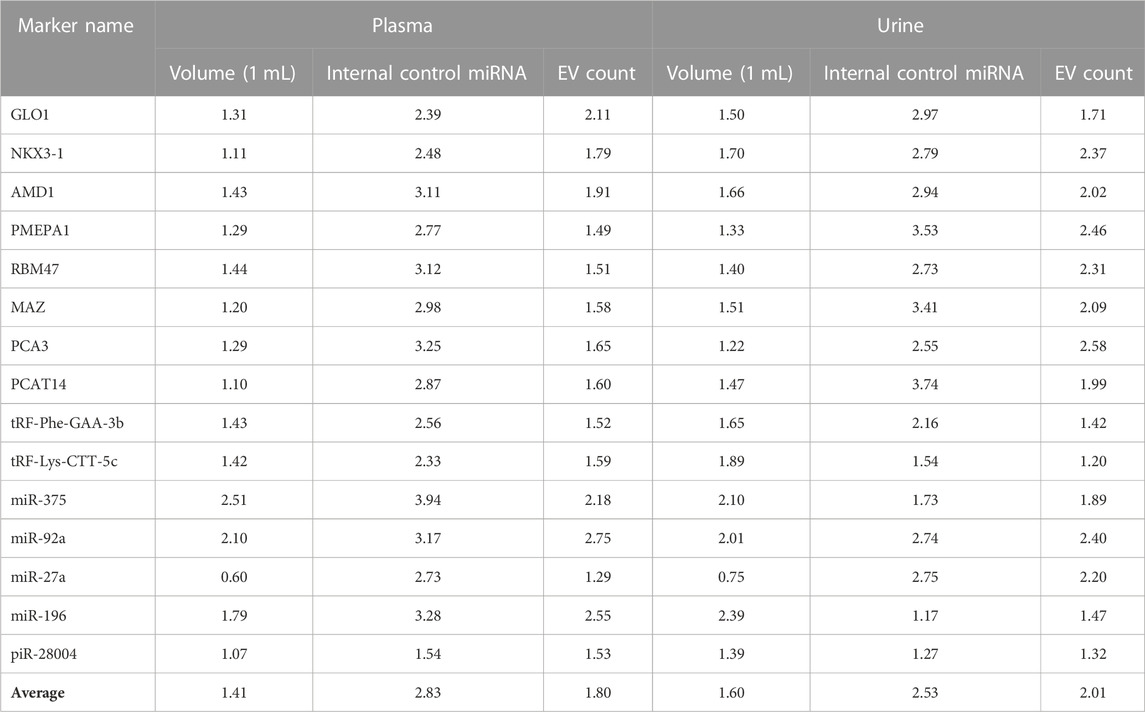
TABLE 3. Variation coefficients of RT-ddPCR results in plasma and urinary EV samples under different normalization strategies.
To validate the results of the previous RNA sequencing study and identify biomarkers, whose main tissue source in plasma or urinary EVs was PCa and/or normal prostate, we compared their levels in plasma and urinary EV samples collected before and after radical prostatectomy from 30 PCa patients.
In urinary EVs, the levels of four biomarker candidates: tRF-Phe-GAA-3b (FC = 3.73; p < 0.0001), tRF-Lys-CTT-5c (FC = 1.46, p = 0.0327), miR-375-3p (FC = 14.85, p < 0.0001) and piR-28004 (FC = 2.45, p = 0.0081) were significantly decreased following radical prostatectomy (Figures 2A–D), which is in concordance to our previous data. However, in plasma EVs, the levels of only one biomarker candidate—NKX3-1 (FC = 2.32, p = 0.0008) significantly decreased after prostatectomy (Figure 2E). The levels of several other biomarker candidates in plasma (Supplementary Image S1) and urinary (Supplementary Image S2) EVs tended to decrease following prostatectomy yet did not reach statistical significance.
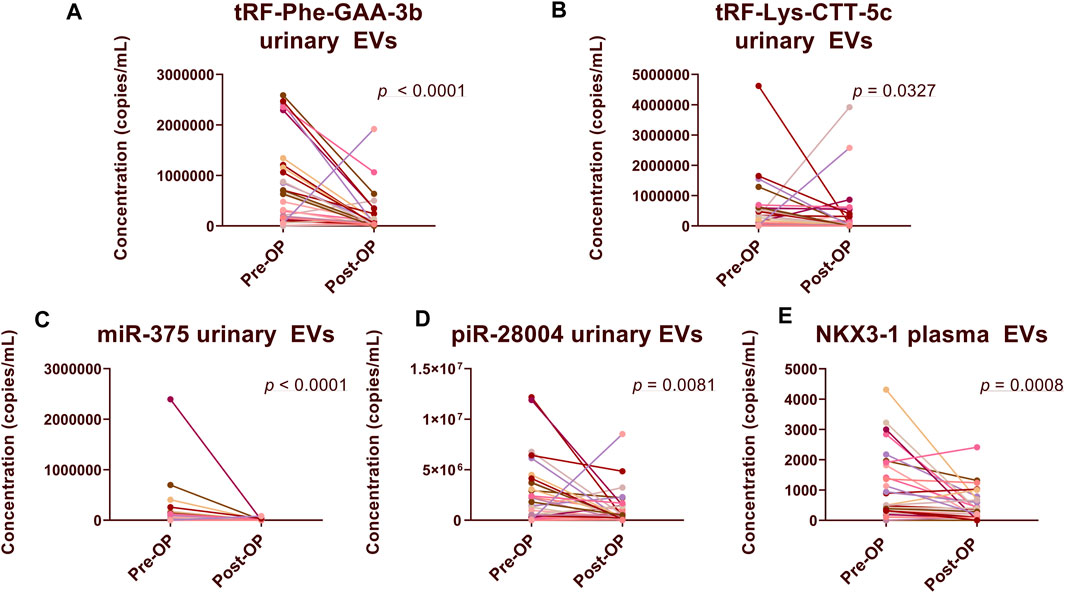
FIGURE 2. Comparison of RNA biomarker levels in Pre-Op vs. Post-Op plasma and urinary EVs. Paired dot plots show copy numbers of RNA biomarkers per ml of urine (A–D) and plasma (E) collected before and after radical prostatectomy in 30 PCa patients. Wilcoxon matched-pairs signed rank test was used to assess the statistical significance of the differences between groups. p-value < 0.05 was considered significant.
In order to assess whether the selected RNA biomarker candidates could distinguish between patients with PCa and BPH, we compared their levels in a test cohort of 20 PCa and 20 BPH patient plasma and urinary EV samples. In plasma EV samples, the levels of NKX3-1 (FC = 5.42, p = 0.0003, AUC = 0.82) and miR-27a (FC = 1.61, p = 0.0129, AUC = 0.73) were significantly higher in PCa patients (Figures 3A,B). The levels of GLO1 (FC = 3.99, p = 0.0534, AUC = 0.68) were also higher in PCa patients, but the difference was not statistically significant (Figure 3C). The levels of several other biomarker candidates such as PCAT14 and PMEPA1 were elevated in PCa plasma EVs yet failed to reach statistical significance (Supplementary Image S3). None of the potential RNA candidates reached statistical significance between the two groups in urinary EVs (Supplementary Image S4).
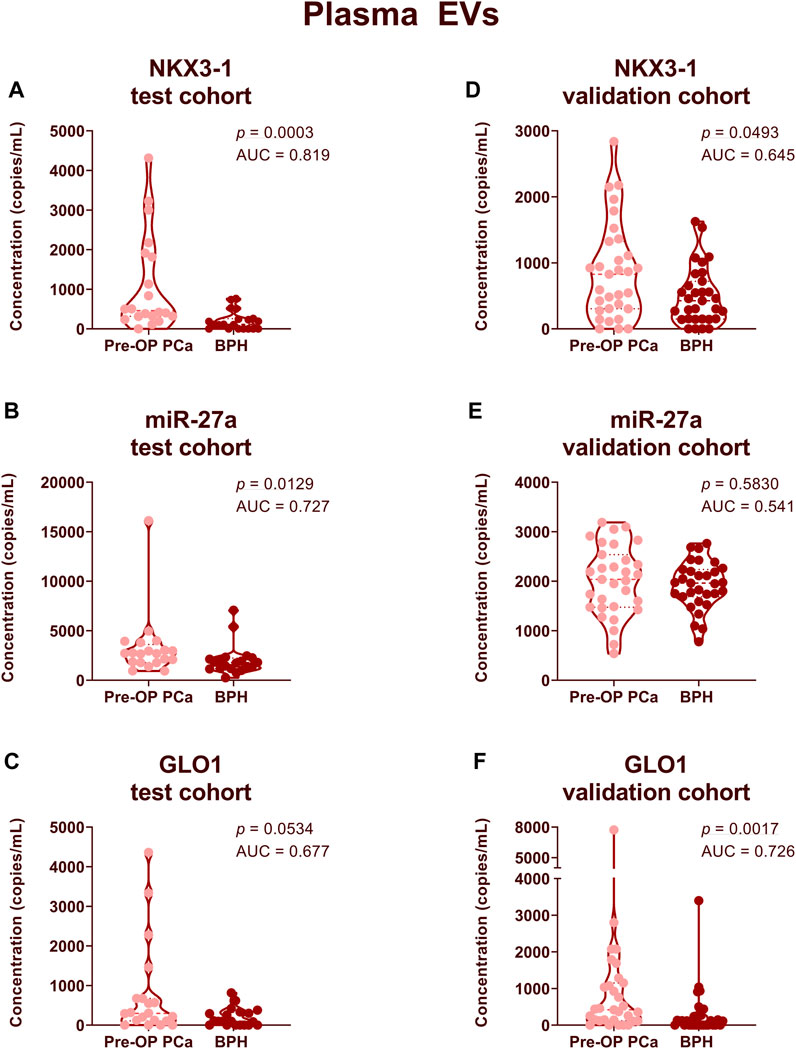
FIGURE 3. Comparison of RNA biomarker levels in patients with PCa vs BPH in plasma EV samples. Violin plots show copy numbers of RNA biomarkers NKX3-1 (A,D), miR-27a (B,E) and GLO1 (C,F) per ml of plasma in the test cohort (20 PCa, 20 BPH) (A–C) and validation cohort (31 PCa, 31 BPH) (D–F). Mann-Whitney test was used to assess the statistical significance of the differences between groups. p-value < 0.05 was considered significant.
Next, we aimed to validate these results in an independent validation cohort of 31 PCa and 31 BPH patient plasma samples. At this point, we did not include urinary EV samples as they showed significantly lower diagnostic potential compared to plasma EVs. The level of NKX3-1 remained significantly higher in PCa patients compared to BPH patients (FC = 1.76, p = 0.0493, AUC = 0.65) (Figure 3D). However, miR-27a failed to discriminate between PCa and BPH in an independent cohort (Figure 3E). In an independent patient cohort, the levels of GLO1 were significantly higher in PCa patients compared to BPH patients (FC = 3.10, p = 0.0017, AUC = 0.73) (Figure 3F).
Next, we combined the two top-performing candidates - NKX3-1 and GLO1—in a biomarker model based on Gaussian identity function. The two-biomarker model showed an AUC of 0.845 (Figure 4A) in the test cohort and an AUC of 0.713 in the validation cohort (Figure 4B). The leave-one-out cross-validation of the model yielded an AUC value of 0.765, thus further confirming its viability (Figure 4C). PSA test showed a poor diagnostic value in our cohort of patients as it could distinguish PCa from BPH with an AUC of 0.634. Adding PSA to the two-biomarker model did not improve the performance of the model in the test cohort (Figure 4E), whereas it slightly increased its diagnostic performance in the validation set by increasing the AUC from 0.713 to 0.757 (Figure 4F).
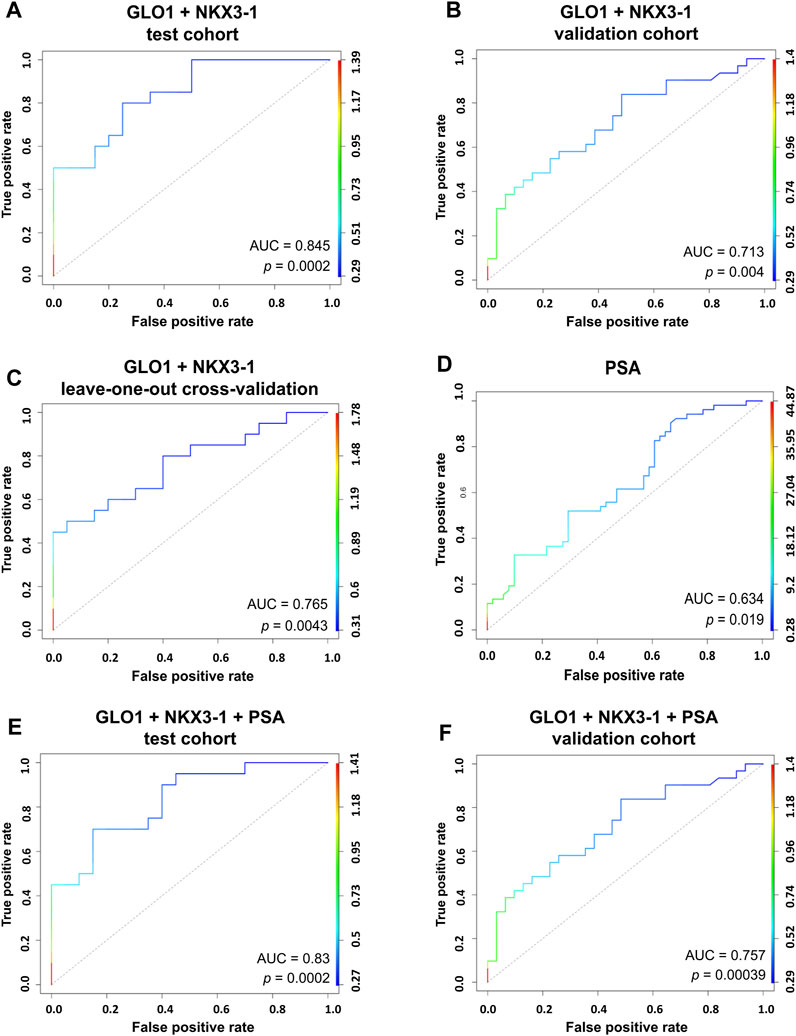
FIGURE 4. RNA biomarker models. Generalized linear models combining the top two performing candidates NKX3-1 and GLO1 based on Gaussian identity function show an ability to discriminate between PCa and BPH in a test cohort of 20 PCa vs 20 BPH patient plasma EVs (A) and a validation cohort of 31 PCa vs 31 BPH patient plasma EVs (B). Leave-one-out cross-validation of the model (C). ROC curve for the PSA test (D). A combined model of PSA measurements and two RNA biomarkers (NKX3-1 and GLO1) showing the ability to discriminate between PCa and BPH in a test cohort of 20 PCa vs 20 BPH patient plasma EVs (E) and a validation cohort of 31 PCa vs 31 BPH patient plasma EVs (F).
To assess whether the RNA biomarker candidates have the ability to discriminate between low and high-grade prostate cancer, we divided the data from 30 PCa Pre-Op plasma and urinary EV samples, into two groups: high Gleason (HG) (Gleason score 4 + 3, 4 + 5 and 4 + 5) and low Gleason (LG) (Gleason score 3 + 3 and 3 + 4) groups, comprising of 15 patients in each group. We found that the levels of NKX3-1 both in plasma and urinary EVs tended to be higher in patients with HG group, yet did not reach statistical significance (Figures 5A, B). Similarly, the levels of MAZ and PCAT14 in urinary EVs tended to be higher in patients with a high Gleason score (Figures 5C,D).
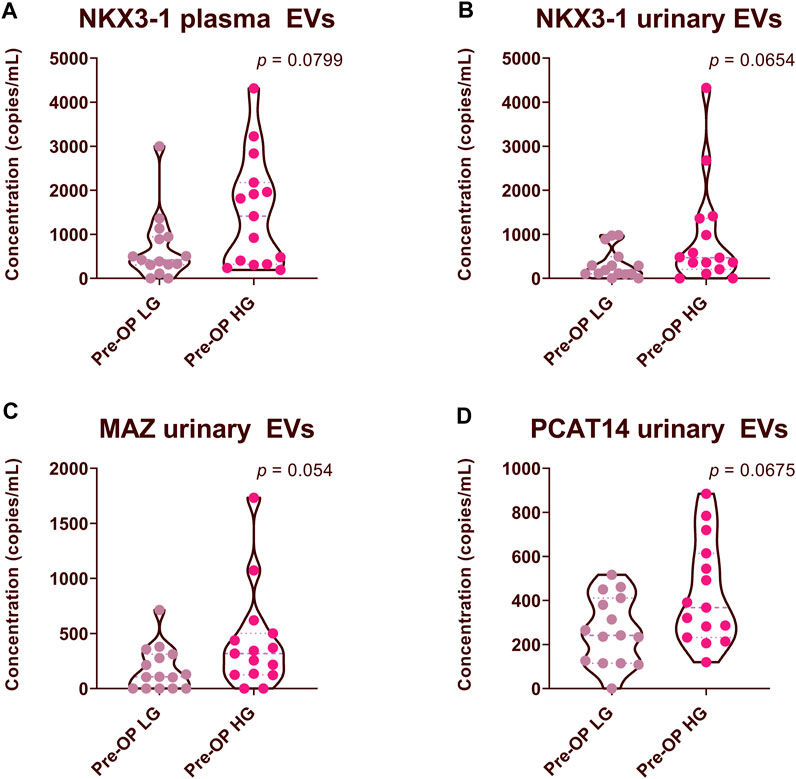
FIGURE 5. Comparison of RNA biomarker levels in patients with high Gleason (HG) and low Gleason (LG) scores. Violin plots show copy numbers of RNA biomarkers per 1 mL of patient plasma (A) and urinary EVs (B–D). Mann-Whitney test was used to assess the statistical significance of the differences between groups. p-value < 0.05 was considered significant.
NKX3-1 gene encodes a transcription factor that functions as a prostate-specific tumor suppressor and its protein levels are commonly decreased in PCa (Padmanabhan et al., 2016). We have found that its mRNA is overexpressed in PCa as compared to adjacent normal prostate tissues (Bajo-Santos et al., 2023) and the levels of NKX3-1 mRNA are significantly higher in plasma EVs from patients with PCa than BPH, and higher levels tend to associate with higher Gleason score that seems to contradict with its tumor suppressor’s role in PCa. To gain a comprehensive view of its expression level in PCa, we analyzed the transcriptomic data available at The Cancer Genome Atlas Program (TCGA). Comparison of NKX3-1 mRNA levels in RNAseq data from 502 prostate adenocarcinoma cases and 52 normal prostate tissues showed that its level in PCa tissues is substantially higher than in normal prostate tissues (Mann-Whitney test, p = 6.65 × 10⁻⁵) (Figure 6A). To search for somatic mutations in NKX3-1 gene, we compared the RNA sequences obtained from PCa and normal prostate tissues in our previous study (Bajo-Santos et al., 2023). We were unable to identify any somatic point mutations in the tumor tissues, whereas the frequencies of several common SNPs suggested that one allele of NKX3-1 is lost in the tumor tissues of 4 out of 10 PCa patients (Figure 6B).
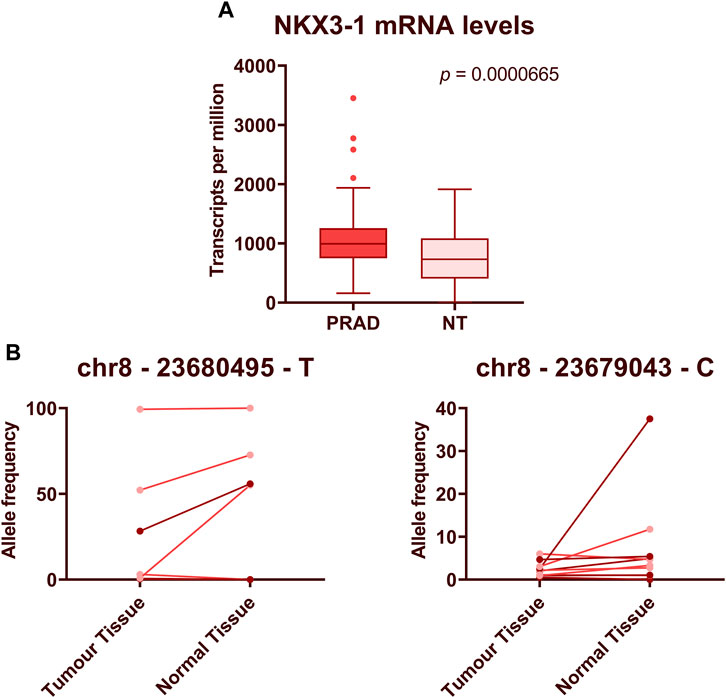
FIGURE 6. Expression levels and mutational analysis of NKX3-1 in PCa tissues. (A) The box plot shows NKX3-1 mRNA levels in prostate adenocarcinoma (PRAD) and normal prostate tissue (NT) gene expression datasets from TCGA database. Mann-Whitney test was used to assess the statistical significance of the differences between groups. p-value < 0.05 was considered significant. (B) Paired dot plots show allele frequencies of 2 SNPs obtained from RNA sequencing data in tumor and normal prostate tissues from 10 PCa patients.
Liquid biopsies have emerged as an increasingly favored alternative to traditional tissue biopsies for cancer diagnosis and surveillance. Biological fluids like plasma and urine hold rich reservoirs of cancer-related information, encompassing circulating cancer cells, cell-free DNA and RNA, diverse proteins, and EVs (Lu et al., 2019; Ramirez-Garrastacho et al., 2022a). Previously deemed metabolic byproducts, EVs have been revealed to harbor an extensive array of metabolites and nucleic acids derived from their parent cells, assuming pivotal roles in intercellular communication, cancer progression, and metastasis (Doyle and Wang, 2019).
Several studies, including our recent study of breast cancer, have shown that EV concentrations in body fluids are increased in cancer patients as compared to healthy controls and their levels reflect clinical events such as chemotherapy or surgery, thus suggesting that the excess EVs are produced in the body due to the disease process or treatment (Lázaro-Ibáñez et al., 2014; Cappello et al., 2017; Krafft et al., 2017; Menck et al., 2017; König et al., 2018; Sadovska et al., 2022). Therefore, we expected that the EV numbers should decrease after the surgical removal of the tumor. However, our data did not reveal a statistically significant reduction in EV yields in patients undergoing radical prostatectomy. This suggests that the prostate and/or PCa does not produce sufficiently large amounts of EVs that could substantially influence the overall EV counts in the body. This could be attributed to the relatively small size of the prostate gland or to lower EV secretion rates. Of note, we observed a tendency towards elevated EV concentrations in patients with BPH compared to those with PCa. While these differences did not reach statistical significance, the observations align with findings from a prior study suggesting that the enlarged prostate size observed in BPH patients may contribute to an overall increase in EV counts (Salvi et al., 2021). On the other hand, it can not be excluded that the controversial findings regarding the EV counts are related to technical issues such as co-isolation of lipoprotein particles that could potentially introduce distortions to NTA measurements, differences in the EV isolation and counting methods and pre-analytical variables (Ramirez-Garrastacho et al., 2022a).
The primary goal of this study was to validate RNA biomarker candidates identified in our previous sequencing study (Bajo-Santos et al., 2023) and develop clinically applicable ddPCR-based assays for the detection and monitoring of PCa. We utilized RT-ddPCR, commonly employed for the absolute quantification of nucleic acids. This method has gained significant traction in oncology, finding application in various areas such as absolute allele quantification, detection of rare mutations, assessment of copy number variations, and DNA methylation analysis. Key benefits include its absolute quantification, high specificity, and high sensitivity, facilitating the precise analysis of minute copy numbers within a sample without a need for standard curve construction. Its capacity to detect and accurately quantify low copy numbers of target molecules aligns seamlessly with EV-enclosed cancer biomarker analysis requirements in liquid biopsies (Palacín-Aliana et al., 2021). The main technical challenges we encountered during this study were related to the fragmented nature of EV-enclosed RNAs and the normalization of PCR data.
The greatest part of the biomarker candidates identified in our EV RNA sequencing study were mRNAs. Alignment of EV RNA reads against the reference sequences clearly showed that the EV RNA is fragmented, however, it was not clear if the fragmentation is entirely random or there are some preferential cleavage sites or sorting mechanisms resulting in the enrichment of some specific fragments in EVs. This represents a challenge in the PCR primer design. Although we succeeded in developing several successful PCR assays for the amplification of mRNA fragments, currently there are no universal rules for selecting appropriate target sequences.
The foremost hurdle, however, lies in the normalization of PCR data. In the RNA sequencing analysis, gene expression values can be reliably normalized using global normalization approaches (X. Li et al., 2020) allowing accurate comparison of the gene expression levels across samples, however, these approaches can not be transferred to the PCR results and currently no robust normalization approach exists for the analysis of PCR results obtained from extracellular RNAs (Erdbrügger et al., 2021). We explored three data normalization strategies to identify an approach that minimized dataset variations. Ultimately, we determined that normalizing data to the volume of the analyzed biofluids yielded the least variable results. This normalization technique appears to be effective for plasma samples, given that its volume is generally less susceptible to variability, a trend documented in earlier studies (Endzeliņš et al., 2017; Royo et al., 2020). However, urine demonstrates greater heterogeneity in terms of composition and concentration, influenced by diverse factors including patient diet, health, and lifestyle, therefore such an approach is not optimal for urinary EVs. Although several alternative normalization approaches for urinary EVs have been proposed, currently none of them is widely accepted in the EV research community and finding a robust normalization approach is still an unmet need (Blijdorp et al., 2021; Erdbrügger et al., 2021).
Furthermore, only a minor fraction of the total EVs in biofluids appears to be derived from the prostate, rendering the detection of prostate-specific RNA fragments exceedingly challenging. A potential avenue for addressing this challenge is urine collection subsequent to a digital rectal examination, as such prostate stimulation has been demonstrated to elevate prostate-specific EV counts in urine (Hendriks et al., 2016; Pellegrini et al., 2017). Additionally, a lack of standardized methodologies for EV isolation and the preservation of biological fluids underscores another predicament. This lack of consensus contributes to remarkable variation across EV research studies, often leading to difficulties in replicating or validating results.
Urine is the most frequently employed biofluid in liquid biopsies of PCa. Its merits encompass non-invasive collection, the capacity to collect and conserve substantial volumes simultaneously, and a comparatively limited count of contributing organs for urinary EVs (Ramirez-Garrastacho et al., 2022a). It is a preferential biofluid for the diagnosis and active surveillance of PCa, whereas blood is likely to be the most suitable biofluid for the post-operative monitoring of PCa patients (Ramirez-Garrastacho et al., 2022a). In this study, we used blood plasma instead of serum. This decision was motivated by the observation that during the processing of serum, EVs from platelets tend to co-isolate, thereby augmenting the total EV count and subsequently introducing additional variability (Coumans et al., 2017; Campos-Fernández et al., 2019). To the best of our knowledge, a direct comparison of RNA biomarker levels in urinary and plasma EVs has not been reported before. The levels of the majority of biomarker candidates, except for NKX3-1, did not decrease in the PostOp plasma EVs, suggesting that these RNAs are released by various different organs, whereas the expression of NKX3-1 is strictly prostate-specific (Gurel et al., 2010), therefore its levels fell after prostatectomy. Together with GLO1, it showed better diagnostic performance in distinguishing PCa from BPH as compared to urinary EVs. On the contrary, in urinary EVs, the levels of 4 biomarkers—tRF-Phe-GAA-3b and tRF-Lys-CTT-5c, miR-375-3p and piR-28004 substantially decreased after the prostatectomy, showing that in urine these RNAs are contributed mostly by the prostate and/or PCa. However, none of them could distinguish PCa from BPH. This is puzzling, since at least two of them—miR-375-3p and piR-28004 were significantly overexpressed in PCa as compared to normal prostate tissues (Bajo-Santos et al., 2023). The two tRFs (tRF-Phe-GAA-3b and tRF-Lys-CTT-5c) have also been previously found as significantly overexpressed in metastatic vs. organ-confined disease and prognostic of biochemical recurrence (Martens-Uzunova et al., 2012; Olvedy et al., 2016). Conceivably, these RNAs are also overexpressed in BPH tissues, or the EV release rate in urine from PCa tissues is lower than that from BPH tissues. These results seem to contradict the findings from our previous study, where urinary EVs demonstrated a notably higher enrichment in PCa and/or prostate biomarker candidates (Bajo-Santos et al., 2023). This disparity most likely is attributed to the challenges encountered in normalizing urinary EV PCR results.
Out of our 15 RNA biomarker candidates, mRNAs NKX3-1 and GLO1 showed the highest diagnostic value. NKX3-1 is an androgen-regulated gene with prostate-specific expression pattern (Gurel et al., 2010). It is located on chromosome 8p21.2, a region that is deleted in up to 86% of PCa cases (Vocke et al., 1996). It encodes a homeobox-containing transcription factor that negatively regulates epithelial cell growth and prostate morphogenesis thus functioning as a prostate-specific tumor suppressor (He et al., 1997; Papachristodoulou et al., 2021). However, we found that NKX3-1 mRNA is overexpressed in PCa tissues as compared to normal prostate tissues, and its level in plasma EVs is increased in patients with PCa as compared to BPH. We reasoned that the transcription rate of NKX3-1 is increased in androgen-sensitive PCa cells, whereas the protein functions and/or levels may be affected by mutations or post-translational modifications (Padmanabhan et al., 2016). Indeed, the analysis of transcriptomic data from TCGA database confirmed that NKX3-1 mRNA levels are increased in PCa as compared to normal prostate. In line with previous studies (Voeller et al., 1997), we did not find somatic point mutations in the coding region of NKX3-1, whereas we identified a pattern of SNPs suggesting a LOH affecting this gene in 4 out of 10 PCa patients analyzed. Furthermore, it is also possible that NKX3-1 mRNA is increasingly degraded and/or sorted into EVs to deplete its intracellular concentration in PCa cells. Furthermore, finding higher NKX3-1 levels in plasma EVs in patients with aggressive PCa is aligned with a previous study showing that high NKX3-1 levels in cell-free plasma are associated with aggressive PCa characteristics (De Souza et al., 2020). Additionally, higher EV-enclosed NKX3-1 levels originating from PCa cells compared to normal prostate cells had also been previously reported, aligning with our results (Lázaro-Ibáñez et al., 2017).
GLO1 codes the enzyme glyoxalase 1, a part of the glyoxalase system in the cytosol, which breaks down reactive aldehyde metabolites (Thornalley, 2003). Several studies have shown that it is overexpressed in high grade prostate cancer tissues and indicates early recurrence (Baunacke et al., 2014; Burdelski et al., 2017; Rounds et al., 2021). Despite our results not showing a statistically significant difference between GLO1 levels in high and low-grade PCa EVs, it was significantly higher in PCa patient plasma EVs than in BPH patients.
Several previous studies have explored the diagnostic and prognostic relevance of EV-enclosed RNAs in PCa patients (Ramirez-Garrastacho et al., 2022b). One of the most extensively studied biomarkers is PCA3—an lncRNA whose level in urinary EVs can differentiate between healthy men and PCa patients (Motamedinia et al., 2016), and between PCa patients with GS ≤ 6 vs. GS ≥ 7 (Donovan et al., 2015). Individually, PCA3 could distinguish biopsy-confirmed healthy men and PCa patients with an AUC of 0.681 (Motamedinia et al., 2016), whereas in combination with ERG mRNA and SPDEF as normalizer, it constitutes the ExoDx Prostate test that is routinely used for detection of high-grade PCa in men over 50 years of age and gray zone PSA levels (2–10 ng/mL), and informs whether to proceed with prostate biopsy (Tutrone et al., 2020). In the current study, we assessed its ability to differentiate between PCa and BPH. Although a fraction of PCa patients had elevated levels of PCA3 both in plasma and urinary EVs, its diagnostic value was moderate with AUC of 0.56 and 0.57 in plasma and urinary EVs, respectively. The best diagnostic biomarkers found in this study were GLO1 and NKX3-1 which individually could distinguish PCa from BPH in the validation cohort with an AUC of 0.726 and 0.645, respectively. Combining both biomarkers in a biomarker model yielded an AUC of 0.713 in the validation cohort, whereas adding the PSA levels to the model increased the AUC to 0.757 thus showing enhanced diagnostic performance as compared to individual markers. This observation aligns with findings from several other studies, advocating that the synergistic utilization of multiple markers is a more efficient approach to cancer detection (Prensner et al., 2012; Murphy et al., 2015; Davey et al., 2020; Ramirez-Garrastacho et al., 2022a). For instance, Davey et al. developed a seven mRNA biomarker model (FOLH1, HPN, CD24, TMPRSS2-ERG overexpressed; ITSN1, ANXA3, SLC45A3 underexpressed) that could distinguish PCa from benign conditions with AUC of 0.825. Furthermore, combining this model with two miRNAs yielded an AUC of 0.843 (Davey et al., 2020).
Taken together, in this study, we tested the diagnostic and prognostic performance of 15 RNA biomarker candidates by RT-ddPCR in independent cohorts of PCa and BPH patients. This resulted in the validation of two novel PCa biomarkers - GLO1 and NKX3-1 mRNAs that are overexpressed in PCa tissues, known to functionally contribute to the PCa development, and have higher levels in plasma EVs from PCa patients than BPH patients. In addition, higher levels of NKX3-1 in plasma and urinary EVs tended to associate with aggressive PCa. A biomarker model combining GLO1, NKX3-1 and PSA could distinguish PCa from BPH with an AUC of 0.76 in an independent validation cohort. We envision that these biomarkers could be of use for the development of liquid biopsies for the detection of clinically significant PCa, deciding on the need of prostate biopsies in men with elevated PSA levels and active surveillance of patients with low-grade disease.
The original contributions presented in the study are included in the article/Supplementary Material, further inquiries can be directed to the corresponding author.
The studies involving humans were approved by the Latvian Central Medical Ethics Committee. The studies were conducted in accordance with the local legislation and institutional requirements. The participants provided their written informed consent to participate in this study.
AB: Investigation, Methodology, Visualization, Writing–original draft. CB-S: Investigation, Methodology, Writing–review and editing. PZ: Data curation, Methodology, Software, Visualization, Writing–review and editing. AB: Data curation, Investigation, Resources, Writing–review and editing. JJ: Data curation, Investigation, Resources, Writing–review and editing. VL: Conceptualization, Data curation, Investigation, Writing–review and editing. EM-U: Conceptualization, Investigation, Methodology, Writing–review and editing. GJ: Conceptualization, Investigation, Supervision, Writing–review and editing. AL: Conceptualization, Data curation, Funding acquisition, Methodology, Project administration, Supervision, Validation, Writing–original draft.
The author(s) declare financial support was received for the research, authorship, and/or publication of this article. This research was funded by the ERDF project No. 1.1.1.1/20/A/045.
We are thankful to our colleagues from the Genome Database of Latvian Population for storing and providing the plasma samples used in this study.
The authors declare that the research was conducted in the absence of any commercial or financial relationships that could be construed as a potential conflict of interest.
All claims expressed in this article are solely those of the authors and do not necessarily represent those of their affiliated organizations, or those of the publisher, the editors and the reviewers. Any product that may be evaluated in this article, or claim that may be made by its manufacturer, is not guaranteed or endorsed by the publisher.
The Supplementary Material for this article can be found online at: https://www.frontiersin.org/articles/10.3389/fmolb.2023.1279854/full#supplementary-material
SUPPLEMENTARY IMAGE S1 | Comparison of RNA biomarker levels in Pre-Op vs. Post-Op plasma EVs. Paired dot plots show copy numbers of RNA biomarkers per ml of patient plasma collected before and after radical prostatectomy in 30 PCa patients. Wilcoxon matched-pairs signed rank test was used to assess the statistical significance of the differences between groups. p-value < 0.05 was considered significant.
SUPPLEMENTARY IMAGE S2 | Comparison of RNA biomarker levels in Pre-Op vs. Post-Op urinary EVs. Paired dot plots show copy numbers of RNA biomarkers per ml of patient urine collected before and after radical prostatectomy in 30 PCa patients. Wilcoxon matched-pairs signed rank test was used to assess the statistical significance of the differences between groups. p-value < 0.05 was considered significant.
SUPPLEMENTARY IMAGE S3 | Comparison of RNA biomarker levels in patients with PCa vs. BPH in plasma EV samples. Violin plots show copy numbers of RNA biomarkers per ml of patient plasma in the test cohort (20 PCa, 20 BPH). Mann-Whitney test was used to assess the statistical significance of the differences between groups. p-value < 0.05 was considered significant.
SUPPLEMENTARY IMAGE S4 | Comparison of RNA biomarker levels in patients with PCa vs. BPH in urinary EV samples. Violin plots show copy numbers of RNA biomarkers per ml of patient urine in the test cohort (20 PCa, 20 BPH). Mann-Whitney test was used to assess the statistical significance of the differences between groups. p-value < 0.05 was considered significant.
AUC, area under curve; BPH, benign prostatic hyperplasia; cDNA, complementary DNA; EV, extracellular vesicle; HG, high Gleason score; LG, low Gleason score; lncRNA, long non coding RNA; LOH, loss of heterozygosity; miRNA, micro RNA; mRNA, messenger RNA; NTA, nanoparticle tracking analysis; PCa, prostate cancer; piRNA, piwi-interacting RNA; PSA, prostate-specific antigen; SNP, single nucleotide polymorphism; TCGA, The Cancer Genome Atlas Program; tRF, tRNA derived fragment.
Abels, E. R., and Breakefield, X. O. (2016). Introduction to extracellular vesicles: biogenesis, RNA cargo selection, content, release, and uptake. Cell. Mol. Neurobiol. 36 (3), 301–312. doi:10.1007/s10571-016-0366-z
Ahmed, H. U., El-Shater Bosaily, A., Brown, L. C., Gabe, R., Kaplan, R., Parmar, M. K., et al. (2017). Diagnostic accuracy of multi-parametric MRI and TRUS biopsy in prostate cancer (PROMIS): a paired validating confirmatory study. Lancet 389 (10071), 815–822. doi:10.1016/S0140-6736(16)32401-1
Bajo-Santos, C., Brokāne, A., Zayakin, P., Endzeliņš, E., Soboļevska, K., Belovs, A., et al. (2023). Plasma and urinary extracellular vesicles as a source of RNA biomarkers for prostate cancer in liquid biopsies. Front. Mol. Biosci. 10, 980433. doi:10.3389/fmolb.2023.980433
Baunacke, M., Horn, L.-C., Trettner, S., Engel, K. M. Y., Hemdan, N. Y. A., Wiechmann, V., et al. (2014). Exploring glyoxalase 1 expression in prostate cancer tissues: targeting the enzyme by ethyl pyruvate defangs some malignancy-associated properties. Prostate 74 (1), 48–60. doi:10.1002/pros.22728
Blijdorp, C. J., Tutakhel, O. A. Z., Hartjes, T. A., van den Bosch, T. P. P., van Heugten, M. H., Rigalli, J. P., et al. (2021). Comparing approaches to normalize, quantify, and characterize urinary extracellular vesicles. J. Am. Soc. Nephrol. 32 (5), 1210–1226. doi:10.1681/ASN.2020081142
Burdelski, C., Shihada, R., Hinsch, A., Angerer, A., Göbel, C., Friedrich, E., et al. (2017). High-Level Glyoxalase 1 (GLO1) expression is linked to poor prognosis in prostate cancer. Prostate 77 (15), 1528–1538. doi:10.1002/pros.23431
Campos-Fernández, E., Barcelos, L. S., de Souza, A. G., Goulart, L. R., and Alonso-Goulart, V. (2019). Research landscape of liquid biopsies in prostate cancer. Am. J. Cancer Res. 9 (7), 1309–1328.
Cappello, F., Logozzi, M., Campanella, C., Bavisotto, C. C., Marcilla, A., Properzi, F., et al. (2017). Exosome levels in human body fluids: a tumor marker by themselves? Eur. J. Pharm. Sci. 96, 93–98. doi:10.1016/j.ejps.2016.09.010
Cocks, A., Martinez-Rodriguez, V., del Vecchio, F., Schukking, M., Broseghini, E., Giannakopoulos, S., et al. (2021). Diverse roles of EV-RNA in cancer progression. Seminars Cancer Biol. 75, 127–135. doi:10.1016/j.semcancer.2020.11.022
Coumans, F. A. W., Brisson, A. R., Buzas, E. I., Dignat-George, F., Drees, E. E. E., El-Andaloussi, S., et al. (2017). Methodological guidelines to study extracellular vesicles. Circulation Res. 120 (10), 1632–1648. doi:10.1161/CIRCRESAHA.117.309417
Davey, M., Benzina, S., Savoie, M., Breault, G., Ghosh, A., and Ouellette, R. J. (2020). Affinity captured urinary extracellular vesicles provide mRNA and miRNA biomarkers for improved accuracy of prostate cancer detection: a pilot study. Int. J. Mol. Sci. 21 (21), 8330. doi:10.3390/ijms21218330
Descotes, J.-L. (2019). Diagnosis of prostate cancer. Asian J. Urology 6 (2), 129–136. doi:10.1016/j.ajur.2018.11.007
De Souza, M. F., Kuasne, H., Barros-Filho, M. D. C., Cilião, H. L., Marchi, F. A., Fuganti, P. E., et al. (2020). Circulating mRNA signature as a marker for high-risk prostate cancer. Carcinogenesis 41 (2), 139–145. doi:10.1093/carcin/bgz129
Donovan, M. J., Noerholm, M., Bentink, S., Belzer, S., Skog, J., O’Neill, V., et al. (2015). A molecular signature of PCA3 and ERG exosomal RNA from non-DRE urine is predictive of initial prostate biopsy result. Prostate Cancer Prostatic Dis. 18 (4), 370–375. doi:10.1038/pcan.2015.40
Doyle, L., and Wang, M. (2019). Overview of extracellular vesicles, their origin, composition, purpose, and methods for exosome isolation and analysis. Cells 8 (7), 727. doi:10.3390/cells8070727
Endzeliņš, E., Berger, A., Melne, V., Bajo-Santos, C., Soboļevska, K., Ābols, A., et al. (2017). Detection of circulating miRNAs: comparative analysis of extracellular vesicle-incorporated miRNAs and cell-free miRNAs in whole plasma of prostate cancer patients. BMC Cancer 17 (1), 730. doi:10.1186/s12885-017-3737-z
Erdbrügger, U., Blijdorp, C. J., Bijnsdorp, I. V., Borràs, F. E., Burger, D., Bussolati, B., et al. (2021). Urinary extracellular vesicles: a position paper by the urine task force of the international society for extracellular vesicles. J. Extracell. Vesicles 10 (7), e12093. doi:10.1002/jev2.12093
Flores-Téllez, T. del N. J., and Baena, E. (2022). Experimental challenges to modeling prostate cancer heterogeneity. Cancer Lett. 524, 194–205. doi:10.1016/j.canlet.2021.10.012
Foj, L., Ferrer, F., Serra, M., Arévalo, A., Gavagnach, M., Giménez, N., et al. (2017). Exosomal and non-exosomal urinary miRNAs in prostate cancer detection and prognosis. Prostate 77 (6), 573–583. doi:10.1002/pros.23295
Gouin, K., Peck, K., Antes, T., Johnson, J. L., Li, C., Vaturi, S. D., et al. (2017). A comprehensive method for identification of suitable reference genes in extracellular vesicles. J. Extracell. Vesicles 6 (1), 1347019. doi:10.1080/20013078.2017.1347019
Gurel, B., Ali, T. Z., Montgomery, E. A., Begum, S., Hicks, J., Goggins, M., et al. (2010). NKX3.1 as a marker of prostatic origin in metastatic tumors. Am. J. Surg. Pathology 34 (8), 1097–1105. doi:10.1097/PAS.0b013e3181e6cbf3
He, W. W., Sciavolino, P. J., Wing, J., Augustus, M., Hudson, P., Meissner, P. S., et al. (1997). A novel human prostate-specific, androgen-regulated homeobox gene (NKX3.1) that maps to 8p21, a region frequently deleted in prostate cancer. Genomics 43 (1), 69–77. doi:10.1006/geno.1997.4715
Hell, L., Däullary, T., Burghart, V., Mauracher, L.-M., Grilz, E., Moser, B., et al. (2021). Extracellular vesicle-associated tissue factor activity in prostate cancer patients with disseminated intravascular coagulation. Cancers 13 (7), 1487. doi:10.3390/cancers13071487
Hendriks, R. J., Dijkstra, S., Jannink, S. A., Steffens, M. G., van Oort, I. M., Mulders, P. F. A., et al. (2016). Comparative analysis of prostate cancer specific biomarkers PCA3 and ERG in whole urine, urinary sediments and exosomes. Clin. Chem. Laboratory Med. (CCLM) 54 (3), 483–492. doi:10.1515/cclm-2015-0599
Hessvik, N. P., Sandvig, K., and Llorente, A. (2013). Exosomal miRNAs as biomarkers for prostate cancer. Front. Genet. 4, 36. doi:10.3389/fgene.2013.00036
Huang, H., Guma, S. R., Melamed, J., Zhou, M., Lee, P., and Deng, F.-M. (2018). NKX3.1 and PSMA are sensitive diagnostic markers for prostatic carcinoma in bone metastasis after decalcification of specimens. Am. J. Clin. Exp. Urology 6 (5), 182–188.
Ilic, D., Djulbegovic, M., Jung, J. H., Hwang, E. C., Zhou, Q., Cleves, A., et al. (2018). Prostate cancer screening with prostate-specific antigen (PSA) test: a systematic review and meta-analysis. BMJ 362, k3519. doi:10.1136/bmj.k3519
König, L., Kasimir-Bauer, S., Bittner, A.-K., Hoffmann, O., Wagner, B., Santos Manvailer, L. F., et al. (2018). Elevated levels of extracellular vesicles are associated with therapy failure and disease progression in breast cancer patients undergoing neoadjuvant chemotherapy. OncoImmunology 7 (1), e1376153. doi:10.1080/2162402X.2017.1376153
Krafft, C., Wilhelm, K., Eremin, A., Nestel, S., von Bubnoff, N., Schultze-Seemann, W., et al. (2017). A specific spectral signature of serum and plasma-derived extracellular vesicles for cancer screening. Nanomedicine Nanotechnol. Biol. Med. 13 (3), 835–841. doi:10.1016/j.nano.2016.11.016
Ku, A., Fredsøe, J., Sørensen, K. D., Borre, M., Evander, M., Laurell, T., et al. (2021). High-throughput and automated acoustic trapping of extracellular vesicles to identify microRNAs with diagnostic potential for prostate cancer. Front. Oncol. 11, 631021. doi:10.3389/fonc.2021.631021
Lázaro-Ibáñez, E., Lunavat, T. R., Jang, S. C., Escobedo-Lucea, C., Oliver-De La Cruz, J., Siljander, P., et al. (2017). Distinct prostate cancer-related mRNA cargo in extracellular vesicle subsets from prostate cell lines. BMC Cancer 17 (1), 92. doi:10.1186/s12885-017-3087-x
Lázaro-Ibáñez, E., Sanz-Garcia, A., Visakorpi, T., Escobedo-Lucea, C., Siljander, P., Ayuso-Sacido, Á., et al. (2014). Different gDNA content in the subpopulations of prostate cancer extracellular vesicles: apoptotic bodies, microvesicles, and exosomes. Prostate 74 (14), 1379–1390. doi:10.1002/pros.22853
Li, M., Zeringer, E., Barta, T., Schageman, J., Cheng, A., and Vlassov, A. v. (2014). Analysis of the RNA content of the exosomes derived from blood serum and urine and its potential as biomarkers. Philosophical Trans. R. Soc. B Biol. Sci. 369 (1652), 20130502. doi:10.1098/rstb.2013.0502
Li, X., Cooper, N. G. F., O’Toole, T. E., and Rouchka, E. C. (2020). Choice of library size normalization and statistical methods for differential gene expression analysis in balanced two-group comparisons for RNA-seq studies. BMC Genomics 21 (1), 75. doi:10.1186/s12864-020-6502-7
Loeb, S., Bjurlin, M. A., Nicholson, J., Tammela, T. L., Penson, D. F., Carter, H. B., et al. (2014). Overdiagnosis and overtreatment of prostate cancer. Eur. Urol. 65 (6), 1046–1055. doi:10.1016/j.eururo.2013.12.062
Loeb, S., Vellekoop, A., Ahmed, H. U., Catto, J., Emberton, M., Nam, R., et al. (2013). Systematic review of complications of prostate biopsy. Eur. Urol. 64 (6), 876–892. doi:10.1016/j.eururo.2013.05.049
Lomas, D. J., and Ahmed, H. U. (2020). All change in the prostate cancer diagnostic pathway. Nat. Rev. Clin. Oncol. 17 (6), 372–381. doi:10.1038/s41571-020-0332-z
Lu, Y.-T., Delijani, K., Mecum, A., and Goldkorn, A. (2019). Current status of liquid biopsies for the detection and management of prostate cancer. Cancer Manag. Res. 11, 5271–5291. doi:10.2147/CMAR.S170380
Martens-Uzunova, E. S., Jalava, S. E., Dits, N. F., van Leenders, G. J. L. H., Møller, S., Trapman, J., et al. (2012). Diagnostic and prognostic signatures from the small non-coding RNA transcriptome in prostate cancer. Oncogene 31 (8), 978–991. doi:10.1038/onc.2011.304
Matsuzaki, K., Fujita, K., Tomiyama, E., Hatano, K., Hayashi, Y., Wang, C., et al. (2021). MiR-30b-3p and miR-126-3p of urinary extracellular vesicles could be new biomarkers for prostate cancer. Transl. Androl. Urology 10 (4), 1918–1927. doi:10.21037/tau-20-421
Menck, K., Bleckmann, A., Wachter, A., Hennies, B., Ries, L., Schulz, M., et al. (2017). Characterisation of tumour-derived microvesicles in cancer patients’ blood and correlation with clinical outcome. J. Extracell. Vesicles 6 (1), 1340745. doi:10.1080/20013078.2017.1340745
Mercadal, M., Herrero, C., López-Rodrigo, O., Castells, M., de la Fuente, A., Vigués, F., et al. (2020). Impact of extracellular vesicle isolation methods on downstream mirna analysis in semen: a comparative study. Int. J. Mol. Sci. 21 (17), 5949. doi:10.3390/ijms21175949
Motamedinia, P., Scott, A. N., Bate, K. L., Sadeghi, N., Salazar, G., Shapiro, E., et al. (2016). Urine exosomes for non-invasive assessment of gene expression and mutations of prostate cancer. PloS One 11 (5), e0154507. doi:10.1371/journal.pone.0154507
Murphy, L., Prencipe, M., Gallagher, W. M., and Watson, R. W. (2015). Commercialized biomarkers: new horizons in prostate cancer diagnostics. Expert Rev. Mol. Diagnostics 15 (4), 491–503. doi:10.1586/14737159.2015.1011622
Nilsson, J., Skog, J., Nordstrand, A., Baranov, V., Mincheva-Nilsson, L., Breakefield, X. O., et al. (2009). Prostate cancer-derived urine exosomes: a novel approach to biomarkers for prostate cancer. Br. J. Cancer 100 (10), 1603–1607. doi:10.1038/sj.bjc.6605058
Olvedy, M., Scaravilli, M., Hoogstrate, Y., Visakorpi, T., Jenster, G., and Martens-Uzunova, E. S. (2016). A comprehensive repertoire of tRNA-derived fragments in prostate cancer. Oncotarget 7 (17), 24766–24777. doi:10.18632/oncotarget.8293
Padmanabhan, A., Rao, V., De Marzo, A. M., and Bieberich, C. J. (2016). Regulating NKX3.1 stability and function: post-translational modifications and structural determinants. Prostate 76 (6), 523–533. doi:10.1002/pros.23144
Palacín-Aliana, I., García-Romero, N., Asensi-Puig, A., Carrión-Navarro, J., González-Rumayor, V., and Ayuso-Sacido, Á. (2021). Clinical utility of liquid biopsy-based actionable mutations detected via ddPCR. Biomedicines 9 (8), 906. doi:10.3390/biomedicines9080906
Papachristodoulou, A., Rodriguez-Calero, A., Panja, S., Margolskee, E., Virk, R. K., Milner, T. A., et al. (2021). NKX3.1 localization to mitochondria suppresses prostate cancer initiation. Cancer Discov. 11 (9), 2316–2333. doi:10.1158/2159-8290.CD-20-1765
Pellegrini, K. L., Patil, D., Douglas, K. J. S., Lee, G., Wehrmeyer, K., Torlak, M., et al. (2017). Detection of prostate cancer-specific transcripts in extracellular vesicles isolated from post-DRE urine. Prostate 77 (9), 990–999. doi:10.1002/pros.23355
Prensner, J. R., Rubin, M. A., Wei, J. T., and Chinnaiyan, A. M. (2012). Beyond PSA: the next generation of prostate cancer biomarkers. Sci. Transl. Med. 4 (127), 127rv3. doi:10.1126/scitranslmed.3003180
Rahman, M., Jackson, L. K., Johnson, W. E., Li, D. Y., Bild, A. H., and Piccolo, S. R. (2015). Alternative preprocessing of RNA-Sequencing data in the Cancer Genome Atlas leads to improved analysis results. Bioinformatics 31 (22), 3666–3672. doi:10.1093/bioinformatics/btv377
Ramirez-Garrastacho, M., Bajo-Santos, C., Line, A., Martens-Uzunova, E. S., de la Fuente, J. M., Moros, M., et al. (2022a). Extracellular vesicles as a source of prostate cancer biomarkers in liquid biopsies: a decade of research. Br. J. Cancer 126 (3), 331–350. doi:10.1038/s41416-021-01610-8
Ramirez-Garrastacho, M., Berge, V., Linē, A., and Llorente, A. (2022b). Potential of miRNAs in urinary extracellular vesicles for management of active surveillance in prostate cancer patients. Br. J. Cancer 126 (3), 492–501. doi:10.1038/s41416-021-01598-1
Rodríguez, M., Bajo-Santos, C., Hessvik, N. P., Lorenz, S., Fromm, B., Berge, V., et al. (2017). Identification of non-invasive miRNAs biomarkers for prostate cancer by deep sequencing analysis of urinary exosomes. Mol. Cancer 16 (1), 156. doi:10.1186/s12943-017-0726-4
Rounds, L., Nagle, R. B., Muranyi, A., Jandova, J., Gill, S., Vela, E., et al. (2021). Glyoxalase 1 expression as a novel diagnostic marker of high-grade prostatic intraepithelial neoplasia in prostate cancer. Cancers 13 (14), 3608. doi:10.3390/cancers13143608
Royo, F., Théry, C., Falcón-Pérez, J. M., Nieuwland, R., and Witwer, K. W. (2020). Methods for separation and characterization of extracellular vesicles: results of a worldwide survey performed by the ISEV rigor and standardization subcommittee. Cells 9 (9), 1955. doi:10.3390/cells9091955
Sadovska, L., Zayakin, P., Eglītis, K., Endzeliņš, E., Radoviča-Spalviņa, I., Avotiņa, E., et al. (2022). Comprehensive characterization of RNA cargo of extracellular vesicles in breast cancer patients undergoing neoadjuvant chemotherapy. Front. Oncol. 12, 1005812. doi:10.3389/fonc.2022.1005812
Salvi, S., Bandini, E., Carloni, S., Casadio, V., Battistelli, M., Salucci, S., et al. (2021). Detection and investigation of extracellular vesicles in serum and urine supernatant of prostate cancer patients. Diagnostics 11 (3), 466. doi:10.3390/diagnostics11030466
Samsonov, R., Shtam, T., Burdakov, V., Glotov, A., Tsyrlina, E., Berstein, L., et al. (2016). Lectin-induced agglutination method of urinary exosomes isolation followed by mi-RNA analysis: application for prostate cancer diagnostic. Prostate 76 (1), 68–79. doi:10.1002/pros.23101
Sharad, S., Dobi, A., Srivastava, S., Srinivasan, A., and Li, H. (2020). PMEPA1 gene isoforms: a potential biomarker and therapeutic target in prostate cancer. Biomolecules 10 (9), 1221. doi:10.3390/biom10091221
Sung, H., Ferlay, J., Siegel, R. L., Laversanne, M., Soerjomataram, I., Jemal, A., et al. (2021). Global cancer statistics 2020: GLOBOCAN estimates of incidence and mortality worldwide for 36 cancers in 185 countries. CA A Cancer J. Clin. 71 (3), 209–249. doi:10.3322/caac.21660
Thornalley, P. J. (2003). Glyoxalase I – structure, function and a critical role in the enzymatic defence against glycation. Biochem. Soc. Trans. 31 (6), 1343–1348. doi:10.1042/bst0311343
Tonge, D. P., and Gant, T. W. (2013). Evidence based housekeeping gene selection for microRNA-sequencing (miRNA-seq) studies. Toxicol. Res. 2 (5), 328. doi:10.1039/c3tx50034a
Tutrone, R., Donovan, M. J., Torkler, P., Tadigotla, V., McLain, T., Noerholm, M., et al. (2020). Clinical utility of the exosome based ExoDx Prostate(IntelliScore) EPI test in men presenting for initial Biopsy with a PSA 2-10 ng/mL. Prostate Cancer Prostatic Dis. 23 (4), 607–614. doi:10.1038/s41391-020-0237-z
van Niel, G., D’Angelo, G., and Raposo, G. (2018). Shedding light on the cell biology of extracellular vesicles. Nat. Rev. Mol. Cell Biol. 19 (4), 213–228. doi:10.1038/nrm.2017.125
Venables, W. N., and Ripley, B. D. (2002). Modern applied statistics with S. New York: Springer. doi:10.1007/978-0-387-21706-2
Vocke, C. D., Pozzatti, R. O., Bostwick, D. G., Florence, C. D., Jennings, S. B., Strup, S. E., et al. (1996). Analysis of 99 microdissected prostate carcinomas reveals a high frequency of allelic loss on chromosome 8p12-21. Cancer Res. 56 (10), 2411–2416.
Voeller, H. J., Augustus, M., Madike, V., Bova, G. S., Carter, K. C., and Gelmann, E. P. (1997). Coding region of NKX3.1, a prostate-specific homeobox gene on 8p21, is not mutated in human prostate cancers. Cancer Res. 57 (20), 4455–4459.
Woo, H.-K., Park, J., Ku, J. Y., Lee, C. H., Sunkara, V., Ha, H. K., et al. (2019). Urine-based liquid biopsy: non-invasive and sensitive AR-V7 detection in urinary EVs from patients with prostate cancer. Lab a Chip 19 (1), 87–97. doi:10.1039/C8LC01185K
Yan, Y., Liu, J., Xu, Z., Ye, M., and Li, J. (2021). lncRNA PCAT14 is a diagnostic marker for prostate cancer and is associated with immune cell infiltration. Dis. Markers 2021, 9494619. doi:10.1155/2021/9494619
Yáñez-Mó, M., Siljander, P. R.-M., Andreu, Z., Bedina Zavec, A., Borràs, F. E., Buzas, E. I., et al. (2015). Biological properties of extracellular vesicles and their physiological functions. J. Extracell. Vesicles 4 (1), 27066. doi:10.3402/jev.v4.27066
Keywords: prostate cancer, extracellular vesicles, RNA biomarkers, liquid biopsies, droplet digital PCR
Citation: Brokāne A, Bajo-Santos C, Zayakin P, Belovs A, Jansons J, Lietuvietis V, Martens-Uzunova ES, Jenster GW and Linē A (2023) Validation of potential RNA biomarkers for prostate cancer diagnosis and monitoring in plasma and urinary extracellular vesicles. Front. Mol. Biosci. 10:1279854. doi: 10.3389/fmolb.2023.1279854
Received: 18 August 2023; Accepted: 15 November 2023;
Published: 30 November 2023.
Edited by:
Neha Arya, All India Institute of Medical Sciences, IndiaReviewed by:
Manlio Vinciguerra, Medical University of Varna, BulgariaCopyright © 2023 Brokāne, Bajo-Santos, Zayakin, Belovs, Jansons, Lietuvietis, Martens-Uzunova, Jenster and Linē. This is an open-access article distributed under the terms of the Creative Commons Attribution License (CC BY). The use, distribution or reproduction in other forums is permitted, provided the original author(s) and the copyright owner(s) are credited and that the original publication in this journal is cited, in accordance with accepted academic practice. No use, distribution or reproduction is permitted which does not comply with these terms.
*Correspondence: Aija Linē, YWlqYUBiaW9tZWQubHUubHY=
Disclaimer: All claims expressed in this article are solely those of the authors and do not necessarily represent those of their affiliated organizations, or those of the publisher, the editors and the reviewers. Any product that may be evaluated in this article or claim that may be made by its manufacturer is not guaranteed or endorsed by the publisher.
Research integrity at Frontiers
Learn more about the work of our research integrity team to safeguard the quality of each article we publish.