 Nissrin Alachkar
 Dale Norton
 Zsofia Wolkensdorfer
 Mark Muldoon2
 Pawel Paszek
94% of researchers rate our articles as excellent or good
Learn more about the work of our research integrity team to safeguard the quality of each article we publish.
Find out more
ORIGINAL RESEARCH article
Front. Mol. Biosci. , 27 June 2023
Sec. Biological Modeling and Simulation
Volume 10 - 2023 | https://doi.org/10.3389/fmolb.2023.1176107
Transcription of almost all mammalian genes occurs in stochastic bursts, however the fundamental control mechanisms that allow appropriate single-cell responses remain unresolved. Here we utilise single cell genomics data and stochastic models of transcription to perform global analysis of the toll-like receptor (TLR)-induced gene expression variability. Based on analysis of more than 2000 TLR-response genes across multiple experimental conditions we demonstrate that the single-cell, gene-by-gene expression variability can be empirically described by a linear function of the population mean. We show that response heterogeneity of individual genes can be characterised by the slope of the mean-variance line, which captures how cells respond to stimulus and provides insight into evolutionary differences between species. We further demonstrate that linear relationships theoretically determine the underlying transcriptional bursting kinetics, revealing different regulatory modes of TLR response heterogeneity. Stochastic modelling of temporal scRNA-seq count distributions demonstrates that increased response variability is associated with larger and more frequent transcriptional bursts, which emerge via increased complexity of transcriptional regulatory networks between genes and different species. Overall, we provide a methodology relying on inference of empirical mean-variance relationships from single cell data and new insights into control of innate immune response variability.
Transcription of almost all mammalian genes occurs in bursts, during brief and random periods of gene activity. The patterns of temporal mRNA production in a single cell, and the overall mRNA (and protein) distribution in cellular populations, are controlled by transcriptional bursting, namely, via the modulation of burst size and burst frequency (Raj et al., 2006; Suter et al., 2011; Molina et al., 2013). The innate and adaptive immune responses exhibit extreme variability at the single cell level, in comparison to other tissue systems (Shalek et al., 2013; Shalek et al., 2014; Hagai et al., 2018), where only subsets of cells produce specific effector molecules, and thus are able to respond to pathogen (Avraham et al., 2015; Iakovlev et al., 2021). This apparent level of variability poses a fundamental systems biology question; how do robust immune responses emerge from this heterogeneous transcriptional bursting process?
Recent advances have demonstrated key insights into regulation of transcriptional bursting. In general, the bursting kinetics are gene-specific and subject to regulatory control via cellular signalling events (Suter et al., 2011; Larson et al., 2013; Megaridis et al., 2018; Wong et al., 2018; Bass et al., 2021) as well as genome architecture and promoter sequences (Dar et al., 2012; Dey et al., 2015; Zoller et al., 2015; Hagai et al., 2018; Ochiai et al., 2020; Einarsson et al., 2022). For example, core promoters control burst sizes, while enhancer elements modulate burst frequency to define cell-type specific (Larsson et al., 2019) or circadian gene expression outputs (Nicolas et al., 2018). Coordinated gene activity has also been shown to regulate mRNA outputs as a function of spatial position during development (Zoller et al., 2018; Hoppe et al., 2020; Wang et al., 2020) as well as temporal immune responses (Robles-Rebollo et al., 2022). The resulting cell-to-cell variability is a consequence of the stochastic processes governing signalling and transcription (Elowitz et al., 2002), but also reflects extrinsic differences between individual cells (Spencer et al., 2009; Adamson et al., 2016; Phillips et al., 2019; Shaffer et al., 2020) or variability of the pathogen in the context of the innate immune response (Avraham et al., 2015). With individual genes exhibiting different levels of stimuli-induced heterogeneity, we are still lacking general understanding of how transcription is regulated at the single cell level.
Toll-like (TLR) receptor signalling constitutes one of the fundamental, evolutionarily conserved innate immune defence mechanisms against foreign threats (Gay et al., 2014; Bryant et al., 2015), yet exhibits substantial cell-to-cell variability (Shalek et al., 2013; Shalek et al., 2014; Lu et al., 2015; Xue et al., 2015; Hagai et al., 2018). We recently demonstrated that this overall TLR response to stimulation (or in general perturbation) is constrained through gene-specific transcriptional bursting kinetics (Bagnall et al., 2020). By utilising single molecule Fluorescent in situ Hybridisation (smFISH), we established that the overall mRNA variability is linearly constrained by the mean mRNA response across a range of related stimuli. Variance (and in fact higher moments) of the mRNA distributions have been also shown to be constrained by the mean response in the developing embryo (Zoller et al., 2018). These analyses suggest that complex transcriptional regulation at a single cell level may be globally characterised by mean-variance relationships of gene-specific mRNA outputs, providing new ways to characterise response variability. While quantitative smFISH provides important insights, this approach is often limited by the number of genes, which can be investigated (Raj et al., 2008; Zenklusen et al., 2008; Larson et al., 2013; Lee et al., 2014; Gomez-Schiavon et al., 2017; Bagnall et al., 2018; Bagnall et al., 2020; Bass et al., 2021), therefore further analyses of global gene expression patterns (Larsson et al., 2019; Ochiai et al., 2020) are required to fully understand the underlying regulatory constraints.
Here we utilise scRNA-seq data on innate immune phagocytes stimulated with common TLR ligands, lipopolysaccharides (LPS) of Gram-negative bacteria upstream of TLR4 and viral-like double-stranded RNA (PIC) for TLR3 (Hagai et al., 2018) to investigate the control of single cell gene expression heterogeneity of the innate immune responses. We analyse 2,338 TLR-response genes and demonstrate that they globally follow empirical linear mean-variance relationships, exhibiting a genome-wide spectrum of response variability levels characterised by the slope of the relationship. We show that linear relationships define different modes of individual-gene response modulation with majority of the genes undergoing frequency modulation to TLR stimulation. Mathematical modelling of scRNA-seq count distributions using dynamic stochastic telegraph models of transcription of varied complexity levels, demonstrates that increased response variability is associated with larger and more frequent transcriptional bursts, which emerge via increased regulatory complexity. Finally, we show that linear mean-variance relationships capture evolutionarily differences in response variability across pig, rabbit, rat, and mouse and predict transcriptional bursting modulation between species. Overall, our data demonstrate the utility of empirical mean-variance relationships in providing new insights into control of transcriptional variability in the innate immune response.
To globally investigate the control of transcriptional bursting in the TLR system relationships we used existing scRNA-seq data from mouse phagocytes either untreated or stimulated with LPS and PIC for 2, 4 and 6 h (Hagai et al., 2018). The dataset contains unique molecular identifier (UMI) mRNA counts for 53,086 cells and 16,798 genes across 20 experimental conditions including replicates, of which 2,338 genes were identified as TLR-dependent (see Figure 1A for correlation of sample mean and variance across all datasets, and Materials and Methods for data processing). While in general, there is a nonlinear relation between the variance and mean response, in agreement with other analyses (Taniguchi et al., 2010; Dar et al., 2016), the relative variability in the data (captured by a coefficient of variation, i.e., standard deviation normalised by the mean) decreases as the level of response increases (Supplementary Figure S1A). We previously showed that the gene-specific variability can be defined by the slope of the mean-variance relationship (Bagnall et al., 2020). To test this phenomenon globally, for each of the 2,338 TLR-inducible genes, the sample mean (μ) and variance (σ2) relationship was fitted using robust linear regression (
FIGURE 1. TLR-induced transcriptional variability is linearly constrained. (A). Overall variability in the scRNA-seq dataset (Hagai et al., 2018). Shown is the scatter plot of the sample mean (μ) and variance (σ2) calculated for 2340 TLR-dependent genes across 20 experimental conditions. Data points corresponding to Jchain, Ccl5 and Nfkbia highlighted in yellow, red, and green, respectively. Broken line indicates μ = σ2 line. (B). Schematic description of the fitting protocol. (C). Histogram of coefficient of determination (R2) for 2,133 gene fits characterised by a significant regression slope (p-value < 0.05). R2 = 0.6 broken line corresponds to the high confidence gene cut-off. (D). Distribution of the fitted regression slopes for the 1,551 high confidence gene set. Histogram of the fitted slopes shown on the left. Number of genes with different slope range shown on the right. (E). Fitted mean-variance relationships for a subset of genes. Shown are the individual datapoints (LPS, PIC and unstimulated) as well as fitted regression line with a fitted equation (* denotes statistically significant intercept, p-value < 0.05) and the coefficient of determination (R2). (F). Mean mRNA counts across treatments (LPS, PIC) and time (0, 2, 4, 6 h) for the 1,551 high confidence genes.
Having established the linear relationships relating the gene-specific transcriptional variability to mean expression, we sought to study global properties of transcriptional bursting underlying these trends. We used moment estimators of the underlying scRNA-seq count distributions to calculate bursting characteristics, such that burst size bs = σ2/μ (i.e., the Fano factor) and burst frequency bf = μ/bs (Nicolas et al., 2017). These estimators rely on the moments of the mRNA distributions to quantify ‘burstiness’ as a departure ‘nonbursty’ Poissonian mRNA production, characterised by bs = 1 and bf =
FIGURE 2. Mean-variance relationships constrain transcriptional bursting characteristics. (A). Theoretical burst size and frequency characteristics. (Left) Simulated mean variance relationships with positive (in blue, α = 20, α0 = 100) and negative (in red, α = 20, α0 = −100) intercepts, respectively. (Middle & Right) Derived burst size and frequency modulation schemes for corresponding parameter values calculated using moment estimators. A special case of α = 20, α0 = 0 is shown in broken line. (B). Global modulation of transcriptional busting. Shown is the comparison between fitted mean-variance relationship and derived theoretical burst size and frequency modulation schemes vs. experimental data. Shown is distribution of relative root mean square error (RRMSE) of 1,551 high confidence genes (C). Modulation schemes for Cd44, Pfn1, Eif6 and Cxcl10 genes. Shown is the comparison between theoretical relationships based on fitted mean-variance relationships (in red) and corresponding estimates from data (open circles). Equations for fitted mean-variance relationships highlighted in the top left panel, respectively.
We calculated the theoretical bursting modulation schemes for the 1,551 high confidence genes and compared these to the moment estimators of the burst size and frequency from the data (Figure 2B). We found that the average relative root mean square error (RRMSE, see methods) of the mean-variance fit in relation to data was 0.07% ± 0.02%, where 1,431 genes had an error smaller than 0.1%. In comparison, the average error for the burst size modulation was 0.08% ± 0.03% (with 1,281 genes having an error smaller than 0.1%), while the average error for the burst frequency modulation was 0.07% ± 0.1% (with 1,389 genes having an error smaller than 0.1%). Given their empirical nature, the predicted theoretical trends are in good agreement with the changes of burst size and frequency observed in the data. Profilin 1 (Pnf1) and Cd44 are example genes characterised by intercept α0<0, while the genes encoding eukaryotic translation initiation factor 6 (Eif6) and Cxcl10 had α0>0 (Figure 2C). Jchain is an example of a gene with a good mean-variance fit, but one of the poorest fit in terms of bursting frequency, which might be due to limited sample size and its profound variability. Of the 1,551 high confidence genes, 430 genes had a significant intercept (p-value < 0.05) in the regression fit, with 414 characterised by negative and 16 positive intercepts (Supplementary Figure S1F). While intuitively zero intercept is expected (i.e., no expression in untreated conditions), these in part reflect the empirical nature of these trends and the limited sample size, especially for those genes where α0 is small (in relation to variance), for example, Cxcl10 (Figure 2C). However, many genes, including Pnf1 and Eif6 exhibit substantial basal expression in untreated cells (Bass et al., 2021), resulting in either elevated or reduced variability (in relation to true zero) being captured via non-zero intercept in the regression fit (Bagnall et al., 2020).
The linear mean-variance relationships reflect the constrained changes of burst size and burst frequency required to regulate response variability as shown in their derived analytical functions of the mean mRNA expression. To understand the modulation of transcriptional bursting, we first calculated fold changes of burst size vs. burst frequency across the range of mean expression calculated for individual response genes (Figure 3A). We found that 1,015 out of the 1,551 high confidence genes exhibit 2 times more fold changes in burst frequency than burst size. This suggests a predominant frequency modulation, in agreement with recent analyses of LPS-induced macrophages (Robles-Rebollo et al., 2022). However, we also found 48 genes exhibiting fold changes in burst size 2 times more than burst frequency, while 389 exhibited comparable modulation of both burst size and burst frequency. To study the transcriptional bursting modulation more systematically, we derived an analytical relationship between the burst size and frequency (independent of the mean mRNA expression) based on the linear constrains (Figure 3B). The general relationship is given by bf = α0/(bs(bs-α)), where α0 can take positive or negative values. When α0>0, we have an inverse relationship between the burst size and frequency, which asymptotically approaches zero, as the burst size approaches infinity. It is also worth mentioning that, in this case, the function is undefined for values of burst size smaller than or equal to α (Figure 3B, in blue), reflecting a biological limit of burst size and frequency for genes following this modulation trend. We found that 315 genes (out of the 1,551 high confidence genes) exhibited such an inverse relationship, with all genes exhibiting higher frequency than burst size modulation (see Figure 3C for specific genes and Figure 3D and Supplementary Table S2 for global analysis). For the case when α0<0, linear constrains define a non-monotonic relationship between the burst size and frequency on the interval (0,α) with a local minimum at bs* = α/2, and frequency diverging to infinity as burst size tends towards α or is close to 0 (Figure 3B, in red). From the case α0<0, three patterns of bursting modulation can be distinguished; the burst frequency and size exhibit either inverse relationship, where the frequency increases and burst size decreases (for bs < bs*) or concurrent increases (bs > bs*). In addition, we define a U-shape relationship where the inverse or concurrent relationship is possible (i.e.,
FIGURE 3. LPS-induced gene expression undergoes different modes of transcriptional bursting. (A). Relative changes of burst size and burst frequency. Shown is the relative fold change of burst size and frequency calculated across the individual range of mean expression for 1,551 high confidence genes (in blue circles). Identity line depicted in black, two-fold change highlighted in red. (B). Theoretical relationship between burst size and frequency. (Left) Simulated mean variance relationships with positive (in blue, α = 20, α0 = 100) and negative (in red, α = 20, α0 = −100) intercepts, respectively. (Right) Burst size and frequency modulation schemes for corresponding parameter values calculated using moment estimators. A special case of α = 20, α0 = 0 shown in broken line. (C). Modulation of burst size and frequency across a range of individual genes. Shown are inverse relationship (α0 > 0) in blue as well as inverse, U-shape and concurrent relationships (α0 < 0). Relationship predicted from linear constraints in solid lines and corresponding estimates from experimental data in open circles. U-shape numerically defined as maximum burst size value > α/2 and minimum burst size value < α/2 across conditions. (D). Prevalence of different modulation schemes across 1,551 high confidence genes. Definition of the mode as in C, dominant modulation defined by absolute difference in the burst size vs. frequency changes across the respective range of mean expression (as in A).
The distribution of fitted regression slopes varying over 3 orders of magnitude demonstrate a wide range of response variability among individual TLR-induced genes (Figure 1D). While we have demonstrated that individual genes exhibit different modes of transcriptional bursting characteristics to regulate responses to stimulation, we wanted to understand the control of variability in the system more mechanistically. A well-established mathematical description of mRNA production involves a 2-state telegraph model (Figure 4A), where gene activity changes randomly between “off” and “on” states, with mRNA transcription occurring in the “on” state (Raj et al., 2006; Zenklusen et al., 2008; Suter et al., 2011; Nicolas et al., 2018). The associated parameters are gene activity rates (kon and koff) as well as rate of mRNA transcription (kt) and degradation (kd) (Nicolas et al., 2018). Although the 2-state telegraph model has been widely used in the past to model mRNA count data, more complex structures are often required to capture additional complexity associated with multiple regulatory steps, combinatorial promoter cycling and transcriptional initiation (Harper et al., 2011; Zoller et al., 2015). We previously showed that heterogenous Il1β mRNA transcription requires more regulatory steps than that of Tnfα (Bagnall et al., 2020). We therefore hypothesised that TLR response variability is linked with the complexity of the transcriptional regulation. To test this hypothesis, we introduced a 3-state stochastic model, which assumes sequential promoter activation between “off”, “intermediate” and “on” states, equivalent to promoter cycling (Harper et al., 2011; Zoller et al., 2015), with transcription occurring in the “intermediate” (I) state as well as in the “on” state, characterised by 5 transition rates (ton, toff, kon, koff and kc), 2 transcription rates (kti and kt), and a degradation rate kd (Figure 4A).
FIGURE 4. TLR response variability is associated with regulatory complexity. (A). Schematic representation of the 2-state and 3-state models of transcription. (B). Comparison between the fitted and measured mRNA counts distributions. Shown are cumulative probability distribution of data (in green) vs. the corresponding 2-state and 3-state stochastic model fits (in red and blue, respectively) for representative condition for Eif6 (PIC, 4h, replicate 3) and Ccl2 (LPS, 2h, replicate 2) genes. (C). Analysis of transcriptional bursting across high coverage genes and conditions fitted by 2-state vs. 3-state models. Shown is the comparison between best fit 2-state and 3-state models in terms of mean mRNA expression, variance, burst size and frequency from experimental data. Best fit defined by AICbest model<0.5AIC2nd best (from Supplementary Figure S3B). Burst size and frequency calculated per condition using moment estimators. Statistical significance assessed with Mann-Whitney test (** p-value < 0.01, **** p-value < 0.0001). (D). Relationship between slope of the mean-variance relationship and fraction of 3-state model fits for high coverage genes. Fraction of 3-state model fits per gene defined by the number of conditions with AIC3-state model<AIC2-state over all conditions per gene. Broken line indicates 0.5, r denotes Spearman correlation coefficient.
We first used a profile likelihood approach (Vu et al., 2016; Larsson et al., 2019) to fit the measured scRNA-seq count distributions assuming steady state kinetics of the 2-state model (the so called Beta-Poisson model) for the 1,551 high confidence genes, each across 20 treatment datasets (Supplementary Table S3). Values of kinetic parameters were inferred for 7,804 of 31,020 datasets (∼25% across 1,519 genes), which in general corresponded to genes characterised by larger expression, in comparison to those that failed to fit (Supplementary Figure S2A). The fitted parameter values (kon, koff and kt, expressed in units per degradation half-life) varied over 3 orders of magnitude across all genes and datasets (Supplementary Figure S2B). In general, gene inactivation rates (koff) were greater than activation rates (kon) (Supplementary Figure S2C), consistent with intermittent transcriptional kinetics (Suter et al., 2011; Dar et al., 2012; Larsson et al., 2019). While the Beta-Poisson model explicitly assumes a steady-state (and does not make any assumptions about mRNA half-life), we wanted to account for the underlying dynamical stochastic processes and corresponding temporal mRNA production and decay (Gomez-Schiavon et al., 2017). However, it was not computationally feasible to fit all genes across all scRNA-seq datasets, we therefore identified on a subset of 99 high confidence genes for which at least 10 datasets were fitted using a Beta-Poisson model (Supplementary Figure S2D). Of these, 96 had an existing measurement of mRNA half-life (which is required for dynamical model fitting) in LPS-stimulated bone marrow derived macrophages (Hao and Baltimore, 2009; Kratochvill et al., 2011) or other cell models (Maurer et al., 1999; Raghavan et al., 2002; Park et al., 2004; Sharova et al., 2009; Kambara et al., 2014; Payne et al., 2014; Martin et al., 2017; Zainol et al., 2019) (see Supplementary Table S3 for specific values). The resulting 96 high coverage genes included 51 of 100 most variable genes (as defined by the fitted regression slope) and 60 of 100 most expressed genes including chemokine family Ccl5, Ccl4, Ccl3, Ccl2 as well as IL1b and TNFa (Supplementary Figure S2D–F, see Supplementary Table S3 for a list of genes and fitted relationships).
We used a genetic algorithm to fit dynamical 2-state and 3-state stochastic models across 20 individual datasets (LPS and PIC stimulation at 0, 2, 4, 6 h time-course across replicates) for the 96 high coverage genes (see Material and Methods). We then applied the Akaike information criterion (AIC) (Akaike, 1973) incorporating the penalty for model complexity, to select the simplest (i.e., best fit) model that accurately fitted the measured mRNA distributions per condition, noting that the lower AIC value corresponds to the better model fit. In general, we found that Beta-Poisson model, the least constrained model, fitted better than dynamical models (805 out of 1,210 conditions (i.e., treatment and replicates) favoured Beta-Poisson model based on their AIC values, Supplementary Figure S3A, B). The more constrained dynamical 2-state model provided a best fit for 170 conditions, while the 3-state model best captured 235 conditions (and 30 and 57, respectively when using a more stringent criterion of two-fold AIC change, Supplementary Figure S3B). When comparing 2-state with 3-state model directly and assuming a two-fold AIC change between the two models, there were 141 out of 1,507 conditions that favoured the 2-state model, while the opposite was true for 266 conditions (see Supplementary Figure S3C for other thresholds). For example, 2-state model recapitulated PIC-treated Eif6 mRNA count distribution (at 4 h) better than a 3-state model, as reflected by the AIC2-state<AIC3-state, this to some extent reflects the fact that although generally more accurate, the 3-state model is also more difficult to fit by the genetic algorithm. In turn, the 3-state model better recapitulated the LPS-treated Ccl2 distribution (at 2 h) spanning almost over 3 orders of magnitudes (Figure 4B). The number of 2-state-and 3-state model fits was not strongly related to the treatment, time point or in fact biological replicates, although LPS had 155 conditions more fitted with 3-state than 2-state model (Supplementary Figure S3D).
The 141 2-state model fits were characterised by kon = 0.02 ± 0.01 min-1 (half-time of 35 min) on average, and off rates averaging koff = 0.74 ± 0.25 min-1 (half-time of 1 min), with average transcription rate kt = 1.23 ± 4.44 mRNA min-1, indicative of ‘bursty’ kinetics (Supplementary Figure S4A). The ‘on’ rate showed significant positive correlation with the variance of the corresponding count distributions (r = 0.48), demonstrating that a faster ‘on’ switch contributes towards increased response variability. The 266 3-state model fits were also characterised by relatively slow average ‘on’ rates (ton = 0.036 ± 0.13 min-1 and kon = 0.33 ± 0.32 min-1) in relation to the ‘off’ rates (toff = 0.74 ± 0.26 min-1, koff = 0.44 ± 0.36 min-1 and kc = 0.50 ± 0.36 min-1, Supplementary Figure S4B). The mRNA count variance was correlated positively with ton rate (i.e., transition to intermediate state, r = 0.33) as well as with transcription rates in ‘on’ and ‘intermediate’ states (r > 0.4). In comparison to the 2-state model, the transcription rate in the ‘on’ state was significantly higher (kt = 7.63 ± 13.05 mRNA min-1) indicative of larger burst sizes (Supplementary Figure S4C, D).
We then asked if the level of variability is linked with the model complexity. We found that scRNA-seq count distributions fitted with the 3-state model were characterised by greater variability than those corresponding to the 2-state model (see Figure 4C; Supplementary Figure S4D for less stringent model selection thresholds). In agreement, the 3-state-model fits were associated with significantly larger burst size and lower burst frequency than that of the 2-state model fits, consistent with more heterogenous bursting kinetics across the relevant conditions. Finally, we analysed model selection across individual high coverage genes rather than corresponding conditions; we found the fraction of conditions explained by one model changes between individual genes (e.g., 3-state model fitted 3 out of 20 for Eif6, 10 out of 20 for Ccl5 and all conditions for Vcam1 Figure 4D). Our interpretation of this is that as the mRNA responses increase, a more complex regulatory structure is required to capture the underlying distribution. We found that, for the high coverage genes, the fraction of conditions explained by the 3-state model correlated well (r = 0.56, p-value < 0.0001) with the slope of mean-variance relationship, and thus response heterogeneity (Figure 4D). Overall, this demonstrates that while increased heterogeneity involves larger and infrequent bursts (in comparison to homogenous responses), this is underlined by increased complexity of the transcriptional regulatory network.
Previous work highlighted the relationship between evolutionary response divergence of innate immune genes and their cell-to-cell variability, with highly divergent genes exhibiting more variability (Hagai et al., 2018). However, the changes in patterns of transcriptional bursting during evolution is still poorly understood. We proposed that by comparing the linear mean-variance relationships across species, the variations in transcriptional bursting patterns that develop through evolution could be better understood. Specifically, if the evolutionary changes in response variability can be captured by a fold-change k in the slope of the relationship, then the increased variability is predicted to be due to increased burst size and reduced burst frequency by a factor k, respectively (Figure 5A).
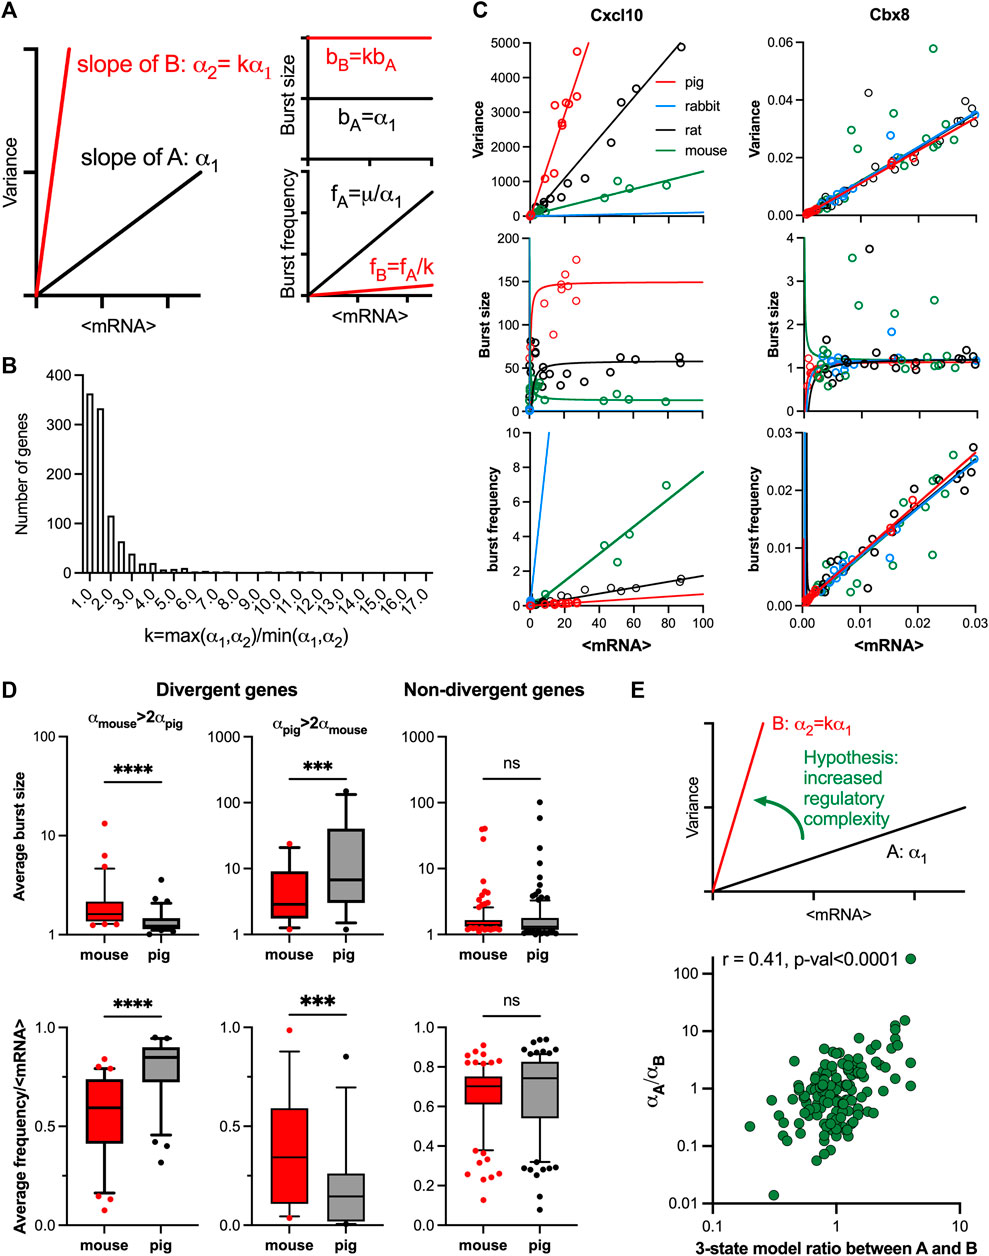
FIGURE 5. Evolutionary control of TLR response variability. (A). Schematic representation of response variability during evolution for putative species A and (B). Shown are mean variance relationships corresponding to slopes (α1 and α2 = kα1) and the predicted burst size (B) and frequency (F) modulation schemes for corresponding parameter values calculated using moment estimators. (B). Histogram of the slope ratio k calculated for the 169 orthologue genes across all pairwise comparisons between mouse, rat, rabbit and pig. k = max (α1,α2)/min (α1,α2), where α1 and α2 denote slopes of the fitted mean-variance relationships for each pair of species per gene. (C). Modulation schemes for Cxcl10 and Cbx8 genes. Shown is the comparison between theoretical relationships based on the fitted mean-variance relationships (in solid lines, colour-coded by species) and corresponding moment estimates for burst size and frequency from experimental data (circles). (D). Analysis of burst size and frequency for divergent and non-divergent mouse and pig TLR-response genes. Shown are box plots of average burst size and mean-normalized frequency per gene stratified into divergent (αmouse> 2αpig or αpig>2αpig) and complementary non-divergent groups (31, 15 and 123 orthologue genes, respectively). Statistical significance assessed with a paired Wilcoxon test (**** p-value < 0.0001, *** p-value < 0.001, ns not significant). (E). Change of variability between species is associated with regulatory complexity. Top: Schematic representation of the hypothesis. Bottom: Relationship between the slope ratio (αA/αB) estimated for 146 pairwise comparisons between 28 fitted orthologue genes for mouse, rat, rabbit and pig; and the corresponding ratio between species A and B of the number of conditions per gene with 3-state model fitting better than 2-state model. Absolute difference in AIC of the two models was used for model selection. Shown is the Spearman correlation coefficient r and a p-value for r > 0.
The relationship between the mean and variance of the single cell mRNA counts was studied in data for four mammalian species from Hagai et al. (2018): mouse, rat, pig, and rabbit, in cells either untreated or treated with LPS or PIC for 2, 4 and 6 h (see methods and Supplementary Table S4 for species specific number of conditions per gene ranging from 12 to 21). We found that from the 2,338 LPS response genes, a subset of 218 genes with one-to-one orthologues showed response to treatment in all four species (Supplementary Figure S5A). 78% of fitted mean-variance relationships for the 218 genes were characterised by R2 > 0.6, including 102 genes in all four species and 169 in at least three species. To characterise the divergence in response variability we performed species pairwise comparison between the fitted regression slopes of the 169 genes subset (Supplementary Table S5). Out of this subset 21 genes including chemokines Ccl2, Ccl4, Ccl5 and Cxcl10 (Figure 5B; Supplementary Figure S5B), had all 6 possible pairwise comparisons showing significant differences, indicating divergence in TLR response variability between each of the two species. 5 significant FDR values (difference in three out of four species) were obtained for 49 genes including chemokines Ccl20, Ccl3, MMP9 (Supplementary Figure S5B) and cytokines Il1a, Il10 and Il27 indicating significant differences in response variability. On the other hand, no significant differences were obtained between any of the four slopes in 7 genes, including a transcriptional repressor Chromobox Protein Homologue 8 (Cbx8, Figure 5B). In agreement, a distribution of slope ratios calculated across all pairs of species for the 169 genes (Figure 5C and Supplementary Table S6) revealed 49 pairs with k > 5 and 258 pairs with k > 2, indicating substantial changes of the response variability between species, including the chemokine and cytokine genes. Conversely, 54% of slope ratios (549 out of total 1,014 genes) were smaller than 1.5, indicative of conserved variability. The inflammatory chemokines were shown previously to rapidly evolve in mammals and other vertebrates with clear differences in expression between closely related species (Nielsen et al., 2005; Haygood et al., 2010). Moreover, gene duplication of the CC chemokine ligands can result in different copy numbers of these genes between individuals (Nomiyama et al., 2010), further increasing the divergence in expression. Importantly, our analyses specifically capture changes of response variability and suggest a statistical relationship of these changes with the generic evolutionary divergence (see Materials and Methods) of gene expression response (Supplementary Figure S5C).
To validate the predicted changes in transcriptional bursting during evolution (Figure 5A), we first calculated the theoretical modulation schemes for all the 169 evolutionary genes across species and compared these to the moment estimators of the burst size and frequency from the data (Supplementary Figure S5D). We found that the average RRMSE of the mean-variance fit in relation to data was 0.06% ± 0.05% across all species, where 90% genes had an error smaller than 0.1%. In comparison, the average error for the burst size predictions was 0.08% ± 0.05%, while the average error for the burst frequency predictions was 0.05% ± 0.04%. The predicted theoretical trends are in good agreement with the observed changes of burst size and frequency. For example, Cxcl10 exhibits concurrent changes of the burst size and frequency, the level of which is determined by the slope of the relationships, while Cbx8 exhibits the same modulation across species (Figure 5C). In addition, our predictions of species-specific modulation scheme are based not only on the slope α, but also the mean-variance intercept, which we previously showed may affect the bursting relationships (Figure 2A and Supplementary Figure S1E). We therefore investigated if the difference of the slopes alone is sufficient to predict modulation of bursting characteristics across species (Figure 5A). We stratified the 169 orthologous genes into divergent and non-divergent subsets, with the divergence threshold defined by a 2-fold change in the slope of the mean-variance relationships. The divergent subset included 31 genes exhibiting higher slope in mouse, and 15 in pig (Supplementary Figure S5E). We found that divergent genes, associated with increased response variability, exhibited significantly higher average burst sizes (as calculated across all corresponding conditions) and reciprocally lower normalised burst frequency when compared between the two species (Figure 5D). In contrast, the non-divergent genes showed no significant differences in the burst size or normalized frequency, as predicted by the linear constraints. Interestingly, we also observed significant differences in the average expression between the divergent genes group, opposing to the non-divergent group (Supplementary Figure S5F).
We then asked if the increased variability in gene expression between species was associated with changes of regulatory complexity (Figure 5E). Following previous methodology, we selected 28 orthologue genes from the subset of 96 of high coverage genes in mouse and used a genetic algorithm to recapitulate scRNA-seq count distributions with dynamical 2-state and 3-state models (see Materials and Methods and Supplementary Table S6 for details of the analysis). We then calculated the fold change in the number of conditions (per gene) fitted with 3-state models across all pairwise comparisons of the four species. We found that this fold change correlated (Spearman’s r = 0.41, p < 0.0001) with the ratio of the slopes between the corresponding linear relationships, such that the transition to a higher slope was associated with increased number of 3-state model fits across corresponding conditions (Figure 5E). Overall, this demonstrates that evolutionary increases in TLR response variability are associated with increased regulatory complexity, resulting in larger and less frequent transcriptional bursting kinetics.
Transcription is inherently a stochastic process leading to heterogeneity in cell-to-cell mRNA levels, which has been studied from the inception of systems biology (Paulsson, 2004). The most recent advances suggest the existence of fundamental constraints governing the heterogeneity of gene expression, which rely on the scaling between the variance and mean of the mRNA response distribution (Dar et al., 2016; Zoller et al., 2018). In particular, we previously developed an approach relaying smFISH a comparative analyses of noise across many immune-related conditions (i.e., treatments, doses and times, etc.), which showed that the overall mRNA variability is linearly constrained by the mean mRNA response across a range of immune-response stimuli (Bagnall et al., 2020). However, these approaches were typically limited by the number of genes considered, not allowing to generalise the observations to the genome-wide scale. Here, utilising an existing scRNA-seq data on the evolutionary-conserved innate immune signalling (Hagai et al., 2018), we perform global analysis of the TLR gene expression response variability and underlying transcriptional bursting. We demonstrate that cell-to-cell variability can be empirically described by a linear function of the population mean across a genome. Based on this, we develop a methodology, relying on statistical modelling of linear mean-variance relationships from single-cell data, that provides a simple yet meaningful way to understand regulation of cellular heterogeneity. We demonstrate that (1) The response heterogeneity of a gene can be defined as the slope of the mean-variance line across >1,500 individual response genes. High variability genes include chemokines and cytokines such as CCL family, while other functional genes are more homogenous, in agreement with previous work (Hagai et al., 2018). (2) The changes in heterogeneity between species can be described by the change in the slope of the corresponding mean-variance lines, providing insights into the evolutionary control of TLR response variability. (3) The linear relationships determine the underlying transcriptional bursting kinetics, revealing different regulatory modes in response to stimulation and through evolution. (4) Application of dynamical stochastic models of transcription demonstrates a link between the variability and the regulatory complexity, with complexity facilitating heterogeneity via larger and less frequent transcriptional bursting kinetics.
While, in general the available sequencing data are subject to measurement noise (Luecken and Theis, 2019), and often restricted by the number of data points available, the mean-variance relationships fitted 1,551 genes - 66% of total 2,338 TLR-inducible genes in primary murine phagocytes across 20 experimental datasets (Figure 1). In comparison, out of the 218 genes with one-to-one orthologues between mouse, rat, rabbit and pig, 78% fitted mean-variance relationships despite the number of datapoints being limited to 12 (Figure 5). Fit quality was reflected in the low mean squared errors between the fitted trends and data, providing good support for the observed phenomenon. We found that 430 relationships (out of 1,551 murine fits) were characterised by statistically significant intercept (α0). While intuitively zero intercept is expected (i.e., no expression in untreated conditions), for some genes, this may reflect the empirical nature of these trends, especially for those with small intercept (in relation to variance), for example, Cxcl10 (Figure 2C). However, we found that many genes with non-zero intercept fits were associated with substantial basal expression in untreated cells, which was also observed previously for the more quantitative smFISH data (Bagnall et al., 2020). Basal expression of the related gene targets has been shown to exhibit different bursting kinetics and mode of regulation from the inducible expression (Bass et al., 2021), which in part may explain the fitted non-zero intercepts for a subset of genes. For α0 = 0, linear constraints essentially imply that the burst size must be constant (and equal to the slope of the mean-variance line), while the frequency undergoes modulation with the population mean changes in response to stimulation. This is in general agreement with recent analyses demonstrating a role of frequency in regulation of LPS-induced macrophages (Robles-Rebollo et al., 2022) or stimulation (Larson et al., 2013; Fukaya et al., 2016; Nicolas et al., 2017; Hoppe et al., 2020; Luo et al., 2022). However, the presence of non-zero intercepts in linear fits extends the variety of modulation schemes, including a subset of genes exhibiting burst size modulation (Figure 3). For instance, a positive intercept is associated with an inverse relationship between the burst size and frequency, while a negative intercept may imply concurrent burst size and frequency changes. As with the mean-variance relationships, the predicted modulation schemes are generally in good agreement with the data in terms of the mean-squared error. Notably, we demonstrate that our methodology can be extended to capture evolutionary differences between species. While gene expression divergence between species has been previously measured in terms of the population response (Nourmohammad et al., 2017), the slope of the linear relationships captures the specific differences in TLR response variability through evolution (Figure 5). We demonstrate that the evolutionary change of the variability can be described as a ratio k between the slopes of the corresponding mean-variance fits, which theoretically implies reciprocal scaling of the burst size and frequency also by k. Analysis of the 218 TLR orthologue genes indeed demonstrates that responses of divergent genes are controlled by reciprocal changes of burst size and frequency, while non-divergent genes show the same characteristics across species. Interestingly, we found that within each pair of species, divergent genes exhibited different changes of variability suggesting complex evolutionary traits (e.g., 31 genes exhibiting higher variability in mouse than in pig, and 15 in pig vs. mouse). Our current analyses also suggest that the slope of the mean-variance relationship, at least in part is related to the amplitude of the gene response (Supplementary Figure S1D), suggesting that more inducible genes exhibited increased variability. It would be important to better understand how variability of particular response genes evolved between different species, in the context of their sequence dissimilarities (Nielsen et al., 2005; Haygood et al., 2010; Nomiyama et al., 2010; Einarsson et al., 2022) as well as epigenetic (Lind and Spagopoulou, 2018) and signalling components (Brennan and Gilmore, 2018) of the TLR signalling between species.
We used stochastic models of transcription to better understand regulation of transcriptional bursting (Figure 4). A typical representation involves a 2-state telegraph model, where gene activity changes randomly between “off” and “on” states, facilitating mRNA transcription (Raj et al., 2006; Zenklusen et al., 2008; Suter et al., 2011; Nicolas et al., 2018). However, more complex structures are often used to capture complexity associated with multiple regulatory steps, combinatorial promoter cycling and transcriptional initiation (Harper et al., 2011; Rybakova et al., 2015; Zoller et al., 2015; Yang et al., 2022). We hypothesised that TLR response variability is linked with the complexity of the transcriptional regulation. We introduced a 3-state stochastic model, which assumed a sequential activation between “off”, “intermediate” and “on” states, equivalent to promoter cycling (Harper et al., 2011; Zoller et al., 2015). First, we used a computationally efficient Beta-Poisson model, a steady-state approximation of the 2-state telegraph model, which has previously been used to fit scRNA-seq distributions (Larsson et al., 2019; Luo et al., 2022). However, this model does not take into account the dynamical nature of the process (measurements at 0, 2, 4 and 6 h) and the mRNA half-life with many genes peaking early after stimulation (Hao and Baltimore, 2009). We therefore used a genetic algorithm to fit the theoretical temporal count distributions at specific times to the measured scRNA-seq data using the dynamical 2-state and 3-state models. Based on the Beta-Poisson fits, we selected 96 high coverage murine response genes (and 28 orthologue genes for species analyses), which have existing estimates of mRNA half-life in LPS-stimulated bone marrow derived macrophages (Hao and Baltimore, 2009; Kratochvill et al., 2011) or other cell models. Our current understanding of TLR signalling suggest that due to endotoxin resistance and desensitisation (Buckley et al., 2006; Morris et al., 2014; Kalliara et al., 2022), the regulatory network, and thus model structures and parameters, are time-varying (Wang et al., 2018). For example, previous work show that stability of TLR target genes are regulated in response to stimulation, and also may vary between treatments (Hao and Baltimore, 2009). However, due to limited availability of the data as well as substantially increased computational complexity when considering non-stationary processes (Shand and Li, 2017), we did not incorporate those effects in our models. In general, the measurement of relevant half-lives over times-scales of different stimulation protocols would allow more accurate fits and ultimately better understanding of the influence of time-varying parameters in the system in the future. In our current fitting protocols we treated each data time-point (and replicate) separately, which also allowed more efficient algorithm implementation to fit 1,507 mouse, and 1,079 orthologue conditions. We then used the AIC method (Akaike, 1973) to compare the models considered, including a penalty for complexity, and select the one that fitted the measured mRNA distributions most accurately. The results demonstrated that a large subset of genes and conditions fitted a dynamical 3-state model better than the 2-state model. We found that the fraction of conditions explained by the 3-state model correlated well (r = 0.56, p-value < 0.0001) with slope of the mean-variance relationship, and thus response heterogeneity, for the high coverage murine genes (Figure 4). Similarly, the increased complexity was associated with evolutionary changes of response variability between species (Figure 5). In general, we found that increased regulatory complexity facilitated larger response variability through increased burst sizes and reduced frequency of transcriptional bursting (Figure 4D), while scRNA-seq count variance exhibited correlations with transcription rates and ‘on’ rates. A better understanding of the relationships, and in particular mechanistic basics for controlling gene-specific slopes (i.e., response variability) as well as their sensitivity to pharmacological perturbation and infection and disease state, will require further detailed investigations (Robles-Rebollo et al., 2022). Nevertheless, we believe that our methodology, relying on the inference of mean-variance relationships, provides new insight into regulation of single-cell variability of innate immune signalling and will be applicable to other gene expression systems, including prominent stochastic regulation of adaptive immunity (de la Higuera et al., 2019; Iakovlev et al., 2021).
Computational analysis was performed using Python v3.8.2 in a 64-bit Ubuntu environment running under Windows Subsystem for Linux (WSL) 2 and using the conda v4.8.3 package manager. Relevant packages were NumPy v1.19.1 (Van Der Walt et al., 2011), pandas v1.0.5 (Reback et al., 2020), Scanpy v1.5.1 (Wolf et al., 2018), scikit-learn v0.23.1 (Pedregosa et al., 2011), SciPy v1.4.1 (Virtanen et al., 2020) and statsmodels v0.11.1 (Seabold and Perktold, 2010) for processing and Matplotlib v3.2.1 (Hunter, 2007) and seaborn v0.10.1 (Waskom et al., 2020) for visualisation. Robust linear regression models and Benjamini-Hochberg false discovery rate (FDR) correction was performed in statsmodels. Coefficient of determination (
mRNA count data associated with the study by Hagai et al. (2018) were downloaded from the Array Express database, in particular, the E-MTAB-6754.processed.2.zip file to obtain the UMI counts of bone marrow-derived mononuclear phagocytes from mouse, rat, pig and rabbit. Phagocytes were either untreated (0 h) or stimulated with LPS for 2, 4 and 6 h, resulting in 12 scRNA-seq datasets per species. In addition, phagocytes from mice and rat were also treated with PIC at 2, 4 and 6 h. Notably, the dataset contains no UMI counts for PIC stimulation at 6 h for mouse 1 but has two for mouse 2 (labelled 6 and 6A). When collating the counts, the missing replicate for mouse 1 was disregarded and the PIC 6A time point—assumed to be a technical replicate—was excluded. Therefore, 20 datasets (referred as conditions herein) for the mouse, 21 datasets for the rat, 12 conditions for the pig and the rabbit dataset were considered for each gene (see Supplementary Table S4). The UMI counts were median scaled per cell using the normalize_total function of Scanpy and subsequently used for fitting mean-variance relationships and bursting modulation. Integer values, referred to as “mRNA counts” in this work were used for mathematical model fitting (see Github repository for data normalisation, UMI normalisation (Grün et al., 2014) and extraction of mRNA count distributions). Gene IDs, gene symbols and the descriptions of the genes were obtained from the Ensembl Release 103 database of the four studied species: Mus musculus (mouse), Rattus norvegicus (rat), Sus scrofa (pig) and Oryctolagus Cuniculus (rabbit) using the BioMart web tool (Yates et al., 2020). Hagai et al. (2018) defined a set of 2,336 LPS-responsive genes based on differential expression in response to LPS stimulation with FDR-corrected p-value < 0.01 and existing orthologues in rabbit, rat and pig. Il1b and Tnf were added to this list—as well characterised TLR-response genes from the study of Bagnall et al. (2020)–resulting in a set of 2,338 LPS response genes with 46,740 conditions overall. Similarly, the responsive genes from the three other species were also determined. 2,586 rat genes, 1892 pig genes and 859 rabbit genes showed differential expression upon LPS stimulus. 218 one-to-one orthologue genes were found to be responsive in all species, these genes formed the analysis subset.
The sample mean (
Comparison between burst size and burst frequency modulation was quantified as the ratio of the two quantities, i.e.,
The differences in the mean-variance relationships of a gene between species were measured by pairwise comparisons between the slopes. A Student’s t-test was performed to determine whether the two slopes are statistically significantly different, or not. The following formula was used to calculate the t-statistic values:
SEslope represents the standard error of the value of the slope in the fitting of the robust linear regression model on the data. The degrees of freedom (d.o.f.) is dependent on the number of data points used to create the two linear regression lines compared (n1 and n2, respectively). p-values were determined using the cumulative distribution function of the relevant t distribution. As the four slopes were compared pairwise, six p-values were calculated per gene. p-values were corrected by the Benjamini-Hochberg procedure. Two slopes were deemed significantly different if the false discovery rate (FDR) corrected p-value was below 0.05. Subset of genes with different number of significant FDR-corrected p-values were compared using a measure of evolutionary response divergence, such that response divergence = log[1/3 × ∑j(log[FC pig] − log[FC glirej])2], with j =(1,2,3) corresponding to 3 glires (mouse, rat and rabbit) and FC is the fold change in response to LPS stimulation per gene (Supplementary Table S4 in (Hagai et al., 2018)).
Inference of Beta-Poisson model parameters (
Theoretical temporal mRNA distributions for considered models of transcription were obtained using the Chemical Master Equation (CME) following our previous approach (Bagnall et al., 2020). In brief, the time evolution of the probability distribution over mRNA counts
A genetic algorithm (GA) was implemented using the ga function in MATLAB and employed to estimate model parameters. We minimised an objective function given by the average absolute distance between the theoretical (CME) and measured cumulative distribution functions (CDFs) across observed mRNA counts per condition (
Akaike’s Information Criterium (AIC) was used to asses model fits and perform model selection (Akaike, 1973).
Statistical analysis was performed using GraphPad Prism 8 software (version 8.4.2). The D’Agostino-Pearson test was applied to test for normal (Gaussian) distribution of acquired data. Two-sample comparison was conducted using non-parametric Mann Whitney test. For analyses of variance Kruskal-Wallis ANOVA with Dunn’s multiple comparisons test was performed. Coefficient of determination (R2) was used to assess regression fits; Spearman correlation coefficient r was used to test association between other variables.
The datasets presented in this study can be found in online repositories. The names of the repository/repositories and accession number(s) can be found below: https://github.com/ppaszek/TLR_bursting; https://www.ebi.ac.uk/biostudies/arrayexpress/studies/E-MTAB-6754.
NA performed analyses presented in the manuscript. DN and ZW performed preliminary analyses and developed Python codes. MM and PP provided supervision and conceptualisation. PP with assistance of NA and MM wrote the manuscript. All authors contributed to the article and approved the submitted version.
NA was supported by Wellcome Trust PhD Studentship. This work was also supported by BBSRC (BB/R007691/1).
The authors declare that the research was conducted in the absence of any commercial or financial relationships that could be construed as a potential conflict of interest.
All claims expressed in this article are solely those of the authors and do not necessarily represent those of their affiliated organizations, or those of the publisher, the editors and the reviewers. Any product that may be evaluated in this article, or claim that may be made by its manufacturer, is not guaranteed or endorsed by the publisher.
The Supplementary Material for this article can be found online at: https://www.frontiersin.org/articles/10.3389/fmolb.2023.1176107/full#supplementary-material
Adamson, A., Boddington, C., Downton, P., Rowe, W., Bagnall, J., Lam, C., et al. (2016). Signal transduction controls heterogeneous NF-κB dynamics and target gene expression through cytokine-specific refractory states. Nat. Commun. 7, 12057. doi:10.1038/ncomms12057
Akaike, H. (1973). “Information theory and an extension of the maximum likelihood principle,” in Selected papers of hirotugu Akaike (Berlin, Germany: Springer).
Al-Mohy, A. H., and Higham, N. J. (2011). Computing the action of the matrix exponential, with an application to exponential integrators. Siam J. Sci. Comput. 33, 488–511. doi:10.1137/100788860
Avraham, R., Haseley, N., Brown, D., Penaranda, C., Jijon, H. B., Trombetta, J. J., et al. (2015). Pathogen cell-to-cell variability drives heterogeneity in host immune responses. Cell 162, 1309–1321. doi:10.1016/j.cell.2015.08.027
Bagnall, J., Boddington, C., England, H., Brignall, R., Downton, P., Alsoufi, Z., et al. (2018). Quantitative analysis of competitive cytokine signaling predicts tissue thresholds for the propagation of macrophage activation. Sci. Signal 11, eaaf3998. doi:10.1126/scisignal.aaf3998
Bagnall, J., Rowe, W., Alachkar, N., Roberts, J., England, H., Clark, C., et al. (2020). Gene-specific linear trends constrain transcriptional variability of the toll-like receptor signaling. Cell Syst. 11, 300–314. doi:10.1016/j.cels.2020.08.007
Bass, V. L., Wong, V. C., Bullock, M. E., Gaudet, S., and Miller-Jensen, K. (2021). TNF stimulation primarily modulates transcriptional burst size of NF-κB-regulated genes. Mol. Syst. Biol. 17, e10127. doi:10.15252/msb.202010127
Brennan, J. J., and Gilmore, T. D. (2018). Evolutionary origins of toll-like receptor signaling. Mol. Biol. Evol. 35, 1576–1587. doi:10.1093/molbev/msy050
Bryant, C. E., Symmons, M., and Gay, N. J. (2015). Toll-like receptor signalling through macromolecular protein complexes. Mol. Immunol. 63, 162–165. doi:10.1016/j.molimm.2014.06.033
Buckley, J. M., Wang, J. H., and Redmond, H. P. (2006). Cellular reprogramming by gram-positive bacterial components: A review. J. Leukoc. Biol. 80, 731–741. doi:10.1189/jlb.0506312
Dar, R. D., Razooky, B. S., Singh, A., Trimeloni, T. V., McCollum, J. M., Cox, C. D., et al. (2012). Transcriptional burst frequency and burst size are equally modulated across the human genome. Proc. Natl. Acad. Sci. U. S. A. 109, 17454–17459. doi:10.1073/pnas.1213530109
Dar, R. D., Shaffer, S. M., Singh, A., Razooky, B. S., Simpson, M. L., Raj, A., et al. (2016). Transcriptional bursting explains the noise-versus-mean relationship in mRNA and protein levels. Plos One 11, e0158298. doi:10.1371/journal.pone.0158298
de la Higuera, L., Lopez-Garcia, M., Castro, M., Abourashchi, N., Lythe, G., and Molina-Paris, C. (2019). Fate of a naive T cell: A stochastic journey. Front. Immunol. 10, 194. doi:10.3389/fimmu.2019.00194
Dey, S. S., Foley, J. E., Limsirichai, P., Schaffer, D. V., and Arkin, A. P. (2015). Orthogonal control of expression mean and variance by epigenetic features at different genomic loci. Mol. Syst. Biol. 11, 806. doi:10.15252/msb.20145704
Einarsson, H., Salvatore, M., Vaagenso, C., Alcaraz, N., Lange, J., Rennie, S., et al. (2022). Promoter sequence and architecture determine expression variability and confer robustness to genetic variants. eLife 11, e80943. doi:10.7554/eLife.80943
Elowitz, M. B., Levine, A. J., Siggia, E. D., and Swain, P. S. (2002). Stochastic gene expression in a single cell. Science 297, 1183–1186. doi:10.1126/science.1070919
Fukaya, T., Lim, B., and Levine, M. (2016). Enhancer control of transcriptional bursting. Cell 166, 358–368. doi:10.1016/j.cell.2016.05.025
Gay, N. J., Symmons, M. F., Gangloff, M., and Bryant, C. E. (2014). Assembly and localization of Toll-like receptor signalling complexes. Nat. Rev. Immunol. 14, 546–558. doi:10.1038/nri3713
Gomez-Schiavon, M., Chen, L. F., West, A. E., and Buchler, N. E. (2017). BayFish: Bayesian inference of transcription dynamics from population snapshots of single-molecule RNA FISH in single cells. Genome Biol. 18, 164. doi:10.1186/s13059-017-1297-9
Grün, D., Kester, L., and van Oudenaarden, A. (2014). Validation of noise models for single-cell transcriptomics. Nat. Methods 11, 637–640. doi:10.1038/nmeth.2930
Hagai, T., Chen, X., Miragaia, R. J., Rostom, R., Gomes, T., Kunowska, N., et al. (2018). Gene expression variability across cells and species shapes innate immunity. Nature 563, 197–202. doi:10.1038/s41586-018-0657-2
Hao, S., and Baltimore, D. (2009). The stability of mRNA influences the temporal order of the induction of genes encoding inflammatory molecules. Nat. Immunol. 10, 281–288. doi:10.1038/ni.1699
Harper, C. V., Finkenstadt, B., Woodcock, D. J., Friedrichsen, S., Semprini, S., Ashall, L., et al. (2011). Dynamic analysis of stochastic transcription cycles. PLoS Biol. 9, e1000607. doi:10.1371/journal.pbio.1000607
Haygood, R., Babbitt, C. C., Fedrigo, O., and Wray, G. A. (2010). Contrasts between adaptive coding and noncoding changes during human evolution. Proc. Natl. Acad. Sci. 107, 7853–7857. doi:10.1073/pnas.0911249107
Hunter, J. D. (2007). Matplotlib: A 2D graphics environment, Computing in Science and Engineering. IEEE Computer Society 9 (3), 99–104. doi:10.1109/MCSE.2007.55
Hoppe, C., Bowles, J. R., Minchington, T. G., Sutcliffe, C., Upadhyai, P., Rattray, M., et al. (2020). Modulation of the promoter activation rate dictates the transcriptional response to graded BMP signaling levels in the Drosophila embryo. Dev. Cell 54, 727–741. doi:10.1016/j.devcel.2020.07.007
Iakovlev, M., Faravelli, S., and Becskei, A. (2021). Gene families with stochastic exclusive gene choice underlie cell adhesion in mammalian cells. Front. Cell Dev. Biol. 9, 642212. doi:10.3389/fcell.2021.642212
Kalliara, E., Kardynska, M., Bagnall, J., Spiller, D. G., Müller, W., Ruckerl, D., et al. (2022). Post-transcriptional regulatory feedback encodes JAK-STAT signal memory of interferon stimulation. Front. Immunol. 13, 947213. doi:10.3389/fimmu.2022.947213
Kambara, H., Niazi, F., Kostadinova, L., Moonka, D. K., Siegel, C. T., Post, A. B., et al. (2014). Negative regulation of the interferon response by an interferon-induced long non-coding RNA. Nucleic Acids Res. 42, 10668–10680. doi:10.1093/nar/gku713
Kratochvill, F., Machacek, C., Vogl, C., Ebner, F., Sedlyarov, V., Gruber, A. R., et al. (2011). Tristetraprolin-driven regulatory circuit controls quality and timing of mRNA decay in inflammation. Mol. Syst. Biol. 7, 560. doi:10.1038/msb.2011.93
Larson, D. R., Fritzsch, C., Sun, L., Meng, X., Lawrence, D. S., and Singer, R. H. (2013). Direct observation of frequency modulated transcription in single cells using light activation. Elife 2, e00750. doi:10.7554/eLife.00750
Larsson, A. J. M., Johnsson, P., Hagemann-Jensen, M., Hartmanis, L., Faridani, O. R., Reinius, B., et al. (2019). Genomic encoding of transcriptional burst kinetics. Nature 565, 251–254. doi:10.1038/s41586-018-0836-1
Lee, R. E., Walker, S. R., Savery, K., Frank, D. A., and Gaudet, S. (2014). Fold change of nuclear NF-κB determines TNF-induced transcription in single cells. Mol. Cell 53, 867–879. doi:10.1016/j.molcel.2014.01.026
Lind, M. I., and Spagopoulou, F. (2018). Evolutionary consequences of epigenetic inheritance. Heredity 121, 205–209. doi:10.1038/s41437-018-0113-y
Lu, Y., Xue, Q., Eisele, M. R., Sulistijo, E. S., Brower, K., Han, L., et al. (2015). Highly multiplexed profiling of single-cell effector functions reveals deep functional heterogeneity in response to pathogenic ligands. Proc. Natl. Acad. Sci. U. S. A. 112, E607–E615. doi:10.1073/pnas.1416756112
Luecken, M. D., and Theis, F. J. (2019). Current best practices in single-cell RNA-seq analysis: A tutorial. Mol. Syst. Biol. 15, e8746. doi:10.15252/msb.20188746
Luo, X., Qin, F., Xiao, F., and Cai, G. (2022). BISC: Accurate inference of transcriptional bursting kinetics from single-cell transcriptomic data. Briefings Bioinforma. 23, bbac464. doi:10.1093/bib/bbac464
Martin, L. J., Smith, S. B., Khoutorsky, A., Magnussen, C. A., Samoshkin, A., Sorge, R. E., et al. (2017). Epiregulin and EGFR interactions are involved in pain processing. J. Clin. Invest. 127, 3353–3366. doi:10.1172/JCI87406
Maurer, F., Tierney, M., and Medcalf, R. L. (1999). An AU-rich sequence in the 3'-UTR of plasminogen activator inhibitor type 2 (PAI-2) mRNA promotes PAI-2 mRNA decay and provides a binding site for nuclear HuR. Nucleic Acids Res. 27, 1664–1673. doi:10.1093/nar/27.7.1664
Megaridis, M. R., Lu, Y. Y., Tevonian, E. N., Junger, K. M., Moy, J. M., Bohn-Wippert, K., et al. (2018). Fine-tuning of noise in gene expression with nucleosome remodeling. Apl. Bioeng. 2, 026106. doi:10.1063/1.5021183
Molina, N., Suter, D. M., Cannavo, R., Zoller, B., Gotic, I., and Naef, F. (2013). Stimulus-induced modulation of transcriptional bursting in a single mammalian gene. Proc. Natl. Acad. Sci. U. S. A. 110, 20563–20568. doi:10.1073/pnas.1312310110
Morris, M. C., Gilliam, E. A., and Li, L. (2014). Innate immune programing by endotoxin and its pathological consequences. Front. Immunol. 5, 680. doi:10.3389/fimmu.2014.00680
Nicolas, D., Phillips, N. E., and Naef, F. (2017). What shapes eukaryotic transcriptional bursting? Mol. Biosyst. 13, 1280–1290. doi:10.1039/c7mb00154a
Nicolas, D., Zoller, B., Suter, D. M., and Naef, F. (2018). Modulation of transcriptional burst frequency by histone acetylation. Proc. Natl. Acad. Sci. U. S. A. 115, 7153–7158. doi:10.1073/pnas.1722330115
Nielsen, R., Bustamante, C., Clark, A. G., Glanowski, S., Sackton, T. B., Hubisz, M. J., et al. (2005). A scan for positively selected genes in the genomes of humans and chimpanzees. PLOS Biol. 3, e170. doi:10.1371/journal.pbio.0030170
Nomiyama, H., Osada, N., and Yoshie, O. (2010). The evolution of mammalian chemokine genes. Cytokine Growth Factor Rev. 21, 253–262. doi:10.1016/j.cytogfr.2010.03.004
Nourmohammad, A., Rambeau, J., Held, T., Kovacova, V., Berg, J., and Lässig, M. (2017). Adaptive evolution of gene expression in Drosophila. Cell Rep. 20, 1385–1395. doi:10.1016/j.celrep.2017.07.033
Ochiai, H., Hayashi, T., Umeda, M., Yoshimura, M., Harada, A., Shimizu, Y., et al. (2020). Genome-wide kinetic properties of transcriptional bursting in mouse embryonic stem cells. Sci. Adv. 6, eaaz6699. doi:10.1126/sciadv.aaz6699
Park, J. H., Yu, Q., Erman, B., Appelbaum, J. S., Montoya-Durango, D., Grimes, H. L., et al. (2004). Suppression of IL7Ralpha transcription by IL-7 and other prosurvival cytokines: A novel mechanism for maximizing IL-7-dependent T cell survival. Immunity 21, 289–302. doi:10.1016/j.immuni.2004.07.016
Paulsson, J. (2004). Summing up the noise in gene networks. Nature 427, 415–418. doi:10.1038/nature02257
Payne, T. L., Blackinton, J., Frisbee, A., Pickeral, J., Sawant, S., Vandergrift, N. A., et al. (2014). Transcriptional and posttranscriptional regulation of cytokine gene expression in HIV-1 antigen-specific CD8+ T cells that mediate virus inhibition. J. Virology 88, 9514–9528. doi:10.1128/JVI.00802-14
Pedregosa, F., Varoquaux, G., Gramfort, A., Michel, V., Thirion, B., Grisel, O., et al. (2011). Scikit-learn: Machine learning in Python, Journal of Machine Learning Research 12, 2825–2830.
Phillips, N. E., Mandic, A., Omidi, S., Naef, F., and Suter, D. M. (2019). Memory and relatedness of transcriptional activity in mammalian cell lineages. Nat. Commun. 10, 1208. doi:10.1038/s41467-019-09189-8
Raghavan, A., Ogilvie, R. L., Reilly, C., Abelson, M. L., Raghavan, S., Vasdewani, J., et al. (2002). Genome-wide analysis of mRNA decay in resting and activated primary human T lymphocytes. Nucleic Acids Res. 30, 5529–5538. doi:10.1093/nar/gkf682
Raj, A., Peskin, C. S., Tranchina, D., Vargas, D. Y., and Tyagi, S. (2006). Stochastic mRNA synthesis in mammalian cells. PLoS Biol. 4, e309. doi:10.1371/journal.pbio.0040309
Raj, A., van den Bogaard, P., Rifkin, S. A., van Oudenaarden, A., and Tyagi, S. (2008). Imaging individual mRNA molecules using multiple singly labeled probes. Nat. Methods 5, 877–879. doi:10.1038/nmeth.1253
Reback, J., McKinney, W., Jbrockmendel , , Van Den Bossche, J., Augspurger, T., Cloud, P., et al. (2020). pandas-dev/pandas: Pandas 1.0.5. doi:10.5281/ZENODO.3898987
Robles-Rebollo, I., Cuartero, S., Canellas-Socias, A., Wells, S., Karimi, M. M., Mereu, E., et al. (2022). Cohesin couples transcriptional bursting probabilities of inducible enhancers and promoters. Nat. Commun. 13, 4342. doi:10.1038/s41467-022-31192-9
Rybakova, K. N., Bruggeman, F. J., Tomaszewska, A., Moné, M. J., Carlberg, C., and Westerhoff, H. V. (2015). Multiplex eukaryotic transcription (In)activation: Timing, bursting and cycling of a ratchet clock mechanism. PLoS Comput. Biol. 11, e1004236. doi:10.1371/journal.pcbi.1004236
Schwanhausser, B., Busse, D., Li, N., Dittmar, G., Schuchhardt, J., Wolf, J., et al. (2011). Global quantification of mammalian gene expression control. Nature 473, 337–342. doi:10.1038/nature10098
Seabold, S., and Perktold, J. (2010). statsmodels: Econometric and statistical modeling with python, 9th Python in Science Conference.
Shaffer, S. M., Emert, B. L., Reyes Hueros, R. A., Cote, C., Harmange, G., Schaff, D. L., et al. (2020). Memory sequencing reveals heritable single-cell gene expression programs associated with distinct cellular behaviors. Cell 182, 947–959. doi:10.1016/j.cell.2020.07.003
Shalek, A. K., Satija, R., Adiconis, X., Gertner, R. S., Gaublomme, J. T., Raychowdhury, R., et al. (2013). Single-cell transcriptomics reveals bimodality in expression and splicing in immune cells. Nature 498, 236–240. doi:10.1038/nature12172
Shalek, A. K., Satija, R., Shuga, J., Trombetta, J. J., Gennert, D., Lu, D., et al. (2014). Single-cell RNA-seq reveals dynamic paracrine control of cellular variation. Nature 510, 363–369. doi:10.1038/nature13437
Shand, L., and Li, B. (2017). Modeling nonstationarity in space and time. Biometrics 73, 759–768. doi:10.1111/biom.12656
Sharova, L. V., Sharov, A. A., Nedorezov, T., Piao, Y., Shaik, N., and Ko, M. S. (2009). Database for mRNA half-life of 19 977 genes obtained by DNA microarray analysis of pluripotent and differentiating mouse embryonic stem cells. DNA Res. 16, 45–58. doi:10.1093/dnares/dsn030
Skinner, S. O., Xu, H., Nagarkar-Jaiswal, S., Freire, P. R., Zwaka, T. P., and Golding, I. (2016). Single-cell analysis of transcription kinetics across the cell cycle. Elife 5, e12175. doi:10.7554/eLife.12175
Spencer, S. L., Gaudet, S., Albeck, J. G., Burke, J. M., and Sorger, P. K. (2009). Non-genetic origins of cell-to-cell variability in TRAIL-induced apoptosis. Nature 459, 428–432. doi:10.1038/nature08012
Suter, D. M., Molina, N., Gatfield, D., Schneider, K., Schibler, U., and Naef, F. (2011). Mammalian genes are transcribed with widely different bursting kinetics. Science 332, 472–474. doi:10.1126/science.1198817
Taniguchi, Y., Choi, P. J., Li, G. W., Chen, H., Babu, M., Hearn, J., et al. (2010). Quantifying E. coli proteome and transcriptome with single-molecule sensitivity in single cells. Science 329, 533–538. doi:10.1126/science.1188308
Van der Walt, S., Colbert, S. C., and Varoquaux, G. (2011). The NumPy Array: A Structure for Efficient Numerical Computation. Computing in Science and Engineering 13 (2), 22–30. doi:10.1109/MCSE.2011.37
Virtanen, P., Gommers, R., Oliphant, T. E., Haberland, M., Reddy, T., Cournapeau, D., et al. (2020). SciPy 1.0: fundamental algorithms for scientific computing in Python. Nat Methods 17 (3), 261–272. doi:10.1038/s41592-019-0686-2
Vu, T. N., Wills, Q. F., Kalari, K. R., Niu, N., Wang, L., Rantalainen, M., et al. (2016). Beta-Poisson model for single-cell RNA-seq data analyses. Bioinformatics 32, 2128–2135. doi:10.1093/bioinformatics/btw202
Wang, Y., Qi, J., Shao, J., and Tang, X. Q. (2020). Signaling mechanism of transcriptional bursting: A technical resolution-independent study. Biol. (Basel) 9, 339. doi:10.3390/biology9100339
Wang, Z., Guo, Y., and Gong, H. (2018). An integrative analysis of time-varying regulatory networks from high-dimensional data. Proc. IEEE Int. Conf. Big Data 2018, 3798–3807. doi:10.1109/BigData.2018.8622361
Waskom, M., Botvinnik, O., Ostblom, J., Gelbart, M., Lukauskas, S., Hobson, P., et al. (2020). mwaskom/seaborn: v0.10.1 (April 2020). doi:10.5281/ZENODO.3767070
Wolf, F. A., Angerer, P., and Theis, F. J. (2018). SCANPY: large-scale single-cell gene expression data analysis. Genome Biol. 19 (1), 15. doi:10.1186/s13059-017-1382-0
Wong, V. C., Bass, V. L., Bullock, M. E., Chavali, A. K., Lee, R. E. C., Mothes, W., et al. (2018). NF-κB-Chromatin interactions drive diverse phenotypes by modulating transcriptional noise. Cell Rep. 22, 585–599. doi:10.1016/j.celrep.2017.12.080
Xue, Q., Lu, Y., Eisele, M. R., Sulistijo, E. S., Khan, N., Fan, R., et al. (2015). Analysis of single-cell cytokine secretion reveals a role for paracrine signaling in coordinating macrophage responses to TLR4 stimulation. Sci. Signal. 8, ra59. doi:10.1126/scisignal.aaa2155
Yang, X., Wang, Z., Wu, Y., Zhou, T., and Zhang, J. (2022). Kinetic characteristics of transcriptional bursting in a complex gene model with cyclic promoter structure. Math. Biosci. Eng. 19, 3313–3336. doi:10.3934/mbe.2022153
Yates, A. D., Achuthan, P., Akanni, W., Allen, J., Allen, J., Alvarez-Jarreta, J., et al. (2020). Ensembl 2020. Nucleic Acids Res. 48 (D1), D682–D688. doi:10.1093/nar/gkz966
Zainol, M. I. B., Kawasaki, T., Monwan, W., Murase, M., Sueyoshi, T., and Kawai, T. (2019). Innate immune responses through Toll-like receptor 3 require human-antigen-R-mediated Atp6v0d2 mRNA stabilization. Sci. Rep. 9, 20406. doi:10.1038/s41598-019-56914-w
Zenklusen, D., Larson, D. R., and Singer, R. H. (2008). Single-RNA counting reveals alternative modes of gene expression in yeast. Nat. Struct. Mol. Biol. 15, 1263–1271. doi:10.1038/nsmb.1514
Zoller, B., Little, S. C., and Gregor, T. (2018). Diverse spatial expression patterns emerge from unified kinetics of transcriptional bursting. Cell 175, 835–847. doi:10.1016/j.cell.2018.09.056
Keywords: transcriptional bursting, burst size, burst frequency, stochastic transcription, telegraph model, innate immunity, toll-like receptor, scRNA-seq inference
Citation: Alachkar N, Norton D, Wolkensdorfer Z, Muldoon M and Paszek P (2023) Variability of the innate immune response is globally constrained by transcriptional bursting. Front. Mol. Biosci. 10:1176107. doi: 10.3389/fmolb.2023.1176107
Received: 25 April 2023; Accepted: 15 June 2023;
Published: 27 June 2023.
Edited by:
Guido Tiana, University of Milan, ItalyReviewed by:
Attila Becskei, University of Basel, SwitzerlandCopyright © 2023 Alachkar, Norton, Wolkensdorfer, Muldoon and Paszek. This is an open-access article distributed under the terms of the Creative Commons Attribution License (CC BY). The use, distribution or reproduction in other forums is permitted, provided the original author(s) and the copyright owner(s) are credited and that the original publication in this journal is cited, in accordance with accepted academic practice. No use, distribution or reproduction is permitted which does not comply with these terms.
*Correspondence: Pawel Paszek, cGF3ZWwucGFzemVrQG1hbmNoZXN0ZXIuYWMudWs=
Disclaimer: All claims expressed in this article are solely those of the authors and do not necessarily represent those of their affiliated organizations, or those of the publisher, the editors and the reviewers. Any product that may be evaluated in this article or claim that may be made by its manufacturer is not guaranteed or endorsed by the publisher.
Research integrity at Frontiers
Learn more about the work of our research integrity team to safeguard the quality of each article we publish.