 Nuan Li1,2
 Le Xue1,2
 Xiaoli Mai3Peng Wang1,2,4
 Chenzhuo Zhu5
 Xiaofeng Han1Yuanyuan Xie6
 Bin Wang6
 Yuqing Ge7
 Yewei Zhang8
 Jianfei Sun1,2*
- 1State Key Laboratory of Bioelectronics, School of Biological Sciences and Medical Engineering, Southeast University, Nanjing, China
- 2Jiangsu Key Laboratory of Biomaterials and Devices, Southeast University, Nanjing, China
- 3Department of Radiology, The Affiliated Drum Tower Hospital of Nanjing University, Nanjing, China
- 4Department of Sports Medicine and Adult Reconstructive Surgery, The Affiliated Drum Tower Hospital of Nanjing University, Nanjing, China
- 5Southeast University-Monash University Joint Graduate School, Southeast University, Suzhou, China
- 6Clinical Stem Cell Center, The Affiliated Drum Tower Hospital of Nanjing University, Nanjing, China
- 7State Key Laboratory of Transducer Technology, Shanghai Institute of Microsystem and Information Technology, Chinese Academy of Sciences, Shanghai, China
- 8The Hepatopancreatobiliary Center, The Second Affiliated Hospital of Nanjing Medical University, Nanjing, China
Rapid development of medical imaging, such as cellular tracking, has increased the demand for “live” contrast agents. This study provides the first experimental evidence demonstrating that transfection of the clMagR/clCry4 gene can impart magnetic resonance imaging (MRI) T2-contrast properties to living prokaryotic Escherichia coli (E. coli) in the presence of Fe3+ through the endogenous formation of iron oxide nanoparticles. The transfected clMagR/clCry4 gene markedly promoted uptake of exogenous iron by E. coli, achieving an intracellular co-precipitation condition and formation of iron oxide nanoparticles. This study will stimulate further exploration of the biological applications of clMagR/clCry4 in imaging studies.
Introduction
Contrast-enhanced magnetic resonance imaging (MRI) has become an indispensable tool in medical imaging (Rogers et al., 2006; Park et al., 2017). Gadolinium (Gd)-based small molecules and iron oxide nanoparticles have been mainly used as MRI-T1 and -T2 contrast agents, respectively, to provide high contrast sensitivity against background signals and have been approved by the U.S. Food and Drug Administration (FDA) and the European Medicines Agency (EMEA) (Park et al., 2017; Wahsner et al., 2019). Nevertheless, there are still some challenges facing these contrast agents in practical applications, especially for long-term tracking in vivo. The main issue lies in their biosafety and the exocytosis of inorganic substances over a long period (Wahsner et al., 2019). For example, Gd was recently reported to be somewhat toxic to the liver and kidney (Calvin et al., 2010), and iron (Fe) overload has also been proposed to be involved in degenerative diseases (Zecca et al., 2004; Stephenson et al., 2014). Thus, it has inspired a new wave to develop new contrast agents, where control of iron accumulation in cells could work as a means to alter longitudinal or transverse relaxation times, generating contrast, probably derived endogenously from the organism itself.
Recently, protein-based MRI contrast agents have attracted increasing attention, such as transferrin and ferritin (Jutz et al., 2015; Schilling et al., 2017). Transferrin and ferritin are critical proteins that regulate iron metabolism in vivo, which are capable of binding Fe to exhibit paramagnetic properties (Yang et al., 2016). Although the two proteins, especially ferritin, have relatively large magnetic moments and influence the transverse relaxation of the proton, the effect appears to be too weak to be used directly as contrast agents for MRI in vivo (Liu and Theil, 2005; Jutz et al., 2015). Generally, ferritin is used as a natural reactor in vitro to transform hydrated paramagnetic ferric oxide into superparamagnetic iron oxide nanoparticles (Liu and Theil, 2005; Turano et al., 2010). These transformed protein molecules have been proposed as a new type of nanoparticle and partly improve the biosafety of contrast agents; however, they are essentially an exogenous substance.
Xie et al. discovered a novel magnetic protein biocompass in Columba livia, which integrated both magnetoreceptor (MagR) and type IV cryptochrome (clCry4) (Qin et al., 2016). MagR is the homologue of the iron–sulfur cluster assembly protein (A-type ISC protein, IscA). The IscA protein is an iron chaperon that can bind to intracellular iron to form Fe–S clusters for electron transfer (Ding and Clark, 2004; Holm and Lo, 2016). The Cry4 protein is considered an electron donor excited by light that can form long-lived radical pairs to activate downstream pathways (Maeda et al., 2012; Zoltowski et al., 2019; Xu et al., 2021). Because clMagR/clCry4 protein is involved with the process of electron transfer, we hypothesized it would be suitable for MRI contrast as a “live” agent.
We investigated the MRI contrast performance of clMagR/clCry4 gene in a living organism. Unlike the strategy used for ferritin, the clMagR/clCry4 gene was simply transfected into prokaryotic E. coli, rather than administering clMagR/clCry4 protein molecules. The transfected E. coli showed significant T2 contrast on MRI when cultured in an iron-supplemented medium, while the protein itself was unable to show this effect. The transfection of the clMagR/clCry4 gene led to the formation of iron oxide nanoparticles within E. coli, which could mediate the alteration of the MRI transverse relaxation rate.
Materials and methods
MRI analysis
The MRI study was performed using the 7T BioSpec 70/20 USR system (Bruker Biospin; Ettlingen) with ParaVision 6.0.1. software. The MRI-T1 images were acquired using a rapid acquisition sequence with relaxation enhancement (RARE) using the following parameters: matrix = 256 × 256, flip angle (FA) = 90°, field of view (FOV) = 8.0 × 6.03 cm, slice thickness = 2 mm, echo time (TE) = 8.87 ms, and repetition time (TR) = 400 ms. The MRI-T2 images were acquired using the TurboRARE sequence using the following parameters: matrix = 256 × 256, FA = 90°, FOV = 8.0 × 6.03 cm, slice thickness = 2 mm, TE = 80 ms, and TR = 2,200 ms. For MRI-T1 relaxation time map imaging (T1 mapping), we used the RARE sequence with variable TR with the following parameters: matrix = 256 × 256, FA = 90°, FOV = 8.0 × 6.03 cm, slice thickness = 2 mm, TE = 7.17 ms, echo spacing = 7.17 ms, averages = 2, repetition = 1, and TR = 190, 200, 300, and 400 ms. For MRI-T2 relaxation time map imaging (T2 mapping), we used a multislice multiecho (MSME) sequence with variable TE with the following parameters: matrix = 256 × 256, FA = 90°, FOV = 8.0 × 6.03 cm, slice thickness = 2 mm, TE = 9–225 ms with an increment of 9 ms, echo spacing = 9.0 ms, echo times = 25, averages = 1, repetition = 1, and TR = 3,000 ms. The regions of interest (ROIs) were drawn in the same plane of each sample after scanning, the T1 and T2 relaxation times were calculated using ParaVision software, and the rates at which the signal decayed were defined as R1 and R2.
The Python language (Python Software Foundation, Version 3.8.0) was used to batch calculate the mean gray values and to quantify the signal density of the MRI images (Sindhulakshmi et al., 2014; Gadi et al., 2020). In detail, original DICOM images were processed with a Gaussian filter. On the basis of the maximum between-class variance method (OTSU), the image data were classified into targets and backgrounds. The OpenCV (OpenSource Computer Vision Library, Version 4.4.0) contour search algorithm was adopted to extract the true coordinate parameters of each target area and to discard false values. Furthermore, the aforementioned coordinates were processed to obtain the mean gray value of each target area pixel group on the original image, all pixels were sorted according to their mean gray values, and the average value and the quartile value were recorded. The heat map of the original gray value was drawn using Numerical Python (NumPy), Pandas, Matplotlib, and OpenCV. In this study, to facilitate the statistics of MRI dark contrast, the mean gray values mentioned included 255 (the maximum gray value of the 8-bit gray image) minus the original gray values.
The bacteria were collected by centrifugation (2,000 rpm, 5 min, 4°C), the pellets were washed three times, and resuspended in phosphate buffer solution (PBS, pH 7.4). The density of bacteria cells was evaluated by optical density (OD) measurement at 600 nm (A600 units/mL). Protein concentrations were determined using the bicinchoninic acid (BCA) assay with each sample in triplicate, using the microplate method according to the protocol recommended by the manufacturer using commercially available BSA as the calibration solution. Data were plotted in the graph form, and a linear trendline was fit to obtain a standard BSA protein curve. Data were acquired and analyzed using the SpectraMax Plus microplate reader and SoftMax Pro software (Molecular Devices). The MRI samples were collected into polyethylene centrifugation tubes for scanning.
Intracellular iron quantification
The bacteria were collected after MRI scanning, lysed in nitric acid, and then analyzed by inductive-coupled plasma mass spectrometry (ICP-MS, PerkinElmer NexION 2000). For calibration, the reference solutions containing different concentrations of iron (i.e., 0, 20, 50, 100, 200, and 500 μg/L in Milli-Q water, 18.2 MΩ cm) as internal standards were prepared. A reference solution was used at the beginning, middle, and end of the measurements as a quality control. Acidity of experimental samples and reference solutions were controlled at 5%. Experimental samples were filtered through a 0.22-μm hydrophilic syringe filter (Sartorius Stedim Biotech, Germany) to remove solid impurities. Data corresponding to iron content were determined by ICP-MS. The iron standard curve, determined from calibration solutions with known concentrations (μg/L), was used to calculate the iron content in bacteria.
Detection of intracellular pH
Intracellular pH was measured using the fluorescent pH indicator 2,7-bicarboxyethyl-5,6-carboxyfluorescein-acet-oxymethylester (BCECF-AM) according to the manufacturer’s protocol (Burgess and Han, 2010; Chakraborty et al., 2017). Bacterial suspensions (OD 2.0) were incubated with 20 μM BCECF-AM at 37 °C for 60 min. After loading, the cells were washed three times with PBS buffer and remained in the same solution. A pH calibration curve was constructed using BCECF-AM with a pH calibration buffer kit containing a pH range of 4.5, 5.5, 6.5, and 7.5, and valinomycin (10 μM) and nigericin (10 μM), which equilibrated the intracellular and extracellular pH of bacteria. Intracellular pH was recorded by determining the fluorescence ratio (F490 nm/F440 nm) of the emission wavelength at 535 nm for excitation wavelengths of 490 and 440 nm using a multimode microplate reader (Tecan Infinite M200). Bacterial photographs were detected using inverted fluorescence microscopy (Nikon Microsystems).
Ultrastructural observation
The bacteria were collected by centrifugation, pellets washed with PBS and then fixed with 2.5% glutaraldehyde overnight at 4°C. The samples were fixed with 1% osmium tetroxide for 1 h, dehydrated with a series of ethanol concentrations in Milli-Q water (i.e., 35, 50, 60, 70, 80, 90, 95, and 100% ethanol for 10 min in each step) and then embedded in epoxy resin and polymerized at 60°C overnight. Ultrathin (about 90 nm) sections were cut with a diamond knife in an ultramicrotome (Leica, EM UC7) and collected onto carbon-coated copper grids, stained with uranyl acetate and lead citrate, and then examined by transmission electron microscopy (TEM) (Hitachi H-600-4) at an operating voltage of 120 KV.
Biomaterial extraction and electronic microscope analysis
To extract electron-dense granules, clMagR/clCry4-transfected bacteria (under exogenous iron supply condition) were harvested, washed, and resuspended in PBS and then fragmented using an ultrasonic cell disruptor (Scientz-II D, amplitude 15%, pulse 5 s on and 2 s off). Subsequently, electron-dense granules were separated from cell debris using gradient centrifugation, washed and resuspended in Milli-Q water to remove residual PBS. The biosynthesis of materials was isolated from the suspension using the MACS LD separation column, the QuadroMACS Separator, and the MACS MultiStand (Miltenyi Biotec Inc) according to the manufacturer’s instructions. The resulting materials were placed on carbon-coated copper grids and dried. Bright-field scanning transmission electron microscopy (BF-STEM), dark-field STEM (DF-STEM), high-angle annular dark-field STEM (HAADF-STEM), energy-dispersive X-ray spectroscopy (XEDS) element mapping, selected area electron diffraction (SAED), and high-resolution TEM (HRTEM) were carried out on FEI Talos F200X TEM at an operating voltage of 200 KV. All micrographs were analyzed using DigitalMicrograph software (Gatan Microscopy Suite, Version 3.42.3048.0) and ICDD PDF-4 + 2009 software (The International Centre for Diffraction Data, ICDD; Powder Diffraction File, PDF). The fast Fourier transform (FFT) was performed using ImageJ, v1.53a software.
Statistical analysis
GraphPad Prism software (v8.3.1 (332), La Jolla, CA, United States) was used for graph preparation. Data were presented as mean ± standard deviation (SD). Statistical differences were analyzed using the unpaired Student’s t-test. For mean gray values, statistical differences were conducted using IBM SPSS Statistics 25 software packages and analyzed using two-way analysis of variance (ANOVA) followed by the Bonferroni and Tukey’s honest significant differences (HSD) post-hoc test. The differences were considered statistically significant when the p-value was less than 0.05. *p < 0.05, **p < 0.01, ***p < 0.001; no significance (ns), p > 0.05.
Results and discussion
Transfection of the clMagR/clCry4 gene into E. coli is shown schematically in Figure 1A. Similar to that of our previous report (Xue et al., 2020), transfection was shown to be successful based on the sodium dodecyl sulfate polyacrylamide gel electrophoresis (SDS-PAGE) pattern of the expressed clMagR/clCry4 protein (Figure 1B). Because the d electrons in Fe atom have been demonstrated to contribute to the net spins of the Fe-loaded IscA monomer (Beinert et al., 1997; Xiao et al., 2020), the characteristic signal at g' ≈ 4.3 (g-factor) in the electronic spin resonance (ESR) spectrum proved the presence of the protein–Fe(III) complex (Figure 1C) (Sun and Chasteen, 1994; Wajnberg et al., 2018). Furthermore, the broad peak of the ESR also indicated the heterogeneity of the protein clMagR/clCry4 protein expressed inside E. coli. The bacteria were resuspended in PBS buffer solution for cell suspensions (Supplementary Figure S1). Then, the clMagR/clCry4-transfected E. coli were tested by qualitative MRI-T1 and -T2 scans. As shown from the images, there were no significant differences for either mode nor were there any differences in the relaxation rates R1 and R2 (Figure 1D). Furthermore, MRI-T1 and -T2 mapping modes were used to quantitatively evaluate the imaging contrast of transfected E. coli. The mean gray values acquired from the mapping images were measured using the Python language and two-way ANOVA statistics, followed by the Bonferroni and Tukey’s HSD post-hoc test. Both the images and the statistical values of the mean gray areas also showed minimal differences (Figures 1E, F). In addition, only the clMagR-transfected E. coli also showed a little imaging contrast with the control (Supplementary Figure S2). We tested the MRI contrast properties for the purified clMagR/clCry4 protein. The protein itself showed a little MRI contrast effect (Supplementary Figure S3). Based on these cases, the transfection of the clMagR/clCry4 gene was unable to influence MRI spin relaxation signals. Due to its presence in a living organism, the clMagR/clCry4 protein could perceive a magnetic field; thus, we hypothesized that the magnetism of the clMagR/clCry4 protein would associate with the electron transfer, that is, binding with Fe. Because there was insufficient Fe in the medium for E. coli, the clMagR/clCry4 complex was incapable of producing magnetic behaviors.
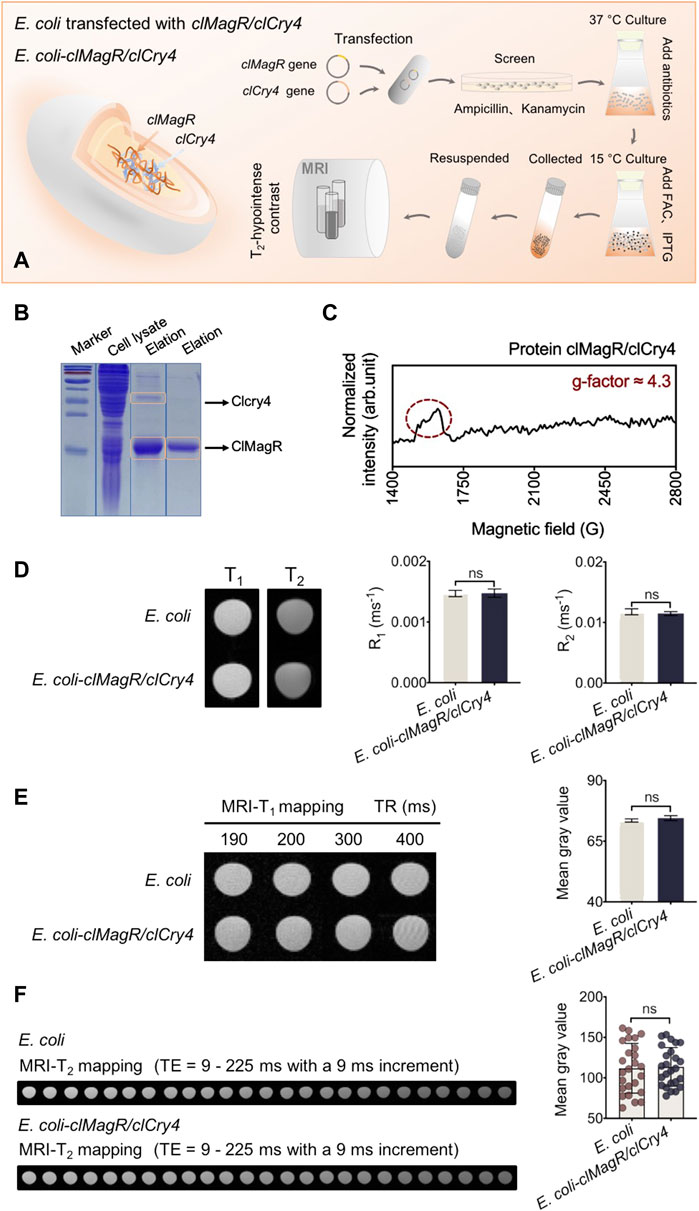
FIGURE 1. Bacteria construction and MRI analysis. (A) Schematic illustration of the prokaryotic expression system and bacterial culture. clMagR/clCry4 is transfected into a commonly used bacterial model (as heterologous host), the E. coli BL21 (DE3) strain to investigate MRI susceptibility. (B) SDS-PAGE analysis. Arrows point to clMagR and clCry4. PageRuler prestained protein ladder was used to indicate the apparent molecular mass standards (marker, kDa). (C) ESR spectrum of the clMagR/clCry4 protein. Signal at g' ≈ 4.3 in spectrum attributed to protein-Fe(III) complex. (D) MRI-T1 and -T2 images show the signal intensity of E. coli. Histograms represent bacterial R1 and R2 statistical values. (E) Bacterial MRI-T1 mapping and the corresponding mean gray values analysis. (F) Bacterial MRI-T2 mapping and the corresponding mean gray values analysis. It should be noted that the bacterial densities of samples were almost equivalent (A600 units/mL, OD 50.0). Data were presented as mean ± SD (n = 3). For MRI R1 and R2 values, statistical differences were analyzed using the unpaired Student’s t-test. For the mean gray value data, statistical significances were analyzed using two-way ANOVA followed by the Bonferroni and Tukey’s HSD post-hoc test. ns, no significance (p > 0.05).
Thus, we added ammonium ferric citrate (FAC) to the medium as an exogenous iron donor. FAC is a soluble ferric salt that has been approved by the U.S. FDA as a food supplement and clinical drug (Tenne et al., 2015). Hence, it is safe and has clear effects, as confirmed by scanning electron microscopy (SEM) and live/dead BacLight stain tests. As revealed by the SEM micrographs, E. coli retained its typical rod-shaped morphology without any discernible alteration (Supplementary Figure S4). The fluorescence pattern of SYTO 9 and double-staining with propidium iodide (PI) further confirmed the good viability of bacteria as shown in Supplementary Figure S5, where green indicates living cells and red indicates dead cells. Beyond that, the addition of FAC significantly increased the intracellular iron content within bacteria, and E. coli transfected with clMagR/clCry4 gene showed higher levels than the control, which was experimentally verified by ICP-MS (Figure 2A). However, the status of iron within the bacteria was different. Dissociative Fe will produce abundant hydroxyl free radicals resulting from the Fenton reaction, while Fe binding could greatly reduce this production of free radicals (Dixon and Stockwell, 2014). Thus, we used ESR to identify the hydroxyl free radicals with the spin adduct of 5,5-dimethyl-1-pyrroline N-oxide (DMPO)-hydroxyl radicals. For control E. coli, the quartet signal was unambiguously detected, indicating the presence of abundant hydroxyl free radicals (Figure 2B). However, for E. coli transfected with clMagR/clCry4 gene, the intensity of the corresponding ESR signal decreased greatly, meaning that dissociated Fe was bound (Figure 2C). A similar case occurred for E. coli transfected with clMagR gene, while the intensity decrease was slightly lower than that of E. coli transfected with clMagR/clCry4 gene (Supplementary Figure S6). Thus, we assumed that the dissociative Fe within E. coli was bound to the clMagR/clCry4 protein, causing the alteration of bacterial magnetism. The SQUID measurement confirmed this point. As predicted, control E. coli were diamagnetic, even after exposure to FAC (Figure 2D). A similar diamagnetic curve was also observed in E. coli transfected with clMagR/clCry4 gene in the absence of an exogenous iron supply. However, the bacteria exhibited a paramagnetic curve after culture in the presence of media containing an exogenous iron supply, and the intensity of magnetization increased by two orders of magnitude (Figure 2E). As shown by the magnetization loop, there was even a very slight hysteresis, which seemed somewhat superparamagnetic (magnetic susceptibility, 0.00625 emu/g). Surprisingly, this effect was not observed in clMagR-transfected E. coli, where the bacteria retained the diamagnetic behavior (Supplementary Figure S7). Therefore, these findings supported the potential effects on MRI contrast of transfection with clMagR/clCry4 gene in the presence of exogenous iron supply.
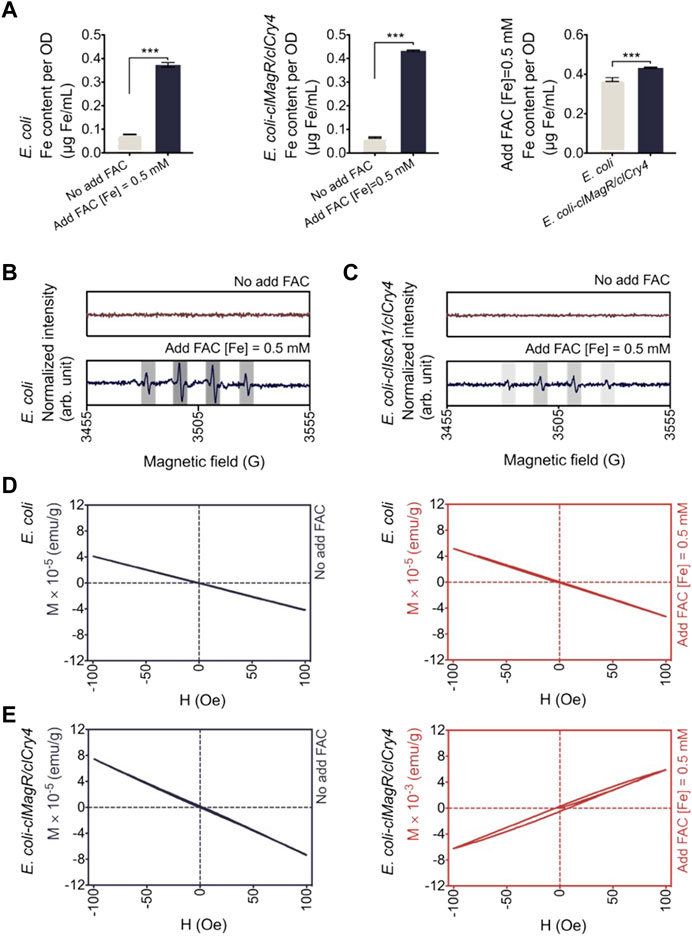
FIGURE 2. Biological effects of exogenous iron on bacteria. (A) Iron content analysis. Data corresponding to iron content were determined by ICP-MS. The intracellular Fe content of E. coli transfected with clMagR/clCry4 was higher than that of the control. Data were presented as mean ± SD (n = 3). Statistical significance was analyzed using the unpaired Student’s t-test. ***p < 0.001. (B,C) Hydroxyl radical generation was monitored by ESR measurement. The main quartet signal characteristic for the •DMPO-OH adduct is indicated by gray columns. Compared to control E. coli, the quartet signal was also detected at by E. coli transfected with clMagR/clCry4 but at a much lower intensity. Data were normalized for intergroup difference comparison. (D,E) Hysteresis loops (magnetization M versus applied field H) of E. coli were measured by SQUID magnetometry. When cultured in the exogenous iron supply medium, E. coli transfected with clMagR/clCry4 showed detectable magnetic properties (magnetic susceptibility, 0.00625 emu/g).
As shown by the qualitative MRI scan, the clMagR/clCry4-transfected E. coli exhibited significant MRI-T2 contrast after culturing with FAC, while there was little influence on the MRI-T1 mode (Figure 3A); the histograms represent the corresponding statistical R1 and R2 values (Figure 3B). Furthermore, to quantitatively confirm the imaging contrast effect, the mean gray values acquired from the mapping of MRI-T1 and -T2 images (Figures 3C, D) were calculated. Independently of the time of TE, it can be clearly seen that clMagR/clCry4 gene transfection imparted the contrast effect of MRI-T2 to E. coli, which was significantly different from that of the control E. coli strains. Moreover, the influence of the FAC concentration (exogenous iron level) in the medium, and the bacterial density on the imaging contrast effect, was evaluated (Supplementary Figures S8, S9). As described in detail, with an increase in the iron level or bacterial density assayed, clMagR/clCry4 protein achieved a more significant influence on the T2-contrast of the transfected E. coli. Here, the corresponding original gray values were plotted against the TE for different bacterial densities after pseudocolor processing (Supplementary Figure S10). With an increase in the bacterial density, the MRI gray value of E. coli-transfected clMagR/clCry4 gene tended to go from a constant to a high-order power function versus the TE time course of MRI-T2 mapping.
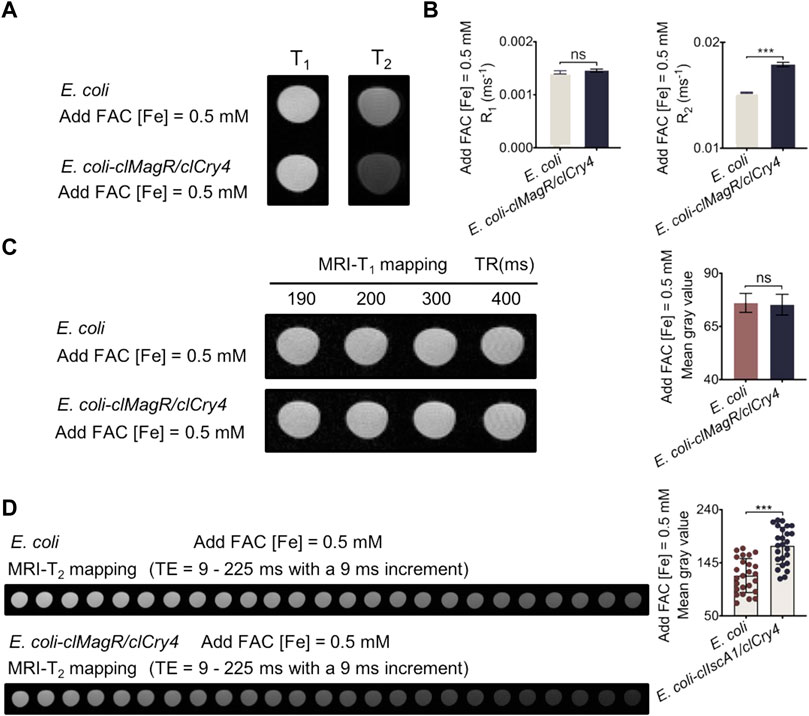
FIGURE 3. MRI analysis of bacteria under exogenous iron supply conditions. (A) MRI-T1 and -T2 images showing signal intensity of bacteria. (B) MRI statistical R1 and R2 values analysis of the bacteria. (C) Bacterial MRI-T1 mapping and the corresponding mean gray values analysis. (D) Bacterial MRI-T2 mapping and the corresponding mean gray values analysis. It should be noted that the bacterial densities of samples were almost equivalent (A600 units/mL, OD 50.0). Data were presented as mean ± SD (n = 3). For MRI R1 and R2 values, statistical differences were analyzed using the unpaired Student’s t-test. For the mean gray value data, statistical significances were analyzed using two-way ANOVA followed by Bonferroni and Tukey’s HSD post-hoc test. ns, no significance (p > 0.05), ***p < 0.001.
To explore the underlying mechanism responsible for MRI-T2 contrast E. coli transfected with clMagR/clCry4 cultured in the presence of FAC, the purified clMagR/clCry4 protein was tested for contrast properties in the MR imaging. As shown in Supplementary Figure S11, the protein itself was unable to achieve MRI-T2 contrast signals. Thus, an explanation should lie with event results within living organisms. To validate this hypothesis, we first tested the intracellular pH of E. coli after transfection of clMagR/clCry4 gene using the pH-sensitive organic dye BCECF-AM, which has been widely used in elaborating the physiology of prokaryotes and eukaryotes (Burgess and Han, 2010; Chakraborty et al., 2017). As shown in Supplementary Figure S12, the fluorescence alteration indicated that the microenvironment inside E. coli changed from a weakly alkaline pH to acidic pH with the addition of FAC. However, it was found that transfection of clMagR/clCry4 gene inhibited this change in the pH value to maintain a weakly alkaline state, the detailed mechanism of which remains unclear. Apart from that, similar evidence was obtained by means of the conventional glass electrode pH meter measurement (Supplementary Table S1). On the other hand, the Fe ions will bind to biological molecules within the bacteria. It has been known that E. coli secreted the siderophore enterobactin to chelate Fe3+ with high affinity, forming soluble Fe (III)-siderophores to transport inside E. coli (Liu et al., 1993; Faraldo-Gomez and Sansom, 2003). Fe ions could then be released either by siderophore hydrolysis or by reduction of flavin oxidoreductase, after which the dissociative Fe would be recruited by the clMagR/clCry4 protein (Coves et al., 1993; Raymond et al., 2003). However, Fe-binding residues in clMagR are flexible and easily disrupted, so the Fe ions can partially dissociate into a free state resulting from the reactive oxygen species (Rouault and Klausner, 1996; Ding and Clark, 2004). In the presence of Fe ions under weakly alkaline conditions, the formation of iron oxide nanoparticles is assumed, which is somewhat similar to a co-precipitation reaction occurring within E. coli. Hence, it should be noted that the FAD group of the clCry4 protein is widely known to generate free radicals under photonic action, which may explain why clMagR/clCry4 transfection is advantageous in the MRI-T2 contrast of E. coli compared to clMagR transfection alone.
We used TEM to observe ultrathin bacterial sections. Under low magnification, many electron-dense granules were clearly observed in the E. coli transfected with clMagR/clCry4 in the presence of exogenous iron supply (Figures 4A, B). Fe element mapping further indicated that there were abundant iron-based compounds detectable within E. coli (Figure 4C). Hence, we speculated that the electron-dense granules should contain the iron-based nanomaterials. These electron-dense granules were then extracted from the bacteria for TEM characterization by repeating magnetic separation and washing. Interestingly, a magnet could be used to easily attract the extracted granules (Supplementary Video S1), indicating that the magnetic iron oxide nanoparticles were present. In the TEM micrographs, aggregates of tiny nanoparticles can be clearly observed (Figure 4D). The exact matching of Fe and O elements in the XEDS mapping confirmed that the composition of the nanoparticles was iron oxide.
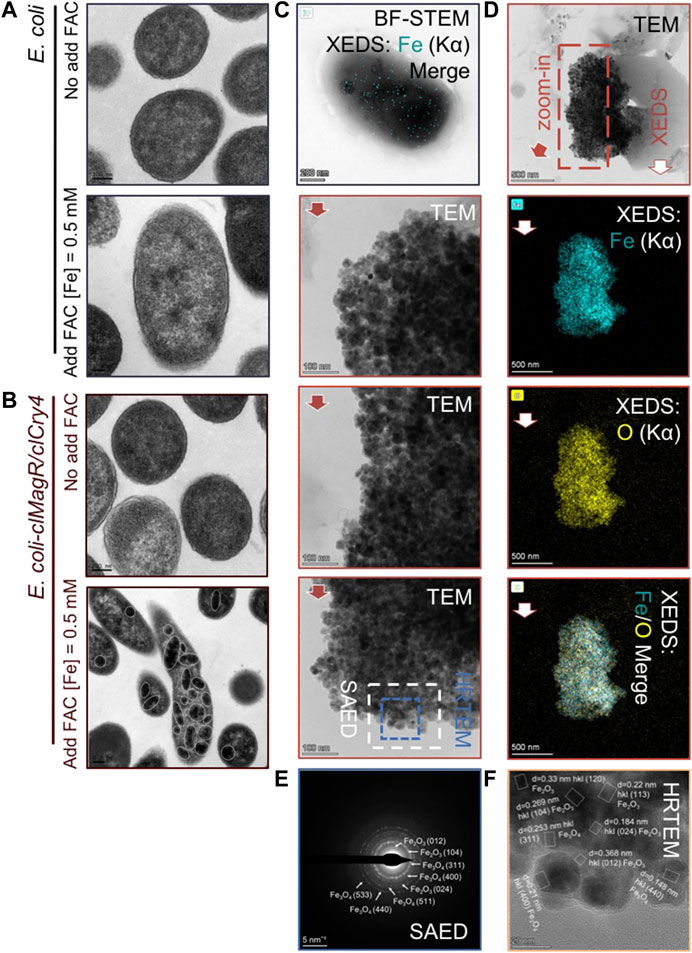
FIGURE 4. Detailed information on intracellular granules. (A,B) Detection of the intracellular ultrastructure. Following the transfer of E. coli transfected with clMagR/clCry4 into the exogenous iron supply medium, the electron micrograph shows that electron-dense granules were detectable in the cytoplasm and form widely distributed aggregates, marked by solid circles. (C) Electron micrographs and the corresponding XEDS Fe (Kα) elemental mapping of E. coli transfected with clMagR/clCry4 under exogenous iron supply conditions. (D) Electron micrographs and corresponding XEDS elemental mappings of the two-dimensional morphologies of the extract particles. (E,F) SAED and HRTEM patterns indicated by the dotted frame in (D).
In addition, STEM micrographs were acquired together with XEDS elemental mappings to give complementary information on the particles being imaged, and the extracted particles demonstrated a small size range (averaged 20.62 ± 3.5 nm) (Supplementary Figure S13). Furthermore, SAED and HRTEM demonstrated the coexistence of the Fe2O3 and Fe3O4 polycrystal phases in the tiny nanoparticles (Figures 4E, F), which provides evidence supporting the presence of a magnetization loop and the MRI-T2 contrast effect of clMagR/clCry4 transfected in E. coli. Nonetheless, it should be mentioned that aggregates of tabular-like ferric oxide nanoparticles with poor crystalline features were also detected (Supplementary Figure S14). These amorphous precursors demonstrated, in part, that the formation process of such nanoparticles was somewhat similar to that achieved by a chemical co-precipitation method.
Conclusion
This study was the first to exploit the transfection of the clMagR/clCry4 gene to produce an MRI-T2 contrast agent effect on a living organism. This innovative phenomenon has neither been observed nor hypothesized previously. Using E. coli as the model organism, an exogenous iron supply was shown to be a critical factor for this phenomenon. Exogenous Fe could be internalized in E. coli and form a dynamic “bind-release” process with the clMagR/clCry4 protein. During the cycle, a biosynthesis process occurred in the presence of dissociative Fe under weakly alkaline intracellular conditions, which is somewhat similar to the chemical co-precipitation reaction, leading to the formation of tiny iron oxide nanoparticles. These tiny iron oxide particles influence the transverse relaxation observed on MRI. Because this strategy depends on the activity of the associated protein complex, it has a wide range of potential applications that are dependent on the presence of an exogenous iron supply. We believe that this novel technique will play a key role in future biomedical imaging and tracking applications. Furthermore, due to the key role of clMagR/clCry4 protein in magnetoreception, our findings are useful for harmonizing the long-term controversy over the existence of magnetoreceptors in organisms, ranging from prokaryotes to animals.
Data availability statement
The original contributions presented in the study are included in the article/Supplementary Material; further inquiries can be directed to the corresponding author.
Author contributions
JS and NL conceived the study design and drafted the manuscript. NL, LX, PW, and CZ participated in data extraction and data analysis. JS, NL, XM, XH, YX, BW, YG, and YZ performed data checking and analysis. JS and NL reviewed and edited the manuscript. All authors read and agreed to the published version of the manuscript.
Funding
This investigation was financially funded by the National Key Research and Development Program of China (2021YFA1201403) and the Shanghai Science and Technology Committee (No. 20dz1101200).
Conflict of interest
The authors declare that the research was conducted in the absence of any commercial or financial relationships that could be construed as a potential conflict of interest.
Publisher’s note
All claims expressed in this article are solely those of the authors and do not necessarily represent those of their affiliated organizations, or those of the publisher, the editors, and the reviewers. Any product that may be evaluated in this article, or claim that may be made by its manufacturer, is not guaranteed or endorsed by the publisher.
Supplementary material
The Supplementary Material for this article can be found online at: https://www.frontiersin.org/articles/10.3389/fmolb.2023.1119356/full#supplementary-material
References
Beinert, H., Holm, R. H., and Munck, E. (1997). Iron-sulfur clusters: Nature's modular, multipurpose structures. Science 277, 653–659. doi:10.1126/science.277.5326.653
Burgess, K., and Han, J. Y. (2010). Fluorescent indicators for intracellular pH. Chem. Rev. 110, 2709–2728. doi:10.1021/cr900249z
Calvin, A. D., Misra, S., and Pflueger, A. (2010). Contrast-induced acute kidney injury and diabetic nephropathy. Nat. Rev. Nephrol. 6, 679–688. doi:10.1038/nrneph.2010.116
Chakraborty, S., Winardhi, R. S., Morgan, L. K., Yan, J., and Kenney, L. J. (2017). Non-canonical activation of OmpR drives acid and osmotic stress responses in single bacterial cells. Nat. Commun. 8, 1587. doi:10.1038/s41467-017-02030-0
Coves, J., Eschenbrenner, M., and Fontecave, M. (1993). Sulfite reductase of Escherichia coli is a ferrisiderophore reductase. Biochem. Bioph. Res.Co. 192, 1403–1408. doi:10.1006/bbrc.1993.1572
Ding, H. G., and Clark, R. J. (2004). Characterization of iron binding in IscA, an ancient iron-sulphur cluster assembly protein. Biochem. J. 379, 433–440. doi:10.1042/BJ20031702
Dixon, S. J., and Stockwell, B. R. (2014). The role of iron and reactive oxygen species in cell death. Nat. Chem. Biol. 10, 9–17. doi:10.1038/nchembio.1416
Faraldo-Gomez, J. D., and Sansom, M. S. P. (2003). Acquisition of siderophores in Gram-negative bacteria. Nat. Revi. Mol. Cell Bio. 4, 105–116. doi:10.1038/nrm1015
Gadi, V. K., Alybaev, D., Raj, P., Garg, A., Mei, G. X., Sreedeep, S., et al. (2020). A novel Python Program to automate soil colour analysis and interpret surface moisture content. Int. J. Geosynth. Groun. 2, 21–9260. doi:10.1007/s40891-020-00204-3
Holm, R. H., and Lo, W. (2016). Structural conversions of synthetic and protein-bound iron-sulfur clusters. Chem. Rev. 116, 13685–13713. doi:10.1021/acs.chemrev.6b00276
Jutz, G., van Rijn, P., Miranda, B. S., and Boeker, A. (2015). Ferritin: A versatile building block for bionanotechnology. Chem. Rev. 115, 1653–1701. doi:10.1021/cr400011b
Liu, J., Rutz, J. M., Feix, J. B., and Klebba, P. E. (1993). Permeability properties of a large gated channel within the ferric enterobactin receptor, FepA. Proc. Natl. Acad. Sci. USA. 90, 10653–10657. doi:10.1073/pnas.90.22.10653
Liu, X. F., and Theil, E. C. (2005). Ferritins: Dynamic management of biological iron and oxygen chemistry. Acc. Chem. Res. 38, 167–175. doi:10.1021/ar0302336
Maeda, K., Robinson, A. J., Henbest, K. B., Hogben, H. J., Biskup, T., Ahmad, M., et al. (2012). Magnetically sensitive light-induced reactions in cryptochrome are consistent with its proposed role as a magnetoreceptor. Proc. Natl. Acad. Sci. USA. 109, 4774–4779. doi:10.1073/pnas.1118959109
Park, S. m., Aalipour, A., Vermesh, O., Yu, J. H., and Gambhir, S. S. (2017). Towards clinically translatable in vivo nanodiagnostics. Nat. Rev. Mat. 2, 17014. doi:10.1038/natrevmats.2017.14
Qin, S., Yin, H., Yang, C., Dou, Y., Liu, Z., Zhang, P., et al. (2016). A magnetic protein biocompass. Nat. Mat. 15, 217–226. doi:10.1038/nmat4484
Raymond, K. N., Dertz, E. A., Kim, S. S., and Kim, S. S. (2003). Enterobactin: An archetype for microbial iron transport. Proc. Natl. Acad. Sci. USA. 100, 3584–3588. doi:10.1073/pnas.0630018100
Rogers, W. J., Meyer, C.,H., and Kramer, C. M. (2006). Technology insight: In vivo cell tracking by use of MRI. Nat. Clin. Pract. Card. 3, 554–562. doi:10.1038/ncpcardio0659
Rouault, T. A., and Klausner, R. D. (1996). Iron-sulfur clusters as biosensors of oxidants and iron. Trends biochem. Sci. 21, 174–177. doi:10.1016/s0968-0004(96)10024-4
Schilling, F., Ros, S., Hu, D. E., D'Santos, P., McGuire, S., Mair, R., et al. (2017). MRI measurements of reporter-mediated increases in transmembrane water exchange enable detection of a gene reporter. Nat. Biotechnol. 35, 75–80. doi:10.1038/nbt.3714
Sindhulakshmi, K., Soundarya, J., and Sowmya, U. (2014). Cloud controlled intrusion detection and burglary prevention stratagems in home automation systems. Int. J. Eng. Sci. 2, 2319–5967.
Stephenson, E., Nathoo, N., Mahjoub, Y., Dunn, J. F., and Yong, V. W. (2014). Iron in multiple sclerosis: Roles in neurodegeneration and repair. Nat. Rev. Nephrol. 10, 459–468. doi:10.1038/nrneurol.2014.118
Sun, S. J., and Chasteen, N. D. (1994). Rapid kinetics of the EPR-active species formed during initial iron uptake in horse spleen apoferritin. Biochemistry 33, 15095–15102. doi:10.1021/bi00254a019
Tenne, D., Bogoslavsky, B., and Bino, A. (2015). Ferric ammonium citrate - what's in it? Eur. J. Inorg. Chem. 25, 4159–4161. doi:10.1002/ejic.201500782
Turano, P., Lalli, D., Felli, I. C., Theil, E. C., and Bertini, I. (2010). NMR reveals pathway for ferric mineral precursors to the central cavity of ferritin. Proc. Natl. Acad. Sci. USA. 107 (107), 545545–550550. doi:10.1073/pnas.0908082106
Wahsner, J., Gale, E. M., Rodriguez-Rodriguez, A., and Caravan, P. (2019). Chemistry of MRI contrast agents: Current challenges and new Frontiers. Chem. Rev. 119, 957–1057. doi:10.1021/acs.chemrev.8b00363
Wajnberg, E., Alves, O. C., Perales, J., da Rocha, S. L. G., Ferreira, A. T., Cameron, L. C., et al. (2018). Ferritin from the haemolymph of adult ants: An extraction method for characterization and a ferromagnetic study. Eur. Biophys. J. Biophy. 47, 641–653. doi:10.1007/s00249-018-1293-3
Xiao, D. W., Hu, W. H., Cai, Y., and Zhao, N. (2020). Magnetic noise enabled biocompass. Biol. Phys. 124, 128101. doi:10.1103/PhysRevLett.124.128101
Xu, J., Jarocha, L. E., Zollitsch, T., Konowalczyk, M., Henbest, K. B., Richert, S., et al. (2021). Magnetic sensitivity of cryptochrome 4 from a migratory songbird. Nature 594, 535–540. doi:10.1038/s41586-021-03618-9
Xue, L., Hu, T., Guo, Z., Yang, C., Wang, Z., Qin, S., et al. (2020). A novel biomimetic magnetosensor based on magneto-optically involved conformational variation of MagR/cry4 complex. Adv.Electron. Mat. 6, 1901168. doi:10.1002/aelm.201901168
Yang, C., Tian, R., Liu, T., and Liu, G. (2016). MRI reporter genes for noninvasive molecular imaging. Molecules 21, 580. doi:10.3390/molecules21050580
Zecca, L., Youdim, M. B. H., Riederer, P., Connor, J. R., and Crichton, R. R. (2004). Iron, brain ageing and neurodegenerative disorders. Nat. Rev. Neurosci. 5, 863–873. doi:10.1038/nrn1537
Keywords: contrast agent, iron oxide nanoparticles, biosynthesis, MRI, clMagR/clCry4
Citation: Li N, Xue L, Mai X, Wang P, Zhu C, Han X, Xie Y, Wang B, Ge Y, Zhang Y and Sun J (2023) Transfection of clMagR/clCry4 imparts MR-T2 imaging contrast properties to living organisms (E. coli) in the presence of Fe3+ by endogenous formation of iron oxide nanoparticles. Front. Mol. Biosci. 10:1119356. doi: 10.3389/fmolb.2023.1119356
Received: 08 December 2022; Accepted: 30 January 2023;
Published: 17 February 2023.
Edited by:
Luca Menichetti, Institute of Clinical Physiology (CNR), ItalyReviewed by:
Can Xie, Hefei Institutes of Physical Science (CAS), ChinaXianchuang Zheng, Jinan University, China
Vincenzo Positano, Gabriele Monasterio Tuscany Foundation (CNR), Italy
Alessandra Flori, Gabriele Monasterio Tuscany Foundation (CNR), Italy
Copyright © 2023 Li, Xue, Mai, Wang, Zhu, Han, Xie, Wang, Ge, Zhang and Sun. This is an open-access article distributed under the terms of the Creative Commons Attribution License (CC BY). The use, distribution or reproduction in other forums is permitted, provided the original author(s) and the copyright owner(s) are credited and that the original publication in this journal is cited, in accordance with accepted academic practice. No use, distribution or reproduction is permitted which does not comply with these terms.
*Correspondence: Jianfei Sun, c3VuemFnaGlAc2V1LmVkdS5jbg==