 Chen Chen
 Anquan Shang
 Yuting Gao
 Jingjuan Huang
 Gege Liu
 William C. Cho
 Dong Li
95% of researchers rate our articles as excellent or good
Learn more about the work of our research integrity team to safeguard the quality of each article we publish.
Find out more
ORIGINAL RESEARCH article
Front. Mol. Biosci. , 23 August 2022
Sec. Molecular Diagnostics and Therapeutics
Volume 9 - 2022 | https://doi.org/10.3389/fmolb.2022.968458
This article is part of the Research Topic Medical Knowledge-Assisted Machine Learning Technologies in Individualized Medicine View all 31 articles
Background: The polypyrimidine tract-binding protein (PTBP) nuclear ribonucleoprotein family of proteins, including PTBP1, PTBP2 and PTBP3, regulate the process of cell proliferation, differentiation, apoptosis and carcinogenesis. PTBPs exhibit oncogenic effects in certain tumors. However, the role of PTBPs in pan-cancer remains unclear. Our study examined the clinical significance and mechanism of PTBPs in pan-cancer.
Methods: We compared the expression of PTBPs in paired and unpaired tissue samples from the Cancer Genome Atlas (TCGA) database. Univariate and multivariate Cox regression, Kaplan–Meier curves, and time-dependent receiver operating characteristic (ROC) curves were used to assess the prognostic significance of PTBPs in pan-cancer. The cBioPortal database also identified genomic abnormalities in PTBPs. TISIDB, TCGA, and Cellminer were used to investigate the relationship between PTBP expression and immune subtypes, immune checkpoint (ICP) genes, tumor mutational burden (TMB), microsatellite instability (MSI), tumor-infiltrating immune cells, and chemosensitivity. cBioPortal was used to search for PTBP co-expressing genes in pan-cancer, and GO and KEGG enrichment analyses were performed to search for PTBP-related signaling pathways.
Results: PTBPs were shown to be widely upregulated in human tumor tissues. PTBP1 showed good prognostic value in ACC, KIRP, and LGG; PTBP2 in ACC and KICH; and PTBP3 in ACC, LGG, and PAAD, with AUC >0.7. PTBPs were differentially expressed in tumor immune subtypes and had a strong correlation with tumor-infiltrating lymphocytes (TILs) in the tumor microenvironment (TME). In addition, PTBP expressions were related to ICP, TMB, and MSI, suggesting that these three PTBPs may be potential tumor immunotherapeutic targets and predict the efficacy of immunotherapy. Enrichment analysis of co-expressed genes of PTBPs showed that they may be involved in alternative splicing, cell cycle, cellular senescence, and protein modification.
Conclusion: PTBPs are involved in the malignant progression of tumors. PTBP1, PTBP2 and PTBP3 may be potential biomarkers for prognosis and immunotherapy in pan-cancer and may be novel immunotherapeutic targets.
Cancer is a life-threatening disease to humans worldwide. The incidence and mortality rates of various cancers have been increasing year by year, and lung cancer, colorectal cancer, liver cancer and gastric cancer have the highest mortality rates (Sung et al., 2021). The field of precision medicine is advancing through new developments in technology and medicine, but the present state of practice is far from ideal (König et al., 2017). Therefore, the identification of tumor-related diagnostic, prognostic, and therapeutic biomarkers is a research hotspot.
Polypyrimidine tract-binding proteins (PTBPs) are important RNA-binding proteins (RBPs) which influence cell growth and development by regulating mRNA stability, translation and alternative splicing (Singh et al., 1995; Mickleburgh et al., 2014). The PTBP family consists of PTBP1, PTBP2 and PTBP3, and these proteins show similarities and differences in expression, structure, and biological function (Oberstrass et al., 2005; Tan et al., 2015). Studies have shown that up-regulation of PTBP1 is associated with the poor prognosis and disease progression in non-muscle-invasive bladder cancer. Therefore, PTBP1 may become a possible outcome-predictor for bladder cancer (Bielli et al., 2018). PTBP2 was also shown to stimulate the proliferation, migration, and metastasis of colorectal cancer cells (Ji et al., 2014). Previous studies demonstrated that PTBP3 enhances the invasion and metastasis of breast cancer and regulates the expression of drug resistance proteins in gastric cancer, suggesting that PTBP3 may serve as a potential novel therapeutic target for gastric cancer (Liang et al., 2017; Hou et al., 2018; Liang et al., 2020). These studies have indicated that PTBPs may function in cancer. However, research has been restricted to a small number of tumor types, and the function of PTBPs in pan-cancer has not been examined.
A growing body of evidence has revealed the close relationship between the tumor microenvironment (TME) and the effectiveness of immunotherapy (Donlon et al., 2021; Newnes et al., 2021). Immune checkpoint (ICP) inhibitors, including PD-1, CTLA4, LAG3, and TIM-3, have potent tumor suppressor effects and can interfere with immune escape; these inhibitors are currently the first-line treatment options for multiple malignancies (Ribas and Wolchok, 2018; Tu et al., 2020). Tumor infiltrating immune cells in TME, such as macrophages, neutrophils, T cells, Treg cells, T helpers, and NK cells, can affect the immunological features of malignancies. Unfortunately, this tumor heterogeneity among individuals influences the efficacy of clinical immunotherapy (Keenan et al., 2019). Thus far, precision medicine has not completely manifested in human tumors. Researchers agree on the need to explore better treatment targets.
In this study, we evaluated the clinical importance and prognostic usefulness of PTBPs in pan-cancer. We used the Cancer Genome Atlas (TCGA) to examine the expression levels of PTBP1, PTBP2, and PTBP3 in normal and tumor tissues, and cBioPortal was used to examine the genomic alterations. We also examined the link between PTBP expression and tumor immune subtype, tumor-infiltrating lymphocytes (TILs), ICP, tumor mutational burden (TMB), microsatellite instability (MSI), and chemosensitivity using multiple databases. Finally, we constructed a PTBP-interacting protein network and performed enrichment analysis of co-expressed genes. Our findings have demonstrated the prognostic value of PTBPs in pan-cancer. PTBPs may have excellent potential to be therapeutic targets and predict the efficacy of immunotherapy. We also predicted the molecular mechanisms and biological signaling pathways of PTBPs using databases and experimental data.
A total of 30 tumor types were studied in this article. A schematic flow chart of our research is shown in Supplementary Figure S1.
Gene expression, clinical data, and survival information for 30 different types of tumors were downloaded from TCGA database (https://portal.gdc.cancer.gov), and the RNA-seq data in level 3 HTSeq-FPKM format were log2-transformed. The Mann–Whitney U test was used to analyze the differences in the expression levels of PTBP1, PTBP2, and PTBP3 in unpaired tissue samples, and the Wilcoxon signed rank test was used for paired samples.
To analyze the expression correlation between PTBP1, PTBP2, and PTBP3 genes, we excluded the tumor types with less than three normal samples and then log2-transformed the ratio of the mean expression of PTBPs in tumors and normal samples of the remaining 21 tumor types. All details are shown in Supplementary Table S2.
Copy number alterations and mutations of PTBP genes were analyzed using the online database cBioPortal (http://www.cbioportal.org).
First, univariate Cox regression analysis was performed on the expressions of PTBP1, PTBP2, and PTBP3 in pan-cancer. Factors with p ≤ 0.05 were included in multivariate Cox regression analysis and displayed in a forest plot. We used Cox regression models to predict survival and plotted Kaplan–Meier (KM) curves. The accuracy of the model in predicting prognosis at a specific time was tested by a time-dependent receiver operating characteristic (ROC) curve, and the prognostic value of PTBPs in pan-cancer was determined. Taking the tumor “ACC” as an example, we constructed prognostic nomograms using PTBP expressions and pathological stage, and the accuracy of the nomogram was evaluated by a calibration curve. We examined overall survival (OS) in our analyses.
We analyzed the associations between PTBP expression and immune subtypes in human cancers using TISIDB, an online integrated website (http://cis.hku.hk/TISIDB/index.php). p ≤ 0.05 was considered statistically significant.
Using the ssGSEA algorithm to calculate the score of tumor-infiltrated immune cells in TCGA database, we selected 24 TILs to evaluate the relationship between PTBP expressions and tumor-infiltrating lymphocytes (TILs) in pan-cancer. The TILs included activated DCs (aDCs), B cells, CD8 T cells, cytotoxic cells, DC, eosinophils, immature DCs (iDCs), macrophages, mast cells, neutrophils, NK CD56bright cells, NK CD56dim cells, NK cells, plasmacytoid DCs (pDCs), T cells, T helper cells, T central memory (Tcm), T effector memory (Tem), T follicular helper (Tfh), T gamma delta (Tgd), Th1 cells, Th17 cells, Th2 cells, and Tregs (Bindea et al., 2013). Neutrophils and macrophages were selected for detailed display.
Spearman correlation analysis was performed to examine the relation of the expression levels of PTBPs and four immune checkpoint (ICP) genes (PD-1, CTLA4, LAG3, and TIM-3 genes). We used Spearman correlation analysis to determine the correlation of PTBP expressions with tumor mutational burden (TMB) and MSI in human cancers. RNA-seq data and clinical information were obtained from TCGA database. The TMB data and microsatellite instability (MSI) data were derived from the studies of Thorsson et al. (2018) and Bonneville et al. (2017), respectively. p ≤ 0.05 was considered statistically significant.
Transcriptome data (RNA: RNA-seq) and drug sensitivity data (compound activity: DTP NCI-60) were downloaded from Cellminer (https://discover.nci.nih.gov/cellminer); these data are derived from the same 60 samples. Only FDA approved samples were analyzed. A positive correlation indicated that the higher the expression of PTBP, the more sensitive that the cells were to the drugs.
We performed the analysis of Protein-Protein Interaction (PPI) networks using the STRING website (https://string-db.org/). The parameters for finding the interacting proteins of PTBPs were set as follows: minimum required interaction score [“Medium confidence (0.400)”], meaning of network edges (“evidence”) and active interaction sources (“experiments”). The parameters for finding the interaction relationship among PTBP1, PTBP2 and PTBP3 were set as follows: minimum required interaction score [“Medium confidence (0.400)”], meaning of network edges (“evidence”), active interaction sources (“textmining, experiments, databases, co-expression, co-occurrence”), and max number of interactors to show (“no more than 10 interactors”).
We downloaded the dataset “Pan-cancer analysis of whole genomes (ICGC/TCGA, Nature 2020)” on cBioPortal and screened several mRNAs co-expressed with PTBPs using the absolute value of Spearman’s correlation coefficient ≥0.4 and p < 0.05. Data were obtained from 991 samples.
We performed ID conversion on 926 PTBP1-related mRNAs, 657 PTBP2-related mRNAs, and 874 PTBP3-related mRNAs obtained in the previous step and analyzed their functions by GO and KEGG enrichment analysis. After correcting the p-value by the BH method, items with p. adjust ≤0.05 were selected for partial visualization.
R (version 3.6.3) was used for statistical analysis and visualization. The following R packages were used in this study: ggplot2 package [version 3.3.3], ggpubr package [version 0.1.4] for basic drawing, limma package [version 3.28.14] for differential analysis, survminer package [version 0.4.9], survival package [version 3.2–10] for statistical analysis of survival data, timeROC package [version 0.4] for ROC curve analysis, rms package [version 6.2–0] for building nomograms, impute package [version 1.68.0] for processing the missing value, GSVA package [version 1.34.0] for immune infiltration analysis, org. Hs.eg.db package [version 3.10.0] for id conversion, and the clusterProfiler package [version 3.14.3] for enrichment analysis.
We analyzed the expression levels of PTBPs in tumor tissues and normal/adjacent tissues from 30 cancer types, and the abbreviations of tumor types are shown in Supplementary Table S1. Paired differential expression analysis was then performed for 18 cancer types with more than three normal samples. Among PTBPs, PTBP1 showed the highest RNA expression level in tumor tissues, followed by PTBP3; the expression level of PTBP2 was the lowest among the three genes. PTBP1 was upregulated in tumor tissues compared with normal tissues in BLCA, BRCA, CESC, CHOL, COAD, ESCA, GBM, HNSC, KIRC, KIRP, LIHC, LUAD, LUSC, PRAD, READ, STAD, and UCEC. PTBP2 was upregulated in CHOL, HNSC, KIRC, LIHC, LUAD, and LUSC and downregulated in BLCA, BRCA, CESC, GBM, KICH, PCPG, PRAD, READ, THCA, and UCEC. PTBP3 was upregulated in BLCA, BRCA, CESC, CHOL, COAD, ESCA, GBM, HNSC, LIHC, LUAD, LUSC, READ, STAD, and UCEC and downregulated in KICH, KIRC, KIRP, and THCA (Figures 1A–C). The results of differential expression analysis for paired samples are shown in Figures 1D–F. Furthermore, we predicted the structures of these three proteins based on AlphaFold (Jumper et al., 2021; Varadi et al., 2022) (Supplementary Figures S2–S4), among which, PTBP1 and PTBP2 were highly similar in structure.
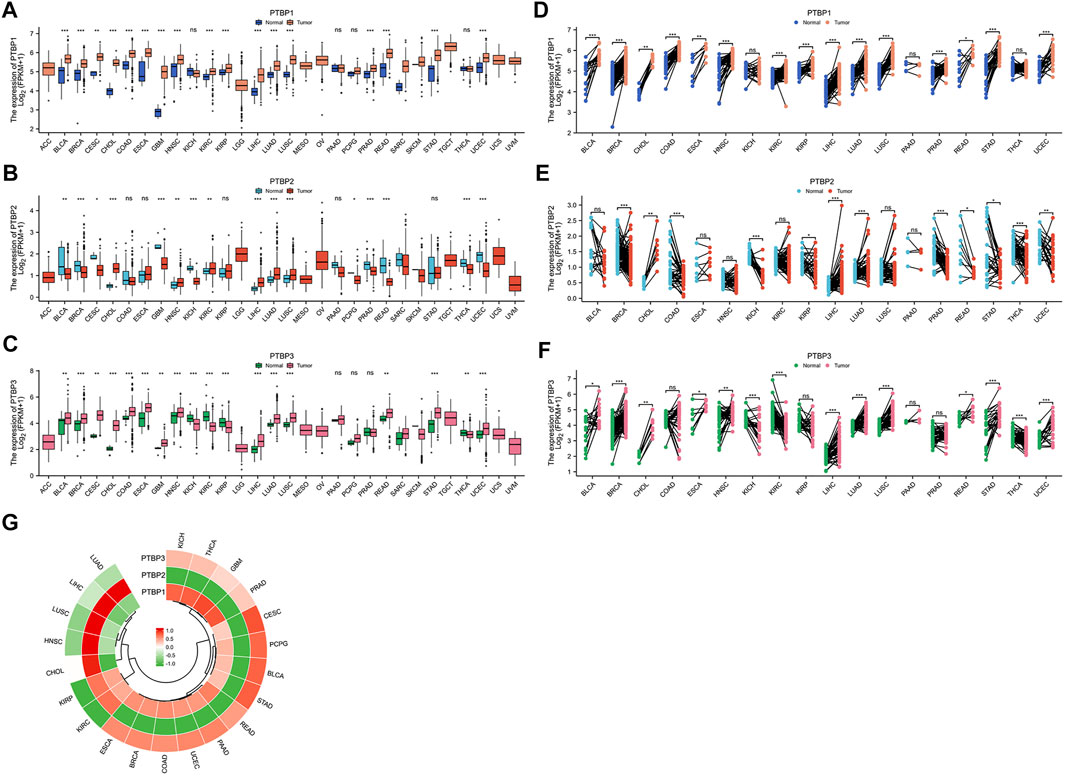
FIGURE 1. The expression levels of PTBP in pan-cancer tissues and the expression correlation among the three PTBP genes. RNA-seq data were obtained from the TCGA database. (A–C) Differential expression of PTBPs in unpaired samples of 30 tumor types. (D–F) Differential expression of PTBPs in paired samples of 30 tumor types (*p < 0.05; **p < 0.01; ***p < 0.001; ns: not significant). (G) Correlation analysis of the expressions of PTBP1, PTBP2, and PTBP3 in various tumor types.
Expression correlation analysis was performed on 21 cancer types with more than three normal samples. As shown in the circular heatmap in Figure 1G, PTBP1 and PTBP3 are expressed similarly, while PTBP2 and PTBP1/3 have the opposite expression in multiple cancers.
We next used the public dataset “Pan-cancer analysis of whole genomes (ICGC/TCGA, Nature 2020)” from cBioPortal to examine copy number alterations and mutations. The dataset includes a total of 2565 patients, and information on these three genes was available in 174 patients. The copy number alterations and mutation data of PTBPs in pan-cancer are shown in Figure 2A. PTBP1 was the most altered among the PTBPs, with the main genetic alteration types being amplifications and deep deletions. PTBP1 was frequently altered in colorectal cancer, pancreatic cancer, and ovarian cancer; PTBP2 was frequently altered in non-small cell lung cancer, lung cancer, and ovarian cancer; and PTBP3 was frequently altered in pancreatic cancer, soft tissue sarcoma, and colorectal cancer (Figures 2B–D).
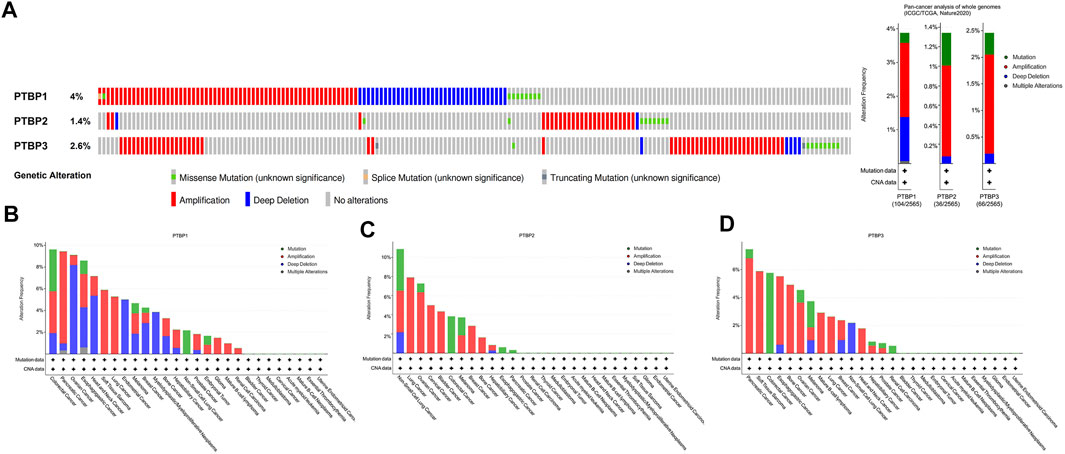
FIGURE 2. Characterization of genetic alterations in PTBPs. (A) General profile of genetic alterations in PTBPs in the pan-cancer dataset from cBioPortal. (B–D) Genetic alterations of PTBPs in specific tumor types, in descending order of alteration frequency.
We next analyzed the relationship between PTBP expression and stage, grade, or other clinical features in pan-cancer and drew violin plots using data from TCGA (Figure 3). The expression of PTBP has a strong correlation with the clinical characteristics of various tumors, indicating that PTBPs are related to the occurrence and development of tumors. For example, the expression of PTBP3 was significantly higher in high-grade BLCA than that in low-grade BLCA (p = 0.002). PTBP2 expression in IDH-mutant GBM was significantly higher than that in IDH-wildtype GBM (p < 0.001). The expression of PTBP1 was related to the pathological stage of ACC: PTBP1 expression in stage IV ACC was significantly higher than that in stage I ACC (p = 0.004). Multivariate Cox regression analysis showed that the HR of PTBP1 in ACC was 3.97 (p = 0.01) (Figure 4A). Patients with high expression of PTBP1 had a lower probability of survival (Figure 4D), indicating that PTBP1 is an independent risk factor for ACC and has the potential to be a prognostic indicator.
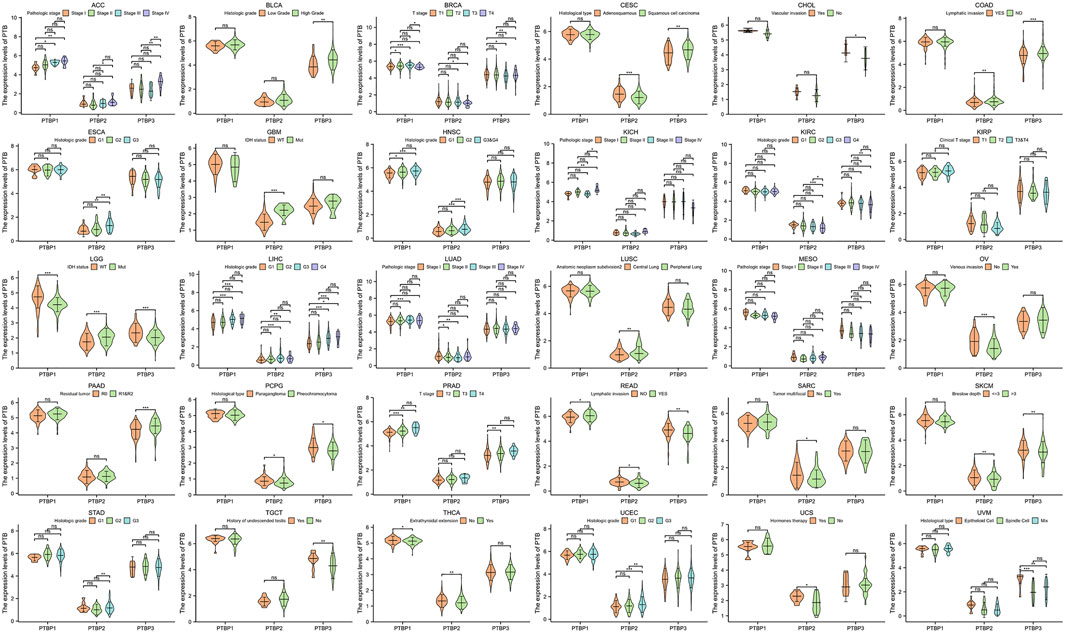
FIGURE 3. Expression levels of PTBPs in clinical parameters of interest (*p < 0.05; **p < 0.01; ***p < 0.001; ns: not significant).
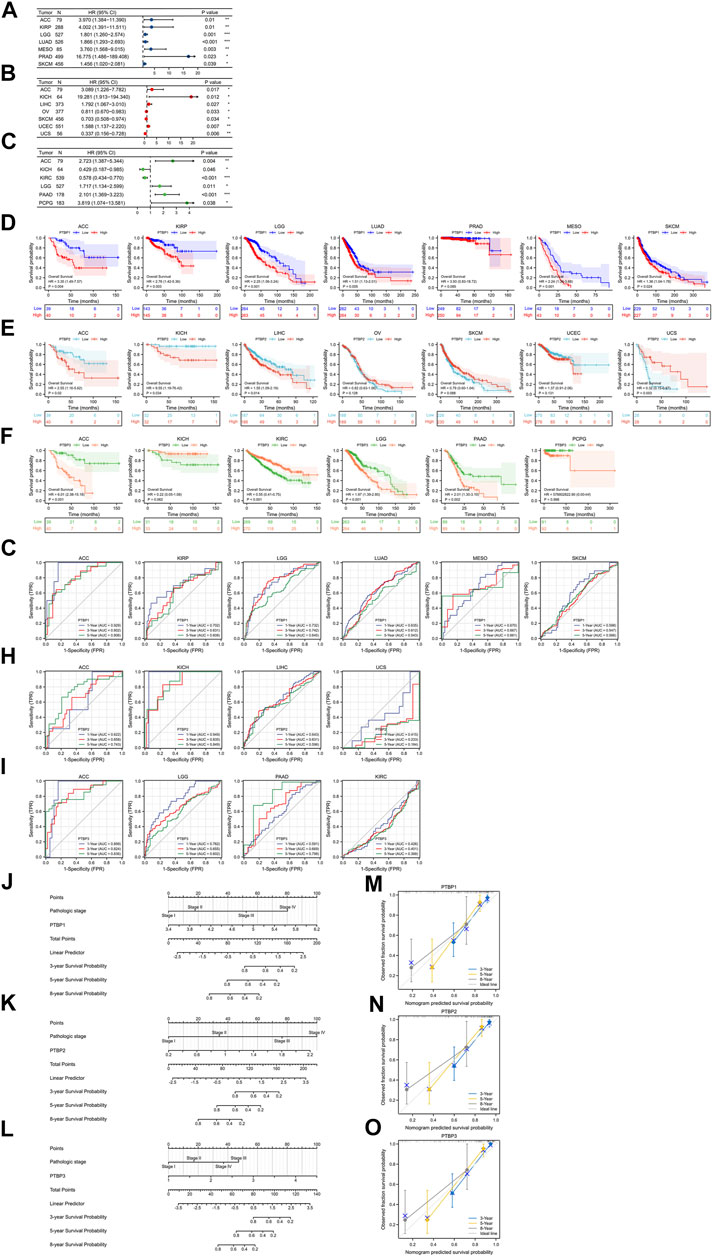
FIGURE 4. Evaluation of the prognostic value of PTBPs in pan-cancer. The multivariate Cox regression analysis results of (A) PTBP1, (B) PTBP2, and (C) PTBP3 were visualized and presented as forest plots (*p < 0.05; **p < 0.01; ***p < 0.001). (D–F) OS-KM survival curves of PTBPs in multiple cancers. (G–I) Time-dependent ROC curves of PTBPs to evaluate the utility of PTBPs as prognostic markers in selected tumor types. (J–O) Prognostic nomograms of PTBP expression combined with pathological stage in ACC. (M–O) The calibration curves for nomograms.
We downloaded RNA-seq data and corresponding clinical information of tumor tissues from 30 cancer types in TCGA database. Univariate and multivariate Cox regression analyses were performed on the OS data to analyze the hazard ratio (HR), 95% confidence interval (95%CI), and p value of PTBPs in pan-cancer (Table 1). Through multivariate Cox regression analysis, we found that PTBP1 was significantly associated with poor prognosis in ACC, KIRP, LGG, LUAD, MESO, PRAD, and SKCM (HR > 1, p < 0.05). PTBP2 is a risk factor for ACC, KICH, LIHC, and UCEC (HR > 1, p < 0.05) and a protective factor for OV, SKCM, and UCS (HR < 1, p < 0.05). PTBP3 was significantly associated with poor prognosis in ACC, LGG, PAAD, and PCPG (HR > 1, p < 0.05), but predicted better prognosis in KICH and KIRC (HR < 1, p < 0.05). The above-listed tumors were chosen to make the forest plots (Figures 4A–C).
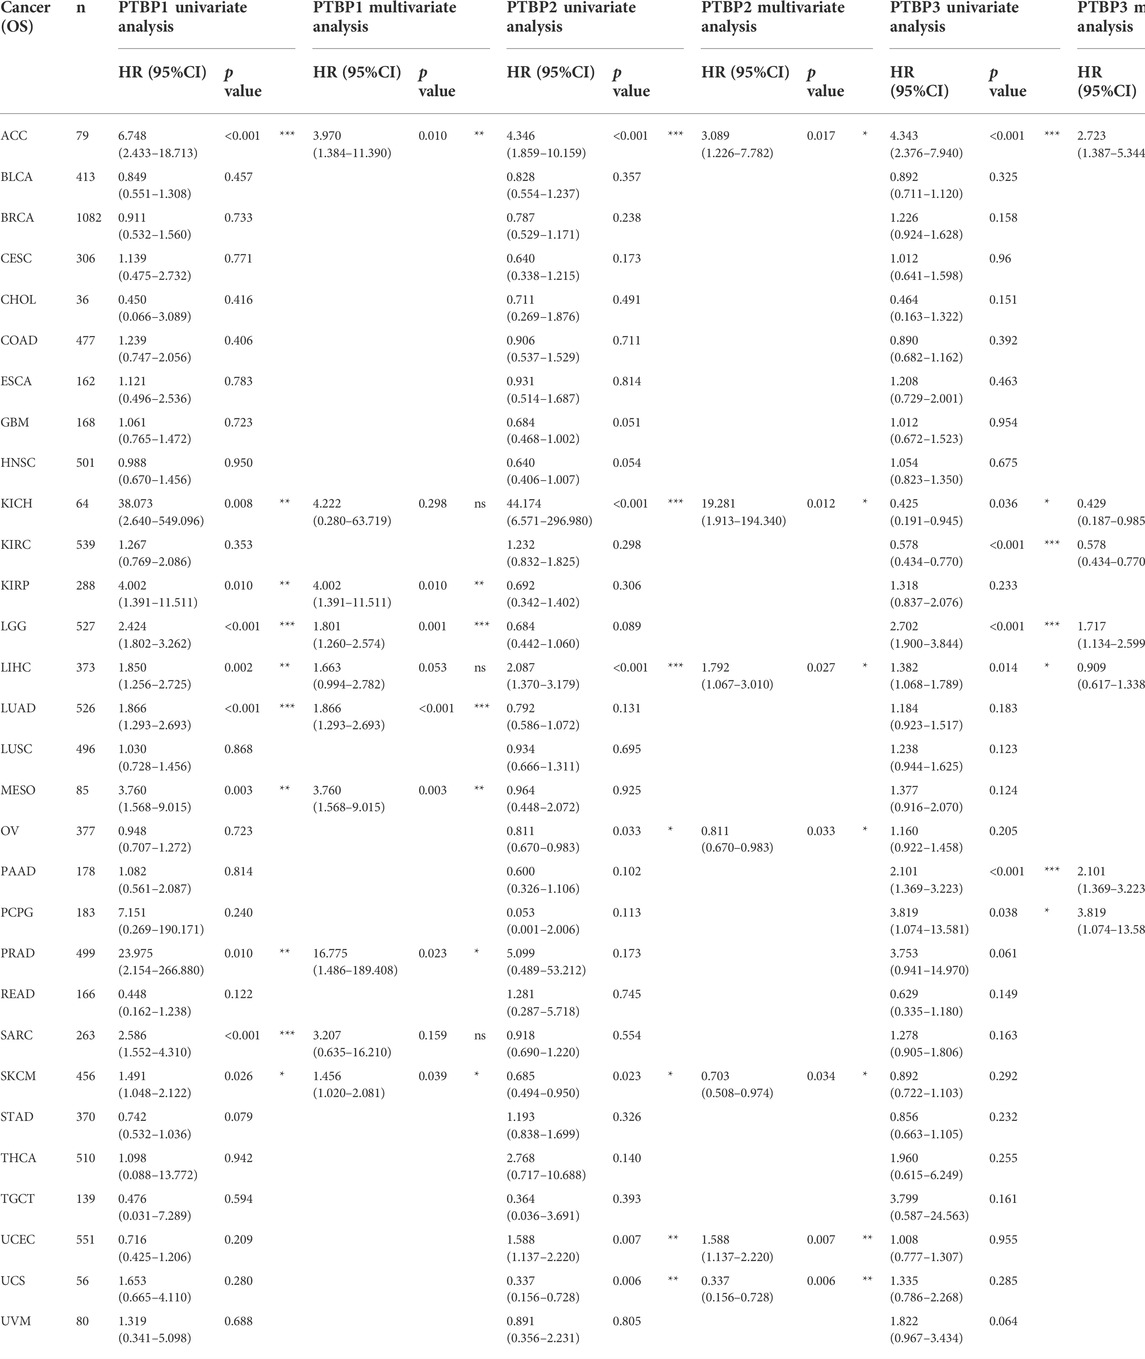
TABLE 1. Univariate and multivariate Cox regression analysis of PTBP expressions and overall survival in pan-cancer.
We divided samples into high and low expression groups using the median value of PTBP expression, predicted survival possibility, and plotted OS-KM curves. Except for PRAD (p > 0.05), the survival time of patients with ACC, KIRP, LGG, LUAD, MESO, and SKCM was shorter when PTBP1 was highly expressed, with statistical significance (HR > 1, p ≤ 0.05) (Figure 4D). Patients with ACC, KICH, and LIHC with high PTBP2 expression had a shorter OS (HR > 1, p ≤ 0.05), while patients with UCS with high PTBP2 expression had a longer survival time (HR = 0.32, p = 0.003). No significant differences in OS were observed in OV, SKCM, and UCEC (p > 0.05) (Figure 4E). When PTBP3 was highly expressed, patients with ACC, LGG, and PAAD had lower survival probability and poorer prognosis (HR > 1, p ≤ 0.05), while patients with KIRC had a longer OS and better prognosis (HR = 0.55, p < 0.001); there was no significant differences observed in patients with KICH and PCPG (p > 0.05) (Figure 4F).
By comprehensively analyzing the results of multivariate Cox regression and the OS-KM curve, we concluded that PTBP1 is a risk factor for ACC, KIRP, LGG, LUAD, MESO, and SKCM, and high expression of PTBP1 predicts a shorter survival time. PTBP2 is a risk factor in ACC, KICH, and LIHC and a protective factor in UCS. PTBP3 is a risk factor for ACC, LGG, and PAAD but a protective factor for KIRC.
Next, we assessed the prognostic value of the three genes in the above tumors. We analyzed the predictive ability of PTBP genes for prognosis at 1, 3, and 5 years by time-dependent ROC curves to confirm the accuracy of these candidate markers (Supplementary Table S3). Our results indicated that PTBP1 may serve as a prognostic biomarker for ACC, KIRP, and LGG at the three time points according to the criterion of AUC >0.7 (Figure 4G). PTBP2 showed good prognostic value in ACC and KICH (Figure 4H), and PTBP3 showed good prognostic value in ACC, LGG, and PAAD (Figure 4I), indicating these PTBPs may function as prognostic biomarkers in these tumors.
Our results showed that all three PTBPs were associated with poor prognosis in ACC, and therefore we determined the prognostic nomogram of ACC. Pathologic stage and PTBP expression were included in Cox regression analysis to establish prognostic nomograms. A vertical line was drawn to connect corresponding points and calculate the total score to estimate the 3-, 5-, and 8-years survival probability of ACC patients (Figures 4J–L). Calibration curves used to observe the predictive effect of the nomogram are shown in Figures 4M–O.
In 2018, Scientists performed an extensive immune genomic analysis of 33 cancer types (Thorsson et al., 2018). Six immune subtypes, including C1 (wound healing), C2 (IFN-gamma dominant), C3 (inflammatory), C4 (lymphocyte depleted), C5 (immunologically quiet), and C6 (TGF-β dominant), were identified by macrophage and lymphocyte markers, the ratio of Th1 cells to Th2 cells, and immune regulatory genes. This tumor heterogeneity leads to suboptimal outcomes of immunotherapy in the clinic.
We investigated the expression levels of PTBPs in different tumor immune subtypes by TISIDB. The results showed that PTBP1 expression was associated with tumor immune subtypes of BLCA, BRCA, COAD, ESCA, GBM, KIRC, KIRP, LGG, LIHC, LUAD, LUSC, PRAD, SARC, SKCM, STAD, TGCT, and UCEC (Figure 5A). PTBP2 expression correlated with tumor immune subtypes of BLCA, BRCA, LGG, LUAD, PAAD, PCPG, PRAD, READ, SARC, SKCM, STAD, TGCT, THCA, and UCEC (Figure 5B). PTBP3 expression correlated with tumor immune subtypes of BLCA, BRCA, ESCA, KIRC, KIRP, LGG, LIHC, LUAD, LUSC, OV, SARC, SKCM, STAD, TGCT, and UCEC (Figure 5C). The expression of PTBPs in immune subtypes of other cancers is shown in Supplementary Figures S5–S7.
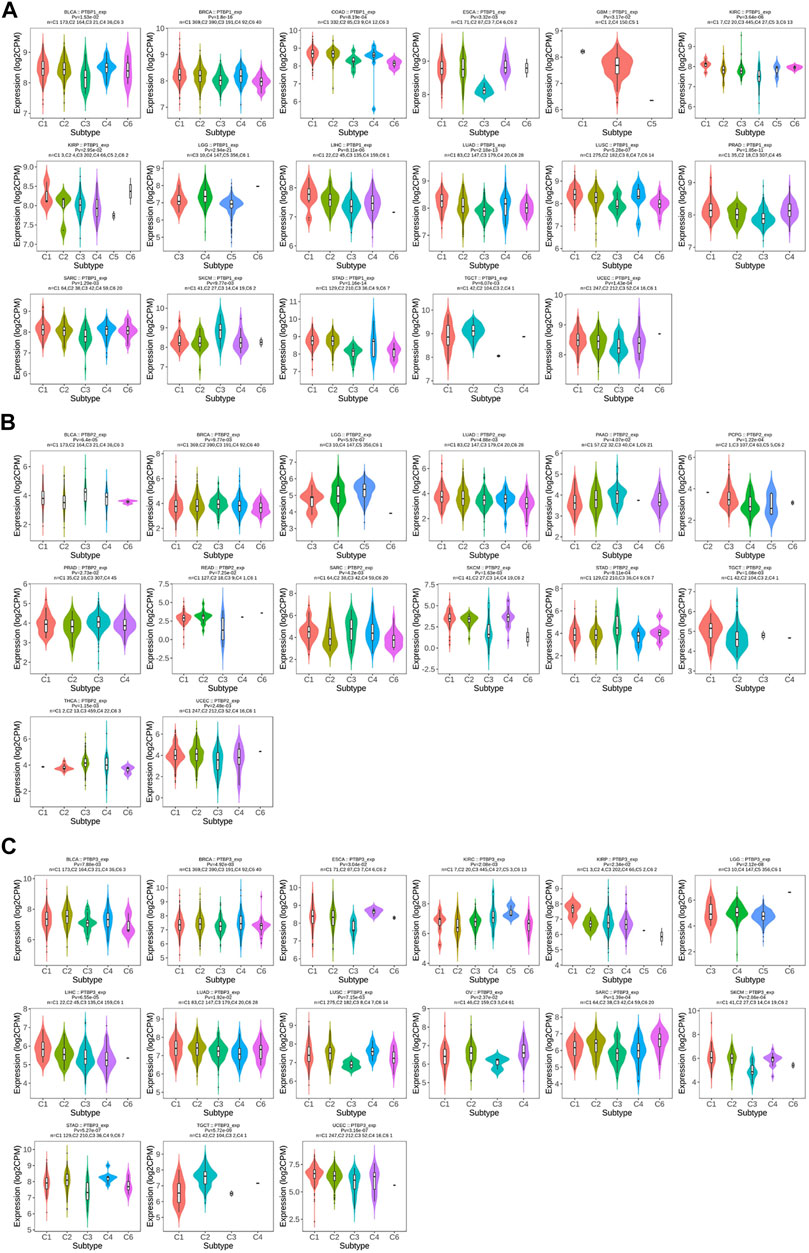
FIGURE 5. The relationship between PTBP expression and tumor immune subtype. (A) Expression levels of PTBP1 in immune subtypes. (B) Expression levels of PTBP2 in immune subtypes. (C) Expression levels of PTBP3 in immune subtypes. These results are statistically significant.
The Spearman correlations between PTBPs and TILs in various tumor types were further investigated. We found strong positive correlations of PTBP1 with Th2 cells (Figure 6A), PTBP2 with T helper cells and Tcm (Figure 6B), and PTBP3 with T helper cells, Tcm, and Th2 cells (Figure 6C) in most tumor types. Overall, the expression of PTBPs was highly correlated with the number of TILs in the TME. These results suggest that PTBPs may have a regulatory effect on the tumor microenvironment (TME) (Geng et al., 2021).
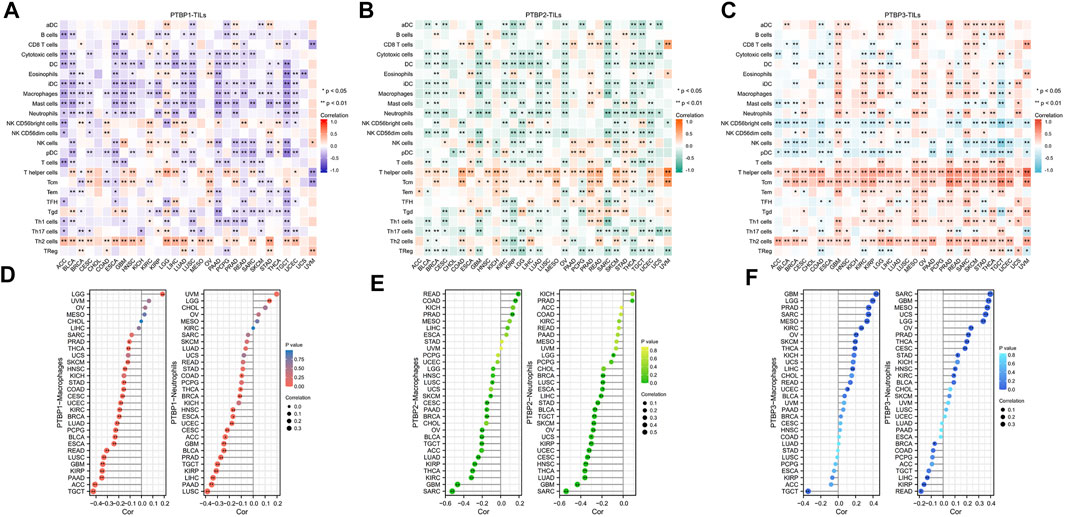
FIGURE 6. Correlation of PTBP expression with tumor-infiltrating lymphocytes in the tumor microenvironment in pan-cancer. (A–C) Heatmap of the correlation of PTBP expression with 24 TILs in pan-cancer. (D–F) The correlation of PTBP expression with macrophages and neutrophils in various tumors is shown in detail in lollipop plots (*p < 0.05; **p < 0.01).
We also examined PTBP expression with macrophages and neutrophils (Figures 6D–F). Most tumor types had an infiltration of macrophages and neutrophils, and this was inversely linked with the expression of PTBP1 and PTBP2. However, in many tumor types, PTBP3 levels were favorably linked with macrophage and neutrophil counts. These details are shown in Supplementary Table S4.
Studies have shown that the immune checkpoint (ICP) genes have a great influence on the efficacy of immunotherapy. PD-1, CTLA4, LAG3, and TIM-3 are four ICPs that are frequently examined in the clinic, and inhibitors targeting these factors have shown potent tumor-killing effects in a variety of tumors (Sun et al., 2021; Yang et al., 2021; Gaikwad et al., 2022; Tian et al., 2022). To explore the potential of PTBPs in immunotherapy, we analyzed the relationship between PTBPs and four ICP genes in pan-cancer (Supplementary Table S5). In the 30 tumor types, PTBP1 expression had the most prevalent positive correlation with LAG3 and PD-1 expression (in Figure 7A). Similarly, PTBP2 was generally positively correlated with CTLA4 and PTBP3 with CTLA4 and TIM-3. These results suggest that PTBPs may serve as potential targets for immunotherapy.
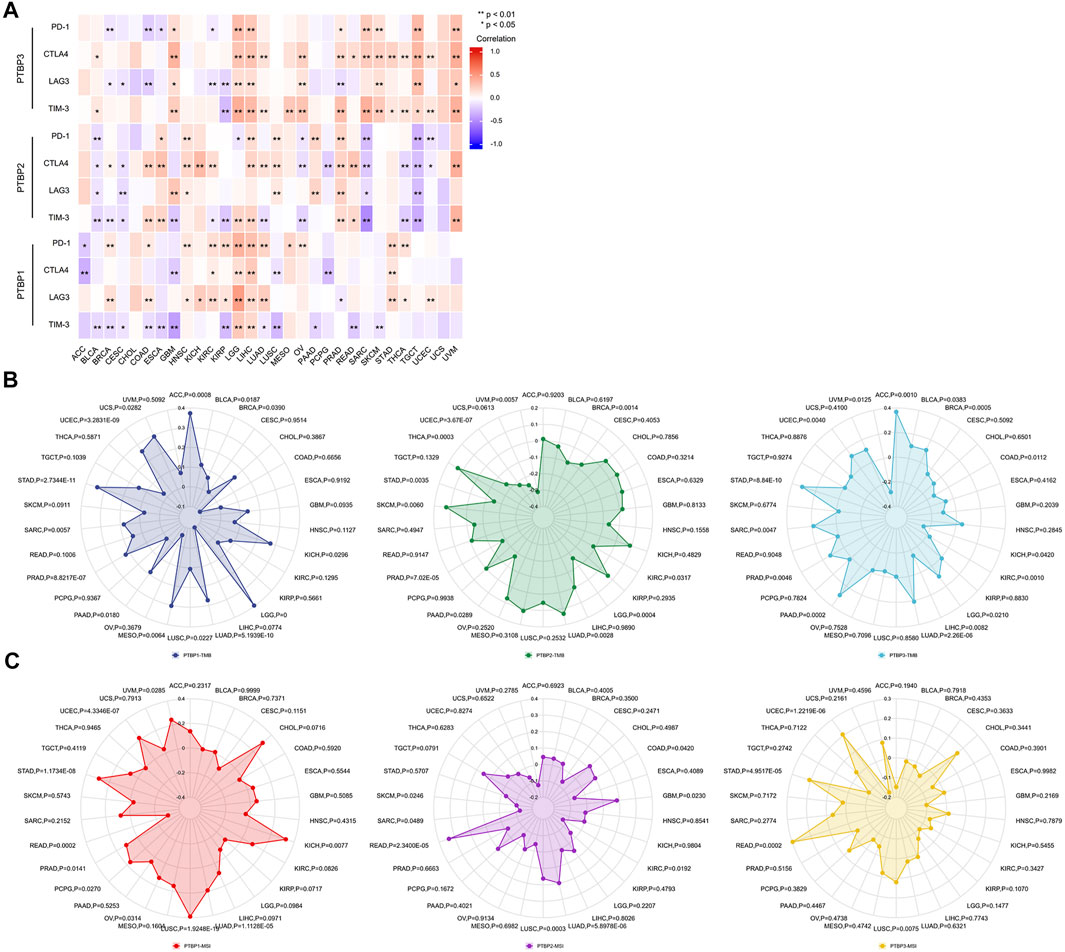
FIGURE 7. Spearman correlation analysis of PTBP expression with immune checkpoint genes, tumor mutational burden and microsatellite instability in pan-cancer. (A) Correlation of PTBP expression with ICPs (PD-1, CTLA4, LAG3 and TIM-3) in pan-cancer (*p < 0.05; **p < 0.01). (B) Correlation of PTBP expression with TMB. (C) Correlation of PTBP expression with MSI. p values are marked in the figures.
TMB and MSI are demonstrated biomarkers that predict the efficacy of immunotherapy, with higher TMB or MSI indicating a better response to ICP inhibitors (Chan et al., 2019; Diao et al., 2021). Using the criteria of |R| ≥ 0.3 and p < 0.05, the radar chart showed that the expression of PTBP1 in ACC, LGG, MESO, and STAD was positively correlated with TMB. PTBP2 expression was negatively correlated with TMB in UVM. PTBP3 expression was positively correlated with TMB in ACC and STAD (Figure 7B).
In KICH and LUSC, PTBP1 expression associated favorably with MSI, but it correlated negatively in READ. PTBP2 expression was positively correlated with MSI in READ (Figure 7C). The detailed expression data were presented in Supplementary Table S6, and the correlations were shown in Supplementary Table S7. These evidences supported the finding that PTBPs may predict response to immunotherapy and play a role in tumor immunity.
We next analyzed the Pearson correlation of PTBP expression with the sensitivity of 263 FDA-approved drugs in 60 tumor cell lines using the Cellminer database (Figures 8A–C) and obtained the top six drugs with the strongest correlation with PTBPs. For example, the expression of PTBP1 was proportional to the sensitivity of cells to gemcitabine (R = 0.409, p = 0.001): the higher the expression of PTBP1, the more sensitive the cell was to gemcitabine. Therefore, the expression of PTBPs may be a predictor of tumor response to chemotherapeutic drugs.
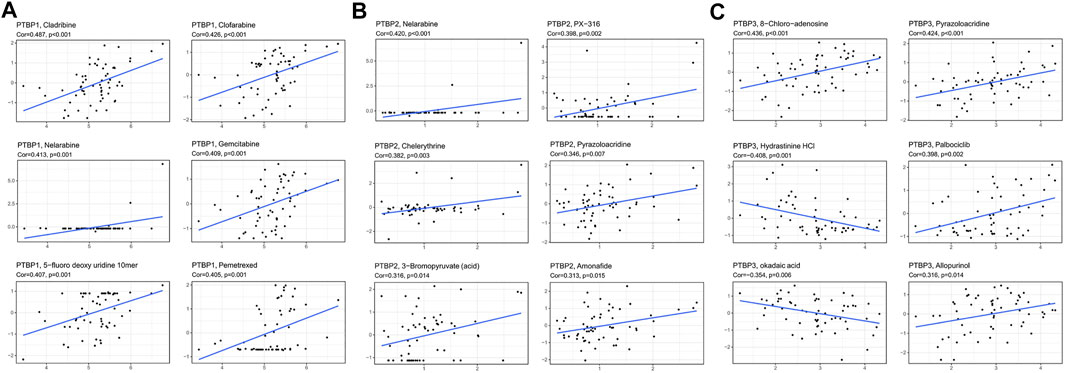
FIGURE 8. Pearson correlation of PTBP expression with drug sensitivity scores in various tumor cell lines in Cellminer. The top six drugs with the largest absolute value of the correlation coefficient are displayed. (A) Correlation of PTBP1 with drug sensitivity. (B) Correlation of PTBP2 with drug sensitivity. (C) Correlation of PTBP3 with drug sensitivity. The correlation coefficient and p value are marked in the figure.
We mapped the PPI networks of PTBP1, PTBP2, and PTBP3 (Figure 9A) respectively and visualized the interaction among these three molecules using STRING (Figure 9B). It showed that PTBP1 was closely related to heterogeneous nuclear ribonucleoproteins (hnRNPs), YBX1, and SFPQ (Meissner et al., 2000; King et al., 2014). There are four relationships between PTBP1 and PTBP2: experimentally determined interactions, databases recorded interactions, protein homology, and text mining. However, PTBP3 did not seem to interact with PTBP1 and PTBP2 (Figure 9B).
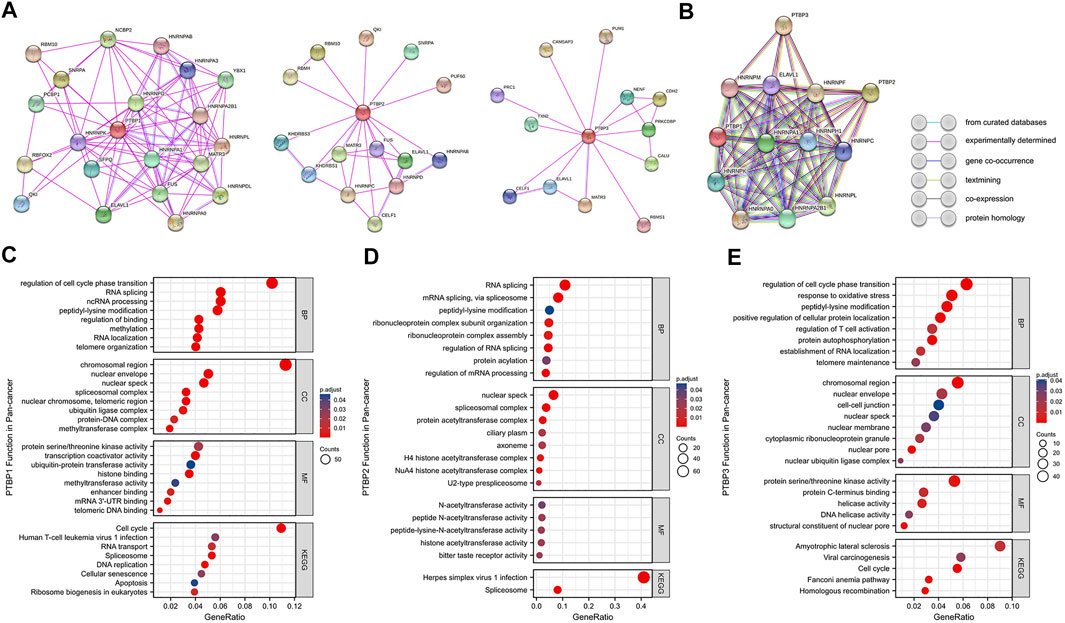
FIGURE 9. Protein-protein interaction networks and functional enrichment analysis of PTBPs in pan-cancer. (A) Experimentally validated interacting proteins of PTBPs using STRING. (B) The interaction relationship among the three protein molecules. Line colors in the legend indicate different relationships. (C–E) GO enrichment and KEGG pathway analysis results for co-expressed mRNAs of PTBPs.
Spearman correlation analysis on the pan-cancer dataset from cBioPortal yielded 926 mRNAs co-expressed with PTBP1, 657 mRNAs co-expressed with PTBP2, and 874 mRNAs co-expressed with PTBP3 (|R| ≥ 0.4, p < 0.05) (Supplementary Table S8). We further analyzed PTBP-related mRNAs using GO (including BP, CC, and MF) and KEGG enrichment analyses (Figures 9C–E). The results revealed that PTBP1 may function through “Cell cycle,” “Human T-cell leukemia virus one infection,” “RNA transport,” “Spliceosome,” “DNA replication,” “Cellular senescence” and “Apoptosis.” PTBP2 may be associated with “Herpes simplex virus one infection” and “Spliceosome” pathways, while PTBP3 may affect tumor progression through “Amyotrophic lateral sclerosis,” “Viral carcinogenesis,” “Cell cycle” and “Homologous recombination” pathways (Supplementary Table S9). Together, the results above have established a novel theoretical framework for the investigation of PTBP regulation mechanism in malignancies.
PTBPs are RNA-binding proteins that are involved in alternative splicing, mRNA stability, and translation. The PTBP family includes PTBP1, PTBP2 and PTBP3. PTBP1 can be expressed in almost all types of cells; PTBP2 is only expressed in the neurological system while PTBP3 is found mostly in immune cells (Spellman et al., 2007). Among the PTBP family members, PTBP1 is most frequently linked with cancer, followed by PTBP3. It is reported that PTBP1 promotes lung cancer metastasis by regulating the alternative splicing of Mena mRNA (Li et al., 2019). PTBP3 is upregulated in breast cancer and regulates ZEB1 mRNA stability to promote epithelial-mesenchymal transition in BRCA (Hou et al., 2018; Liang et al., 2020). Most research has focused on the function of PTBPs in tumor cells, but little attention has been paid to their interaction with immune cells in the TME (Sasanuma et al., 2019; Geng et al., 2021). In addition, reports of PTBPs in uncommon tumors are rare. Thus, we investigated the expression, function, and immune characterization of PTBP1, PTBP2, and PTBP3 in pan-cancer.
We first performed differentiation analysis and correlation analysis on the expression of the PTBP1, PTBP2, and PTBP3 genes in 30 tumor types using TCGA. The results showed that in most tumor types, the expression levels of PTBP1 and PTBP3 in tumor tissues were significantly higher than that in non-tumor tissues. In contrast, the expression level of PTBP2 was lower in tumor tissues compared with that in normal tissues. Interestingly, when we analyzed the expression correlation of PTBPs, we found that PTBP1/3 appeared to have opposite expression trends to PTBP2 in pan-cancer. Our results were consistent with other scholars’ findings. Previous studies suggested that PTBP1 is a repressor of PTBP2 and that there was a “switch” between the two molecules (Boutz et al., 2007; Spellman et al., 2007). SON may be an on-off regulator of the expression of PTBP1 and PTBP2 in GBM (Kim et al., 2021), and PTBP2 compensates for the absence of Ptbp1 during B cell development in mice (Monzón-Casanova et al., 2020). Furthermore, we found a co-expression trend between PTBP1 and PTBP3 which deserved to be further investigated.
It has been reported in the literature that PTBP1 can be used as a biomarker for poor prognosis in bladder cancer (Bielli et al., 2018), and PTBP3 as a therapeutic target for gastric cancer (Liang et al., 2017). Here we further comprehensively explored the association of PTBP expression with prognosis in pan-cancer. Through multivariate Cox regression analysis and OS-KM survival curves, we found that patients with ACC, LGG, and PAAD had poor prognosis when PTBP3 was highly expressed, but patients with KIRC had better prognosis. Given that the expression of PTBP3 in KIRC tumor tissues was significantly lower than that in control tissues, PTBP3 may be a tumor suppressor molecule in KIRC. Thus, more research is required to examine the function and molecular mechanism of PTBP3 in KIRC. Time-dependent ROC curves were used to verify the prognostic value of PTBPs in pan-cancer. Compared with the ordinary ROC curve, the time-dependent ROC curve detects the accuracy of candidate markers at specified times. We finally identified PTBP1 in ACC, KIRP, and LGG; PTBP2 in ACC and KICH; and PTBP3 in ACC, LGG, and PAAD as potential prognostic biomarkers that may be involved in tumor progression in these tumor types.
We then analyzed the expression of PTBPs in different immune subtypes. The results indicated that PTBPs might participate in immune regulation. The expression of PTBPs was significantly different across multiple immune subtypes and strongly correlated with the number of TILs in the TME. Remarkably, PTBP1 on Th2 cells, PTBP2 on T helper cells and Tcm, and PTBP3 on T helper cells, Tcm, and Th2 cells may have broad positive regulatory effects in pan-cancer. PTBPs are also strongly associated with macrophages and neutrophils in the TME. For example, PTBP3 expression was positively correlated with macrophages and neutrophils in GBM, LGG, PRAD, SARC, MESO, KIRC, OV, and THCA. These results demonstrated the important role of PTBPs in tumor immunity and the tumor microenvironment.
The immune microenvironment in tumor tissues leads to tumor heterogeneity, which influences the clinical efficacy of anticancer drugs. Immune checkpoint inhibitors are used as treatment options for cancer patients. We found that PTBP expression showed a strong correlation with PD-1, CTLA4, LAG3, or TIM-3 in pan-cancer. Therefore, PTBPs may be a class of potential therapeutic targets, providing a new direction for combined targeted immunotherapy in the future.
We also analyzed the correlation of PTBPs with TMB and MSI. Tumor cells with high TMB usually have higher levels of neoantigens, which help the immune system to recognize the tumor and activate the anti-tumor effect of T cells. Therefore, higher TMB generally indicates better outcome of immunotherapy, and TMB is highly correlated with the efficacy of PD-1/PD-L1 inhibitors (Yarchoan et al., 2017; Chan et al., 2019). MSI works similarly. TMB and MSI have become predictive markers of tumor immunotherapy efficacy in recent years. The correlation of PTBP expression with TMB and MSI in pan-cancer suggests that PTBPs may become novel biomarkers for predicting patients’ response to immunotherapy.
We also made other notable findings. Gemcitabine is an effective anti-tumor drug for NSCLC (stage III and IV), OV, BRCA, BLCA, and other malignant tumors (Ferrazzi and Stievano, 2006; Mornex and Girard, 2006), and 5-fluorodeoxyuridine is a common chemotherapeutic drug for BRCA, STAD, READ, and BLCA (Koizumi et al., 1993). PTBP1 expression was proportional to the sensitivity of cells to gemcitabine (R = 0.409, p = 0.001) and 5-fluorodeoxyuridine (R = 0.407, p = 0.001). This result indicates that the expression of PTBPs may predict the therapeutic effect of chemotherapeutic drugs.
When we investigated “interacting proteins”, we found that all PTBP family proteins can tightly interacts with hnRNPs and ELAVL1 (also known as HuR), which was verified by co-immunoprecipitation or reported in literature (Hegele et al., 2012). The presence of such protein complexes may increase their effect. For example, PTBP1 can interact with HuR and jointly upregulate the translation of HIF-1α mRNA in human cervical carcinoma HeLa cells (Galbán et al., 2008).
In the enrichment analysis of co-expressed genes, we inferred that PTBPs may function in the cell cycle, RNA splicing and RNA localization. PTBP1 and PTBP3 were enriched in telomere-related signaling pathways, suggesting that they may be involved in cellular senescence pathways. Scientists found that PTBP1 can regulate alternative splicing of genes involved in intracellular trafficking to control the senescence-associated secretory phenotype (SASP). Inhibition of PTBP1 blocks the tumor-promoting effect of SASP and impair immune surveillance (Georgilis et al., 2018). Sayed et al. also found that knockdown of PTBP1 in cancer cells reduced hTERT full-length splicing and telomerase activity (Sayed et al., 2019). The important role of PTBP1 and PTBP3 in cellular senescence and immunity should be further explored.
This study has several limitations. First, our conclusions are limited by sequencing technologies and analytical methodologies from the database, and the data may be lacking in granularity and precision. This has become a pervasive problem in bioinformatics research. Second, whether PTBPs can be used as biomarkers for prognosis and immunotherapy requires validation in more clinical samples. At present, there is no immune-targeted drug against PTBPs, so it is not possible to clinically verify the effect of these targets. Third, the involvement of PTBPs in immune regulation and cellular senescence need to be supported by in vitro and in vivo experimental evidence.
This study comprehensively and systematically analyzed the prognostic value, genetic variation, and signaling pathways of PTBP1, PTBP2, and PTBP3 and the correlation of PTBP expression with TILs, ICP, TMB, MSI, and drug sensitivity from a pan-cancer perspective. Our results indicate that PTBPs may be promising prognostic biomarkers and predict the response to immunotherapy in pan-cancer. We found that PTBPs are closely related to tumor progression and cell senescence, which provides a theoretical reference for subsequent research.
The original contributions presented in the study are included in the article/Supplementary Material, further inquiries can be directed to the corresponding authors.
CC, AS, and DL designed the research study. CC, YG, JH, and GL carried out the data analysis and processing. CC prepared the original manuscript. AS, WC, and DL revised the manuscript and edited the final version. All authors read and approved the final manuscript.
This work was supported by the National Natural Science Foundation of China (82072362, 8200223, 8200222); the Postdoctoral Science Foundation of China (2020M681399); the Science and Technology Innovation Action Plan of Shanghai Science and Technology Commission (19411964800, 20YF1443700); Shanghai Municipal Health and Health Commission (20204Y0070); Shanghai Public Health System Construction Three-Year Action Plan (2020–2022) Key Disciplines (GWV-10.1-XK04) and the Clinical Research Project of Tongji Hospital of Tongji University [ITJ (ZD)1905, ITJ (QN)1905, ITJ (QN)2005].
We would like to acknowledge all members of the “HOME for Researchers” for their assistance and useful suggestions.
The authors declare that the research was conducted in the absence of any commercial or financial relationships that could be construed as a potential conflict of interest.
The reviewer FY declared a shared parent affiliation with the authors to the handling editor at the time of review.
All claims expressed in this article are solely those of the authors and do not necessarily represent those of their affiliated organizations, or those of the publisher, the editors and the reviewers. Any product that may be evaluated in this article, or claim that may be made by its manufacturer, is not guaranteed or endorsed by the publisher.
The Supplementary Material for this article can be found online at: https://www.frontiersin.org/articles/10.3389/fmolb.2022.968458/full#supplementary-material
Bielli, P., Panzeri, V., Lattanzio, R., Mutascio, S., Pieraccioli, M., Volpe, E., et al. (2018). The splicing factor PTBP1 promotes expression of oncogenic splice variants and predicts poor prognosis in patients with non-muscle-invasive bladder cancer. Clin. Cancer Res. 24, 5422–5432. doi:10.1158/1078-0432.CCR-17-3850
Bindea, G., Mlecnik, B., Tosolini, M., Kirilovsky, A., Waldner, M., Obenauf, A. C., et al. (2013). Spatiotemporal dynamics of intratumoral immune cells reveal the immune landscape in human cancer. Immunity 39, 782–795. doi:10.1016/j.immuni.2013.10.003
Bonneville, R., Krook, M. A., Kautto, E. A., Miya, J., Wing, M. R., Chen, H. Z., et al. (2017). Landscape of microsatellite instability across 39 cancer types. JCO Precis. Oncol. 1, 1–15. doi:10.1200/PO.17.00073
Boutz, P. L., Stoilov, P., Li, Q., Lin, C. H., Chawla, G., Ostrow, K., et al. (2007). A post-transcriptional regulatory switch in polypyrimidine tract-binding proteins reprograms alternative splicing in developing neurons. Genes Dev. 21, 1636–1652. doi:10.1101/gad.1558107
Chan, T. A., Yarchoan, M., Jaffee, E., Swanton, C., Quezada, S. A., Stenzinger, A., et al. (2019). Development of tumor mutation burden as an immunotherapy biomarker: utility for the oncology clinic. Ann. Oncol. 30, 44–56. doi:10.1093/annonc/mdy495
Diao, Z., Han, Y., Chen, Y., Zhang, R., and Li, J. (2021). The clinical utility of microsatellite instability in colorectal cancer. Crit. Rev. Oncol. Hematol. 157, 103171. doi:10.1016/j.critrevonc.2020.103171
Donlon, N. E., Power, R., Hayes, C., Reynolds, J. V., and Lysaght, J. (2021). Radiotherapy, immunotherapy, and the tumour microenvironment: Turning an immunosuppressive milieu into a therapeutic opportunity. Cancer Lett. 502, 84–96. doi:10.1016/j.canlet.2020.12.045
Ferrazzi, E., and Stievano, L. (2006). Gemcitabine: monochemotherapy of breast cancer. Ann. Oncol. 17, v169–172. doi:10.1093/annonc/mdj975
Gaikwad, S., Agrawal, M. Y., Kaushik, I., Ramachandran, S., and Srivastava, S. K. (2022). Immune checkpoint proteins: Signaling mechanisms and molecular interactions in cancer immunotherapy. Semin. Cancer Biol. doi:10.1016/j.semcancer.2022.03.014
Galbán, S., Kuwano, Y., Pullmann, R., Martindale, J. L., Kim, H. H., Lal, A., et al. (2008). RNA-binding proteins HuR and PTB promote the translation of hypoxia-inducible factor 1alpha. Mol. Cell. Biol. 28, 93–107. doi:10.1128/MCB.00973-07
Geng, G., Xu, C., Peng, N., Li, Y., Liu, J., Wu, J., et al. (2021). PTBP1 is necessary for dendritic cells to regulate T-cell homeostasis and antitumour immunity. Immunology 163, 74–85. doi:10.1111/imm.13304
Georgilis, A., Klotz, S., Hanley, C. J., Herranz, N., Weirich, B., Morancho, B., et al. (2018). PTBP1-Mediated alternative splicing regulates the inflammatory secretome and the pro-tumorigenic effects of senescent cells. Cancer Cell 34, 85–102.e9. doi:10.1016/j.ccell.2018.06.007
Hegele, A., Kamburov, A., Grossmann, A., Sourlis, C., Wowro, S., Weimann, M., et al. (2012). Dynamic protein-protein interaction wiring of the human spliceosome. Mol. Cell 45, 567–580. doi:10.1016/j.molcel.2011.12.034
Hou, P., Li, L., Chen, F., Chen, Y., Liu, H., Li, J., et al. (2018). PTBP3-Mediated regulation of ZEB1 mRNA stability promotes epithelial-mesenchymal transition in breast cancer. Cancer Res. 78, 387–398. doi:10.1158/0008-5472.CAN-17-0883
Ji, Q., Zhang, L., Liu, X., Zhou, L., Wang, W., Han, Z., et al. (2014). Long non-coding RNA MALAT1 promotes tumour growth and metastasis in colorectal cancer through binding to SFPQ and releasing oncogene PTBP2 from SFPQ/PTBP2 complex. Br. J. Cancer 111, 736–748. doi:10.1038/bjc.2014.383
Jumper, J., Evans, R., Pritzel, A., Green, T., Figurnov, M., Ronneberger, O., et al. (2021). Highly accurate protein structure prediction with AlphaFold. Nature 596, 583–589. doi:10.1038/s41586-021-03819-2
Keenan, T. E., Burke, K. P., and Van Allen, E. M. (2019). Genomic correlates of response to immune checkpoint blockade. Nat. Med. 25, 389–402. doi:10.1038/s41591-019-0382-x
Kim, J. H., Jeong, K., Li, J., Murphy, J. M., Vukadin, L., Stone, J. K., et al. (2021). SON drives oncogenic RNA splicing in glioblastoma by regulating PTBP1/PTBP2 switching and RBFOX2 activity. Nat. Commun. 12, 5551. doi:10.1038/s41467-021-25892-x
King, H. A., Cobbold, L. C., Pichon, X., Pöyry, T., Wilson, L. A., Booden, H., et al. (2014). Remodelling of a polypyrimidine tract-binding protein complex during apoptosis activates cellular IRESs. Cell Death Differ. 21, 161–171. doi:10.1038/cdd.2013.135
Koizumi, W., Kurihara, M., Sasai, T., Yoshida, S., Morise, K., Imamura, A., et al. (1993). A phase II study of combination therapy with 5'-deoxy-5-fluorouridine and cisplatin in the treatment of advanced gastric cancer with primary foci. Cancer 72, 658–662. doi:10.1002/1097-0142(19930801)72:3<658::aid-cncr2820720306>3.0.co;2-k
König, I. R., Fuchs, O., Hansen, G., von Mutius, E., and Kopp, M. V. (2017). What is precision medicine. Eur. Respir. J. 50, 1700391. doi:10.1183/13993003.00391-2017
Li, S., Shen, L., Huang, L., Lei, S., Cai, X., Breitzig, M., et al. (2019). PTBP1 enhances exon11a skipping in Mena pre-mRNA to promote migration and invasion in lung carcinoma cells. Biochim. Biophys. Acta. Gene Regul. Mech. 1862, 858–869. doi:10.1016/j.bbagrm.2019.04.006
Liang, X., Shi, H., Yang, L., Qiu, C., Lin, S., Qi, Y., et al. (2017). Inhibition of polypyrimidine tract-binding protein 3 induces apoptosis and cell cycle arrest, and enhances the cytotoxicity of 5- fluorouracil in gastric cancer cells. Br. J. Cancer 116, 903–911. doi:10.1038/bjc.2017.32
Liang, Y., Song, X., Li, Y., Chen, B., Zhao, W., Wang, L., et al. (2020). LncRNA BCRT1 promotes breast cancer progression by targeting miR-1303/PTBP3 axis. Mol. Cancer 19, 85. doi:10.1186/s12943-020-01206-5
Meissner, M., Dechat, T., Gerner, C., Grimm, R., Foisner, R., and Sauermann, G. (2000). Differential nuclear localization and nuclear matrix association of the splicing factors PSF and PTB. J. Cell. Biochem. 76, 559–566. doi:10.1002/(sici)1097-4644(20000315)76:4<559::aid-jcb4>3.0.co;2-u
Mickleburgh, I., Kafasla, P., Cherny, D., Llorian, M., Curry, S., Jackson, R. J., et al. (2014). The organization of RNA contacts by PTB for regulation of FAS splicing. Nucleic Acids Res. 42, 8605–8620. doi:10.1093/nar/gku519
Monzón-Casanova, E., Matheson, L. S., Tabbada, K., Zarnack, K., Smith, C. W., and Turner, M. (2020). Polypyrimidine tract-binding proteins are essential for B cell development. Elife 9, e53557. doi:10.7554/eLife.53557
Mornex, F., and Girard, N. (2006). Gemcitabine and radiation therapy in non-small cell lung cancer: state of the art. Ann. Oncol. 17, 1743–1747. doi:10.1093/annonc/mdl117
Newnes, H. V., Armitage, J. D., Audsley, K. M., Bosco, A., and Waithman, J. (2021). Directing the future breakthroughs in immunotherapy: The importance of a holistic approach to the tumour microenvironment. Cancers (Basel) 13, 5911. doi:10.3390/cancers13235911
Oberstrass, F. C., Auweter, S. D., Erat, M., Hargous, Y., Henning, A., Wenter, P., et al. (2005). Structure of PTB bound to RNA: specific binding and implications for splicing regulation. Science 309, 2054–2057. doi:10.1126/science.1114066
Ribas, A., and Wolchok, J. D. (2018). Cancer immunotherapy using checkpoint blockade. Science 359, 1350–1355. doi:10.1126/science.aar4060
Sasanuma, H., Ozawa, M., and Yoshida, N. (2019). RNA-binding protein Ptbp1 is essential for BCR-mediated antibody production. Int. Immunol. 31, 157–166. doi:10.1093/intimm/dxy077
Sayed, M. E., Yuan, L., Robin, J. D., Tedone, E., Batten, K., Dahlson, N., et al. (2019). NOVA1 directs PTBP1 to hTERT pre-mRNA and promotes telomerase activity in cancer cells. Oncogene 38, 2937–2952. doi:10.1038/s41388-018-0639-8
Singh, R., Valcárcel, J., and Green, M. R. (1995). Distinct binding specificities and functions of higher eukaryotic polypyrimidine tract-binding proteins. Science 268, 1173–1176. doi:10.1126/science.7761834
Spellman, R., Llorian, M., and Smith, C. W. (2007). Crossregulation and functional redundancy between the splicing regulator PTB and its paralogs nPTB and ROD1. Mol. Cell 27, 420–434. doi:10.1016/j.molcel.2007.06.016
Sun, S., Xu, L., Zhang, X., Pang, L., Long, Z., Deng, C., et al. (2021). Systematic assessment of transcriptomic biomarkers for immune checkpoint blockade response in cancer immunotherapy. Cancers (Basel) 13, 1639. doi:10.3390/cancers13071639
Sung, H., Ferlay, J., Siegel, R. L., Laversanne, M., Soerjomataram, I., Jemal, A., et al. (2021). Global cancer statistics 2020: GLOBOCAN estimates of incidence and mortality worldwide for 36 cancers in 185 countries. CA. Cancer J. Clin. 71, 209–249. doi:10.3322/caac.21660
Tan, L. Y., Whitfield, P., Llorian, M., Monzon-Casanova, E., Diaz-Munoz, M. D., Turner, M., et al. (2015). Generation of functionally distinct isoforms of PTBP3 by alternative splicing and translation initiation. Nucleic Acids Res. 43, 5586–5600. doi:10.1093/nar/gkv429
Thorsson, V., Gibbs, D. L., Brown, S. D., Wolf, D., Bortone, D. S., Ou Yang, T. H., et al. (2018). The immune landscape of cancer. Immunity 48, 812–830.e14. doi:10.1016/j.immuni.2018.03.023
Tian, J., Liu, Y., Zhang, T., Yue, L., Xiao, Y., and Guo, C. (2022). LAG-3 is a promising inhibitory immune checkpoint for antitumor immunotherapy. Expert Rev. Anticancer Ther. 22, 289–296. doi:10.1080/14737140.2022.2039124
Tu, L., Guan, R., Yang, H., Zhou, Y., Hong, W., Ma, L., et al. (2020). Assessment of the expression of the immune checkpoint molecules PD-1, CTLA4, TIM-3 and LAG-3 across different cancers in relation to treatment response, tumor-infiltrating immune cells and survival. Int. J. Cancer 147, 423–439. doi:10.1002/ijc.32785
Varadi, M., Anyango, S., Deshpande, M., Nair, S., Natassia, C., Yordanova, G., et al. (2022). AlphaFold protein structure database: massively expanding the structural coverage of protein-sequence space with high-accuracy models. Nucleic Acids Res. 50, D439–D444. doi:10.1093/nar/gkab1061
Yang, J., Zhao, S., Wang, J., Sheng, Q., Liu, Q., and Shyr, Y. (2021). A pan-cancer immunogenomic atlas for immune checkpoint blockade immunotherapy. Cancer Res. 82, 539–542. doi:10.1158/0008-5472.CAN-21-2335
Keywords: biomarkers, immunotherapy, pan-cancer, polypyrimidine tract-binding proteins, prognosis
Citation: Chen C, Shang A, Gao Y, Huang J, Liu G, Cho WC and Li D (2022) PTBPs: An immunomodulatory-related prognostic biomarker in pan-cancer. Front. Mol. Biosci. 9:968458. doi: 10.3389/fmolb.2022.968458
Received: 14 June 2022; Accepted: 02 August 2022;
Published: 23 August 2022.
Edited by:
Teng Ma, Capital Medical University, ChinaReviewed by:
Fengqiang Yang, Tongji University, ChinaCopyright © 2022 Chen, Shang, Gao, Huang, Liu, Cho and Li. This is an open-access article distributed under the terms of the Creative Commons Attribution License (CC BY). The use, distribution or reproduction in other forums is permitted, provided the original author(s) and the copyright owner(s) are credited and that the original publication in this journal is cited, in accordance with accepted academic practice. No use, distribution or reproduction is permitted which does not comply with these terms.
*Correspondence: William C. Cho, Y2hvY3NAaGEub3JnLmhr; Dong Li, bGlkb25nQHRvbmdqaS5lZHUuY24=
†These authors have contributed equally to this work.
Disclaimer: All claims expressed in this article are solely those of the authors and do not necessarily represent those of their affiliated organizations, or those of the publisher, the editors and the reviewers. Any product that may be evaluated in this article or claim that may be made by its manufacturer is not guaranteed or endorsed by the publisher.
Research integrity at Frontiers
Learn more about the work of our research integrity team to safeguard the quality of each article we publish.