- 1Department of Applied Mathematics and Statistics, Stony Brook University, Stony Brook, NY, United States
- 2Mathematics, Division of Science, New York University, Abu Dhabi, United Arab Emirates
- 3Department of Materials Science and Chemical Engineering, Stony Brook University, Stony Brook, NY, United States
- 4Department of Oral Biology and Pathology, Stony Brook University, Stony Brook, NY, United States
We calculate the thermal and conformational states of the spike glycoprotein (S-protein) of SARS-CoV-2 at seven temperatures ranging from 3°C to 95°C by all-atom molecular dynamics (MD) µs-scale simulations with the objectives to understand the structural variations on the temperatures and to determine the potential phase transition while trying to correlate such findings of the S-protein with the observed properties of the SARS-CoV2. Our simulations revealed the following thermal properties of the S-protein: 1) It is structurally stable at 3°C, agreeing with observations that the virus stays active for more than two weeks in the cold supply chain; 2) Its structure varies more significantly at temperature values of 60°C–80°C; 3) The sharpest structural variations occur near 60°C, signaling a plausible critical temperature nearby; 4) The maximum deviation of the receptor-binding domain at 37°C, corroborating the anecdotal observations that the virus is most infective at 37°C; 5) The in silico data agree with reported experiments of the SARS-CoV-2 survival times from weeks to seconds by our clustering approach analysis. Our MD simulations at µs scales demonstrated the S-protein’s thermodynamics of the critical states at around 60°C, and the stable and denatured states for temperatures below and above this value, respectively.
1 Introduction
The SARS-CoV-2 engulfs the world, even in tropical countries (Sarkar et al., 2020; Tosepu et al., 2020), and it remains infectious for weeks at 3°C–4°C in the cold supply chain (Dai et al., 2020; Rizou et al., 2020). Recent studies confirmed the negative correlation between the spread of the COVID-19 and climate (Sobral et al., 2020; Tosepu et al., 2020); moreover, the instantaneous reproduction number of SARS-CoV-2 is closely related to the temperature (Rubin et al., 2020).
The biological experiments with more laboratory details verified that coronaviruses are thermolabile. For example, SARS-CoV is inactivated after 75°C heat for 15 min, and MERS becomes inactivated after 65°C heat for 1 min (Darnell et al., 2004; Leclercq et al., 2014). These impacts are also apparent in the recent laboratory studies about SARS-CoV-2. It remains infectious in aerosols at 21°C–23°C for 3–24 h (Van Doremalen et al., 2020). The SARS-CoV-2 remains active at 37°C for at least 24 h but inactive after 60°C heat for 15 min (Wang et al., 2020). When the incubation temperature reaches 70°C, the virus is inactive within 5 min (Chin et al., 2020). These confirm that SARS-CoV-2 gradually loses viability with increasing temperature. The data available for understanding is still sparse, and handling these clinical specimens poses a biosafety risk to laboratory professionals and workers (Wang et al., 2020). It is necessary to introduce more computational simulations.
Understanding the biochemical and thermolabile properties of SARS-CoV-2 requires a comprehensive understanding of the structure at the atomic level. The S-protein is one of the coronavirus’s initial and largest structural proteins (Li, 2016). The outer membrane S-protein, similar with the genome to SARS-CoV’s S-protein (Ahmed et al., 2020), is the primary host interaction protein with host cell targets such as ACE2 and is critical for cell adherence and pathogenicity (Pöhlmann et al., 2012; Heise et al., 2018). The temperature dependence of the SARS-CoV-2 characteristics, notably for S-protein, is interesting in medical prediction because ambient temperatures first alter the structure of the virus protein membrane. The S-protein has two domains: the S1 domain is on top and comprises the portion that interacts directly with host cell receptors; the S2 domain, in contrast to the S1 subunit, forms the stalk of the S-protein (de Groot et al., 1987), facilitating virion fusion with cellular membranes (Walls et al., 2020). The receptor binding domain (RBD) is responsible for binding to ACE2, which is the initial step for entry into target cells (Lan et al., 2020). In vitro binding studies confirmed that the RBD on SARS-CoV-2 binds to ACE2 with a low nano band affinity, indicating a crucial functional component in the S1 domain that induces the binding to ACE2 (Tian et al., 2020; Walls et al., 2020). The RBD of the S1 domain undergoes hinge-like conformational changes, transitioning between the closed and open state (Heise et al., 2018). The SARS-CoV-2 may withstand a higher temperature than SARS-CoV, and RBD-ACE2 binding for SARS-CoV-2 is more temperature-sensitive than SARS-CoV (He et al., 2020). MD simulations also demonstrate a temperature-dependent binding affinity of SARS-CoV-2 to the ACE2 (Zhou et al., 2021) also provided the preliminary structural states of S-protein by 200 ns at 10°C–50°C (Rath and Kumar, 2020). At the outermost of the protein, N-terminal domain (NTD) is increasingly exposed. The NTD and RBD sections are more versatile, allowing for structural adaptation to host receptors (Verkhivker, 2020). The structure and binding sites of such S-proteins are well established, while other characteristics, especially the stability under external factors, such as temperature, remain elusive. Moreover, due to the requirement to simulate over extended time scales, recent studies for the S-protein are difficult to reach to µs-scale.
The computational simulations reveal more details and track more trajectories, applying in multiple fields and works (Papaleo, 2015; Ostrowska et al., 2019; Mahmood et al., 2021; Zhang and Huang, 2021). Our work uses all-atom molecular dynamics (MD) simulation and understands its characteristics at the atomic level critically. We conduct µs-scale simulations at 3°C (of a cold supply chain), 20°C (typical room temperature), 37°C (normal human body temperature), 60°C, 70°C, 80°C, and 95°C (temperatures selected to locate the critical temperature). The simulations are long enough to collect conformational samples of the S-protein for applying statistical analysis to study the effect of virus temperature stability. The analysis is based on a variety of measurements from different perspectives, including the root-mean-square deviation (RMSD), the number of hydrogen bonds (H-bonds), the solvent-accessible surface area (SASA) of the whole protein, and the mass deviation of the RBD. We also correlate the in vitro data of the virus life scale with the conformational change of the S-protein. Additionally, the analysis of residue based root-mean-square fluctuation (RMSF) and structural divergence are performed to isolate the temperature-sensitive residues at given temperatures.
The RBD is buried and inaccessible to receptors in a close state. The open state is necessary for binding with the receptors and to be infectious (Vankadari and Wilce, 2020). The different states of S-protein RBD, including open, close, and intermediate states, give the different potential targets for vaccination and therapeutic development (Lan et al., 2020). MD modeling has been used to investigate the binding characteristics of SARS-CoV-2; however, long-timescale MD simulations to study the temperature influence on the S-protein’s closed state conformation are uncommon. The recent work focuses on the open state of S-protein and reveals the S-protein structure details effect by 0°C–60°C in 100 ns (Khan et al., 2022). Therefore, our work with longer simulations (reach 3 μs) and a wider range of temperatures (3°C–95°C) exposes the closed state of S-protein 6VXX.PDB (Walls et al., 2020) trajectory and multi-granularity analysis, providing new insights into the RBD closed state influenced by temperature.
Our simulations of µs-long atomic resolutions have demonstrated the S-protein’s conformational changes at seven well-chosen temperatures. We discovered the existence, and the possible critical temperature, of a phase transition that rives the states of infectivity and non-infectivity. The temperatures are clustered by unsupervised learning based on an in silico measurements combination, and the clustering result agrees well with published in vitro data. Finally, the spike opening, represented by the deviation of the RBD (Zimmerman and Bowman, 2021), at different temperatures are compared. The simulations in this work are conducted on the most powerful IBM supercomputers to help achieve a fast and accurate quantitative understanding of the new virus structures to complement the sparse and inconsistent in vitro experiments with high-infectious virus cultivation.
2 Methods and materials
2.1 Molecular dynamics parameters
Our MD experiments are conducted on the AiMOS supercomputer, a heterogeneous system of IBM POWER9 CPUs and Nvidia V100 GPUs. The S-protein data is obtained from the protein data bank [PDB: 6VXX (Walls et al., 2020)]. CHARMM27 is employed to describe the system of the S-protein and the SPC/E water molecules. The initial structure of the S-protein 12 nm3 × 13 nm3 × 16 nm3 was immersed in a cubic water box of 21 nm3 × 21 nm3 × 21 nm3. The periodic boundary condition is applied to all three boundaries of the water box. The total number of atoms is 8,05,218, of which 45,156 (5.6%) are for the S-protein and 7,60,047 (94.4%) for water. Simulations are performed using energy minimization by gradient optimization and the canonical (NVT) ensemble. The charge neutrally is achieved by adding 15 Na+ to the solvent to neutralize the −15 charge in protein. During the MD simulations, S-protein coordinates are recorded every 0.1 ns and finally reach 3 μs.
2.2 Data collection and analysis
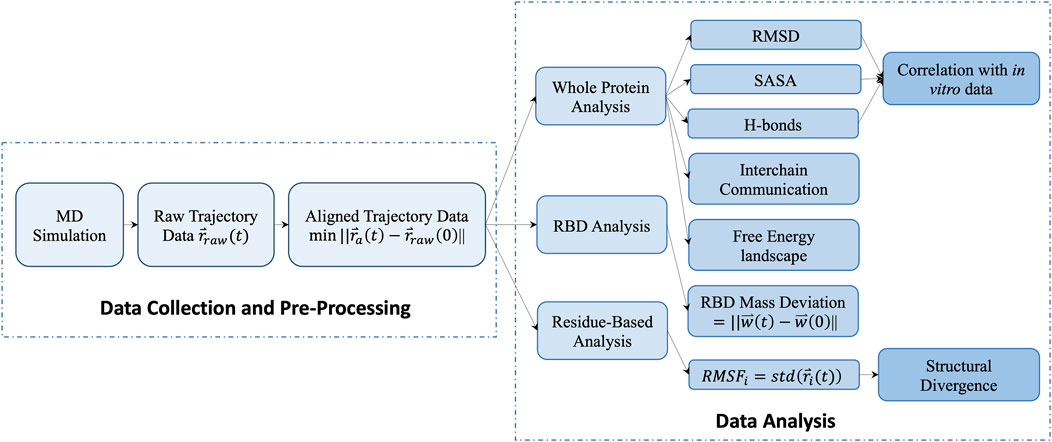
We process the raw trajectory obtained from the simulation by aligning the protein backbone in the center of box and rotating and translating the protein backbone. The processed trajectories of atomic positions support the data analysis in three-level. 1) The protein level calculation measures the S-protein’s thermal stabilities, including the backbone RMSD, the number of mainchain-mainchain (M-M) and protein-water (P-W) H-bonds, and SASA. The unsupervised learning method K-means was performed based on those measurements to cluster different temperatures into groups of viral survival durations. The interchain communication and the free energy landscape (FEL) are also considered in the protein level calculation. 2) The domain level of the RBD mass deviation was calculated to compare the spike opening between temperatures. 3) The residue level RMSF and structural divergence were applied to measure the fluctuations of individual residues and catch the culprit residue clusters. The flowchart outlines of our data analysis are shown in Figure 1.
2.2.1 Statistical analysis
To obtain a comprehensive conclusion of the temperature impact, we performed a statistical analysis based on multi-perspective measurements. The in silico data are used as inputs of an unsupervised learning method based on K-means to cluster different temperatures into four groups of viral survival durations, second, minute, day, and week-long survival durations accordingly. In this, the in silico data include the average, standard deviation, kurtosis, and skewness of RMSD, as well as the average and variation of the P-W H-bonds.
2.2.2 The free energy landscape
The FEL provides insight into the S-protein conformational changes and the thermodynamics properties of the S-protein folding process. The FEL, a measurement calculated for the protein stability level, uses the deep valley to represent the lowest energy stable states and the boundaries between deep valleys to represent the intermediate conformations (Hoang et al., 2004; Khan et al., 2020; Khan et al., 2022).
The first two principal components (PC1 and PC2) are used to calculate the FEL by:
where
2.2.3 Conformational changes of RBD analysis
The opening is quantified in terms of how far the center of mass of an RBD (Arg319-Phe541) deviates from its position in the close (or down) state (Zimmerman and Bowman, 2021). Therefore, the RBD movements is measured by
where
2.2.4 Structural divergence analysis
The RMSF measures the time averaged root mean squared fluctuation for each residue. Structural divergence, is used to measure the residue-based structure conformational changes between two comparing temperatures
where
3 Results and discussions
The average structures of S-protein within the last 0.5 μs for each temperature are shown in Figure 2. The color and thickness of the structure are scaled by the B-factor related to the mean square isotropic displacement of the residues. The residue with a high B-factor belongs to the flexible structure, while the low B-factor represents the well-ordered structure.
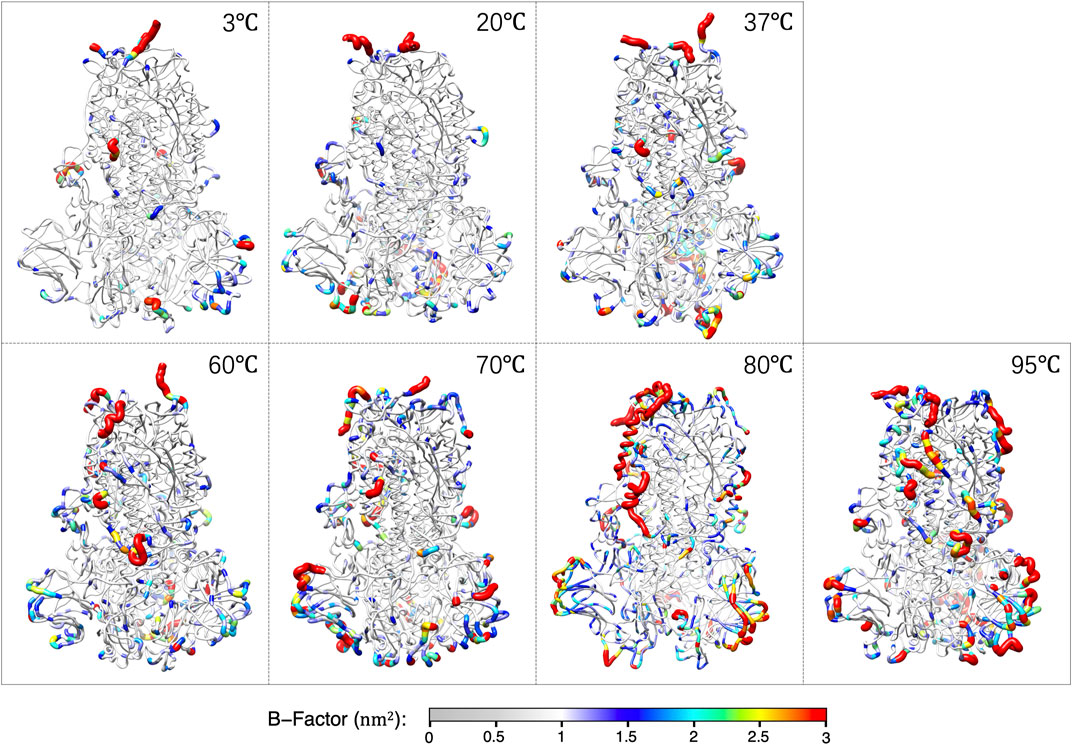
FIGURE 2. The averaged structures over the last 0.5 μs of S-protein colored by the B-factors at each temperature.
3.1 The protein based
3.1.1 The RMSD
The evolution of the protein structure was monitored along the MD trajectory by calculating the average RMSD of backbone atoms taking the initial structure as the reference frame. The RMSD moving average with 0.02 μs window size is plotted against the simulated time in Figure 3A1. The mean and standard deviation of the 1.5–3 μs RMSD is shown in Figure 3A2. The S-protein shows very stably with a small RMSD (0.37 nm) at 3°C, and the RMSD gradually increases by ∼35.1% to 0.5 nm at 20°C–60°C. The S-protein becomes more unstable, with the RMSD increasing to 0.6–0.7 nm at 70°C–95°C.
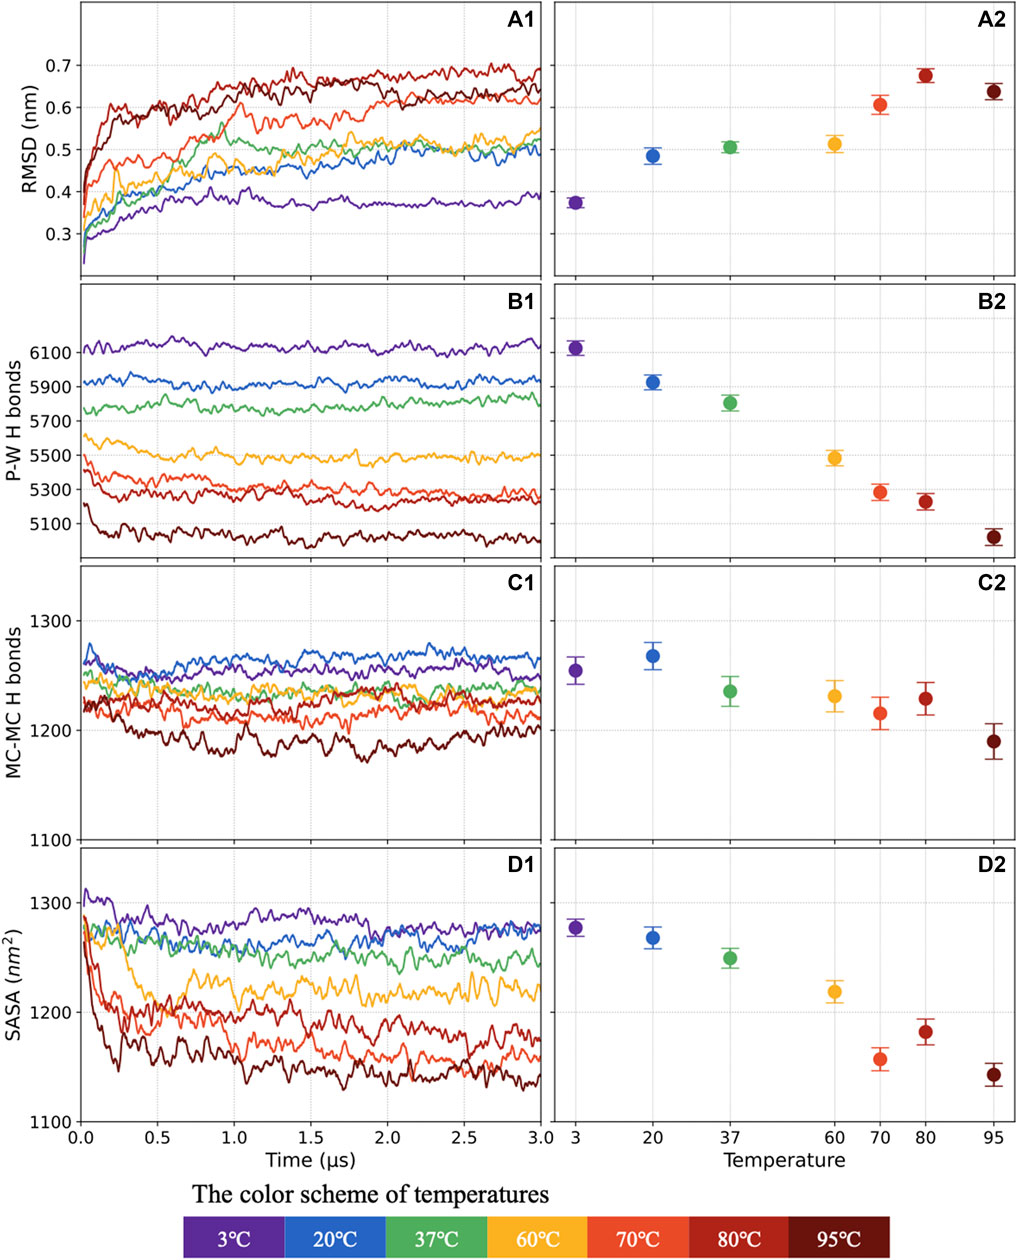
FIGURE 3. The RMSD evolving as a function of time (A1) and average distribution of the last 1.5 μs values (A2). Similar plots show the number of P-W H-bonds (B1,B2), the numbers of M-M H-bonds (C1,C2), and the SASA (D1,D2). This manuscript will keep using the color scheme for 3°C–95°C.
The S-protein could be possible to stay long-term stable at cold temperatures with lower RMSD compared with room temperature (the RMSD at 20°C is 32.4% higher than that at 3°C). The in silico result is consistent with the reported case that salmon-attached coronavirus remains infectious for more than 1 week at 4°C (Dai et al., 2020). At 4°C, the virus is still stable with only ∼0.7-log reduction with infectious titers after 14 days (Chin et al., 2020). Furthermore, the S-protein becomes more sensitive to higher temperatures after 60°C. In particular, there appears a noticeable jump at RMSD from 0.53 nm (60°C) to 0.62 nm (70°C) that may serve as a signal for the presence of a critical heat denaturation around 60°C. The laboratory results (Chin et al., 2020) also showed a similar conclusion: the viral inactivation time is greatly reduced to 5 min when the incubation temperature increase to 70°C.
3.1.2 The number of H-bonds
In general, the H-bond shows a high consistency with the system stability. A well-ordered protein structure tends to have more H-bond, and when the structure becomes active, the number of H-bond will decrease. The P-W and M-M H-bond counts versus simulation time and average distribution, including standards deviation, are presented in Figures 3B1–C2, respectively.
The average number of P-W H-bonds decreases quite linearly by 22.1%, from 6,126 to 5,021, as the temperature increases from 3°C to 95°C. However, the effect of increasing temperatures from 3°C to 80°C on the mainchain is insignificant. Compared with 1,254 M-M H-bonds at 3°C, only around 25 M-M H-bonds are broken, decreasing by 2%, at 80°C.
3.1.3 The SASA
The SASA of S-protein explores the solvent-accessible conformational change. The SASA with 0.02 μs window size moving average are plotted in Figure 3D1, and the average distribution with standards deviation are shown in Figure 3D2. The average of SASA keeps decreasing by 10% as the temperature increases from 3°C to 95°C. The SASA shows a consistent trend with the number of P-W H-bonds, revealing that access to the solvent is a precondition to forming the H-bonds between water and protein.
3.1.4 Correlating in silico measurements with virus’s survival times
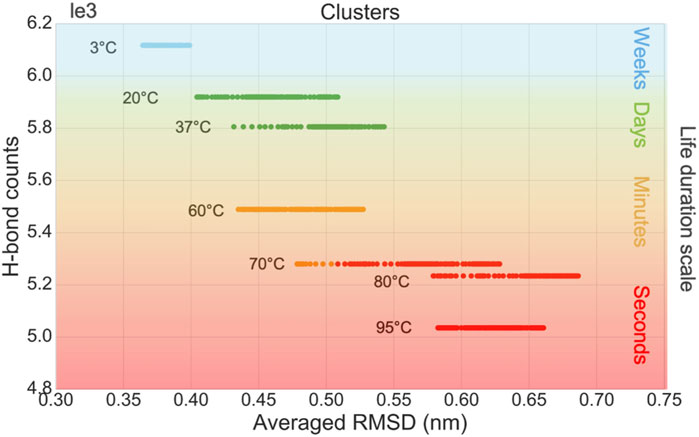
The in silico data are used as inputs of an unsupervised learning method to cluster different temperatures into different groups of viral survival durations. The samples are clustered by K-means, in terms of the virus life duration, based on six features, including the average, standard deviation, kurtosis, and skewness of RMSD, as well as the average and variation of the P-W H-bond counts. A moving window statistic is used with a window size of 100 ns and a stride size of 10 ns. To compare with in vitro data, we correlate four categories as second, minute, day, and week-long survival durations for the cluster n = 4 in the K-means method. The survival times of the virus at different incubation temperatures were reported by in vitro experiments (Chin et al., 2020). The samples are grouped into four clusters which are colored green, blue, orange, and red, shown in Figure 4 and described in Table 1.
3.1.5 The interchain communication
The interface area and the number of H-bond across the interface are calculated by PDBePISA (Krissinel and Henrick, 2007) and shown in Figure 5 to reveal the interaction between the three chains of S-protein. No significant change of S protein from 3°C to 60°C was detected in the interfacial area and interfacial H-bonds. The interfacial area and the interfacial H-bonds increase in the structurally unstable high temperatures from 70°C to 95°C (with higher RMSD and lower H-bonds). Therefore, instead of splitting the S protein, the interchain interactions will increase when the S protein begins to denature due to increased temperature.
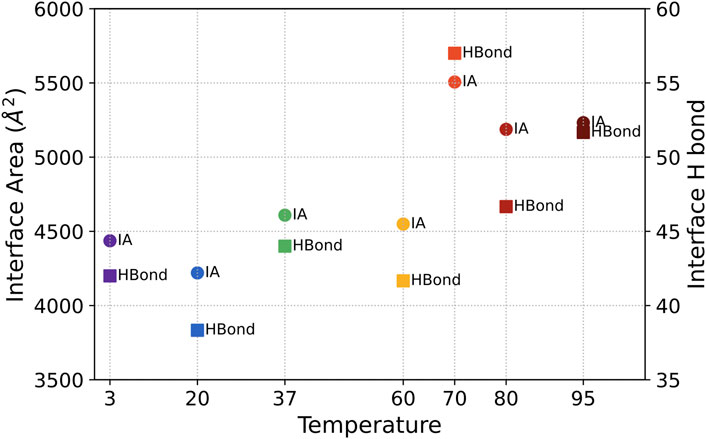
FIGURE 5. The averaged interface area (marked as IA) and the number of H-bond across the interface (marked as Hbond) between three chains for S-protein from 3°C to 95°C.
3.1.6 The free energy landscape
The FEL demonstrating the energy stability of S-proteins at 3°C–95°C is shown in Figure 6. All seven temperatures are plotted with the same color scheme, and the minimum energy area is colored blue. The 3°C shows a deep valley for global energy minima while the 80°C and 95°C reveal several different energy minima states. The global blue areas describe more global stability; however, more extra blue areas indicate more transitions in the protein conformation with the thermodynamically new favorable states. We catch the protein conformation for minimum energy area at 80°C (left) and 95°C (right) compared with the 3°C (blue) structure, with zoomed unfolding structure.
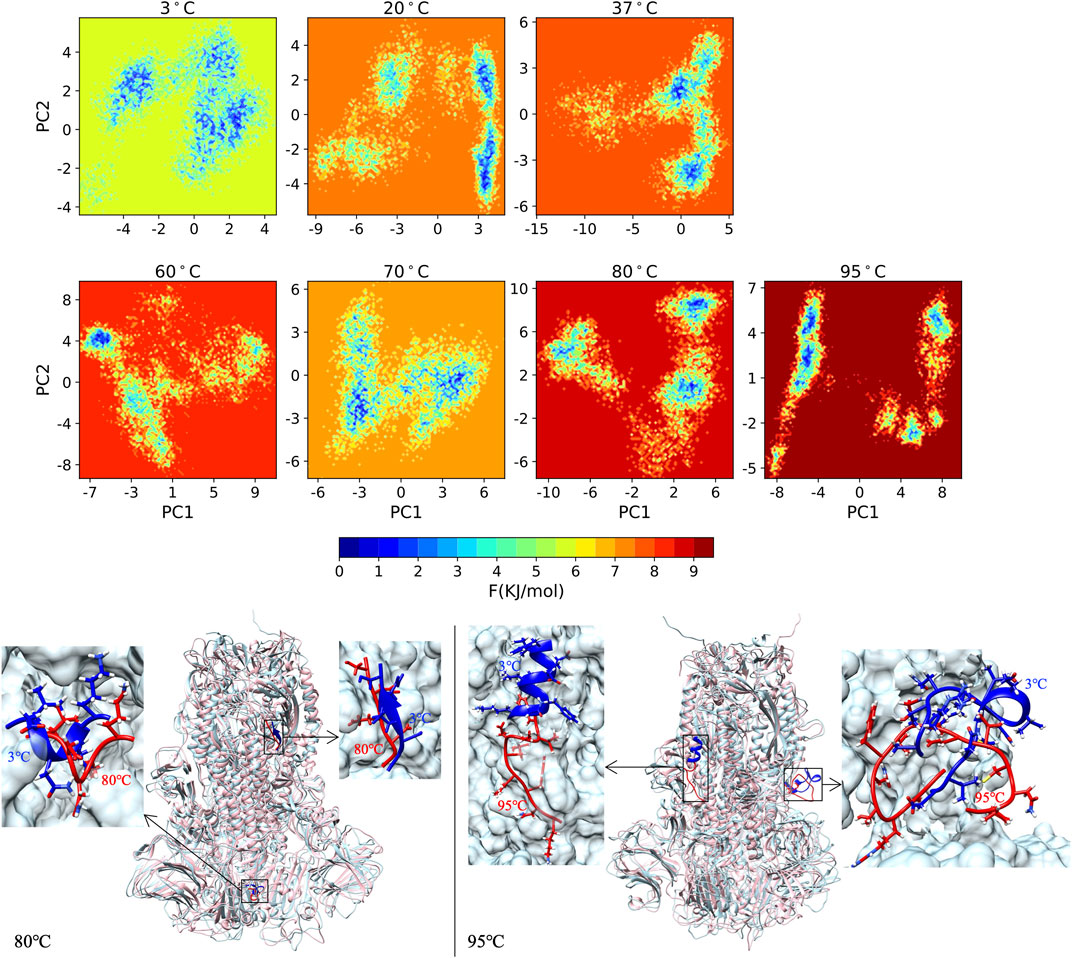
FIGURE 6. The FEL of S-protein from 3°C to 95°C with same color scale, and the protein structure for minimum energy area at 80°C (left) and 95°C (right) compared with the 3°C (blue) structure with zoomed unfolding structure.
The averaged potential energy, entropy, and isochoric molar heat capacity (
3.2 The domain-based
3.2.1 Conformational changes of RBD analysis
The distributions of the 1.5–3 μs RBD mass deviations for all three chains, marked by the colors of the curves as usual (Figure 3), are shown in Figure 7. The 37°C S-protein with a large RBD deviation trajectory is caught in the simulation and demonstrated in Figure 7.
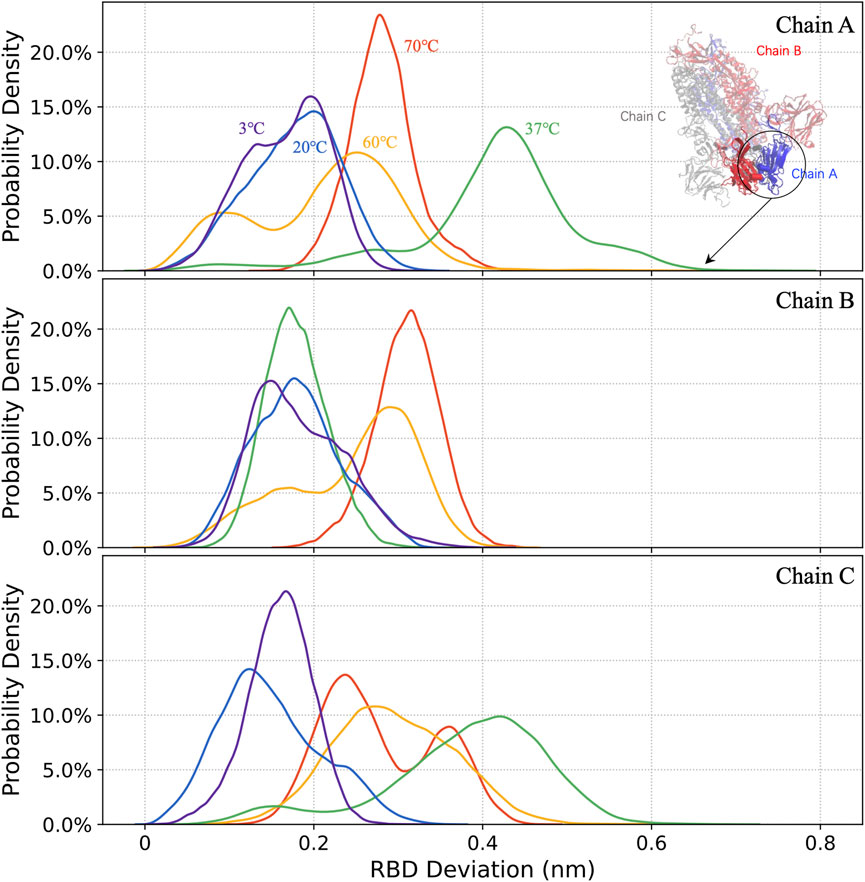
FIGURE 7. The distribution of RBD deviations in chains A, B, and C (from top to bottom) at 3°C, 20°C, 37°C, 60°C, and 70°C.
The S-protein is more likely to adopt open structures at 37°C, compared to other temperatures, with the deviation of the RBD up to 0.8 nm. For 37°C, the RBD in chain A shows an active state rather than being buried by NTD, which may provide a hint for the virus infections. At 3°C, the virus that can survive for over 2 weeks (Chin et al., 2020) is less infectious. The in silico result: at this temperature, the small RBD deviations of 0.15 nm implied that RBD became hardly accessible to receptors for most of the time.
3.3 The residue-based analysis
3.3.1 The RMSF
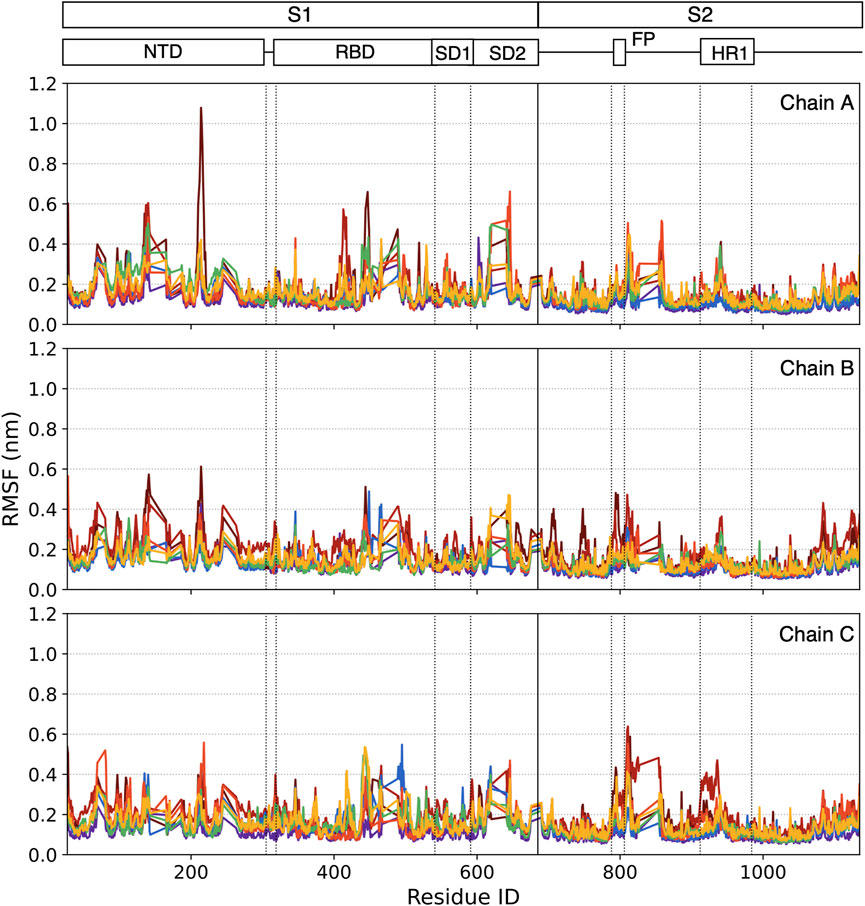
RMSF is a measurement of residue fluctuation in the S-Protein. Although most residues stay in a stable state with lower RMSF, some peak residues can be easily caught. In our case, the RMSF is calculated in the last 0.5 μs time window. In Figure 8, each point represented the RMSF of a specific residue ordered by its residue ID and colored by the color scale mentioned in Figure 3.
In the lower temperature group 3°C–20°C, no significant residue has RMSF larger than 0.5 nm. In the higher temperature group (37°C and 60°C), some individual residue RMSF reaches 0.5 nm. For 70°C, more residues have higher RMSF, especially the N643-R646 cluster in Chain A, have RMSF larger than 0.5 nm. More residue clusters are active in the very high-temperature range.
At 80°C, some residue clusters’ average RMSFs are higher than 0.5 nm, including C136-L141, G413-K417 in Chain A, and C662-I664 in Chain C. At 95°C, the RMSFs of I210-Q218 and K444-N448 in Chain A, F140-G142, and R214-D215 in Chain B, as well as A27-Y28 and S810-K814 in Chain C are larger than 0.5 nm.
3.3.2 The structural divergence
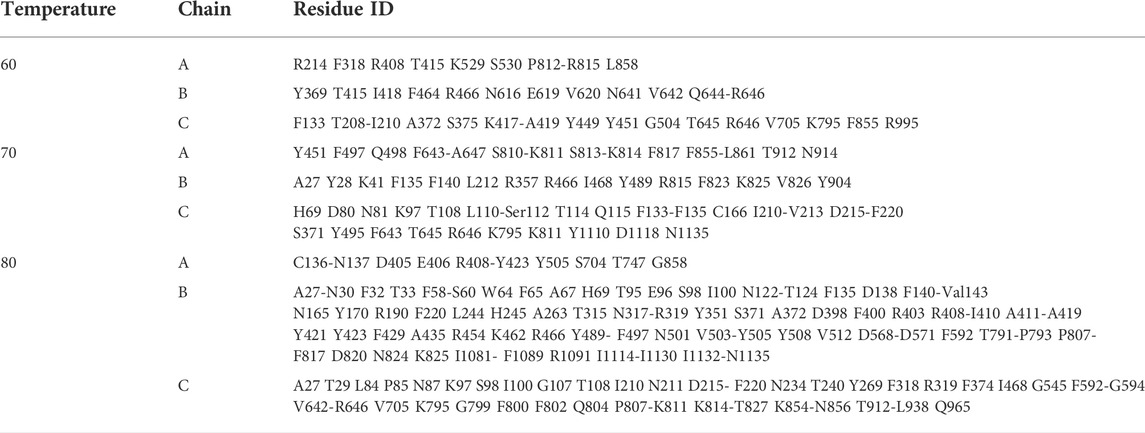
We calculate the structural divergence in the interesting temperature zone of 60°C–80°C. To spot the outliers of residues that cause significant structure divergence, we set
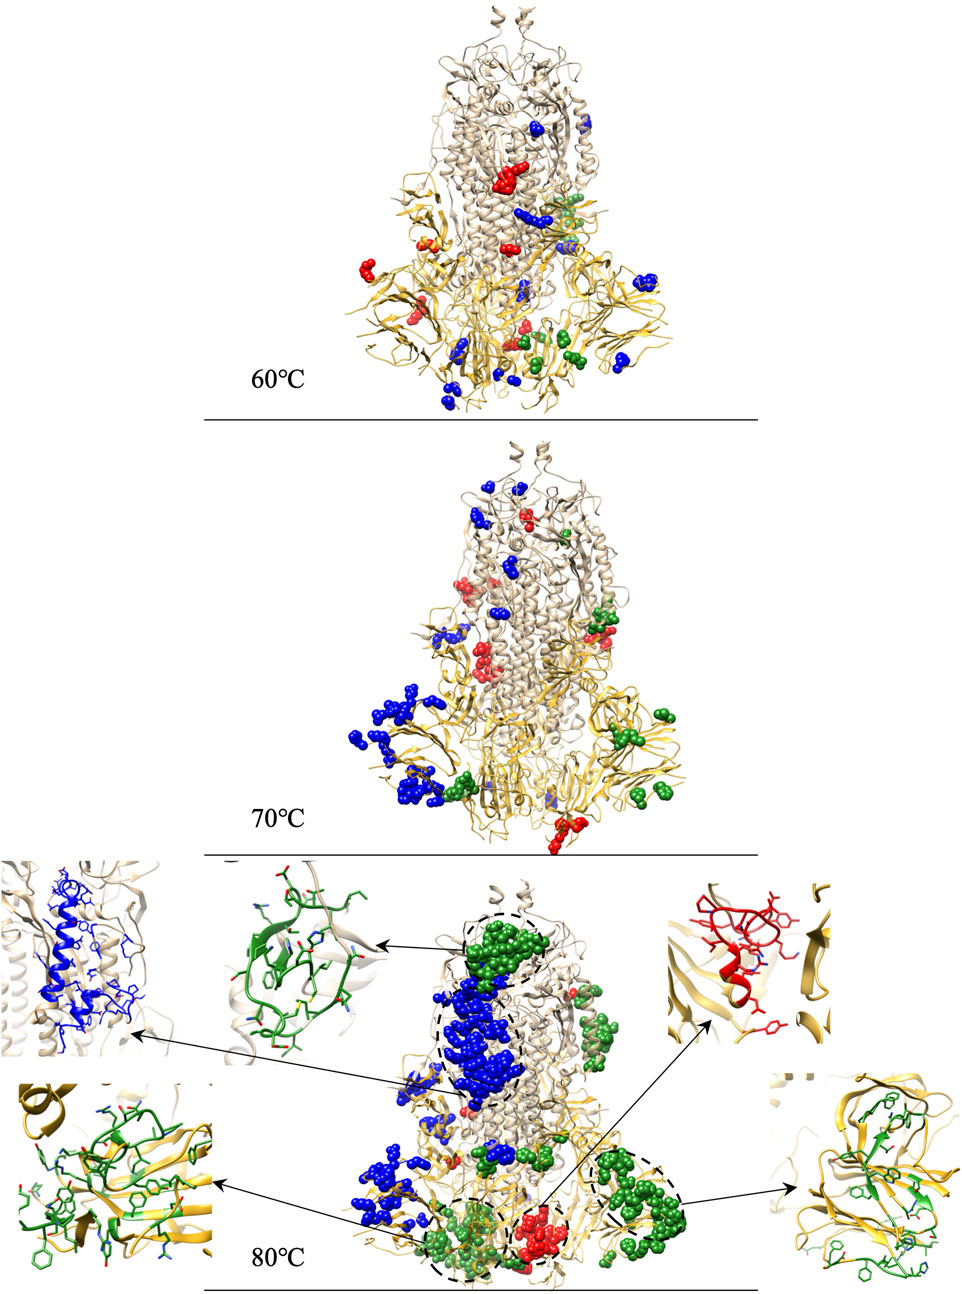
FIGURE 9. Identifications of residue outliers causing protein structure divergences and the residue outlier clusters zoomed structure for 80°C.
At 60°C (11, 13, and 18 outliers in chain A, B, and C, respectively) and 70°C (22, 15, and 34 outliers in chain A, B, and C, respectively), outliers are evenly distributed in the entire S-protein. At 80°C, among the 131 outliers in chain B, 45 are concentrated in RBD, 40 out of 45 forming a cluster zoomed in Figure 9. Moreover, 34 out of the 131 outliers in chain B are concentrated in NTD, and 33 out of 34 constitute a cluster shown in Figure 9. 51 out of 91 outliers form a cluster in chain C and are concentrated on the carbon chain of S2. We capture a large number of outliers in 80°C forming clusters considered as the culprit residues that caused 80°C RMSD higher than other temperatures.
4 Conclusion
Our simulations of µs-long atomic resolutions demonstrate the S-protein’s conformational changes affected by temperature varying and enable us to infer the existence and the possible critical temperature for the S-protein. In the whole protein-based, domain-based, and residue-based analysis, we could get: 1) The S-protein of SARS-CoV-2 is structurally stable at 3°C with the lowest RMSD, the highest number of H-bonds, and the stable RBD. Even in the residue-based analysis, no residue can be caught for large RMSF. 2) All the measurements point out a consistent signal that the heat effect difference between 60°C and 70°C is significant, especially in the RMSD gap and outlier residue clusters catch in the structure divergence analysis. 3) In extremely high temperatures (80°C and 95°C), the S-protein is most active with the highest RMSD and lowest number of H-bonds; moreover, the RMSF provides evidence for the culprit residue that leads S-protein to denature in the short-term. More detailly, in µs-scale, 80°C are broken first in the RBD, NTD, and carbon chain of the S2 domain in the structure divergence analysis.
Our in silico results could be correlated with the published in vitro results to correlate ambient temperature with the life duration and infectivity of the virus. 4) The temperatures from 3°C to 95°C are clustered into four groups by an unsupervised learning algorithm, and the clustering result agrees with in vitro viral survival time scale from weeks to seconds (Chin et al., 2020) (Figure 4). 5) The RBD mass deviation is large at 37°C while it is low at cold temperature (3°C), room temperature (20°C), and high temperatures (higher than 60°C). This indicates the S-protein is more likely to adopt an open structure at 37°C, although the life duration of the virus is shorter than it at 3°C.
For the first time, we present the µs-scale MD studies of the temperature-varying conformation of a life-threatening S-protein. Our simulations on the most powerful IBM supercomputers achieve a fast and accurate quantitative understanding of the new virus structures and corroborate well with the published in vitro experiments. Moreover, our simulations complement the effect of a wide range of temperature on closed state S-protein.
One bottleneck of the current all-atom simulation is the computing power, including computing resources and algorithms. To improve the simulation speed, a multiscale model concurrently considering components at their own characteristic scales (Zhu et al., 2021) and an intelligent time-stepping algorithm (Han et al., 2021) can effectively relieve the computing load and shorten the simulation time. Advances on machine learning based techniques also have been made towards intelligent image processing for simulation parameter determination (Zhang et al., 2021b; Sheriff et al., 2021) and dynamics prediction (Zhang et al., 2021a), which enables long-term study with affordable efforts.
Data availability statement
The original contributions presented in the study are included in the article/Supplementary Material, further inquiries can be directed to the corresponding author.
Author contributions
ZN: Setting up and performing simulations, data collection and analysis, conceptualization, writing—original draft. KH: Discussion. YD: Resources, supervision, writing—editing. ZZ: Setting up simulations. MS: Resources. MR: Resources. PZ: Data analysis, resources, supervision, writing—reviewing and editing.
Funding
The project is sponsored by Stony Brook University’s OVPR & IEDM COVID-19 Seed Grant (PI: PZ). The project is supported by the SUNY-IBM Consortium Award, PI: YD All simulations were conducted on the AiMOS supercomputer at Rensselaer Polytechnic Institute and the WSC Cluster at the IBM T. J. Watson Research Center through an IBM Faculty Award FP0002468 (PI: YD).
Conflict of interest
The authors declare that the research was conducted in the absence of any commercial or financial relationships that could be construed as a potential conflict of interest.
Publisher’s note
All claims expressed in this article are solely those of the authors and do not necessarily represent those of their affiliated organizations, or those of the publisher, the editors and the reviewers. Any product that may be evaluated in this article, or claim that may be made by its manufacturer, is not guaranteed or endorsed by the publisher.
Supplementary material
The Supplementary Material for this article can be found online at: https://www.frontiersin.org/articles/10.3389/fmolb.2022.953064/full#supplementary-material
References
Ahmed, S. F., Quadeer, A. A., and McKay, M. R. (2020). Preliminary identification of potential vaccine targets for the COVID-19 coronavirus (SARS-CoV-2) based on SARS-CoV immunological studies. Viruses 12 (3), 254. doi:10.3390/v12030254
Chin, A. W., Chu, J. T., Perera, M. R., Hui, K. P., Yen, H.-L., Chan, M. C., et al. (2020). Stability of SARS-CoV-2 in different environmental conditions - authors' reply. Lancet. Microbe 1 (1), e146. doi:10.1016/S2666-5247(20)30095-1
Cui, D., Ou, S., and Patel, S. (2014). Protein‐spanning water networks and implications for prediction of protein–protein interactions mediated through hydrophobic effects. Proteins 82 (12), 3312–3326. doi:10.1002/prot.24683
Dagan, S., Hagai, T., Gavrilov, Y., Kapon, R., Levy, Y., and Reich, Z. (2013). Stabilization of a protein conferred by an increase in folded state entropy. Proc. Natl. Acad. Sci. U. S. A. 110 (26), 10628–10633. doi:10.1073/pnas.1302284110
Dai, M., Li, H., Yan, N., Huang, J., Zhao, L., Xu, S., et al. (2020). Long-term survival of salmon-attached SARS-CoV-2 at 4° C as a potential source of transmission in seafood markets. bioRxiv.
Darnell, M. E., Subbarao, K., Feinstone, S. M., and Taylor, D. R. (2004). Inactivation of the coronavirus that induces severe acute respiratory syndrome, SARS-CoV. J. Virol. Methods 121 (1), 85–91. doi:10.1016/j.jviromet.2004.06.006
de Groot, R. J., Luytjes, W., Horzinek, M. C., van der Zeijst, B. A. M., Spaan, W. J. M., and Lenstra, J. A. (1987). Evidence for a coiled-coil structure in the spike proteins of coronaviruses. J. Mol. Biol. 196 (4), 963–966. doi:10.1016/0022-2836(87)90422-0
Fitter, J. (2003). A measure of conformational entropy change during thermal protein unfolding using neutron spectroscopy. Biophys. J. 84 (6), 3924–3930. doi:10.1016/S0006-3495(03)75120-0
Han, C., Zhang, P., Bluestein, D., Cong, G., and Deng, Y. (2021). Artificial intelligence for accelerating time integrations in multiscale modeling. J. Comput. Phys. 427, 110053. doi:10.1016/j.jcp.2020.110053
He, J., Tao, H., Yan, Y., Huang, S.-Y., and Xiao, Y. (2020). Molecular mechanism of evolution and human infection with SARS-CoV-2. Viruses 12 (4), E428. doi:10.3390/v12040428
Heise, M. T., Song, W., Gui, M., Wang, X., and Xiang, Y. (2018). Cryo-EM structure of the SARS coronavirus spike glycoprotein in complex with its host cell receptor ACE2. PLoS Pathog. 14 (8), e1007236. doi:10.1371/journal.ppat.1007236
Hoang, T. X., Trovato, A., Seno, F., Banavar, J. R., and Maritan, A. (2004). Geometry and symmetry presculpt the free-energy landscape of proteins. Proc. Natl. Acad. Sci. U. S. A. 101 (21), 7960–7964. doi:10.1073/pnas.0402525101
Khan, F. I., Lobb, K. A., and Lai, D. (2022). The molecular basis of the effect of temperature on the structure and function of SARS-CoV-2 spike protein. Front. Mol. Biosci. 9, 794960. doi:10.3389/fmolb.2022.794960
Khan, M. T., Ali, S., Zeb, M. T., Kaushik, A. C., Malik, S. I., and Wei, D.-Q. (2020). Gibbs free energy calculation of mutation in PncA and RpsA associated with pyrazinamide resistance. Front. Mol. Biosci. 7, 52. doi:10.3389/fmolb.2020.00052
Krissinel, E., and Henrick, K. (2007). Inference of macromolecular assemblies from crystalline state. J. Mol. Biol. 372, 774–797. doi:10.1016/j.jmb.2007.05.022
Lan, J., Ge, J., Yu, J., Shan, S., Zhou, H., Fan, S., et al. (2020). Structure of the SARS-CoV-2 spike receptor-binding domain bound to the ACE2 receptor. Nature 581 (7807), 215–220. doi:10.1038/s41586-020-2180-5
Leclercq, I., Batejat, C., Burguière, A. M., and Manuguerra, J. C. (2014). Heat inactivation of the M iddle E ast respiratory syndrome coronavirus. Influenza Other Respir. Viruses 8 (5), 585–586. doi:10.1111/irv.12261
Li, F. (2016). Structure, function, and evolution of coronavirus spike proteins. Annu. Rev. Virol. 3 (1), 237–261. doi:10.1146/annurev-virology-110615-042301
Li, J., Hou, C., Ma, X., Guo, S., Zhang, H., Shi, L., et al. (2021). Entropy-enthalpy compensations fold proteins in precise ways. Int. J. Mol. Sci. 22 (17), 9653. doi:10.3390/ijms22179653
Mahmood, M., Poma, A. B., and Okazaki, K.-i. (2021). Optimizing gō-MARTINI coarse-grained model for F-bar protein on lipid membrane. Front. Mol. Biosci. 32, 619381. doi:10.3389/fmolb.2021.619381
Ostrowska, N., Feig, M., and Trylska, J. (2019). Modeling crowded environment in molecular simulations. Front. Mol. Biosci. 86. doi:10.3389/fmolb.2019.00086
Papaleo, E. (2015). Integrating atomistic molecular dynamics simulations, experiments, and network analysis to study protein dynamics: Strength in unity. Front. Mol. Biosci. 2, 28. doi:10.3389/fmolb.2015.00028
Pöhlmann, S., Millet, J. K., Kien, F., Cheung, C.-Y., Siu, Y.-L., Chan, W.-L., et al. (2012). Ezrin interacts with the SARS coronavirus spike protein and restrains infection at the entry stage. PLoS ONE 7 (11), e49566. doi:10.1371/journal.pone.0049566
Rath, S. L., and Kumar, K. (2020). Investigation of the effect of temperature on the structure of SARS-CoV-2 spike protein by molecular dynamics simulations. Front. Mol. Biosci. 7, 583523. doi:10.3389/fmolb.2020.583523
Rizou, M., Galanakis, I. M., Aldawoud, T. M., and Galanakis, C. M. (2020). Safety of foods, food supply chain and environment within the COVID-19 pandemic. Trends Food Sci. Technol. 102, 293–299. doi:10.1016/j.tifs.2020.06.008
Rubin, D., Huang, J., Fisher, B. T., Gasparrini, A., Tam, V., Song, L., et al. (2020). Association of social distancing, population density, and temperature with the instantaneous reproduction number of SARS-CoV-2 in counties across the United States. JAMA Netw. Open 3 (7), e2016099. doi:10.1001/jamanetworkopen.2020.16099
Sarkar, K., Khajanchi, S., and Nieto, J. J. (2020). Modeling and forecasting the COVID-19 pandemic in India. Chaos Solit. Fractals 139, 110049. doi:10.1016/j.chaos.2020.110049
Sheriff, J., Wang, P., Zhang, P., Zhang, Z., Deng, Y., and Bluestein, D. (2021). In vitro measurements of shear-mediated platelet adhesion kinematics as analyzed through machine learning. Ann. Biomed. Eng. 49 (12), 3452–3464. doi:10.1007/s10439-021-02790-3
Sobral, M. F. F., Duarte, G. B., da Penha Sobral, A. I. G., Marinho, M. L. M., and de Souza Melo, A. (2020). Association between climate variables and global transmission oF SARS-CoV-2. Sci. Total Environ. 729, 138997. doi:10.1016/j.scitotenv.2020.138997
Tian, X., Li, C., Huang, A., Xia, S., Lu, S., Shi, Z., et al. (2020). Potent binding of 2019 novel coronavirus spike protein by a SARS coronavirus-specific human monoclonal antibody. Emerg. Microbes Infect. 9 (1), 382–385. doi:10.1080/22221751.2020.1729069
Tosepu, R., Gunawan, J., Effendy, D. S., Lestari, H., Bahar, H., Asfian, P., et al. (2020). Correlation between weather and covid-19 pandemic in jakarta, Indonesia. Sci. Total Environ. 725, 138436. doi:10.1016/j.scitotenv.2020.138436
Umirzakov, I. H. (2020). On isochoric heat capacity of fluids at high temperatures. Phys. A Stat. Mech. its Appl. 539, 122941. doi:10.1016/j.physa.2019.122941
Van Doremalen, N., Bushmaker, T., Morris, D. H., Holbrook, M. G., Gamble, A., Williamson, B. N., et al. (2020). Aerosol and surface stability of SARS-CoV-2 as compared with SARS-CoV-1. N. Engl. J. Med. 382 (16), 1564–1567. doi:10.1056/NEJMc2004973
Vankadari, N., and Wilce, J. A. (2020). Emerging WuHan (COVID-19) coronavirus: Glycan shield and structure prediction of spike glycoprotein and its interaction with human CD26. Emerg. Microbes Infect. 9 (1), 601–604. doi:10.1080/22221751.2020.1739565
Verkhivker, G. M. (2020). Molecular simulations and network modeling reveal an allosteric signaling in the SARS-CoV-2 spike proteins. J. Proteome Res. 19 (11), 4587–4608. doi:10.1021/acs.jproteome.0c00654
Walls, A. C., Park, Y.-J., Tortorici, M. A., Wall, A., McGuire, A. T., and Veesler, D. (2020). Structure, function, and antigenicity of the SARS-CoV-2 spike glycoprotein. Cell 181 (2), 281–292.e6. e286. doi:10.1016/j.cell.2020.02.058
Wang, T., Lien, C., Liu, S., and Selveraj, P. (2020). Effective heat inactivation of SARS-CoV-2. medRxiv.
Zhang, C., and Huang, J. (2021). Interactions between nucleosomes: From atomistic simulation to polymer model. Front. Mol. Biosci. 8, 624679. doi:10.3389/fmolb.2021.624679
Zhang, Z., Zhang, P., Han, C., Cong, G., Yang, C. C., and Deng, Y. (2021a). Online machine learning for accelerating molecular dynamics modeling of cells. Front. Mol. Biosci. 8, 812248. doi:10.3389/fmolb.2021.812248
Zhang, Z., Zhang, P., Wang, P., Sheriff, J., Bluestein, D., and Deng, Y. (2021b). Rapid analysis of streaming platelet images by semi-unsupervised learning. Comput. Med. Imaging Graph. 89, 101895. doi:10.1016/j.compmedimag.2021.101895
Zhou, Z., Yang, Z., Ou, J., Zhang, H., Zhang, Q., Dong, M., et al. (2021). Temperature dependence of the SARS-CoV-2 affinity to human ACE2 determines COVID-19 progression and clinical outcome. Comput. Struct. Biotechnol. J. 19, 161–167. doi:10.1016/j.csbj.2020.12.005
Zhu, Y., Zhang, P., Han, C., Cong, G., and Deng, Y. (2021). Enabling AI-accelerated multiscale modeling of thrombogenesis at millisecond and molecular resolutions on supercomputers. Int. Conf. High Perform. Comput. 12728, 237–254. doi:10.1007/978-3-030-78713-4_13
Keywords: SARS-CoV-2, S-protein, molecular dynamics, thermodynamics, conformational state
Citation: Niu Z, Hasegawa K, Deng Y, Zhang Z, Rafailovich M, Simon M and Zhang P (2022) Modeling of the thermal properties of SARS-CoV-2 S-protein. Front. Mol. Biosci. 9:953064. doi: 10.3389/fmolb.2022.953064
Received: 25 May 2022; Accepted: 26 July 2022;
Published: 27 September 2022.
Edited by:
Peng Tao, Southern Methodist University, United StatesReviewed by:
Luisa Di Paola, Campus Bio-Medico University, ItalyFaizul Azam, Qassim University, Saudi Arabia
Copyright © 2022 Niu, Hasegawa, Deng, Zhang, Rafailovich, Simon and Zhang. This is an open-access article distributed under the terms of the Creative Commons Attribution License (CC BY). The use, distribution or reproduction in other forums is permitted, provided the original author(s) and the copyright owner(s) are credited and that the original publication in this journal is cited, in accordance with accepted academic practice. No use, distribution or reproduction is permitted which does not comply with these terms.
*Correspondence: Peng Zhang, cGVuZy56aGFuZ0BzdG9ueWJyb29rLmVkdQ==
 Ziyuan Niu
 Karin Hasegawa1
 Yuefan Deng
 Ziji Zhang
 Marcia Simon
 Peng Zhang