 Shan Gao
 Xiangrui Zeng
 Min Xu
 Fa Zhang
- 1High Performance Computer Research Center, Institute of Computing Technology, Chinese Academy of Sciences, Beijing, China
- 2University of Chinese Academy of Sciences, Beijing, China
- 3Computational Biology Department, School of Computer Science, Carnegie Mellon University, Pittsburgh, PA, United States
Cryo-electron tomography (Cryo-ET) is an emerging technology for three-dimensional (3D) visualization of macromolecular structures in the near-native state. To recover structures of macromolecules, millions of diverse macromolecules captured in tomograms should be accurately classified into structurally homogeneous subsets. Although existing supervised deep learning–based methods have improved classification accuracy, such trained models have limited ability to classify novel macromolecules that are unseen in the training stage. To adapt the trained model to the macromolecule classification of a novel class, massive labeled macromolecules of the novel class are needed. However, data labeling is very time-consuming and labor-intensive. In this work, we propose a novel few-shot learning method for the classification of novel macromolecules (named FSCC). A two-stage training strategy is designed in FSCC to enhance the generalization ability of the model to novel macromolecules. First, FSCC uses contrastive learning to pre-train the model on a sufficient number of labeled macromolecules. Second, FSCC uses distribution calibration to re-train the classifier, enabling the model to classify macromolecules of novel classes (unseen class in the pre-training). Distribution calibration transfers learned knowledge in the pre-training stage to novel macromolecules with limited labeled macromolecules of novel class. Experiments were performed on both synthetic and real datasets. On the synthetic datasets, compared with the state-of-the-art (SOTA) method based on supervised deep learning, FSCC achieves competitive performance. To achieve such performance, FSCC only needs five labeled macromolecules per novel class. However, the SOTA method needs 1100 ∼ 1500 labeled macromolecules per novel class. On the real datasets, FSCC improves the accuracy by 5% ∼ 16% when compared to the baseline model. These demonstrate good generalization ability of contrastive learning and calibration distribution to classify novel macromolecules with very few labeled macromolecules.
1 Introduction
Biological processes in cells are dominated by complex networks of molecular assemblies and their interactions. Analyzing the native structure and spatial distribution of molecular assemblies is essential for revealing the macromolecular mechanism of cellular processes. Cryo-electron tomography (cryo-ET) is an emerging technique for three-dimensional (3D) visualization of macromolecular structures (Lučić et al., 2013; Wan and Briggs, 2016). Compared to other 3D visualization methods such as X-ray (Blanchet and Svergun, 2013), cryo-ET has the advantage of revealing the structure of macromolecular structures in a near-native state at the sub-molecular resolution. Many important native macromolecular structures have been discovered using cryo-ET, such as SARS-Cov-2 that caused the COVID-19 pandemic (Liu et al., 2020).
In principle, the cellular tomograms imaged by cryo-ET can capture millions of macromolecules with diverse structures. To recover structures of macromolecules, diverse macromolecules in tomograms should be detected (Melia and Bharat, 2018), classified (Gao et al., 2021), aligned and averaged (Zeng et al., 2021), and called subtomogram averaging (STA) (Bharat and Scheres, 2016). Macromolecule classification aims to classify diverse macromolecules into structurally homogeneous subsets accurately. The input to macromolecule classification is a subtomogram, a subvolume of the tomogram. Each subtomogram contains a complete macromolecule. The accuracy of macromolecule classification directly affects the performance of downstream tasks. Because misclassified macromolecules can introduce wrong structures, it further increases the difficulty in alignment. However, macromolecule classification remains challenging due to the low signal-to-noise ratio (SNR), a large variety of macromolecular structures, and small size of macromolecules.
One pioneering method for macromolecule classification is the template search (Yu and Frangakis, 2011). Given the template structure, this method calculates the cross-correlation coefficient between each subvolume of the tomogram and the template structure through a sliding window. When the cross-correlation coefficient is higher than a threshold, the target macromolecule is been identified. Though this method has been successfully applied to identify some large macromolecules (Böhm et al., 2000), the performance highly depends on the template structure. When the targets and template structures are from different organisms or have different conformations, these targets can be missed (Moebel et al., 2021). To avoid relying on template structures, template-free classification methods have been developed (Jonić, 2016; Xu et al., 2019; Martinez-Sanchez et al., 2020). For example, Xu et al. (Xu et al., 2019) proposed an iterative clustering process to group macromolecules that have the same macromolecular structures. Although this template-free method can classify novel macromolecules, iterative clustering in 3D is time-consuming. This makes the method only suitable for small datasets and has limited application in practical scenarios.
Recently, the SHREC contest (Gubins et al., 2020) caused a surge in supervised deep learning–based subtomogram classification methods (Himes and Zhang, 2018; Harastani and Jonic, 2021; Moebel et al., 2021; Pyle and Zanetti, 2021). For example, Xu et al. proposed the DoG-3D-CNN (Gubins et al., 2019) method to classify subtomograms after filtering image noise with a difference of Gaussian (DoG) filter (Wang et al., 2012). Considering that the subtomogram is a 3D image, to extract more features from depth dimension, Gao et al. proposed 3D-dilated-Densenet (Gao et al., 2020). 3D-dilated-Densenet improves the classification performance of macromolecules of small size. Despite improving classification accuracy and decreasing the processing time, the abovementioned supervised deep learning–based methods often have one major bottleneck: trained models have limited ability to classify novel macromolecules that are unseen in the training stage. To adapt the trained model to macromolecule classification of a novel class (unseen class in the training stage), massive labeled macromolecules of the novel class are required to retrain the model. This is inefficient and undesirable in practice tasks as labeling macromolecules is time-consuming and laborious (Oda and Kikkawa, 2013). Furthermore, due to complicated structures and distortion caused by missing wedge and noise, it is hard to label macromolecules with naked eyes even by experts.
In this study, we propose a novel few-shot learning method for macromolecule classification of novel classes (named FSCC) (Figure 1). Combined with contrastive learning and distribution calibration, a two-stage training strategy is designed in FSCC to enhance the generalization ability of the model to novel macromolecules. First, FSCC uses contrastive learning (Khosla et al., 2020) to pre-train the model on a sufficient number of labeled macromolecules. This comes from the intuition that good generalization requires capturing the similarity between subtomograms in the same class and contrasting them with subtomograms in other classes. With contrastive learning, FSCC can pull together macromolecules belonging to the same class in the embedding space and separate macromolecules from different classes. Second, FSCC retrains the model to classify novel macromolecules. Specifically, FSCC freezes the parameters of the feature extractor of the pre-trained model. Then, based on distribution calibration (Yang et al., 2021b), FSCC retrains the classifier with a limited number of labeled macromolecules from novel classes. Distribution calibration is a kind of domain adaption method (Sun and Saenko, 2016). It can bridge the distribution gap between the source domain and target domain. Distribution calibration has been widely applied in high-level computer vision tasks such as object detection (Saito et al., 2019) and image retrieval (Su et al., 2019). In FSCC, the data distribution learned from a few macromolecules can be a biased distribution, which leads the model to become overfitted, whereas in the first pre-train stage, the data distribution learned from sufficient macromolecules is more accurate, which can alleviate such an overfitting problem. Thus, FSCC calibrates the distribution of the novel class by transferring the distribution statistics from the class with a sufficient number of macromolecules. After distribution calibration, FSCC samples an adequate number of features from the calibrated distribution to augment the inputs to the classifier.
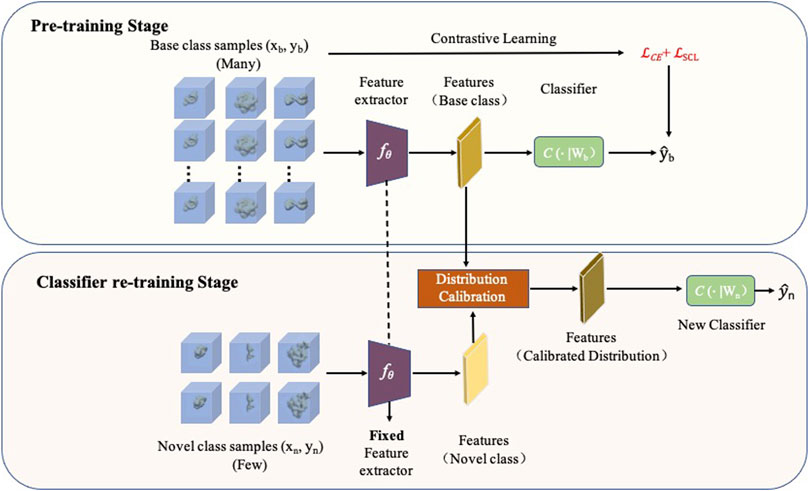
FIGURE 1. Framework of FSCC. FSCC follows a two-stage training strategy. The first training stage is a pre-training stage. FSCC pre-trains the model on a sufficient number of labeled macromolecules of base classes by contrastive learning. The second training stage is a classifier re-training stage. Here, FSCC re-trains the classifier with very few labeled macromolecules of novel class. To augment the inputs of the classifier, FSCC calibrates the distribution of novel classes and samples adequate features from calibrated distribution to re-train the classifier.
To demonstrate the performance of FSCC, we tested FSCC on synthetic and real datasets. The results show that different from existing supervised deep learning–based macromolecule classification methods, FSCC has good generalization ability to novel macromolecules. FSCC can accurately classify novel macromolecules with very few labeled macromolecules. On synthetic datasets, FSCC achieves competitive performance when compared to the state-of-the-art (SOTA) method based on supervised deep learning. Specifically, on the synthetic dataset SHREC21, the F1-score of FSCC is 0.75, while the F1-score of SOTA is 0.73. To achieve such performance, FSCC uses only five labeled macromolecules per novel class. However, the SOTA method uses 1100 ∼ 1500 labeled macromolecules per novel class. On the real datasets, FSCC improves the accuracy by 5% ∼ 16% compared to the baseline model based on two-stage training. These demonstrate the good generalization ability of contrastive learning and calibration distribution to novel macromolecules.
2 Methods
2.1 Two-Stage Training Framework
2.1.1 Problem Definition of Few-Shot Macromolecule Classification
Before introducing the framework of FSCC, we first briefly introduce the problem definition of the few-shot macromolecule classification. In the standard few-shot classification scenario (Li et al., 2021), there are two kinds of macromolecule datasets: a base dataset Dbase and a novel dataset Dnovel. Let Cbase be the set of classes covered by Dbase and let Cnovel be the set of classes covered by Dnovel, then we have Cbase⋂Cnovel = ∅. The goal of the few-shot classification method is to use a model trained on Dbase to classify novel macromolecules of Dnovel, given limited labeled macromolecules from Dnovel. Here, in one few-shot classification task, the limited labeled macromolecules are defined as the support set and the unlabeled macromolecules, which are needed to be classified and are defined as the query set. The classes of the query set and support set are the same at the one few-shot task. According to the number of classes covered by the few-shot classification task and the number of labeled macromolecules per class in the support set, the few-shot task is named N-way-K-shot tasks. N-way-K-shot means there are N novel classes, and each class has K labeled macromolecules. Generally, N is set as 5 and K is set as 1 or 5.
2.1.2 The Framework of FSCC
FSCC designs a two-stage training strategy: pre-training stage and classifier re-training stage to enhance the generalization ability of the model to novel macromolecules (Figure 1). In the pre-training stage, given a sufficient number of labeled macromolecules (xb, yb) from Dbase, where xb is a In×n×n 3D subtomogram image and yb ∈ Cbase, FSCC trains a feature extractor fθ and a classifier C(⋅∣Wb) to predict the class of macromolecules
To enable the pre-trained model to classify novel macromolecules, given a few labeled macromolecules (xn, yn) from Dnovel, FSCC freezes parameters of the feature extractor fθ and retrains the classifier C(⋅∣Wn). Training the classifier with very few labeled macromolecules is a challenge because the feature distribution learned from very few labeled macromolecules (xn, yn) can be a biased distribution (Yang et al., 2021a). This biased distribution cannot accurately reflect the ground-truth distribution of macromolecules of novel classes. Actually, the estimated distribution of the base dataset Dbase with a sufficient number of labeled macromolecules is more accurate than that of the novel dataset Dnovel with limited labeled macromolecules. Previous work has proved that semantically similar images have similar feature distributions (Burke, 2018). Thus, FSCC performs distribution calibration on extracted features of the input novel macromolecule xn with learned knowledge from the base dataset Dbase. The detailed description of distribution calibration is given in Subsection 2.3. After calibration distribution, FSCC samples adequate features from calibrated distribution to augment the input for the classifier.
2.2 Supervised Contrastive Learning
FSCC designs a weighted loss function
where λ is a weight coefficient of
Cross-entropy loss
where M is the number of input subtomograms in the mini-batch; i means the i-th macromolecule in this mini-batch; c means the class ID of base classes; yi,c denotes the ground-truth label of input subtomograms, and

FIGURE 2. Conceptualization of cross-entropy loss
Contrastive learning is one of the methods that have been widely used in self-supervised learning to enhance the generalization ability of the model recently (Jaiswal et al., 2020). The idea of contrastive learning is to find the similarities of samples of the same class by contrasting them with samples from other classes. In our task, with the label information, FSCC introduces supervised contrastive learning loss
where (xi, yi)(i = 1, 2, … , N) is the labeled macromolecules in one mini-batch;
2.3 Distribution Calibration
To apply the pre-trained model to classify novel macromolecules, we fix the parameters of the feature extractor fθ and re-train the classifier C(⋅∣Wn) with a limited number of labeled macromolecules of novel classes Cnovel. The feature distribution learned from very few labeled macromolecules can be a biased distribution, which can make the model to be overfitted (Yang et al., 2021a). Actually, as the base dataset Dbase contains a sufficient number of labeled macromolecules, the learned feature distribution of base dataset Dbase is more accurate than that of the novel dataset Dnovel. Previous works have proven that semantically similar images have similar distributions when the feature distribution follows a Gaussian distribution (Burke, 2018). Thus, to obtain a more accurate distribution of the novel dataset Dnovel, FSCC calibrates the distribution of the novel dataset Dnovel by transferring the distribution statistics of the base dataset Dbase to the novel dataset Dnovel.
The distribution calibration consists of four steps (Algorithm 1). In step 1, FSCC computes the mean and co-variance to describe the nearly-Gaussian feature distribution of each base class in Cbase. The mean μ and co-variance Σ of each base class i are defined as follows:
where vj is a feature vector of the j-th macromolecules from the base class i and ni is the total number of macromolecules in base class i.
In step 2, to make the feature distribution of the novel dataset Dnovel follow Gaussian distribution, FSCC transforms the feature vector
where λ is a hyperparameter that controls correcting the distribution. As suggested in the previous work, we set λ as 0.5 (Yang et al., 2021a).
In step 3, to search similar base classes to a novel class, FSCC computes the Euclidean metric between the transformed feature
where mink(⋅) means selecting the k minimum distance from the distance set
In step 4, with the selected nearest k base classes
Algorithm 1. The training of the classifier in FSCC.
3 Experiments and Results
3.1 Data Preparation
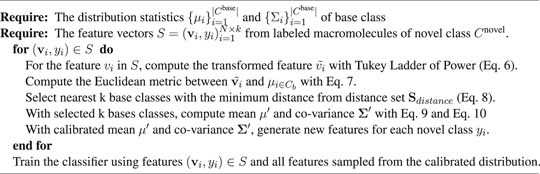
To demonstrate the effectiveness of FSCC, it was tested on synthetic datasets and real datasets. We first introduce the synthetic datasets. There are two synthetic public datasets, which were released by SHREC in 2019 and 2021 (Gubins et al., 2019). For convenience, we named these two synthetic datasets SHREC19 and SHREC21. The raw SHREC dataset contains 10 reconstructed 3D tomograms and ground-truth information that record the localization and class of each macromolecule. The size of the 3D tomogram is 512 × 512 × 512 (1 voxel equals 1 nm). It contains thousands of macromolecules that are uniformly distributed. According to the molecular weight, macromolecules are grouped into large, medium, and small sizes by SHREC (Figure 3). We extract all subtomograms from 10 tomograms based on the ground-truth information. The extracted subtomogram is at the size of 32 × 32 × 32. Figure 4 shows an example of subtomograms of SHREC data. For SHREC19, there are 12 classes of macromolecules and 20785 macromolecules. The class distribution of macromolecules is uniform. Each class contains ∼1700 macromolecules. As published by SHREC, the SNR of SHREC19 is 0.02. For SHREC21, there are 13 classes of macromolecules and 16291 macromolecules. Each class contains ∼1300 macromolecules. In the N-way-K-shot classification tasks (N is set as 5), we randomly divided the SHREC data into the base dataset Dbase and novel dataset Dnovel, with five classes of macromolecules. For SHREC19, there are seven classes of macromolecules as the base dataset Dbase. For SHREC21, there are eight classes of macromolecules as the base dataset Dbase. Both the base dataset Dbase and novel dataset Dnovel cover macromolecules of small, medium, and large sizes.
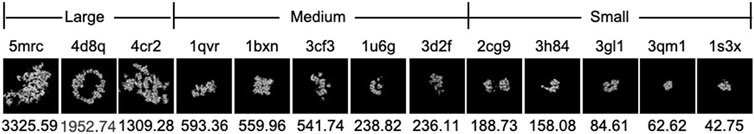
FIGURE 3. Density map and molecular weight (kDa) of each PDB ID in SHREC data. The top row is the PDB ID. The bottom row is the molecular weight (kDa). From left to right, the molecular weight of PDB decreases.
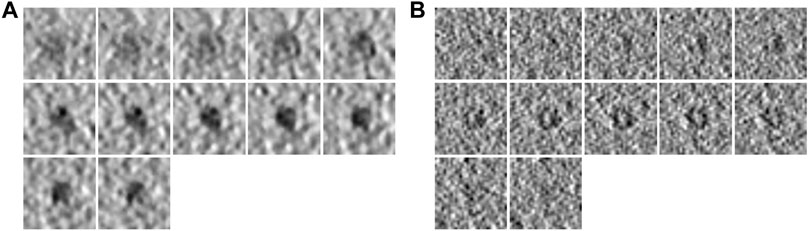
FIGURE 4. Example subtomograms of SHREC data. (A) Consecutive slices of a subtomogram of PDB ID 1bxn in SHREC19. (B) Consecutive slices of a subtomogram of PDB ID 1bxn in SHREC21.
There are two real datasets in our work (Table 1). One real dataset covers seven classes of macromolecular structures published by Gao et al. (2020). For convenience, we name this dataset Dataset1. In Dataset1, there are 400 macromolecules, and each is reconstructed from the 2D tilt series with a size of 28 × 28 × 28. Another real dataset is generated by Guo et al. (2018). For convenience, we name this dataset Dataset2. Dataset2 covers five classes of macromolecular structures. Each class contains 200 macromolecules (28 × 28 × 28). As the real datasets contain a limited number of classes, the base dataset Dbase only contains a few class number of macromolecules if we set the number of novel classes (N) as 5 in the few-shot classification task. Thus, instead of setting N to 5 as in the synthetic dataset, we equally divide the classes of the real dataset into base class Dbase and novel class Dnovel. For Dataset1, we randomly split the dataset into the base dataset Dbase with four classes of macromolecular structures and the novel dataset Dnovel with three classes of macromolecules. For Dataset2, we randomly split the dataset into the base dataset Dbase with three classes of macromolecular structures and the novel dataset Dnovel with two classes of macromolecules.
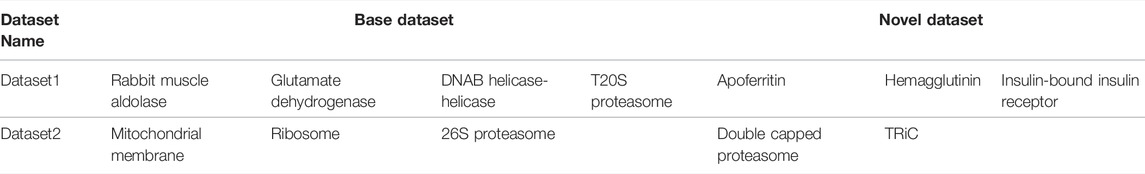
TABLE 1. Macromolecular structures covered in real datasets. The first line shows the macromolecular structures in Dataset1. The second line macromolecular structures in Dataset2.
3.2 Implementation Details
The architecture of FSCC is named as Conv-6 (Figure 5). The input of Conv-6 is a 3d subtomogram xi, and the output is the class ID
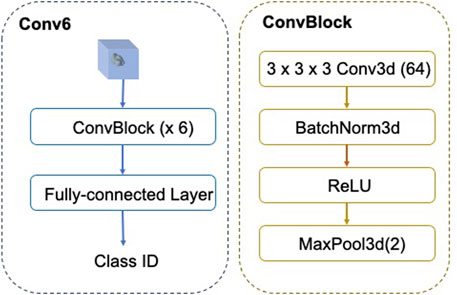
FIGURE 5. Architecture of FSCC Conv-6. In Conv-6, the feature extractor fθ comprises six ConvBlocks and the classifier is the fully connected layer.
3.3 Results on Synthetic Data
3.3.1 The Classification Results on Synthetic Datasets
Here, we show the classification performance of FSCC on the synthetic datasets (Table 2). We tested FSCC and two popular fine-tuning–based methods on the few-shot classification task with SHREC19 and SHREC21. These two methods are named Baseline (Chen et al., 2019) and Baseline++ (Chen et al., 2019) in the original. Baseline and Baseline++ use the same architecture network (Figure 5) as the FSCC and adopt a two-stage training strategy. Baseline is a standard fine-tuning method. Baseline++ is the same as the original Baseline, except for the training of the classifier. Baseline++ trains the classifier base on cosine distance similarity to explicitly reduce intra-class variations. The pre-training strategy of Baseline and Baseline++ is the same as that of FSCC. In the fine-tuning stage, Baseline and Baseline++ re-train the classifier with 10 epochs. In each epoch, Baseline and Baseline++ randomly sample N × K labeled macromolecules to re-train the classifier. Thus, Baseline and Baseline++ methods use 10 × K labeled macromolecules of novel macromolecules per class. Concretely, Baseline and Baseline++ use 50 labeled macromolecules per class when adapting the model to 5-way-5-shot classification tasks of novel macromolecules and 10 labeled macromolecules per class when adapting the model to 5-way-1-shot tasks of novel macromolecules. In contrast to Baseline and Baseline++ methods, FSCC can re-train the classifier in one few-shot classification task. This means FSCC only needs five labeled macromolecules on 5-way-5-shot classification tasks of novel macromolecules and one labeled sample on the 5-way-1-shot classification tasks. In Table 2, we report the classification performance and the number of labeled macromolecules of each novel class that are needed in the fine-tuning stage. The classification performance is demonstrated by the mean and variance of classification accuracy (Eq. (12)) on 100 few-shot classification tasks. The number of labeled macromolecules is shown in parentheses after the classification accuracy. Due to the 5-way-5-shot task providing more labeled macromolecules than that of the 5-way-1-shot task, the classification performance of FSCC on the 5-way-5-shot task is higher than that of the 5-way-1-shot task. Compared with Baseline and Baseline++ methods, on SHREC19, our method improves the accuracy by 3.86% when there are five labeled macromolecules per class and 5.44% when there is one labeled sample per class. On SHREC21, our method improves the accuracy by 4.71% when there are five labeled macromolecules per class and 9.09% when there is one labeled sample per class.
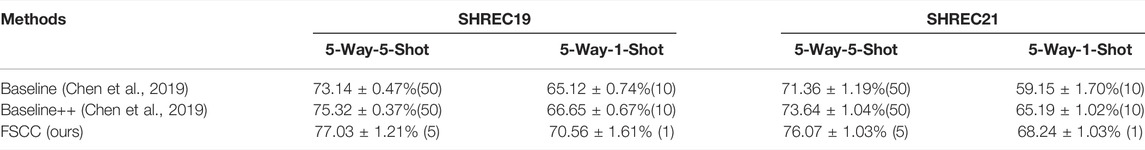
TABLE 2. Classification performance of FSCC and SOTA methods on the synthetic dataset. The classification performance is measured by classification accuracy, followed by the number of labeled training macromolecules in parentheses.
We also compared FSCC with the state-of-the-art (SOTA) performance of supervised deep learning–based methods on SHREC19 and SHREC21. Table 3 shows the F1-score (Eq. (11)) and the number of labeled training macromolecules for each class of macromolecules of FSCC and SOTA. From the average F1 score, we can see that FSCC can achieve the classification performance of SOTA methods with five labeled macromolecules per novel class. However, the SOTA method uses a significantly larger number of 1100 ∼ 1500 labeled macromolecules per novel class. It is worth emphasizing that the SOTA results are published by the SHREC contest. SHREC publics the F1-score of each macromolecule of many popular supervised deep learning–based methods. Here, the SHREC–SOTA means the highest F1 score of each class of macromolecule. Thus, SHREC–SOTA comes from different supervised deep learning–based methods. For most methods, there has been no access to source code or pretrained models. Table 3 only reports the performance of macromolecular structures from novel class Cnovel. In SHREC19 and SHREC21, the PDB ID of macromolecules in the novel class is 1u6g, 3cf3, 3gl1, 3qm1, 4d8q, and 4v49. 4d8q is only covered in SHREC19, and 4v49 is only covered in SHREC21. According to the molecular weight, 3g1 and 3qm1 are macromolecules of small size, 1u6g and 3cf3 are macromolecules of medium size, and 4d8q and 4v4g are macromolecules of large size. The result shows that for both methods, macromolecules of large size are easy to be classified. When the size decreases, the classification accuracy also decreases. The SHREC contest contains localization and classification tasks. In SHREC19, SOTA methods first localized the macromolecules and then classified them. Thus, the macromolecules may not be in the center of the input subtomograms. This makes sense that FSCC has higher classification accuracy because the input subtomograms are extracted according to the ground-truth localization. In SHREC21, SOTA methods adopt the end-to-end pixel classification–based model to obtain the class of macromolecular structures. For macromolecules of large size, the classification accuracy of FSCC is close to SOTA methods. Even for macromolecules of small size such as 3qm1, FSCC improves the classification performance by 0.31. This is because FSCC classifies novel macromolecules according to the statistic of macromolecules of the base class. In the base dataset, 1s3x is similar to 3qm1. Thus, the feature vectors of 1s3x are similar to those of 3qm1, which leads FSCC to classify 3qm1 with higher accuracy than SOTA.

TABLE 3. Classification performance of FSCC and SOTA methods on the synthetic dataset. The classification performance is measured by the F1 score, followed by the number of labeled training macromolecules in parentheses.
3.3.2 Ablation Studies
FSCC contains two key components: contrastive learning (Subsection 2.2) and distribution calibration (Subsection 2.3). Here, we performed an ablation study on SHREC19 to explore the contribution of each key component. In Table 4, there are four CNN models tested in the ablation study. First, we tested the base CNN model (Baseline) without contrastive learning and distribution calibration. Second, we added distribution calibration to the Baseline to test the contribution of distributed calibration. Third, we added contrastive learning to the Baseline to test the contribution of contrastive learning. Compared to Baseline, distribution calibration improves by 5.65% on 5-way-1-shot classification tasks. The aim of the distribution calibration is to calibrate the biased distribution learned from very few labeled macromolecules of novel class. Therefore, in the case of fewer labeled macromolecules, it is reasonable that the distribution calibration can more significantly improve the accuracy of image classification. The last model is our FSCC model. These results show the contribution of contrastive learning and distribution calibration to the few-shot macromolecule classification.

TABLE 4. Ablation study on 5-way-5-shot and 5-way-1-shot classification tasks with SHREC19.
In FSCC, we adopted cross-entropy loss and contrastive learning loss in the pre-training stage. The total loss function is shown in Eq. (1). Here, λ is a hyperparameter to control the component of supervised contrastive learning loss
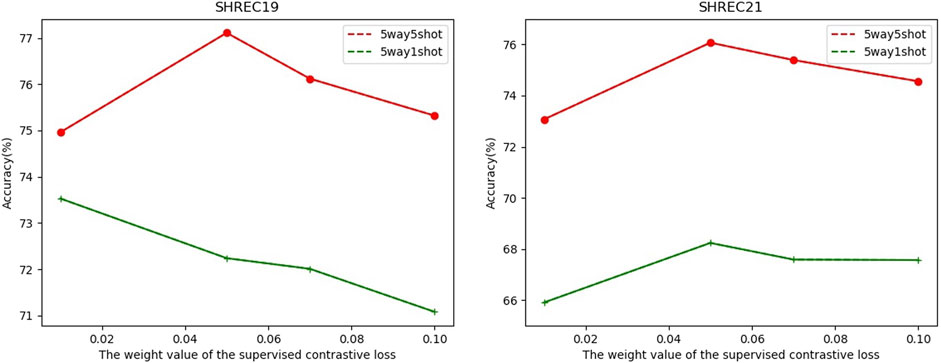
FIGURE 6. Relationship between classification accuracy with the weight value λ of the supervised contrastive loss
3.4 Results on Real Data
Here, we tested FSCC on two real datasets. Table 5 shows the classification performance and training macromolecules of FSCC and baseline models (Baseline and Baseline++) on Dataset1 and Dataset2. The classification performance is represented by the mean and variance of the classification accuracy of randomly constructed 100 few-shot classification tasks. As the real datasets only cover a few classes of macromolecular structures and hundreds of macromolecules per class, the stability of the feature extractor of all pre-trained models is poor. This results in a variance of classification accuracy greater than 1%. In addition, the insufficient labeled macromolecules of the base class lead to poor generalization ability of Baseline and Baseline++. Thus, the classification performance of Baseline and Baseline++ is poor to novel macromolecules. Compared with Baseline methods, for Dataset1, FSCC significantly improves classification accuracy by 16.84% on 3-way-1-shot classification tasks and 5.96% on 3-way-5-shot classification tasks. For Dataset2, FSCC significantly improves classification accuracy by 13.1% on 2-way-1-shot classification tasks and 7.76% on 2-way-5-shot classification tasks.
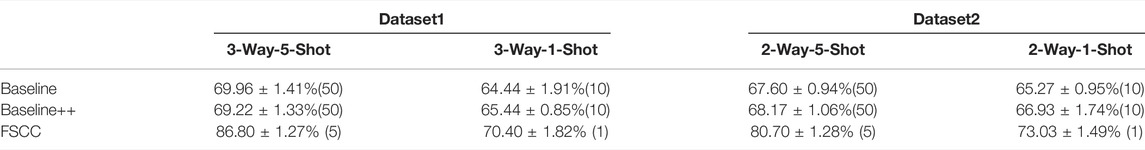
TABLE 5. Classification performance of FSCC on real datasets. The classification performance is measured by classification accuracy, followed by the number of labeled training macromolecules in parentheses.
4 Discussion and Conclusion
The classification of subtomograms is a key step to recover macromolecular structures captured by cryo-ET. Although supervised deep learning–based methods have improved the classification accuracy, they have limited ability to classify novel macromolecules. To adapt the model to a novel class of macromolecules, the trained model needed to be re-trained with massive labeled macromolecules of the novel class. However, it is inefficient and undesirable in practice as labeling the sample is time-consuming and laborious. In this work, we proposed a few-shot learning-based macromolecule classification method named FSCC. Different from the existing supervised deep learning–based methods, FSCC can classify novel macromolecules with very few labeled macromolecules. Based on a two-step training strategy, FSCC first pre-trained the model with supervised contrastive learning on the base dataset with a sufficient number of labeled macromolecules. Supervised contrastive learning can help enhance the generalization ability and stability of the model. Then, FSCC re-trains the classifier with distribution calibration to enable the model to classify novel macromolecules. The results on synthetic datasets demonstrate that compared to SOTA of supervised deep learning–based methods, FSCC can achieve competitive performance given only five labeled macromolecules per novel class. However, the SOTA method needs 1100 ∼ 1500 labeled training macromolecules per novel class. On the synthetic dataset SHREC19 (SNR = 0.02), compared to the popular fine-tuning–based few-shot classification method, FSCC improves classification accuracy by 3.89% on 5-way-5-shot tasks and by 5.44% on 5-way-1-shot tasks. On real datasets, compared to popular fine-tuning–based few-shot classification methods, FSCC improves classification accuracy by 5% ∼ 7% when there are five labeled macromolecules per class of novel macromolecules. FSCC significantly improves classification accuracy by 13% ∼ 16% when there is only one labeled sample per class of novel macromolecules.
Data Availability Statement
The original contributions presented in the study are included in the article/Supplementary Material; further inquiries can be directed to the corresponding authors.
Author Contributions
SG proposed the methods, performed and analyzed the experiments, and wrote the article. XZ collected data. MX modified the article. All authors contributed to the article and approved the submitted version.
Funding
The research is supported by the National Key Research and Development Program of China (No. 2021YFF0704300 and No. 2017YFA0504702), the Strategic Priority Research Program of the Chinese Academy of Sciences (No. XDA16021400), and the NSFC project grants (61932018, 6207244162072280, and 62072283).
Conflict of Interest
The authors declare that the research was conducted in the absence of any commercial or financial relationships that could be construed as a potential conflict of interest.
Publisher’s Note
All claims expressed in this article are solely those of the authors and do not necessarily represent those of their affiliated organizations, or those of the publisher, the editors, and the reviewers. Any product that may be evaluated in this article, or claim that may be made by its manufacturer, is not guaranteed or endorsed by the publisher.
References
Bharat, T. A. M., and Scheres, S. H. W. (2016). Resolving Macromolecular Structures from Electron Cryo-Tomography Data Using Subtomogram Averaging in Relion. Nat. Protoc. 11, 2054–2065. doi:10.1038/nprot.2016.124
Blanchet, C. E., and Svergun, D. I. (2013). Small-angle X-Ray Scattering on Biological Macromolecules and Nanocomposites in Solution. Annu. Rev. Phys. Chem. 64, 37–54. doi:10.1146/annurev-physchem-040412-110132
Böhm, J., Frangakis, A. S., Hegerl, R., Nickell, S., Typke, D., and Baumeister, W. (2000). Toward Detecting and Identifying Macromolecules in a Cellular Context: Template Matching Applied to Electron Tomograms. Proc. Natl. Acad. Sci. U.S.A. 97, 14245–14250. doi:10.1073/pnas.230282097
Burke, W. W. (2018). The Rise and Fall of the Growth of Organization Development: What Now? Consult. Psychol. J. Pract. Res. 70, 186–206. doi:10.1037/cpb0000116
Chen, W.-Y., Liu, Y.-C., Kira, Z., Wang, Y.-C. F., and Huang, J.-B. (2019). A Closer Look at Few-Shot Classification. arXiv Prepr. arXiv:1904.04232.
Gao, S., Han, R., Zeng, X., Cui, X., Liu, Z., Xu, M., et al. (2020). “Dilated-densenet for Macromolecule Classification in Cryo-Electron Tomography,” in International Symposium on Bioinformatics Research and Applications (Berlin, Germany: Springer), 82–94. doi:10.1007/978-3-030-57821-3_8
Gao, S., Han, R., Zeng, X., Liu, Z., Xu, M., and Zhang, F. (2021). Macromolecules Structural Classification with a 3d Dilated Dense Network in Cryo-Electron Tomography. IEEE/ACM Trans. Comput. Biol. Bioinforma. 19, 209–219.
Gubins, I., Chaillet, M. L., van der Schot, G., Veltkamp, R. C., Förster, F., Hao, Y., et al. (2020). Shrec 2020: Classification in Cryo-Electron Tomograms. Comput. Graph. 91, 279–289. doi:10.1016/j.cag.2020.07.010
Gubins, I., van der Schot, G., Veltkamp, R. C., Förster, F., Du, X., Zeng, X., et al. (2019). Classification in Cryo-Electron Tomograms. SHREC’19 Track.
Guo, Q., Lehmer, C., Martínez-Sánchez, A., Rudack, T., Beck, F., Hartmann, H., et al. (2018). In Situ structure of Neuronal C9orf72 Poly-ga Aggregates Reveals Proteasome Recruitment. Cell. 172, 696–705. doi:10.1016/j.cell.2017.12.030
Harastani, M., and Jonic, S. (2021). “Comparison between Hemnma-3d and Traditional Classification Techniques for Analyzing Biomolecular Continuous Shape Variability in Cryo Electron Subtomograms,” in 2021 4th International Conference on Bio-Engineering for Smart Technologies (BioSMART) (Créteil, France: IEEE), 01–04. doi:10.1109/biosmart54244.2021.9677643
Himes, B. A., and Zhang, P. (2018). Emclarity: Software for High-Resolution Cryo-Electron Tomography and Subtomogram Averaging. Nat. Methods 15, 955–961. doi:10.1038/s41592-018-0167-z
Jaiswal, A., Babu, A. R., Zadeh, M. Z., Banerjee, D., and Makedon, F. (2020). A Survey on Contrastive Self-Supervised Learning. Technologies 9, 2. doi:10.3390/technologies9010002
Jonić, S. (2016). Cryo-electron Microscopy Analysis of Structurally Heterogeneous Macromolecular Complexes. Comput. Struct. Biotechnol. J. 14, 385–390. doi:10.1016/j.csbj.2016.10.002
Khosla, P., Teterwak, P., Wang, C., Sarna, A., Tian, Y., Isola, P., et al. (2020). Supervised Contrastive Learning. Adv. Neural Inf. Process. Syst. 33, 18661–18673.
Li, X., Sun, Z., Xue, J.-H., and Ma, Z. (2021). A Concise Review of Recent Few-Shot Meta-Learning Methods. Neurocomputing 456, 463–468. doi:10.1016/j.neucom.2020.05.114
Liu, C., Mendonça, L., Yang, Y., Gao, Y., Shen, C., Liu, J., et al. (2020). The Architecture of Inactivated Sars-Cov-2 with Postfusion Spikes Revealed by Cryo-Em and Cryo-Et. Structure 28, 1218–1224. doi:10.1016/j.str.2020.10.001
Lučić, V., Rigort, A., and Baumeister, W. (2013). Cryo-electron Tomography: the Challenge of Doing Structural Biology In Situ. J. Cell. Biol. 202, 407–419.
Martinez-Sanchez, A., Kochovski, Z., Laugks, U., Meyer zum Alten Borgloh, J., Chakraborty, S., Pfeffer, S., et al. (2020). Template-free Detection and Classification of Membrane-Bound Complexes in Cryo-Electron Tomograms. Nat. Methods 17, 209–216. doi:10.1038/s41592-019-0675-5
Melia, C. E., and Bharat, T. A. M. (2018). Locating Macromolecules and Determining Structures inside Bacterial Cells Using Electron Cryotomography. Biochimica Biophysica Acta (BBA) - Proteins Proteomics 1866, 973–981. doi:10.1016/j.bbapap.2018.06.003
Moebel, E., Martinez-Sanchez, A., Lamm, L., Righetto, R. D., Wietrzynski, W., Albert, S., et al. (2021). Deep Learning Improves Macromolecule Identification in 3d Cellular Cryo-Electron Tomograms. Nat. Methods 18, 1386–1394. doi:10.1038/s41592-021-01275-4
Oda, T., and Kikkawa, M. (2013). Novel Structural Labeling Method Using Cryo-Electron Tomography and Biotin-Streptavidin System. J. Struct. Biol. 183, 305–311. doi:10.1016/j.jsb.2013.07.003
Pyle, E., and Zanetti, G. (2021). Current Data Processing Strategies for Cryo-Electron Tomography and Subtomogram Averaging. Biochem. J. 478, 1827–1845. doi:10.1042/bcj20200715
Saito, K., Ushiku, Y., Harada, T., and Saenko, K. (2019). “Strong-weak Distribution Alignment for Adaptive Object Detection,” in Proceedings of the IEEE/CVF Conference on Computer Vision and Pattern Recognition, 6956–6965. doi:10.1109/cvpr.2019.00712
Su, Y., Li, Y., Nie, W., Song, D., and Liu, A.-A. (2019). Joint Heterogeneous Feature Learning and Distribution Alignment for 2d Image-Based 3d Object Retrieval. IEEE Trans. Circuits Syst. Video Technol. 30, 3765–3776.
Sun, B., and Saenko, K. (2016). “Deep Coral: Correlation Alignment for Deep Domain Adaptation,” in European conference on computer vision (Berlin, Germany: Springer), 443–450. doi:10.1007/978-3-319-49409-8_35
Tukey, J. (1977). Addison-wesley Series in Behavioral Science: Quantitative Methods. Reading: Addison-Wesley.
Wan, W., and Briggs, J. A. G. (2016). Cryo-electron Tomography and Subtomogram Averaging. Methods Enzym. 579, 329–367. doi:10.1016/bs.mie.2016.04.014
Wang, S., Li, W., Wang, Y., Jiang, Y., Jiang, S., and Zhao, R. (2012). An Improved Difference of Gaussian Filter in Face Recognition. J. Multim. 7, 429–433. doi:10.4304/jmm.7.6.429-433
Xu, M., Singla, J., Tocheva, E. I., Chang, Y.-W., Stevens, R. C., Jensen, G. J., et al. (2019). De Novo structural Pattern Mining in Cellular Electron Cryotomograms. Structure 27, 679–691. doi:10.1016/j.str.2019.01.005
Yang, S., Liu, L., and Xu, M. (2021a). Free Lunch for Few-Shot Learning: Distribution Calibration. arXiv Prepr. arXiv:2101.06395.
Yang, S., Wu, S., Liu, T., and Xu, M. (2021b). “Bridging the Gap between Few-Shot and Many-Shot Learning via Distribution Calibration,” in IEEE Transactions on Pattern Analysis and Machine Intelligence. doi:10.1109/tpami.2021.3132021
Yu, Z., and Frangakis, A. S. (2011). Classification of Electron Sub-tomograms with Neural Networks and its Application to Template-Matching. J. Struct. Biol. 174, 494–504. doi:10.1016/j.jsb.2011.02.009
Zeng, Y., Howe, G., Yi, K., Zeng, X., Zhang, J., Chang, Y.-W., et al. (2021). “Unsupervised Domain Alignment Based Open Set Structural Recognition of Macromolecules Captured by Cryo-Electron Tomography,” in 2021 IEEE International Conference on Image Processing (ICIP) (Anchorage, AK, USA: IEEE), 106–110. doi:10.1109/icip42928.2021.9506205
Keywords: few-shot learning, cryo-ET, macromolecule classification, contrastive learning, distribution calibration
Citation: Gao S, Zeng X, Xu M and Zhang F (2022) FSCC: Few-Shot Learning for Macromolecule Classification Based on Contrastive Learning and Distribution Calibration in Cryo-Electron Tomography. Front. Mol. Biosci. 9:931949. doi: 10.3389/fmolb.2022.931949
Received: 29 April 2022; Accepted: 23 23 May 20222022;
Published: 05 July 2022.
Edited by:
William C. Cho, QEH, Hong Kong SAR, ChinaReviewed by:
JJ Fernandez, Spanish National Research Council (CSIC), SpainYonggang Lu, Lanzhou University, China
Copyright © 2022 Gao, Zeng, Xu and Zhang. This is an open-access article distributed under the terms of the Creative Commons Attribution License (CC BY). The use, distribution or reproduction in other forums is permitted, provided the original author(s) and the copyright owner(s) are credited and that the original publication in this journal is cited, in accordance with accepted academic practice. No use, distribution or reproduction is permitted which does not comply with these terms.
*Correspondence: Min Xu, bXh1MUBjcy5jbXUuZWR1; Fa Zhang, emhhbmdmYUBpY3QuYWMuY24=