 Jiaxiu Ma
 Jiapei Jin
- The Key Laboratory of Molecular Biology of Infectious Diseases Designated By the Chinese Ministry of Education, Chongqing Medical University, Chongqing, China
Background: Hepatocellular carcinoma (HCC) represents a global health challenge. Effective biomarkers are required for an early diagnosis to improve the survival rates of HCC patients. Exonuclease 1 (EXO1) plays a significant role in the DNA repair and recombination mechanisms. This study aimed to investigate the diagnostic and prognostic roles of EXO1 in HCC.
Methods: We analyzed the EXO1 expression levels in various cancers including HCC from The Cancer Genome Atlas (TCGA) and Gene Expression Omnibus (GEO) databases. RNA sequencing data were analyzed using the R packages to determine differentially expressed genes (DEGs) between high- and low-EXO1 expressing HCC tissues from the TCGA–LIHC database. A Spearman’s correlation analysis was performed to determine the association between EXO1 expression and immune cell infiltration, and immune checkpoint genes and TP53. MethSurv and CBioPortal databases were used to evaluate the DNA methylation changes and genetic alterations in the EXO1 gene. A logistic regression analysis was performed to determine the association between EXO1 expression and the clinicopathological characteristics of the HCC patients. The diagnostic and prognostic predictive values of EXO1 were evaluated using the Kaplan–Meier (K-M) survival curves, diagnostic receiver operating characteristic (ROC) curves, nomogram model, and Cox regression analysis.
Results: EXO1 expression levels were significantly higher in the tumor tissues and serums of HCC patients compared to the corresponding controls. The DEGs associated with EXO1 were significantly enriched in the cell proliferation pathways. EXO1 expression levels significantly correlated with immune cell infiltration, immune checkpoint genes, and TP53 in the HCC tissues. The DNA methylation status in five CpG islands of the EXO1 gene was associated with the prognosis of HCC. EXO1 expression levels in the HCC tissues were associated with the tumor grades, alpha-fetoprotein (AFP) levels, and the tumor stages. Cox regression analysis showed that EXO1 was a potential independent risk factor for the overall survival (OS) and disease-specific survival (DSS) of HCC patients. ROC curve analysis showed that EXO1 expression levels accurately distinguished HCC tissues from the adjacent normal liver tissues.
Conclusion: Our study demonstrated that EXO1 was a potential diagnostic and prognostic biomarker, and a promising therapeutic target in HCC.
Introduction
Liver cancer is the sixth most common cancer worldwide and the third leading cause of cancer-related deaths (Torre et al., 2015; Sung et al., 2021). Hepatocellular carcinoma (HCC) accounts for 75%–85% of the total liver cancer cases (Sung et al., 2021). The absence of effective early diagnostic biomarkers is partly responsible for the high mortality rates of HCC patients (Aghoram et al., 2012). Alpha-fetoprotein (AFP) is the only blood test currently available for the non-invasive diagnosis of HCC, but its clinical application is limited by low sensitivity and specificity (Johnson, 2001). Therefore, effective diagnostic biomarkers are urgently needed to accurately detect early HCC.
Exonuclease 1 (EXO1) belongs to the RAD2 nuclease family, which includes FEN1 and XPG (Wilson et al., 1998). EXO1 is a structure-specific endonuclease and exonuclease that plays an important role in DNA replication, telomere maintenance, DNA double strand break repair (DSB), and DNA mismatch repair (MMR) (Tishkoff et al., 1998; Lee and Wilson, 1999; Tomimatsu et al., 2012; Keijzers et al., 2019). EXO1 overexpression is associated with poor prognosis in several cancers (Kretschmer et al., 2011; Muthuswami et al., 2013; de Sousa et al., 2017). Furthermore, a high EXO1 expression in HCC specimens is related to a poor prognosis (Dai et al., 2018).
Currently, the role of EXO1 in tumor immune cell infiltration, immune checkpoints, aberrant DNA methylation and genetic alterations, and diagnosis and prognosis in HCC has not been established. Therefore, in this study, we performed an in-depth bioinformatics analysis to determine the diagnostic and prognostic roles of EXO1 in HCC using the TCGA and GEO databases.
Materials and Methods
Data Collection and Ethics Statement
We downloaded the RNAseq data in the Fragments Per Kilobase per Million (FPKM) format and the corresponding clinicopathological information for the 424 HCC patients from the Hepatocellular Carcinoma Project in the TCGA database (https://portal.gdc.cancer.gov/) (TCGA-LIHC). The RNA sequencing data in the FPKM format was converted into the Transcripts Per Million reads (TPM) format. We also downloaded three HCC datasets (GSE46408, GSE84402, and GSE114564) from the GEO database (https://www.ncbi.nlm.nih.gov/geo/). TCGA and GEO databases are publicly available and written informed consent was obtained from the patients prior to data collection.
We randomly selected tumor and adjacent peritumor liver tissues from five HCC patients from the First Affiliated Hospital of Chongqing Medical University. This study strictly followed the principles of medical ethics and was authorized and supervised by the Ethics Committee of Chongqing Medical University (Number: 2021020).
Bioinformatics Analysis of Exonuclease 1 mRNA Expression Levels in Hepatocellular Carcinoma and Normal Liver Tissue Samples
EXO1 mRNA expression levels were extracted from the TCGA database for 33 human cancers as well as 374 HCC tissues and 50 normal liver tissue samples. Gene expression data were extracted from the GEO database for the GSE46408, GSE84402, and GSE114564 datasets to analyze the EXO1 expression in the HCC samples. The 374 HCC samples were divided into high-EXO1 expression and low-EXO1 expression groups based on the median expression value of EXO1. Differentially expressed genes (DEGs) between the two groups were analyzed using the “DESeq2” (v1.26.0) R package (Love et al., 2014) with log-fold change absolute value >1.5 and p-value < 0.05 as the threshold parameters. The volcano plots and heat maps of the DEGs were visualized using the “ggplot2” (v3.3.3) R package.
Quantitative Real-Time PCR Analysis
Total RNA was extracted from liver tissues of five pathologically diagnosed HCC patients with the TRIzol Universal Reagent (TIANGEN, Beijing, China) according to the manufacturer’s instructions. RNA concentrations were determined on a Nano-500 Micro UV VIS Spectrophotometer (Allsheng, Hangzhou, China). First strand cDNA was synthesized using the Transcriptor First Strand cDNA Synthesis kit (TaKaRa, Otsu, Japan) according to the manufacturer’s instructions. Quantitative real-time PCR (qRT-PCR) was then performed with the SYBR Premix Ex Taq (TaKaRa, Otsu, Japan) on a CFX ConnectTM Real-Time System (Bio-Rad, Hercules, CA, United States) and the following primers: EXO1 forward, 5′-TGAGGAAGTATAAAGGGCAGGT-3’; EXO1 reverse, 5′-AGTTTTTCAGCACAAGCAATAGC-3’; β-actin forward, 5′-CCTTCCTGGGCATGGAGTC-3′, and β-actin reverse, 5′-TGATCTTCATTGTGCTGGGTG-3’. Each sample was assessed thrice. The relative EXO1 mRNA levels were determined using the 2-∆∆Ct method.
Functional Enrichment Analysis of Exonuclease 1-Associated Differentially Expressed Genes in Hepatocellular Carcinoma
The “org.Hs.eg.db” (v3.10.0) R package was used to convert entrez ID to the gene symbol. The “ClusterProfiler” (v3.14.3) R package (Yu et al., 2012) was used for the functional annotation and Gene Set Enrichment Analysis (GSEA) of the DEGs. The curated reference genesets from the MgDB file: c2. cp.v7.2. symbols.gmt were selected for GSEA (Subramanian et al., 2005). We identified 569 significantly enriched clusters based on false discovery rate (FDR) <0.25 and p (adjust) <0.05 as threshold parameters. A protein–protein interaction (PPI) analysis was performed using the STRING database (Szklarczyk et al., 2019) and visualized using the Cytoscape software (v3.9.0) (Shannon et al., 2003).
Correlation Analysis Between Exonuclease 1 Expression Levels, Immune Cell Infiltration, and Immune Cell Markers in Hepatocellular Carcinoma
The ssGSEA algorithm in the “GSVA” (v1.34.0) R package (Hanzelmann et al., 2013) was used to evaluate the tumor infiltration status of 24 immune cell types (Bindea et al., 2013), including neutrophils, cytotoxic cells, dendritic cells (DCs), CD8+ T cells, plasmacytoid DC (pDC), natural killer (NK) cells, mast cells, T gamma delta (Tgd), type 17 Th (Th17) cells, immature DCs (iDCs), eosinophils, NK CD56dim cells, regulatory T cells (TReg), T effector memory (Tem), T cells, T central memory (Tcm), B cells, type 1 Th (Th1) cells, macrophages, NK CD56bright cells, activated DC (aDC), T follicular helper (TFH), T helper cells, and type 2 Th (Th2) cells. The Spearman’s correlation analysis was performed to determine the relationship between EXO1 expression levels, the immune cell infiltration status, and the immune cell markers.
Correlation Analysis Between Exonuclease 1 Expression Levels, Immune Checkpoints, and TP53 in Hepatocellular Carcinoma
The association between the EXO1 expression levels, immune checkpoint genes (including CTLA4 and PDCD-1), and TP53 were analyzed in the HCC samples from the TCGA database using the Spearman’s correlation analysis with the “ggplot2” (v3.3.3) R package. The correlation was considered significant with p < 0.05 as the threshold.
Analysis of DNA Methylation Status in the CpG Islands of the Exonuclease 1 Gene
DNA methylation status in the CpG sites of the EXO1 gene was analyzed in the HCC–TCGA datasets using the MethSurv database (https://biit.cs.ut.ee/methsurv/). Furthermore, the prognostic value of the CpG methylation status of EXO1 was evaluated in the HCC samples. Moreover, the association between CpG methylation status of EXO1 and overall survival (OS) of HCC was also evaluated.
Genetic Alterations in the Hepatocellular Carcinoma Samples
The genomic alterations in the EXO1 gene were analyzed using the cBioPortal (https://www.cbioportal.org/) (Cerami et al., 2012; Gao et al., 2013) in the following three HCC datasets: MSK, Clin Cancer Res 2018 (Harding et al., 2019); AMC Hepatology 2014 (Ahn et al., 2014); and TCGA, Firehose Legacy (https://gdac.broadinstitute.org/runs/stddata__2016_01_28/data/LIHC/20160128/). K–M survival curve analysis and log-rank test was performed to determine the prognostic significance of genomic alterations in the EXO1 gene. p < 0.05 was considered statistically significant.
Correlation Analysis Between Exonuclease 1 Expression Levels and Clinicopathological Characteristics of Hepatocellular Carcinoma Patients
The clinicopathological data of the HCC patients including overall survival (OS), disease-specific survival (DSS), and progression-free interval (PFI) were extracted from the TCGA–LIHC project and a previously published study of HCC patients (Liu et al., 2018). The differences in various clinicopathological parameters such as race, AFP levels, DSS events, OS events, T stage, tumor status, histological grade, and pathological stage were compared using the R package between the high- and low-EXO1 expression groups. Differences between the groups were analyzed by the Shapiro–Wilk normality test (p < 0.05) for data with normal distribution, Kruskal–Wallis Test, and Dunn's multiple hypothesis test. The results for the significance level were corrected by the Bonferroni method. The statistical data were visualized using the “ggplot2” (v3.3.3) R package. The logistic regression analysis was used to evaluate the relationship between EXO1 expression levels and the clinicopathological characteristics of HCC patients.
Evaluation of the Prognostic Significance of Exonuclease 1 Expression in Hepatocellular Carcinoma
The survival data of HCC patients from the TCGA–LIHC project and previously published data (Liu et al., 2018) were analyzed using the “survival” (v3.2-10) R package (statistical analysis of survival data) and “survminer” (v.0.4.9) R package (visualization) for the prognostic analysis. K–M survival curve analysis as well as univariate and multivariate Cox regression analyses was performed to determine the survival outcomes of HCC patients based on the EXO1 expression levels. The diagnostic ROC curve, time-dependent survival ROC curve, and nomogram model analysis were performed using the “pROC” (v1.17.0.1), “timeROC” (v0.4) (statistical analysis) and “ggplot2” (v3.3.3) (visualization) R packages to evaluate the predictive value of EXO1 expression levels in HCC diagnosis. K–M survival curves were used for the prognostic analysis of the HCC patient subgroups. The results included a collated sample size (percentage), hazard ratio (HR), confidence interval (CI), and p values. Forest plots were constructed using the “ggplot2” (v3.3.3) R package.
Results
Exonuclease 1 Expression Levels are Significantly Elevated in Multiple Cancers Including Hepatocellular Carcinoma
EXO1 expression was analyzed in 33 cancer datasets from the TCGA database. EXO1 was significantly up-regulated in 19 types of cancer tissues out of the 33 (Figure 1A). None of the cancers analyzed showed any significant down-regulation of EXO1. Furthermore, EXO1 expression was significantly higher (p < 0.001) in the HCC tissues from the GSE46408 (Figure 1B) and the GSE84402 (Figure 1C) datasets and in the serum of HCC patients from the GSE114564 dataset (Figure 1D) compared to the corresponding controls. Furthermore, the EXO1 expression was significantly higher in the HCC tissues compared to the adjacent peritumoral liver tissues (p < 0.001, Figures 1E,F).
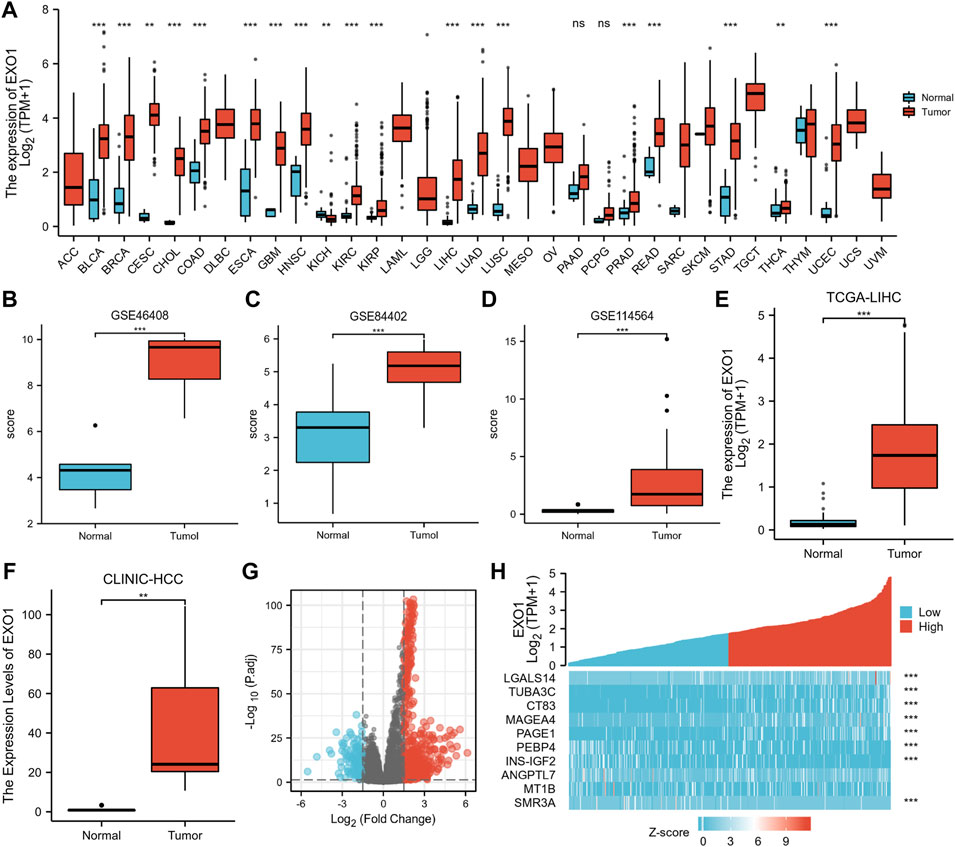
FIGURE 1. EXO1 expression significantly up-regulated in multiple cancers including HCC. (A) TCGA database analysis shows the EXO1 expression levels in 33 types of cancer tissues and their corresponding adjacent normal tissues. ns, p ≥ 0.05; **p < 0.01; ***, p < 0.001. (B,C) EXO1 expression levels were significantly higher in the HCC tissues compared to the adjacent peritumoral liver tissues in the (B) GSE46408 and (C) GSE84402. (D) EXO1 expression levels were significantly higher in the serum of HCC patients compared to the healthy subjects in the GSE114564 dataset (p < 0.001). (E,F) EXO1 expression levels were significantly higher in the HCC tissues compared to the adjacent peritumoral liver tissues (E) TCGA-LIHC datasets and (F) clinical HCC samples. (G,H) According to the median EXO1 level, 424 HCC patients from the TCGA–LIHC project were divided into high- and low-EXO1 expression groups. (G) The volcano plots and (H) the heat maps show the expression levels of specific mRNAs in the HCC patients with high- and low-EXO1 expression (n = 422) from the TCGA-LIHC project.
Differentially Expressed Genes Between High- and Low-Exonuclease 1 Expressing Hepatocellular Carcinoma Patients
The median EXO1 expression value was used to classify 424 HCC patients into high- and low-EXO1 expression groups. Then, we used absolute log-fold change >1.5 and p < 0.05 as the threshold parameters and identified 794 differentially expressed genes (DEGs) (659 up-regulated and 135 down-regulated) in the high-EXO1 expression group compared to the low-EXO1 expression group (Figure 1G). The six most significant DEGs are shown in the single gene co-expression heat map in Figure 1H.
Functional Enrichment Analysis of Exonuclease 1-Associated Differentially Expressed Genes in Hepatocellular Carcinoma
We then performed a functional annotation of the EXO1-associated DEGs in the HCC patients using the “clusterProfiler” R package. The GO enrichment analysis results, including the highly enriched biological processes, cellular components, and molecular functions (p < 0.05) are shown in Figure 2A and Supplementary Table S1. The top biological processes included “organelle fission,” “nuclear division,” “chromosome segregation,” and “nuclear chromosome segregation.” The most enriched cellular components were “condensed chromosome,” “chromosome”, “centromeric region,” “kinetochore,” “condensed chromosomes”, and “centromeric region.” The most enriched molecular functions were “channel activity,” “motor activity,” “neurotransmitter receptor activity,” and “microtubule motor activity.” GSEA showed that the EXO1-associated DEGs were significantly enriched in cell proliferation-related clusters (Figures 2B–I) including genes related to cell cycle checkpoint (NES = 2.144, Padj = 0.042, FDR = 0.035), G2-M checkpoint (NES = 1.934, Padj = 0.042, FDR = 0.035), M phase (NES = 1.881, Padj = 0.042, FDR = 0.035), S phase (NES = 1.973, Padj = 0.042, FDR = 0.035), mitotic G2-M phase (NES = 1.864, Padj = 0.042, FDR = 0.035), mitotic prometaphase (NES = 2.198, Padj = 0.042, FDR = 0.035), mitotic metaphase and anaphase (NES = 2.041, Padj = 0.042, FDR = 0.035), and separation of sister chromosome (NES = 2.112, Padj = 0.042, FDR = 0.035). EXO1-associated DEGs were also enriched in the DNA repair clusters (Figure 2J). EXO1-associated DEGs showed significant correlation with the RHO-GTPASE effectors and signaling pathways regulated by RHO-GTPASE (Figures 2K,L), and the cilium assembly (Figure 2M). The PPI network of the DEGs (Supplementary Figure S1) showed an association between EXO1 and a total of 17 genes.
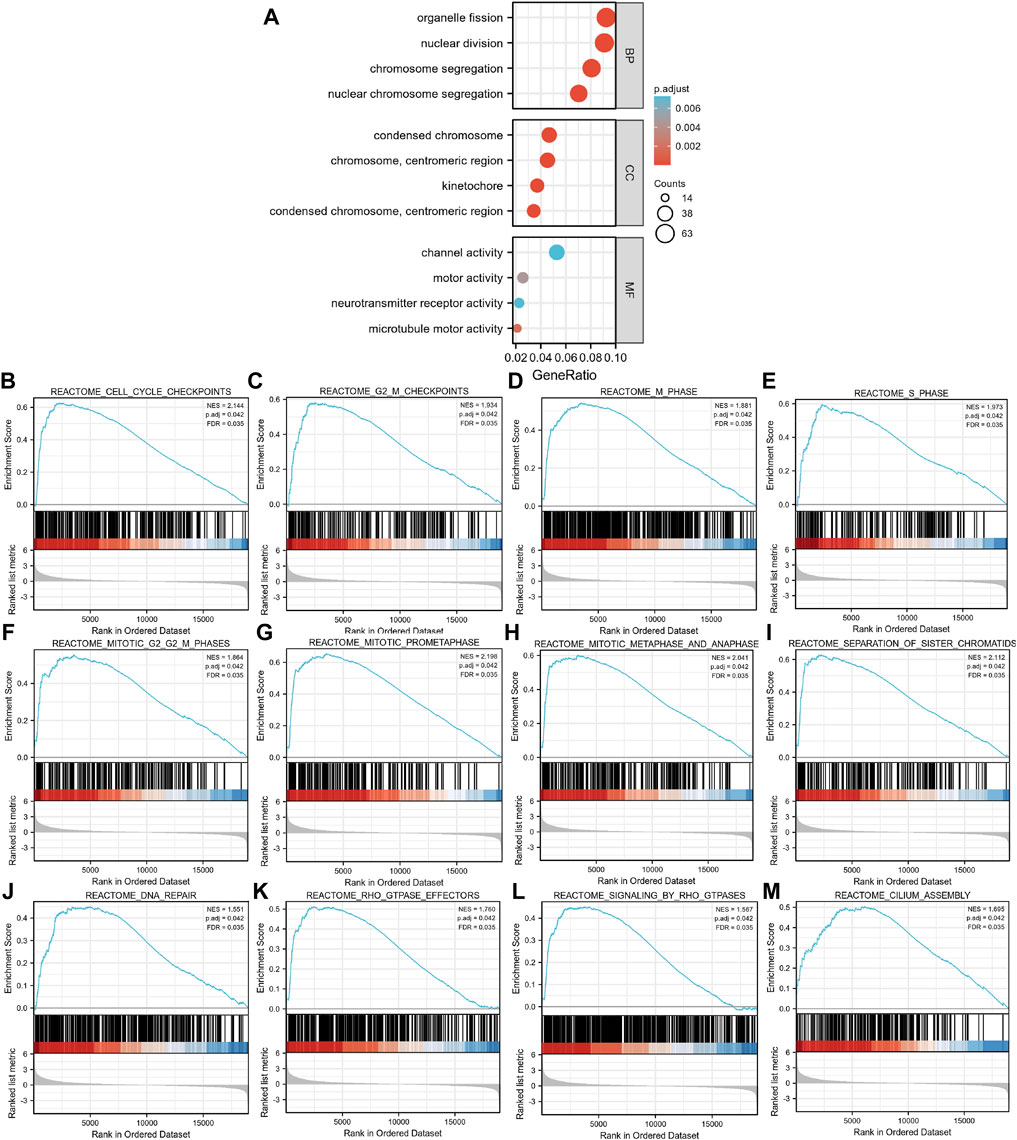
FIGURE 2. Functional enrichment analysis of the differentially expressed genes (DEGs) based on the EXO1 expression levels in HCC. (A) GO enrichment analysis of the EXO1-associated DEGs show the enriched biological functions (BP), cellular components (CC), and molecular functions (MF). (B–M) Gene Set Enrichment Analysis (GSEA) of the altered signaling pathways in the HCC tissues based on the EXO1-associated DEGs between the high- and low-EXO1 expression groups in HCC.
Exonuclease 1 Expression Levels Correlate With the Infiltration of Multiple Immune Cell Types in the Hepatocellular Carcinoma Tissues
The infiltration status of 24 immune cell types in the HCC tissues was evaluated by ssGSEA. The association between EXO1 expression and immune cell infiltration was estimated by the Spearman’s correlation analysis. EXOI expression levels showed a negative association with neutrophils (R = −0.313, p < 0.001), cytotoxic fine cells (R = −0.294, p < 0.001), and CD8+ T cells (R = −0.267, p < 0.001), and positive association with aDCs (r = 0.177, p < 0.001), T helper cells (r = 0.277, p < 0.001), and type 2 T helper cells (r = 0.739, p < 0.001) (Figure 3A). The tumor infiltration levels of neutrophils (Figure 3B), cytotoxic cells (Figure 3C), DC (Figure 3D), TFH (Figure 3E), T helper cells (Figure 3F), and Th2 cells (Figure 3G) were consistent with the Spearman’s analysis results shown in Figure 3A. Next, we evaluated the correlation between EXO1 expression and the immune cell markers. EXO1 expression levels showed positive correlation with specific biomarkers for the B cells (CD19, CD20, and CD38), CD8+ T cells (CD8A, CD8B), other T cell subsets (TFH, Th2, and Treg), M1 macrophages (IRF5), M2 macrophages (CD115), and TAMs (PDCD1LG2, CD80, and CD40) in the HCC tissues (Supplementary Table S2).
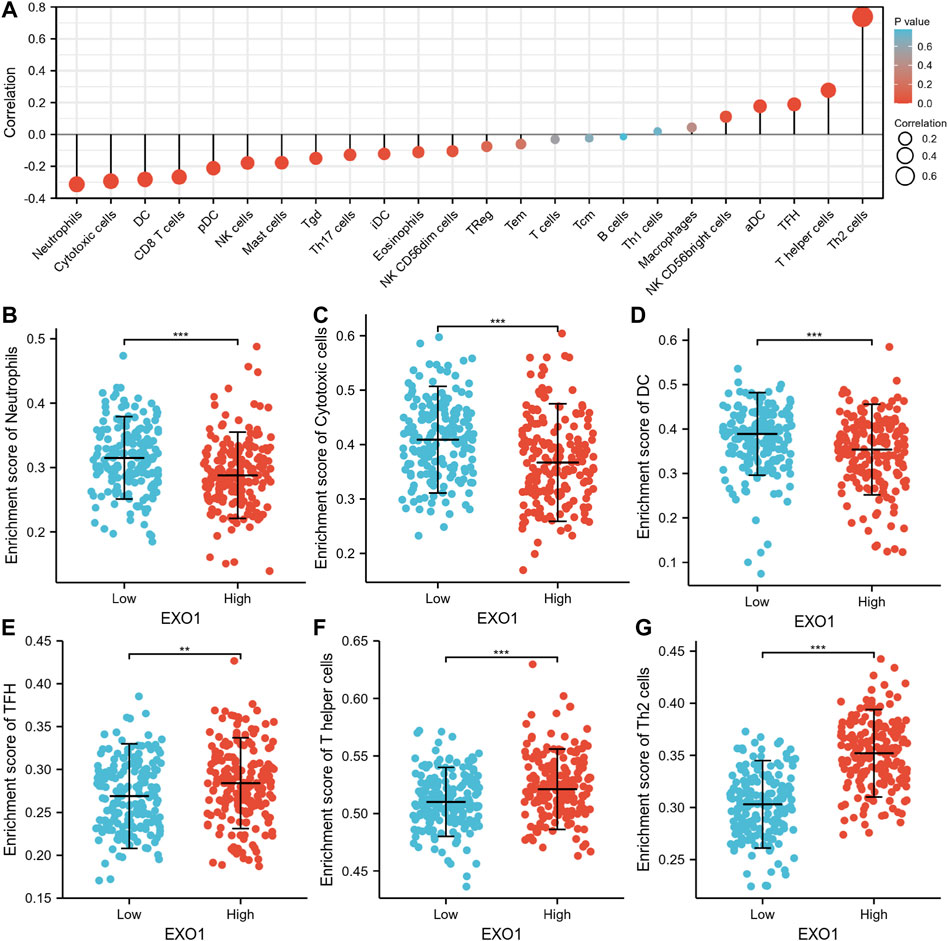
FIGURE 3. The correlation analysis between immune cell infiltration and EXO1 expression in HCC. (A) Spearman’s correlation analysis results between infiltration levels of 24 immune cell types and EXO1 expression levels in the HCC tissues. (B–G) The infiltration levels of (B) neutrophils, (C) cytotoxic cells, (D) DC cells, (E) TFH, (F) T helper cells, and (G) Th2 cells in the high- and low-EXO1 expression groups. Note: DC, dendritic cells; pDC, plasmacytoid DC; NK, natural killer cells; Tgd, T gamma delta; Th17, type 17 Th cells; iDCs, immature DCs; TReg, regulatory T cells; Tem, T effector memory; Tcm, T central memory; Th1 cells, type 1 Th cells; aDC, activated DC; TFH, T follicular helper; Th2, type 2 Th cells.
Exonuclease 1 Expression Levels Correlate With the Expression of Immune Checkpoint Genes and TP53 in the Hepatocellular Carcinoma Tissues
CTLA-4 and PDCD-1 are important immune checkpoint proteins that are associated with tumor immune escape (Krummel and Allison, 1996; Goodman et al., 2017). Furthermore, TP53 is a tumor suppressor gene with low expression in the normal cells and high expression in the malignant tumors (Wang and Sun, 2017). We demonstrated that EXO1 expression levels showed positive correlation with the expression levels of CTLA-4, PDCD-1, and TP53 in the HCC samples of the TCGA dataset (Figures 4A–C).
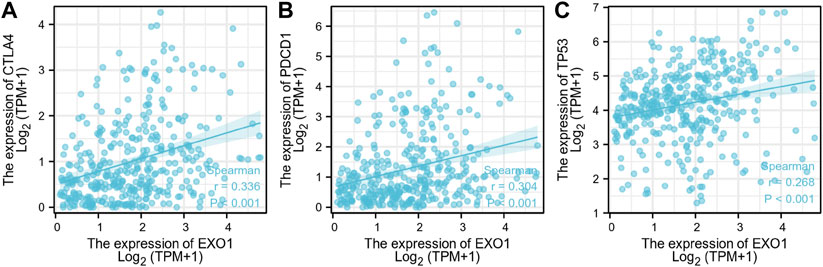
FIGURE 4. The correlation analysis between the expression levels of EXO1, CTLA-4, PDCD-1, and TP53 in HCC. (A–C) The correlation analysis results between the expression levels of EXO1 and the expression levels of (A) CTLA-4, (B) PDCD-1, and (C) TP53 in the TCGA-LIHC dataset.
Methylation Status of the Exonuclease 1 Gene Is Associated With the Prognosis of Hepatocellular Carcinoma Patients
DNA methylation levels in the EXO1 gene and the prognostic value of the CpG islands in the EXO1 gene were analyzed using the MetSurv tool. The results showed 14 methylated CpG islands including cg03292648, cg03116938, cg11837910, and cg22022181 that showed elevated levels of DNA methylation (Figure 5). Furthermore, methylation levels of six CpG islands, namely, cg03116938, cg03292648, cg11837910, cg21919602, cg22022181, and cg24741598 were associated with the prognosis (p < 0.05) (Table 1). Elevated levels of EXO1 methylation in these six CpG islands, especially cg03292648, were associated with a poorer overall survival of HCC patients compared to those with lower levels of CpG methylation in EXO1.

FIGURE 5. DNA methylation levels in the EXO1 gene are associated with the prognosis of HCC patients.
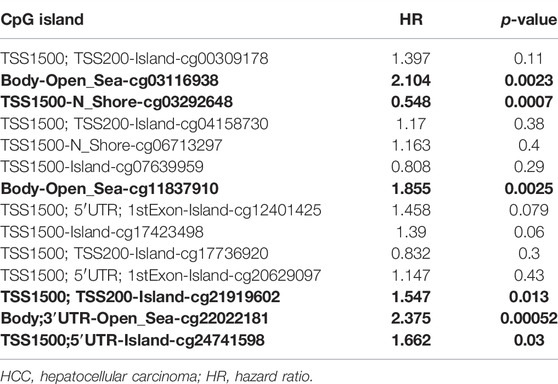
TABLE 1. Effects of methylation levels in the CpG sites of the EXO1 gene on the prognosis of HCC patients.
Genetic Alterations in Exonuclease 1 Are Not Associated With Survival Outcomes in Hepatocellular Carcinoma Patients
We then analyzed genetic alterations in the EXO1 gene based on samples from 737 HCC patients from the following three datasets: MSK, Clin Cancer Res 2018 (n = 127) (Harding et al., 2019); AMC, Hepatology 2014 (n = 231) (Ahn et al., 2014), and TCGA, Firehose Legacy (n = 379). Genetic alterations in the EXO1 gene were observed in only 7% of the HCC patients (Figure 6A). K–M survival curves and a log-rank test showed no significant differences in OS (p = 0.370) and DSS (p = 0.180) between patients with or without genetic alterations in the EXO1 gene (Figures 6B,C).
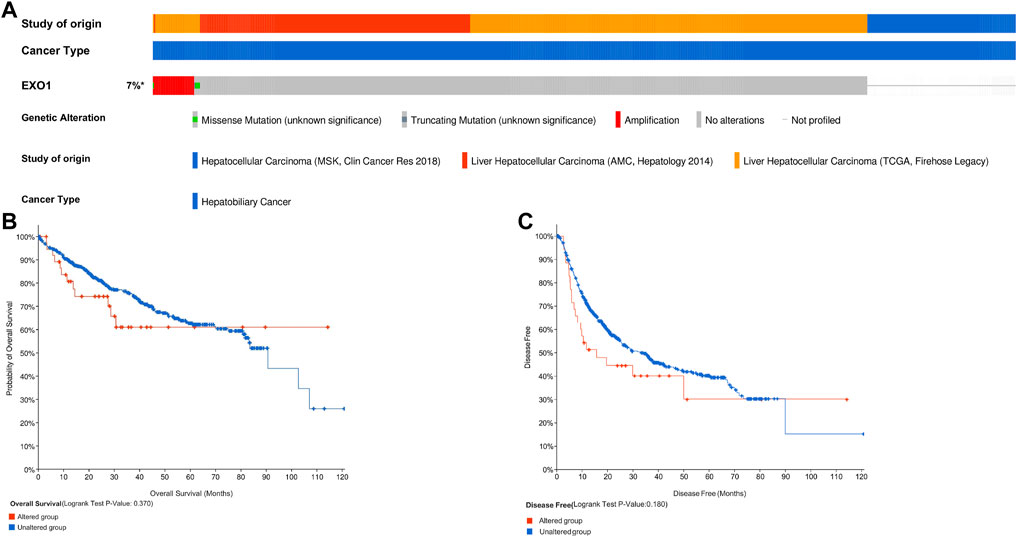
FIGURE 6. EXO1 gene alterations are not associated with the survival outcomes in HCC. (A) OncoPrint visual summary of the alterations in the EXO1 gene. (B,C) Kaplan–Meier survival curves show the (B) overall survival and (C) disease-free survival rates of HCC patients with or without EXO1 gene alterations.
Exonuclease 1 Expression Levels Correlate With Multiple Clinicopathological Characteristics in Hepatocellular Carcinoma
The association between clinicopathological characteristics of HCC patients and the EXO1 expression levels based on the TCGA–LIHC dataset is shown in Table 2. HCC patients with high- and low-EXO1 expression levels showed significant differences in the clinical T stages, pathological stages, tumor status, histological stages, alpha-fetoprotein (AFP) levels, overall survival (OS), and disease-specific survival (DSS). EXO1 expression levels showed a significant correlation with the race (Figure 7A), AFP levels (Figure 7B), DSS (Figure 7C), OS (Figure 7D), T stages (Figure 7E), tumor status (Figure 7F), histologic grades (Figure 7G), and pathologic stages (Figure 7H) of the HCC patients. Asian patients showed a significantly higher EXO1 expression than the other races. Furthermore, HCC patients with high AFP levels, low OS and DSS rates, and advanced cancer stages also showed higher EXO1 levels. The logistic regression analysis showed that the EXO1 expression levels positively correlated with T stage, tumor status, histologic grade, and AFP levels in the HCC tissues (Table 3).
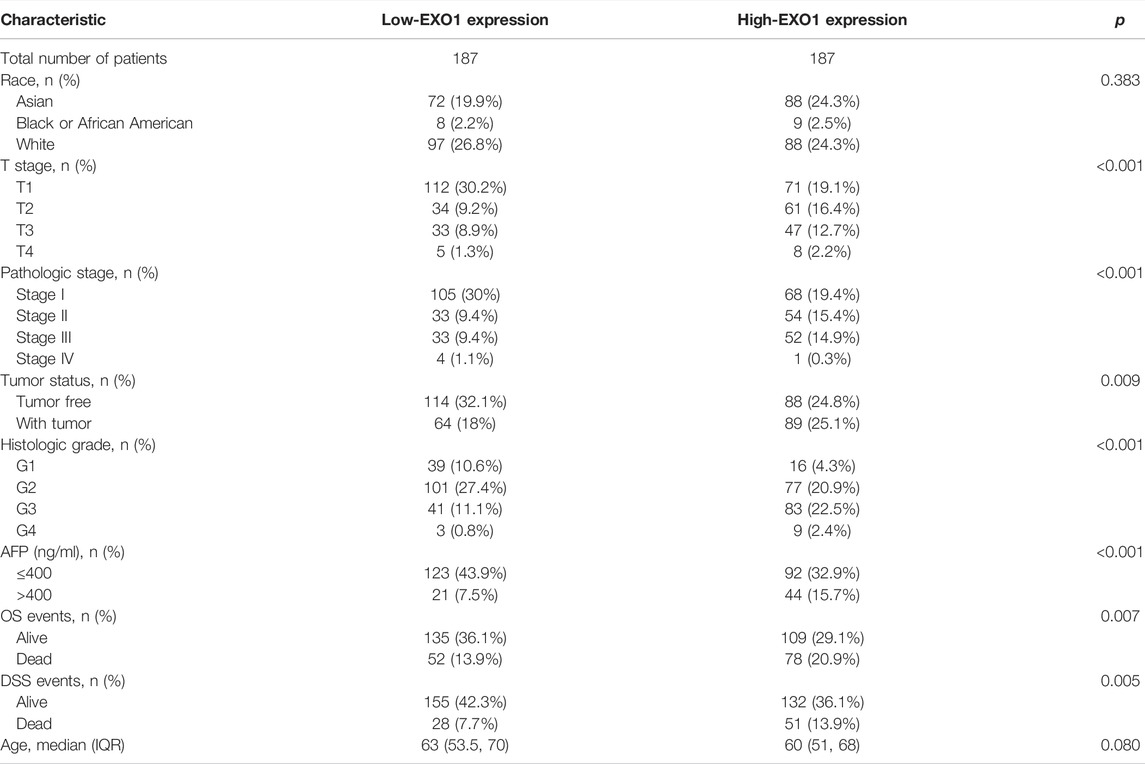
TABLE 2. Clinicopathological characteristics of HCC patients with high- and low-EXO1 expression levels.
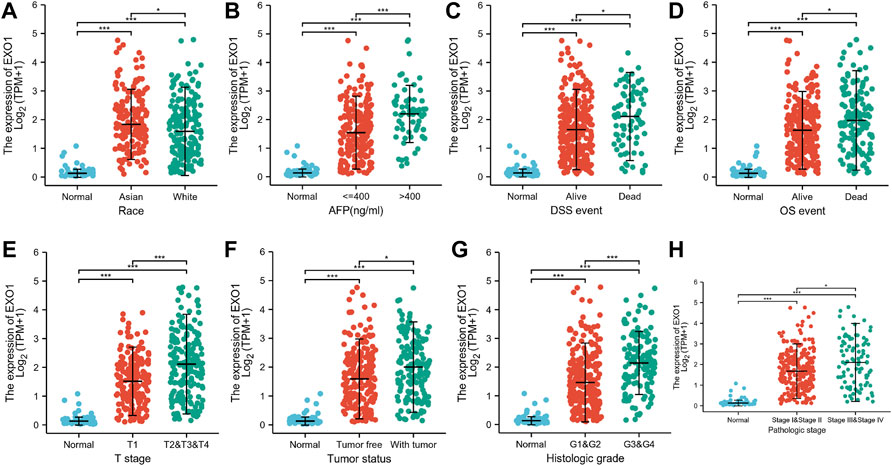
FIGURE 7. EXO1 expression levels correlate with multiple clinicopathological characteristics of HCC patients. (A–H) The correlation analysis between EXO1 expression levels and (A) race, (B) AFP levels, (C) DSS, (D) OS, (E) T stages, (F) tumor status, (G) histologic grades, and (H) pathologic stages of HCC patients. *p < 0.05, ***p < 0.001.
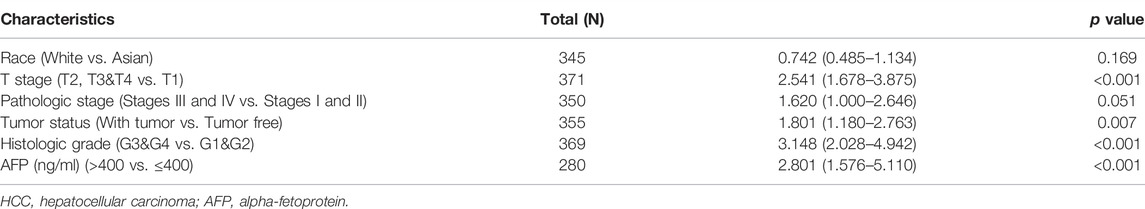
TABLE 3. Logistic regression analysis of the relationship between clinicopathological characteristics and the EXO1 expression levels in HCC patients.
Exonuclease 1 Is a Potential Prognostic and Diagnostic Biomarker in Hepatocellular Carcinoma
K–M survival curve analysis showed that HCC patients with a high-EXO1 expression were associated with significantly lower OS (p < 0.001) (Figure 8A), DSS (p < 0.001) (Figure 8B) and progression-free interval (PFI) (p = 0.001) compared to those with low-EXOI expression levels (Figure 8C). The multivariate Cox regression analysis showed that EXO1 was an independent risk factor for predicting OS (HR: 1.648, p = 0.01) and DSS (HR: 2.216, p = 0.003) but not PFI (Table 4). The pathologic stage was an independent predictor of OS and DSS. The tumor status was an independent predictor of OS and PFI. T stages showed a significant clinical value in predicting PFI.
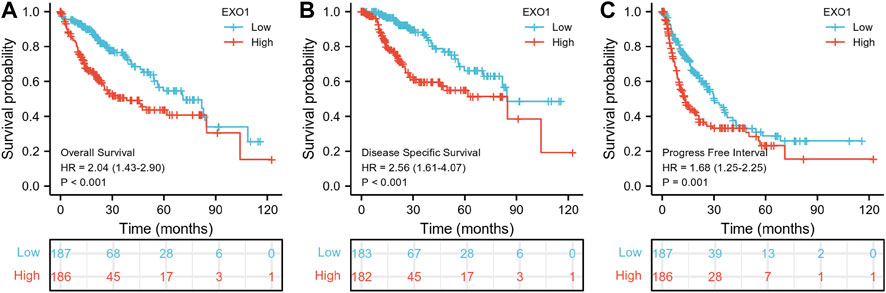
FIGURE 8. EXO1 shows a high prognostic prediction value in HCC patients. The Kaplan–Meier plotter database analysis shows the differences in (A) overall survival, (B) disease-specific survival, and (C) progression-free interval of HCC patients with high- and low-EXO1 expression levels. p < 0.05 indicates statistical significance. The red and blue curves represent high and low EXO1 expressing HCC patients, respectively.
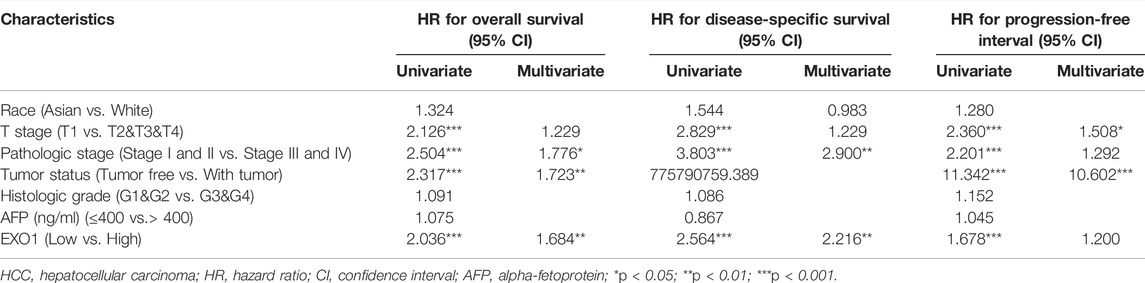
TABLE 4. Cox regression analysis of the clinical outcomes in HCC patients based on various clinicopathological characteristics including EXO1 levels.
An ROC curve analysis was performed to determine the diagnostic value of the EXO1 expression levels. The EXO1 expression levels accurately distinguished tumor tissues from the adjacent peritumoral tissues with an AUC value of 0.971 (Figure 9A). The time-dependent ROC curve analysis showed that the AUC values for the predicted 1 -, 3-, and 5-year survival rates of HCC patients based on the EXO1 expression levels were above 0.6 (Figure 9B). A nomogram model was constructed that included T stages, tumor status, pathologic stages, and EXO1 expression levels as parameters. These factors were established as highly significant prognostic prediction factors based on the multivariate Cox regression analysis. The nomogram showed a significantly high clinical value in predicting the 1 -, 3-, and 5-year survival probability of the HCC patients (Figure 9C).
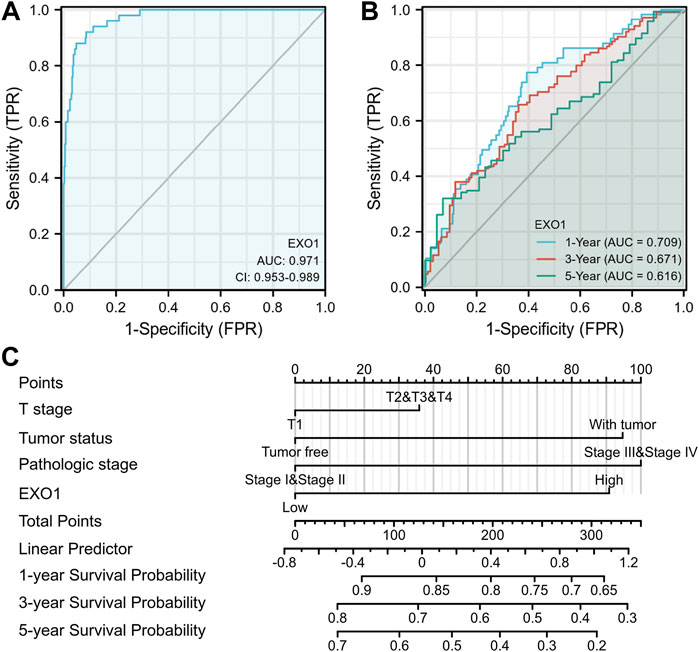
FIGURE 9. The nomogram model with EXO1 shows a superior diagnostic and prognostic performance in HCC. (A) Diagnostic ROC curves to distinguish HCC tissues and normal tissues based on the EXO1 expression levels. (B) Time-dependent survival ROC curves to predict 1-, 3-, and 5-year survival rates of HCC patients based on the EXO1 expression levels. (C) ROC curve analysis to evaluate the prediction efficacy of the nomogram model that includes clinicopathological factors (T stages, tumor status, and pathologic stages) and EXO1 expression levels to predict the 1-, 3-, and 5-year survival rates of HCC patients.
Prognostic Performance of Exonuclease 1 in the Clinicopathological Subgroups of Hepatocellular Carcinoma Patients
Table 5 and Figure 10 show the results of the Cox regression analysis for specific HCC patient subgroups based on the clinicopathological parameters to determine the predictive value of EXO1. High EXO1 expression levels were associated with unfavorable OS in the HCC patients of different races, especially Asians (HR = 4.15, p < 0.001), clinical T2, T3, and T4 stages (HR = 1.70, p = 0.016), clinical pathologic stages, tumor status (HR = 2.19, p = 0.001), and clinical histologic grades, G1 and G2 (HR = 1.82, p = 0.01) (Figure 10A), and DSS (Figure 10B). High EXO1 expression levels were also associated with lower PFI in different races and clinical histologic grades, G1and G2 (HR = 1.93, p = 0.001) (Figure 10C). These results demonstrated that the survival rates of HCC patients with a high EXO1 expression were significantly shorter than those with a low EXO1 expression.
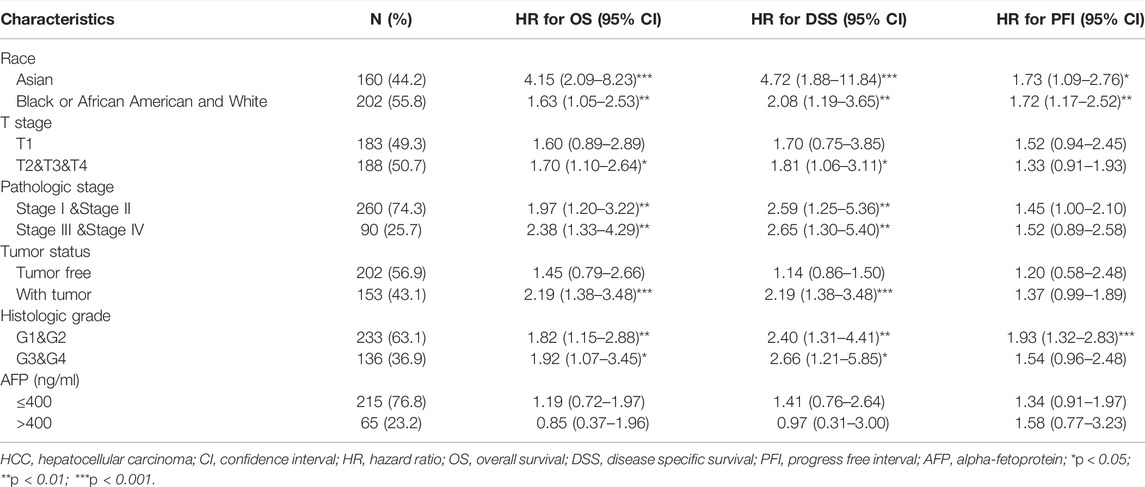
TABLE 5. Prognostic performance of EXO1 on the clinical outcomes of HCC patient subgroups based on the Cox regression analysis.
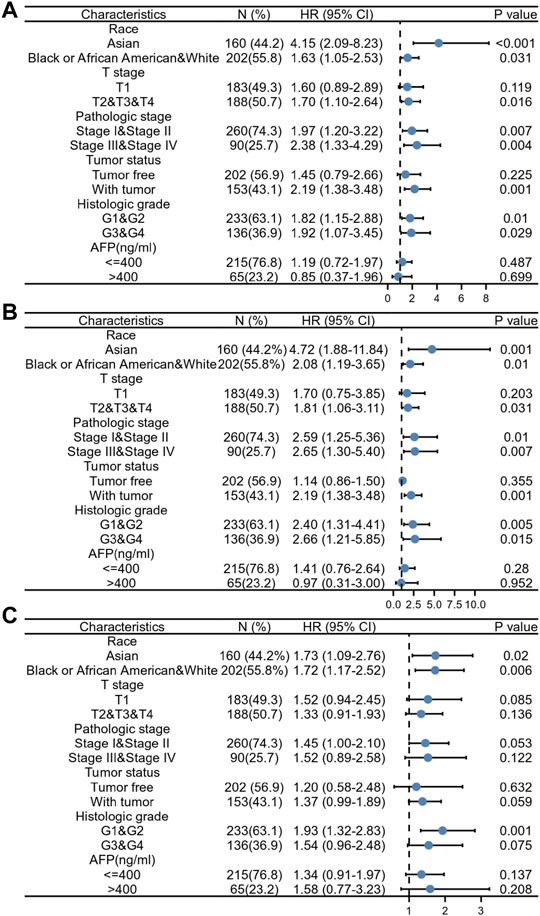
FIGURE 10. Prognostic performance of EXO1 expression in different HCC patient subgroups. The HCC patients were divided into different subgroups based on race, T stages, pathologic stages, tumor status, histologic grades, and AFP levels. (A–C) The Cox regression analysis results show the prognostic performance of EXO1 expression levels regarding (A) overall survival, (B) disease-specific survival, and (C) progression-free interval in different subgroups of HCC patients. The results are represented by the hazard ratio (HR). The bar represents the 95% confidence interval (CI) of the HR values and the size of the diamond represents the significance of the prognostic performance EXO1.
Discussion
In this study, we demonstrated that EXO1 was significantly overexpressed in 19 out of the 33 human cancer tissues. A high EXO1 expression was observed in the HCC tissues from clinical samples as well as the TCGA and GEO databases. Furthermore, a high EXO1 expression was observed in the serum of HCC patients from the GSE114564 dataset. This suggested that EXO1 was a potential serum biomarker for HCC.
The in vitro silencing of EXO1 in the HCC cells reduced cellular proliferation (Dai et al., 2018). Our results showed that EXO1-associated DEGs in the HCC tissues were enriched in biological processes such as organelle fission, nuclear division, chromosome segregation, and nuclear chromosome segregation. EXO1-associated DEGs were enriched in cellular components such as the condensed chromosome and centromeric region as well as molecular functions such as channel activity, motor activity, neurotransmitter receptor activity, and microtubule motor activity. GSEA results showed that HCC tissues with high EXO1 expression were enriched in DEGs related to the cell cycle and DNA damage repair. These data suggested that high EXO1 expression promoted HCC tumorigenesis by regulating cell cycle and DNA damage repair mechanisms.
In a previous study, 25% of HCC samples showed the expression of biomarkers for the inflammatory response (Sia et al., 2017). Our study demonstrated a potential relationship between EXO1 expression and tumor immune cell infiltration. EXO1 expression showed negative correlation with the levels of neutrophils, dendritic cells, and CD8+ T cells in the HCC tissues. Neutrophils play a significant anti-tumor role by activating immune responses against the tumor cells and the direct lysis of tumor cells (Eruslanov et al., 2014). Dendritic cells are the most effective antigen-presenting cells that initiate anti-tumor immunity by activating the CD8+ T cells (Fu and Jiang, 2018). Our data showed a positive correlation between EXO1 expression levels and the proportion of T follicular helper cells, T helper cells, and type 2 T helper cells in the HCC tissues. T follicular helper cells regulate tumor growth and progression via CXCR5, the chemokine receptor (Breitfeld et al., 2000; Höpken and Rehm, 2012). The transforming growth factor-β (TGB-β) expressed by the regulatory T helper cells (Tregs) and type 2 T helper cells plays a significant role in the resistance mechanisms against cancer immunotherapy (Hong et al., 2008; Li et al., 2020). Furthermore, Th2-derived cytokines such as IL-4 and IL-13 promote tumor progression by inducing M2 macrophage polarization (Biswas and Mantovani, 2010). Therefore, our data suggested that the EXO1 overexpression played a significant role in the immune escape mechanisms of HCC cells, thereby contributing to HCC growth and progression.
CTLA-4 and PDCD-1 are two critical proteins associated with tumor immune escape (Krummel and Allison, 1996; Goodman et al., 2017). Immune checkpoint inhibitors (ICIS) such as ipilimumab (CTLA-4 inhibitor) and nivolumab (PDCD-1 inhibitor) significantly improve the overall survival rates of patients with melanoma (Hodi et al., 2010; Long et al., 2017) and advanced liver cancer (Waidmann, 2018). Furthermore, TP53 is highly expressed in malignant tumors and TP53 mutations are associated with the poor prognosis of several human cancers (Wang and Sun, 2017). TP53 mutations suppressed anti-tumor immunity and reduced the efficacy of cancer immunotherapy (Jiang et al., 2018; Xiao et al., 2018; Lyu et al., 2019). Therefore, we evaluated the relationship between EXO1 expression levels and immune checkpoint genes including CTLA-4 and PDCD-1 as well as TP53. Our results showed positive correlations between the expression levels of EXO1 and the expression levels of immune checkpoint genes and TP53 in the HCC tissues. This suggested that EXO1 was a potential target for improving the efficacy of immunotherapy in HCC patients.
DNA methylation is a common epigenetic mechanism that plays a significant role in tumorigenesis. Changes in the methylation status of several genes have been associated with the initiation, growth, and progression of various cancers (Irizarry et al., 2009; Baylin and Jones, 2011,2016). We investigated the relationship between methylation levels in the EXO1 gene and the prognosis of HCC patients. The hypermethylation of 5 CpG sites including cg03116938, cg11837910, and cg22022181 were associated with a poor overall survival. These three CpG sites showed the highest degree of DNA methylation. Mutations in the TP53, CTNNB1, TERT promoter, AXIN1, ARID1A, and ARID2 genes are associated with the diagnosis and treatment of HCC patients (De Stefano et al., 2018). TERT promoter mutations have been reported in the early stages of HCC, whereas TP53 mutations have been reported in the late tumor stages of HCC (Li et al., 2011; Schulze et al., 2015). Our study showed that the incidence of EXO1 gene mutations was only 7% in HCC tissues. Furthermore, EXO1 gene mutations were not associated with OS and DSS in the HCC patients.
Our investigation also showed that EXO1 expression levels in the HCC tissues significantly correlated with the AFP levels, overall survival, disease-specific survival, clinical stages, and the tumor status. Furthermore, higher EXO1 expression levels were associated with a poorer prognosis and advanced clinical stages of the HCC patients. The logistic regression analysis showed that EXO1 expression levels were associated with the clinical stages including T stages and histological stages, tumor status, and AFP levels. K–M survival curves showed that the overall survival, disease-specific survival, and progression-free interval rates of patients with higher EXO1 expression levels were significantly lower than those with lower EXO1 expression levels. The AUC value of EXO1 expression levels for the differential diagnosis of HCC was 0.971. Furthermore, the AUC values of 1-, 3-, and 5-year predicted survival rates were all greater than 0.6. These data suggested that EXO1 was a potential diagnostic and prognostic biomarker for HCC. We also established a nomogram model based on the results of the multivariate Cox regression analysis and showed that EXO1 expression levels significantly improved the prognostic assessment of HCC patients. Previous studies have shown that EXO1 is associated with the poor prognosis of patients with breast cancer (Muthuswami et al., 2013), invasive ductal carcinoma (Kretschmer et al., 2011), and gliomas (de Sousa et al., 2017). These results suggested that EXO1 was a potential prognostic biomarker for multiple cancer types including HCC.
Our study has some limitations. Our results were based on RNA sequencing data of HCC tissues from the TCGA database. However, we could not directly assess the activities of downstream signaling pathways and relative protein levels of EXO1 in the HCC tissues. Therefore, further in vivo and in vitro experiments are necessary to investigate the mechanisms of EXO1 in HCC.
Conclusion
In this study, we demonstrated the diagnostic and prognostic values of EXO1 in HCC. EXO1 was overexpressed in the tumor tissues and serum samples of HCC patients. EXO1 regulated HCC progression by modulating the expression of the genes involved in cell cycling and immune response. EXO1 expression levels correlated with tumor infiltration status of many immune cell types and may play a role in the response to immunotherapy in HCC patients. EXO1 methylation and gene expression was associated with the prognosis of HCC. Therefore, EXO1 is a potential therapeutic target and a useful diagnostic and prognostic biomarker in HCC. However, further studies are needed to validate our findings.
Data Availability Statement
Publicly available datasets were analyzed in this study. This data can be found here:https://portal.gdc.cancer.gov/(TCGA-LIHC), https://www.ncbi.nlm.nih.gov/geo/ (GSE46408, GSE84402, and GSE114564), https://biit.cs.ut.ee/methsurv/, https://www.cbioportal.org/ (MSK, Clin Cancer Res 2018; AMC Hepatology 2014; and TCGA, Firehose Legacy).
Ethics Statement
The studies involving human participants were reviewed and approved by the Ethics Committee of Chongqing Medical University. The patients/participants provided their written informed consent to participate in this study.
Author Contributions
JM performed data analysis and prepared the figures and tables; JJ and HL wrote the original draft of the manuscript; JZ and YL reviewed the write-up; XC was responsible for project administration, supervision, and editing. All the authors approved the final draft of the manuscript.
Conflict of Interest
The authors declare that the research was conducted in the absence of any commercial or financial relationships that could be construed as a potential conflict of interest.
Publisher’s Note
All claims expressed in this article are solely those of the authors and do not necessarily represent those of their affiliated organizations, or those of the publisher, the editors, and the reviewers. Any product that may be evaluated in this article, or claim that may be made by its manufacturer, is not guaranteed or endorsed by the publisher.
Supplementary Material
The Supplementary Material for this article can be found online at: https://www.frontiersin.org/articles/10.3389/fmolb.2022.889414/full#supplementary-material
References
Aghoram, R., Cai, P., and Dickinson, J. A. (2012). Alpha-foetoprotein And/or Liver Ultrasonography for Screening of Hepatocellular Carcinoma in Patients with Chronic Hepatitis B. J. Article; Meta-Analysis; Res. Support, Non-U.S. Gov't; Rev. Syst. Rev., 9. Cochrane Database Syst Rev, D2799. doi:10.1002/14651858.CD002799.pub2
Ahn, S. M., Jang, S. J., Shim, J. H., Kim, D., Hong, S. M., Sung, C. O., et al. (2014). Genomic Portrait of Resectable Hepatocellular Carcinomas: Implications of RB1 and FGF19 Aberrations for Patient Stratification. Hepatology 60 (6), 1972–1982. doi:10.1002/hep.27198
Baylin, S. B., and Jones, P. A. (2016). Epigenetic Determinants of Cancer. Cold Spring Harb. Perspect. Biol. 8 (9), a19505. doi:10.1101/cshperspect.a01950510.1101/cshperspect.a019505
Baylin, S. B., and Jones, P. A. (2011). A Decade of Exploring the Cancer Epigenome - Biological and Translational implicationsJournal Article; Research Support. Nat. Rev. Cancer. 11 (10), 726–734. N.I.H., Extramural; Research Support, Non-U.S. Gov't; Review]. doi:10.1038/nrc3130
Bindea, G., Mlecnik, B., Tosolini, M., Kirilovsky, A., Waldner, M., Obenauf, A. C., et al. (2013). Spatiotemporal Dynamics of Intratumoral Immune Cells Reveal the Immune Landscape in Human cancerResearch Support. J. Artic. 39 (4), 782–795. doi:10.1016/j.immuni.2013.10.003
Biswas, S. K., and Mantovani, A. (2010). Macrophage Plasticity and Interaction with Lymphocyte Subsets: Cancer as a Paradigm. Nat. Immunol. 11 (10), 889–896. doi:10.1038/ni.1937
Breitfeld, D., Ohl, L., Kremmer, E., Ellwart, J., Sallusto, F., Lipp, M., et al. (2000). Follicular B Helper T Cells Express CXC Chemokine Receptor 5, Localize to B Cell Follicles, and Support Immunoglobulin Production. J. Exp. Med. 192 (11), 1545–1552. doi:10.1084/jem.192.11.1545
Cerami, E., Gao, J., Dogrusoz, U., Gross, B. E., Sumer, S. O., Aksoy, B. A., et al. (2012). The cBio Cancer Genomics Portal: An Open Platform for Exploring Multidimensional Cancer Genomics Data: Figure 1. Cancer Discov. 2 (5), 401–404. doi:10.1158/2159-8290.CD-12-0095
Dai, Y., Tang, Z., Yang, Z., Zhang, L., Deng, Q., Zhang, X., et al. (2018). “EXO1 Overexpression Is Associated with Poor Prognosis of Hepatocellular Carcinoma Patients,”, Cell Cycle. in Research Support, 17, 2386–2397. doi:10.1080/15384101.2018.1534511
de Sousa, J. F., Torrieri, R., Serafim, R. B., Di Cristofaro, L. F. M., Escanfella, F. D., Ribeiro, R., et al. (2017). Expression Signatures of DNA Repair Genes Correlate with Survival Prognosis of Astrocytoma Patients. Tumour Biol. 39 (4), 101042831769455. doi:10.1177/1010428317694552
De Stefano, F., Chacon, E., Turcios, L., Marti, F., and Gedaly, R. (2018). Novel Biomarkers in Hepatocellular Carcinoma. Dig. Liver Dis. 50 (11), 1115–1123. doi:10.1016/j.dld.2018.08.019
Eruslanov, E. B., Bhojnagarwala, P. S., Quatromoni, J. G., Stephen, T. L., Ranganathan, A., Deshpande, C., et al. (2014). Tumor-associated Neutrophils Stimulate T Cell Responses in Early-Stage Human Lung Cancer. J. Clin. Invest. 124 (12), 5466–5480. doi:10.1172/JCI77053
Fu, C., and Jiang, A. (2018). Dendritic Cells and CD8 T Cell Immunity in Tumor Microenvironment. Front. Immunol. 9. doi:10.3389/fimmu.2018.03059
Gao, J., Aksoy, B. A., Dogrusoz, U., Dresdner, G., Gross, B., Sumer, S. O., et al. (2013). Integrative Analysis of Complex Cancer Genomics and Clinical Profiles Using the cBioPortal. Sci. Signal. 6 (269). doi:10.1126/scisignal.2004088
Goodman, A., Patel, S. P., and Kurzrock, R. (2017). PD-1-PD-L1 Immune-Checkpoint Blockade in B-Cell Lymphomas. Nat. Rev. Clin. Oncol. 14 (4), 203–220. doi:10.1038/nrclinonc.2016.168
Hänzelmann, S., Castelo, R., and Guinney, J. (2013). GSVA: Gene Set Variation Analysis for Microarray and RNA-Seq Data. J. Article; Res. SupportBMC Bioinforma. 14, 7. N.I.H., Extramural; Research Support, Non-U.S. Gov't]. doi:10.1186/1471-2105-14-7
Harding, J. J., Nandakumar, S., Armenia, J., Khalil, D. N., Albano, M., Ly, M., et al. (2019). Prospective Genotyping of Hepatocellular Carcinoma: Clinical Implications of Next-Generation Sequencing for Matching Patients to Targeted and Immune Therapies. Clin. Cancer Res. 25 (7), 2116–2126. doi:10.1158/1078-0432.CCR-18-2293
Hodi, F. S., O'Day, S. J., McDermott, D. F., Weber, R. W., Sosman, J. A., Haanen, J. B., et al. (2010). Improved Survival with Ipilimumab in Patients with Metastatic Melanoma. N. Engl. J. Med. 363 (8), 711–723. doi:10.1056/NEJMoa1003466
Hong, S., Qian, J., Yang, J., Li, H., Kwak, L. W., and Yi, Q. (2008). Roles of Idiotype-specific T Cells in Myeloma Cell Growth and Survival: Th1 and CTL Cells Are Tumoricidal while Th2 Cells Promote Tumor Growth. Cancer Res. 68 (20), 8456–8464. doi:10.1158/0008-5472.CAN-08-2213
Höpken, U. E., and Rehm, A. (2012). Homeostatic Chemokines Guide Lymphoma Cells to Tumor Growth-Promoting Niches within Secondary Lymphoid Organs. J. Mol. Med. 90 (11), 1237–1245. doi:10.1007/s00109-012-0906-z
Irizarry, R. A., Ladd-Acosta, C., Wen, B., Wu, Z., Montano, C., Onyango, P., et al. (2009). The Human Colon Cancer Methylome Shows Similar Hypo- and Hypermethylation at Conserved Tissue-specific CpG Island Shores. Nat. Genet. 41 (2), 178–186. doi:10.1038/ng.298
Jiang, Z., Liu, Z., Li, M., Chen, C., and Wang, X. (2018). Immunogenomics Analysis Reveals that TP53 Mutations Inhibit Tumor Immunity in Gastric Cancer. Transl. Oncol. 11 (5), 1171–1187. doi:10.1016/j.tranon.2018.07.012
Johnson, P. J. (2001). The Role of Serum Alpha-Fetoprotein Estimation in the Diagnosis and Management of Hepatocellular Carcinoma. Clin. Liver Dis. 5 (1), 145–159. doi:10.1016/S1089-3261(05)70158-6
Keijzers, G., Bakula, D., Petr, M., Madsen, N., Teklu, A., Mkrtchyan, G., et al. (2019). Human Exonuclease 1 (EXO1) Regulatory Functions in DNA Replication with Putative Roles in Cancer. Ijms 20 (1), 74. doi:10.3390/ijms20010074
Kretschmer, C., Sterner-Kock, A., Siedentopf, F., Schoenegg, W., Schlag, P. M., and Kemmner, W. (2011). Identification of Early Molecular Markers for Breast Cancer. Mol. Cancer 10 (1), 15. doi:10.1186/1476-4598-10-15
Krummel, M. F., and Allison, J. P. (1996). CTLA-4 Engagement Inhibits IL-2 Accumulation and Cell Cycle Progression upon Activation of Resting T Cells. J. Exp. Med. 183 (6), 2533–2540. doi:10.1084/jem.183.6.2533
Lee, B.-I., and Wilson, D. M. (1999). The RAD2 Domain of Human Exonuclease 1 Exhibits 5′ to 3′ Exonuclease and Flap Structure-specific Endonuclease Activities. J. Biol. Chem. 274 (53), 37763–37769. [Journal Article; Research Support, U.S. Gov't, Non-P.H.S.; Research Support, U.S. Gov't, P.H.S.]. doi:10.1074/jbc.274.53.37763
Li, M., Zhao, H., Zhang, X., Wood, L. D., Anders, R. A., Choti, M. A., et al. (2011). Inactivating Mutations of the Chromatin Remodeling Gene ARID2 in Hepatocellular Carcinoma. Nat. Genet. 43 (9), 828–829. doi:10.1038/ng.903
Li, S., Liu, M., Do, M. H., Chou, C., Stamatiades, E. G., Nixon, B. G., et al. (2020). Cancer Immunotherapy via Targeted TGF-β Signalling Blockade in TH Cells. Nature 587 (7832), 121–125. doi:10.1038/s41586-020-2850-3
Liu, J., Lichtenberg, T., Hoadley, K. A., Poisson, L. M., Lazar, A. J., Cherniack, A. D., et al. (2018). An Integrated TCGA Pan-Cancer Clinical Data Resource to Drive High-Quality Survival Outcome Analytics. Cell 173 (2), 400–e11. doi:10.1016/j.cell.2018.02.052
Long, G. V., Weber, J. S., Larkin, J., Atkinson, V., Grob, J.-J., Schadendorf, D., et al. (2017). Nivolumab for Patients with Advanced Melanoma Treated beyond Progression. JAMA Oncol. 3 (11), 1511. doi:10.1001/jamaoncol.2017.1588
Love, M. I., Huber, W., and Anders, S. (2014). Moderated Estimation of Fold Change and Dispersion for RNA-Seq Data with DESeq2. Genome Biol. 15 (12). doi:10.1186/s13059-014-0550-8
Lyu, H., Li, M., Jiang, Z., Liu, Z., and Wang, X. (2019). Correlate the TP53 Mutation and the HRAS Mutation with Immune Signatures in Head and Neck Squamous Cell Cancer. Comput. Struct. Biotechnol. J. 17, 1020–1030. doi:10.1016/j.csbj.2019.07.009
Muthuswami, M., Ramesh, V., Banerjee, S., Viveka Thangaraj, S., Periasamy, J., Bhaskar Rao, D., et al. (2013). Breast Tumors with Elevated Expression of 1q Candidate Genes Confer Poor Clinical Outcome and Sensitivity to Ras/PI3K inhibitionResearch Support, Non-U.S. Gov't]. J. Artic. One 8 (10), e77553. doi:10.1371/journal.pone.0077553
Schulze, K., Imbeaud, S., Letouzé, E., Alexandrov, L. B., Calderaro, J., Rebouissou, S., et al. (2015). Exome Sequencing of Hepatocellular Carcinomas Identifies New Mutational Signatures and Potential Therapeutic Targets. Nat. Genet. 47 (5), 505–511. doi:10.1038/ng.3252
Shannon, P., Markiel, A., Ozier, O., Baliga, N. S., Wang, J. T., and Ramage, D. (2003). Cytoscape: A Software Environment for Integrated Models of Biomolecular Interaction Networks. Genome Res. 13 (11), 2498–2504. [Journal Article; Research Support, Non-U.N. Amin, Schwikowski B., Ideker T. Research Support, U.S. Gov't, Non-P.H.S.; Research Support, U.S. Gov't, P.H.S.]. doi:10.1101/gr.1239303
Sia, D., Jiao, Y., Martinez-Quetglas, I., Kuchuk, O., Villacorta-Martin, C., Castro De Moura, M., et al. (2017). Identification of an Immune-specific Class of Hepatocellular Carcinoma, Based on Molecular Features. Gastroenterology 153 (3), 812–826. doi:10.1053/j.gastro.2017.06.007
Subramanian, A., Tamayo, P., Mootha, V. K., Mukherjee, S., Ebert, B. L., Gillette, M. A., et al. (2005). Gene Set Enrichment Analysis: A Knowledge-Based Approach for Interpreting Genome-wide Expression Profiles. Proc. Natl. Acad. Sci. U.S.A. 102 (43), 15545–15550. doi:10.1073/pnas.0506580102
Sung, H., Ferlay, J., Siegel, R. L., Laversanne, M., Soerjomataram, I., Jemal, A., et al. (2021). Global Cancer Statistics 2020: GLOBOCAN Estimates of Incidence and Mortality Worldwide for 36 Cancers in 185 Countries. CA A Cancer J. Clin. 71 (3), 209–249. doi:10.3322/caac.21660
Szklarczyk, D., Gable, A. L., Lyon, D., Junge, A., Wyder, S., Huerta-Cepas, J., et al. (2019). STRING V11: Protein-Protein Association Networks with Increased Coverage, Supporting Functional Discovery in Genome-wide Experimental Datasets. Nucleic Acids Res. 47 (D1), D607–D613. doi:10.1093/nar/gky1131
Tishkoff, D. X., Amin, N. S., Viars, C. S., Arden, K. C., and Kolodner, R. D. (1998). Identification of a Human Gene Encoding a Homologue of Saccharomyces cerevisiae EXO1, an Exonuclease Implicated in Mismatch Repair and Recombination. Cancer Res. 58 (22), 5027–5031. [Journal Article; Research Support, U.S. Gov't, P.H.S.].
Tomimatsu, N., Mukherjee, B., Deland, K., Kurimasa, A., Bolderson, E., Khanna, K. K., et al. (2012). Exo1 Plays a Major Role in DNA End Resection in Humans and Influences Double-Strand Break Repair and Damage Signaling Decisions. DNA Repair 11 (4), 441–448. doi:10.1016/j.dnarep.2012.01.006
Torre, L. A., Bray, F., Siegel, R. L., Ferlay, J., Lortet-Tieulent, J., and Jemal, A. (2015). Global Cancer Statistics, 2012. CA A Cancer J. Clin. 65 (2), 87–108. doi:10.3322/caac.21262
Waidmann, O. (2018). Recent Developments with Immunotherapy for Hepatocellular Carcinoma. Expert Opin. Biol. Ther. 18 (8), 905–910. doi:10.1080/14712598.2018.1499722
Wang, X., and Sun, Q. (2017). TP53 Mutations, Expression and Interaction Networks in Human Cancers. J. Artic. 8 (1), 624–643. doi:10.18632/oncotarget.13483
Wilson, D. M., Coleman, M. A., Adamson, A. W., Christensen, M., Lamerdin, J. E., and Carney, J. P. (1998). Hex1: a New Human Rad2 Nuclease Family Member with Homology to Yeast Exonuclease 1. Nucleic Acids Res. 26 (16), 3762–3768. Journal Article; Research Support, U.S. Gov't, Non-P.H.S.; Research Support, U.S. Gov't, P.H.S.]. doi:10.1093/nar/26.16.3762
Xiao, W., Du, N., Huang, T., Guo, J., Mo, X., Yuan, T., et al. (2018). TP53 Mutation as Potential Negative Predictor for Response of Anti-CTLA-4 Therapy in Metastatic Melanoma. EBioMedicine 32, 119–124. doi:10.1016/j.ebiom.2018.05.019
Keywords: Exo1, hepatocellular carcinoma, clinical outcome, immune cell infiltration, immune checkpoints, DNA methylation, genetic alterations, TP53
Citation: Ma J, Jin J, Lu H, Zhang J, Li Y and Cai X (2022) Exonuclease 1 is a Potential Diagnostic and Prognostic Biomarker in Hepatocellular Carcinoma. Front. Mol. Biosci. 9:889414. doi: 10.3389/fmolb.2022.889414
Received: 04 March 2022; Accepted: 25 April 2022;
Published: 13 June 2022.
Edited by:
Hem Chandra Jha, Indian Institute of Technology Indore, IndiaReviewed by:
Weiqi Rong, Chinese Academy of Medical Sciences and Peking Union Medical College, ChinaGuohua Zeng, First Affiliated Hospital of Guangzhou Medical University, China
Copyright © 2022 Ma, Jin, Lu, Zhang, Li and Cai. This is an open-access article distributed under the terms of the Creative Commons Attribution License (CC BY). The use, distribution or reproduction in other forums is permitted, provided the original author(s) and the copyright owner(s) are credited and that the original publication in this journal is cited, in accordance with accepted academic practice. No use, distribution or reproduction is permitted which does not comply with these terms.
*Correspondence: Xuefei Cai, Y2FpeHVlZmVpQGNxbXUuZWR1LmNu