 Yijun Xia
 Youbin Wang2*
 Yingjie Xiao
94% of researchers rate our articles as excellent or good
Learn more about the work of our research integrity team to safeguard the quality of each article we publish.
Find out more
ORIGINAL RESEARCH article
Front. Mol. Biosci., 20 May 2022
Sec. Molecular Diagnostics and Therapeutics
Volume 9 - 2022 | https://doi.org/10.3389/fmolb.2022.879461
This article is part of the Research TopicFibrotic Tissue Remodeling as a Driver of Disease PathogenesisView all 8 articles
Background: Keloid disorder is a recurrent fibroproliferative cutaneous tumor. Due to the lack of early identification of keloid patients before the formation of keloids, it is impossible to carry out pre-traumatic intervention and prevention for these patients. This led us to identify and determine signatures with diagnostic significance for keloids.
Methods: Public series of matrix files were downloaded from the Gene Expression Omnibus database. Differentially expressed genes (DEGs) were calculated from expression profiling data, and the diagnostic signature was identified by constructing a protein-protein interaction (PPI) network. The diagnostic efficacy of the screened signature was assessed by employing receiver operating characteristic (ROC) curves. Furthermore, we calculated the proportion of different immune cells in the gene expression matrix microenvironment by the “ssGSEA” algorithm, and assessed the difference in immune cell abundance between keloids and control groups and the relationship between the signature and immune cell infiltration. Clinical keloid and normal skin tissues were collected, and the expression of the screened diagnostic signature was validated by RT-qPCR and immunohistochemical assay.
Results: By screening the key genes in PPI, TGM2 was recognized and validated as a diagnostic signature and the infiltrating abundance of 10 immune cells was significantly correlated with TGM2 expression. Gene ontology enrichment analysis demonstrated that TGM2 and molecules interacting with it were mainly enriched in processes involving wound healing and collagen fiber organization. TGM2 correlated positively with HIF-1A (R = 0.82, p-value = 1.4e-05), IL6 (R = 0.62, p-value = 0.0053), and FN1 (R = 0.66, p-value = 0.0019). Besides, TGM2 was significantly upregulated in clinical keloid samples compared to normal skin tissues.
Conclusion: TGM2 may serve as an auxiliary diagnostic indicator for keloids. However, the role of TGM2 in keloids has not been adequately reported in the current literature, which may provide a new direction for molecular studies of keloids.
Keloid disorder is a manifestation of excessive healing after skin injury, characterized by abnormal proliferation of fibroblasts and deposition of extracellular matrix, and is common in plastic surgery (Grabowski et al., 2020). Keloids are more frequent on some exposed parts of the skin with pain and itching, and improper care can induce infection and septicemia, causing considerable physical and psychological stress to the patient (Lee et al., 2019). However, the current diagnoses of keloids primarily rely on the clinical manifestations and associated scar scales. Patients with a tendency to develop keloids can be diagnosed only after the formation of keloids after surgery or trauma, which notably impacts the risks and efficacy of open surgery. Therefore, it is urgent to search for reliable diagnostic indicators for early screening and prevention of keloids to avoid unnecessary surgical stimulations.
Gene sequencing is able to determine the exact relationships among some gene loci and diseases, which has guiding significance for clinical diagnosis and treatment (Horgan et al., 2017). The advances in bioinformatics provide the ability to assist the secondary utilization of existing sequencing data, fully mine the information that is provided by the sequencing data, and identify the biomarkers for a variety of diseases (Min et al., 2017). As a highly recurrent fibrous proliferative tumor, in the absence of satisfactory drug and surgical treatment, the identification of early indicative biomarkers in keloid is of key significance for effective prevention, risk reduction and development of targeted therapy. At present, the identification of keloid biomarkers mostly relies on the reference of other fibrosis diseases, such as studying the role of scleroderma biomolecules in keloids. However, the efficiency of this method is relatively low, and it is prone to omit the specific markers of keloids. We thus utilized gene sequencing datasets and bioinformatics methods to filter keloid markers in the expectation of more efficient identification of key signatures of keloids.
In this study, public series of matrix files for keloids were downloaded from the Gene Expression Omnibus (GEO) database. Pivotal molecules were screened based on the PPI network and the diagnostic efficacy of the screening signature was validated by applying receiver operating characteristic (ROC) curves, and the association of the filtered signature with immune cell infiltration was evaluated to gain more insight into the molecular immune mechanisms involved in keloids.
The keloid matrix files that are freely available in the Gene Expression Omnibus (GEO) database were filtered with the organization as “Homo sapiens” and study type as “Expression profiling by array” or “Expression profiling by high throughput sequencing” as the restriction conditions (Wang et al., 2019). We filtered three different microarray and RNA-seq datasets with accession numbers GSE7890, GSE145725 and GSE117887 (Table 1). The “GEOquery” package of R software (version 3.6.3, R Foundation) was applied to download the series of matrix and probe annotation files (Davis and Meltzer 2007) and the annotation information was extracted through the “affy” package to complete the conversion of probe names to gene symbols (Gautier et al., 2004). The RMA algorithm was employed to perform background corrections to exclude the probe signals from being altered by some nonspecific factors.
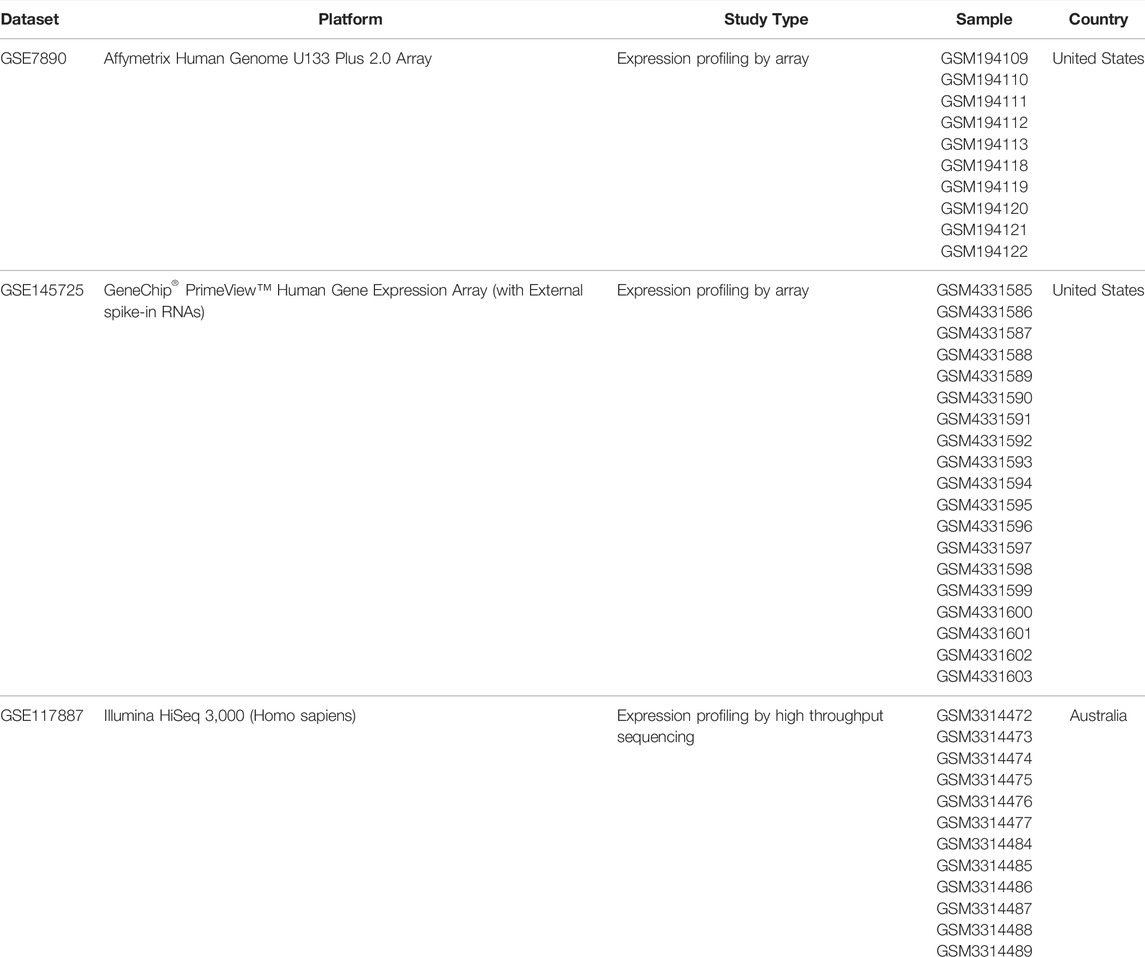
TABLE 1. Overview of the datasets used in this study.
RNA-seq datasets and microarray based on gene expression analysis are sensitive methods to identify possible genes and molecular pathways. Since the data came from different sources, we preprocessed our data through Z-score transformation and adopted log2 transformation to alleviate the influence of outliers. The algorithm of the “limma” package (http://www.bioconductor.org/) was adopted to extract the differential genes from the expression profiles (Ritchie et al., 2015) and P.value <0.05 and |log fold change (FC)| >2 were considered to be the threshold points to filter the genes that were significantly differentially expressed in keloids (Ito and Murphy 2013).
In the STRING (http://string-db.org/) database, the “Multiple Proteins” model was used to construct a protein–protein interaction (PPI) network of genes differentially expressed in both GSE7890 and GSE145725 to demonstrate the links between genes (Szklarczyk et al., 2017). The molecules of the protein network were ranked for connectivity in Cytoscape software and the highest ranked molecule was selected as the key molecule.
The GeneMANIA database was employed to construct a network of interacting proteins with the screened signature (Warde-Farley et al., 2010). To provide additional insights into the biological significance of gene expression differences and the mechanisms that contribute to keloid traits, we performed gene ontology (GO) enrichment analysis of the screened signature and its interacting genes to predict possible involvements in cellular components, molecular functions and biological processes.
To investigate the possible molecular mechanism of the screened signature in keloid, we conducted correlation analysis between the screened signature and the widely studied molecules and recognized signaling pathways in keloids. Gene sets involved in extracellular matrix (ECM) formation, collagen formation, hypoxia and epithelial mesenchymal transition (EMT), and the TGF-beta signaling pathway were obtained in the molecular signatures database (MSigDB) (Liberzon et al., 2015), and correlations between these molecules and the screened signature were visualized by radar plots and scatter plots.
Keloids consist not only of abnormally proliferating fibroblasts but also consist of different cell types, including matrix cells and immune cells, which form the microenvironment of keloids. This led us to compute the proportion of different immune cells in the gene expression matrix microenvironment through the “ssGSEA” algorithm (Subramanian et al., 2005; Bindea et al., 2013) and to evaluate the difference in immune cell abundance between keloid and normal skin and the relationship between the screened signature and immune cell infiltration.
The difference in the expression of the filtered diagnostic signature between keloid and non-keloid was verified in GSE7890, GSE145725 and GSE117887. The receiver operating characteristic (ROC) curve was poltted with the R software “pROC” package (Mandrekar 2010) and the area under the curve (AUC) was calculated to reflect the predictive abilities of the screened signature in GSE7890, GSE145725 and GSE117887 (Robin et al., 2011).
The study protocol was approved by the Bioethical Committee of Peking Union Medical College Hospital. Fifteen keloid samples and five normal skin samples were randomly collected from Department of Plastic Surgery at Peking Union Medical College Hospital. Samples were frozen immediately after leaving the body and kept at -80°C. Total RNA was extracted from samples by a Tissue RNA Kit (G3013, Servicebio). RNA was reverse-transcribed into cDNA using Servicebio®RT First Strand cDNA Synthesis Kit (G3330, Servicebio). The sequences of primer pairs used in the study are shown in Table 2. Real-time qPCR was performed using the SYBR Green qPCR Master Mix (2X) (G3320, Servicebio). Real-time qPCR cycle parameters included initial denaturation at 95°C for 10 min followed by 40 cycles involving denaturation at 95°C for 15 s, annealing at 60°C for 30 s, and extension at 60°C for 30 s. Each sample was tested thrice within the same run. PCR data were normalized using the 2−ΔΔCT method; Glyceraldehyde 3-phosphate dehydrogenase (GAPDH) was used as internal reference for mRNA expression.

TABLE 2. Primers and their sequences for Quantitative RT-PCR analysis.
Eight cases of formalin-fixed, paraffin-embedded keloid tissue and eight cases of normal skin tissue were collected. According to the streptavidin-biotin-peroxidase complex procedure, keloid tissue sections were dewaxed and rehydrated with xylene and different concentrations of ethanol, and the pretreatment of keloid sections was completed. The primary antibody working solution was incubated at 37°C overnight at 4°C. Biotin-labeled secondary antibodies were incubated at 37°C for 30 min. An appropriate amount of alkaline phosphatase-labeled streptavidin working solution was added and incubated at 37°C for 30 min. Sections were re-stained, dehydrated and sealed. TGM2 antibody (dilution = 1:250, ab109200, Abcam, Cambridge, United Kingdom) was used to detect TGM2 expression. Quantitative results were obtained using ImageJ (version 1.8.0) to calculate the integrated optical density (IOD) of positive markers.
All statistical analyses were performed in R software (version 4.1.2) with a two-tailed p-value < 0.05 as statistically significant. Pearson analysis was employed to assess correlations between gene expression values, and between gene expression and immune cell scores. Continuous variables between keloid and control groups were compared using the Mann-Whitney U-test. Receiver operating characteristic (ROC) curves were adopted to estimate the predictive value of the screened signature in keloid patients, and the value of the area under the curve (AUC) was taken to express the diagnostic efficacy of the screened signature.
The process of screening signatures is shown in Figure 1. We downloaded the gene expression microarray and RNA-seq from the GEO database (Table 1) and completed the annotation of gene symbols and clinical grouping information in the R software package. The DEGs in the GSE7890 and GSE145725 datasets were extracted by the " limma” package (Figure 2), and 23 intersecting genes were obtained as illustrated in the venn diagram.
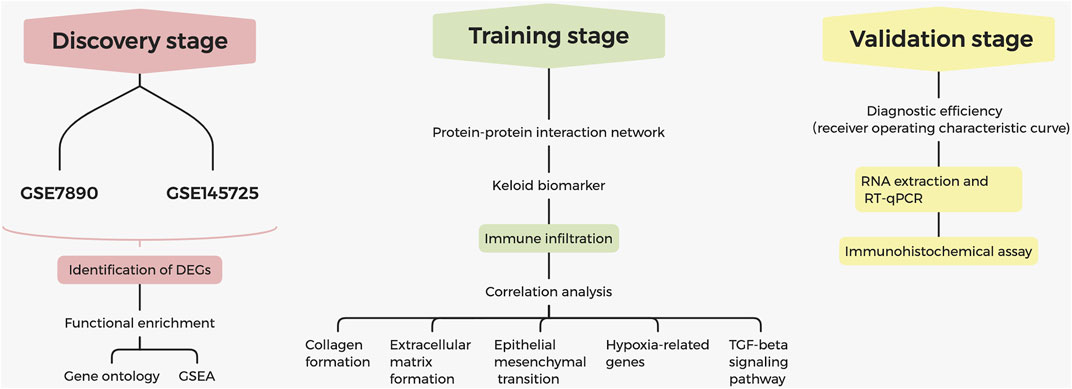
FIGURE 1. Flowchart for identification of diagnostic signatures in keloids.
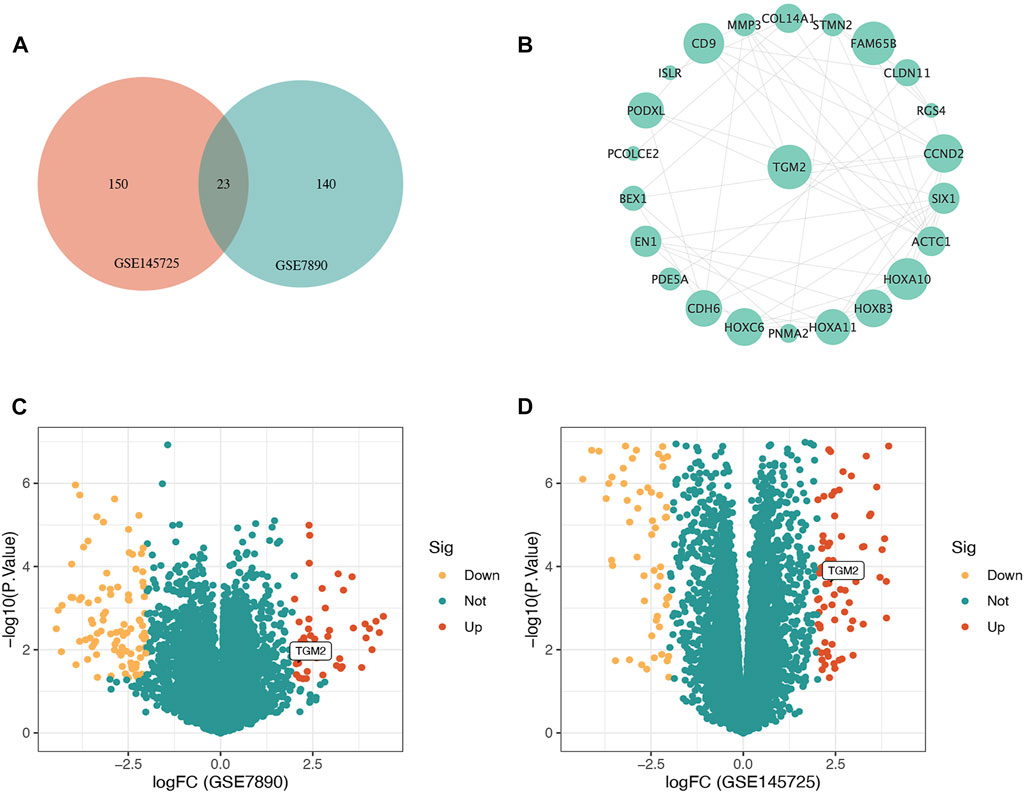
FIGURE 2. Illustration of the identification of the hub gene in keloid. (A) Venn diagram demonstrating the intersection of differentially expressed genes (DEGs) in GSE7890 and GSE145725. (B) Protein-protein interaction network constructed based on STRING database and Cytoscape software for DEGs shared by GSE7890 and GSE145725, and TGM2 with the highest connectivity was selected as the key gene. (C) Volcano map of DEGs of the GSE7890 dataset. (D) Volcano map of DEGs of the GSE145725 dataset. Red represents up-regulated genes, green represents non-significant genes, and yellow represents down-regulated genes.
A protein-protein interaction network of genes differentially expressed in both GSE7890 and GSE145725 datasets was constructed in the STRING database and imported into Cytoscape software. The gene with the highest connectivity to neighboring genes was screened as the key gene, namely TGM2 (Figure 2B).
A protein network interacting with TGM2 was achieved through bioinformatics approaches based on physical interaction, co-expression, co-localization, pathway, prediction and genetic interactions (Figure 3A). Based on the results of the enrichment scores, DEGs may be associated with the regulation of wounding (Figure 3B). GO enrichment analysis demonstrated that TGM2 and molecules interacting with it were mainly enriched in processes involving wound healing, collagen fiber organization, myofibril assembly, regulation of vasoconstriction, and blood vessel diameter maintenance (Figure 3C).
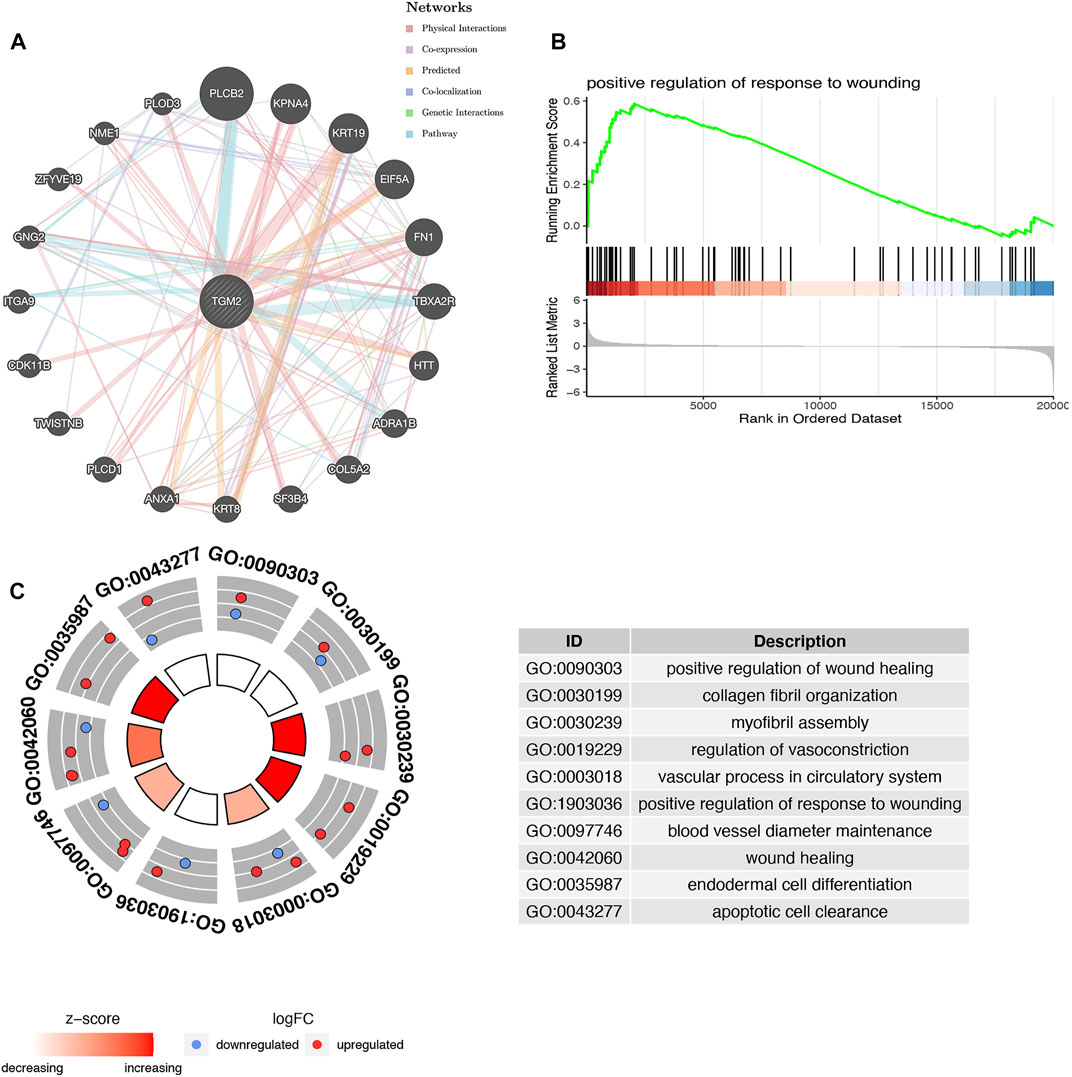
FIGURE 3. Functional prediction of TGM2. (A) Interaction network of TGM2 and its possible related genes was constructed in the GeneMANIA database. (B) Enrichment analyses of differentially expressed genes via gene set enrichment analysis. (C) Biological function prediction of TGM2 and its related genes based on gene ontology enrichment analysis.
Single sample gene set enrichment analysis (ssGSEA) was performed to analyze the GSE145725 dataset and revealed the infiltration of 28 immune cell subpopulations in keloids (Figure 4), with central memory CD4 T cell scoring highest among the immune cells. The results identified significant differences in the proportion of eight immune cell types in keloid and non-keloid tissues, namely activated CD4 T cell, activated CD8 T cell, effector memory CD4 T cell, immature dendritic cell, MDSC, monocyte, neutrophil and T follicular helper cell. The infiltrating abundance of 10 immune cells was significantly correlated with TGM2 expression, among which activated B cell and activated CD8 T cell were negatively correlated with TGM2.
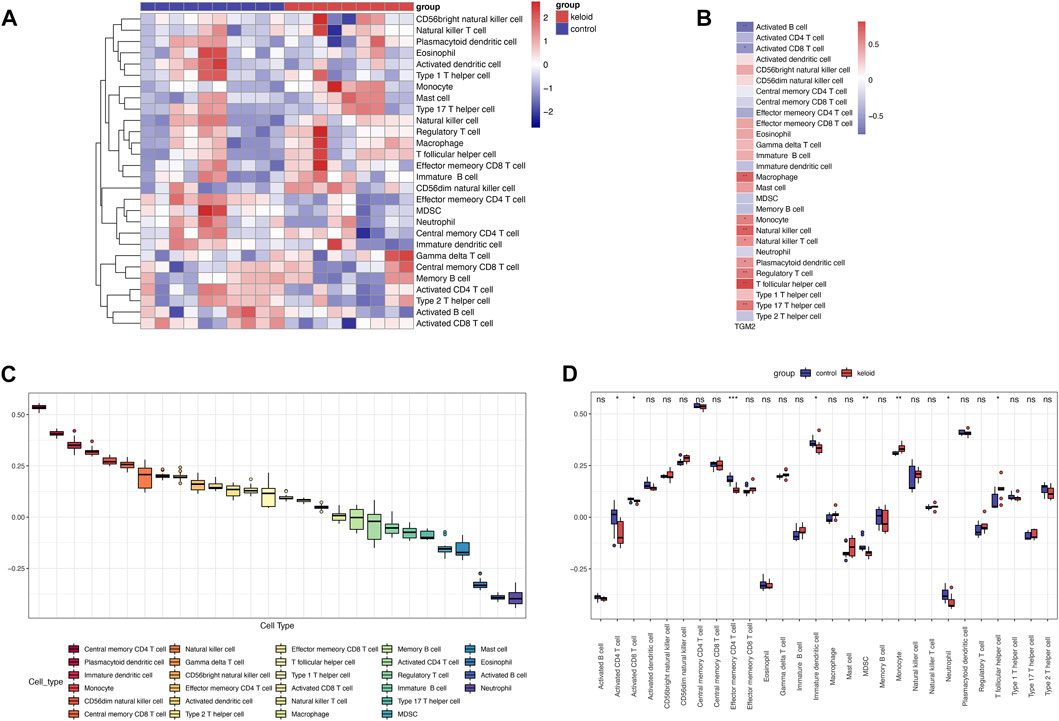
FIGURE 4. Evaluation and visualization of immune cell infiltration. (A) Heatmap of immune cells in keloid and control groups via single-sample gene set enrichment analysis in GSE145725 dataset (n = 19). (B) Correlation analysis of TGM2 expression with immune cell infiltration in the GSE145725 dataset. (C) Ranking of immune cell scores in the GSE145725 dataset. (D) Variation of immune cell scores between keloid and control groups in the GSE145725 dataset. *p < 0.05; **p < 0.01; ***p < 0.001; ****p < 0.0001. ns, not significant.
To investigate the possible molecular mechanism of TGM2 in keloids, we selected key molecules involved in extracellular matrix formation, collagen formation, hypoxia and epithelial mesenchymal transition to conduct correlation analysis with TGM2 in the GSE145725 dataset (Figure 5). TGM2 correlated positively with HIF-1A (R = 0.82, p-value = 1.4e-05), IL6 (R = 0.62, p-value = 0.0053), and FN1 (R = 0.66, p-value = 0.0019). Subsequently, we analyzed the correlation between TGM2 and the TGF-beta signaling pathway in keloids (Figure 6). TGM2 was positively correlated with TGFBR2 (R = 0.81, p-value = 3.1e-05) and SMAD2 (R = 0.56, p-value = 0.013), and significantly negatively correlated with SMAD4 (R = -0.46, p-value = 0.047) and TGFB2 (R = -0.85, p-value < 2.2e-16).
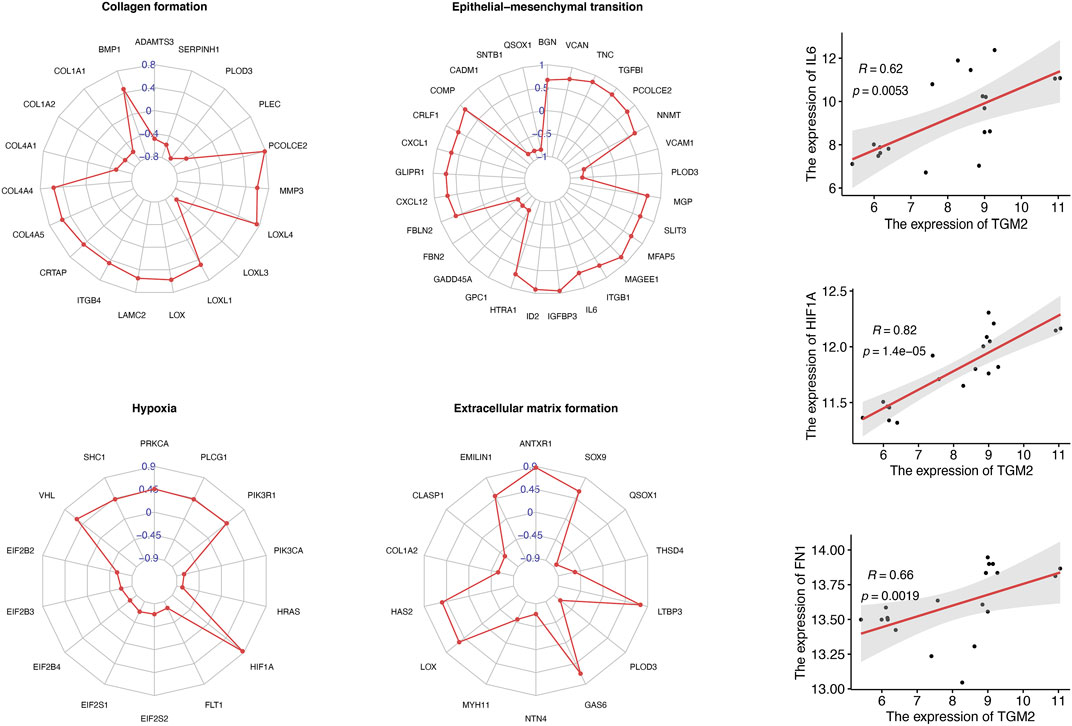
FIGURE 5. Correlation analysis of TGM2 and keloid-associated genes. Radar plots summarized the genes associated with TGM2 in the gene sets of collagen formation, epithelial mesenchymal transition, hypoxia and extracellular matrix formation. Correlation coefficients between TGM2 and keloid-associated genes were indicated in blue. Scatter plots demonstrated significant positive correlations between TGM2 and interleukin 6 (IL6), hypoxia inducible factor 1 subunit alpha (HIF1A), and fibronectin 1 (FN1).
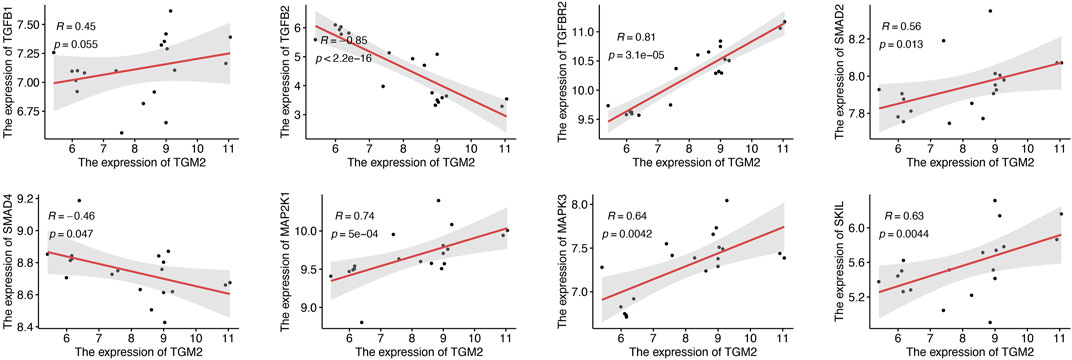
FIGURE 6. Correlation analysis of TGM2 and the TGF-beta signaling pathway in keloids. The scatter plots illustrated the molecules that were significantly correlated with TGM2. Due to the important role of TGF-β1 in the TGF-beta signaling pathway, the scatter plot of the correlation between TGF-β1 and TGM2 was retained.
ROC curves indicated that the AUC values of TGM2 in GSE7890, GSE145725 and GSE117887 were 0.840, 0.922 and 1.000, respectively, indicating that TGM2 has a robust performance in the diagnosis of keloids (Figure 7). In addition, we detected TGM2 expression in clinical keloid tissues via RT-qPCR and IHC (Figure 8). The results revealed that the expression of TGM2 was significantly increased in keloid tissues compared with the corresponding normal skin tissues.
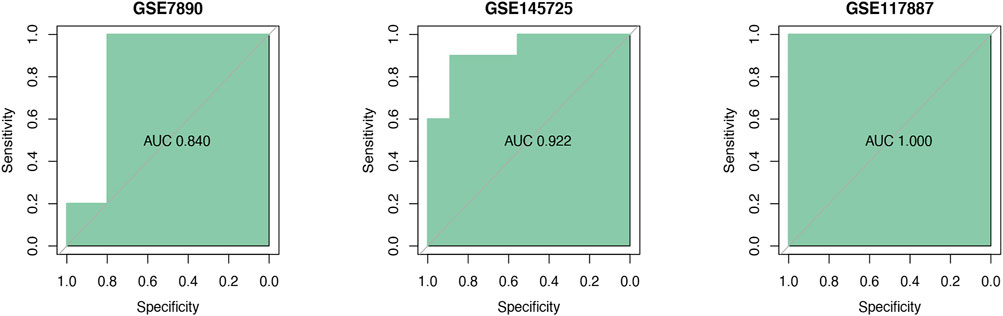
FIGURE 7. Verification of the diagnostic signature. The diagnostic efficacy of filtered TGM2 was verified by ROC curves in three datasets GSE7890 (n = 10), GSE145725 (n = 19), and GSE117887 (n = 12).
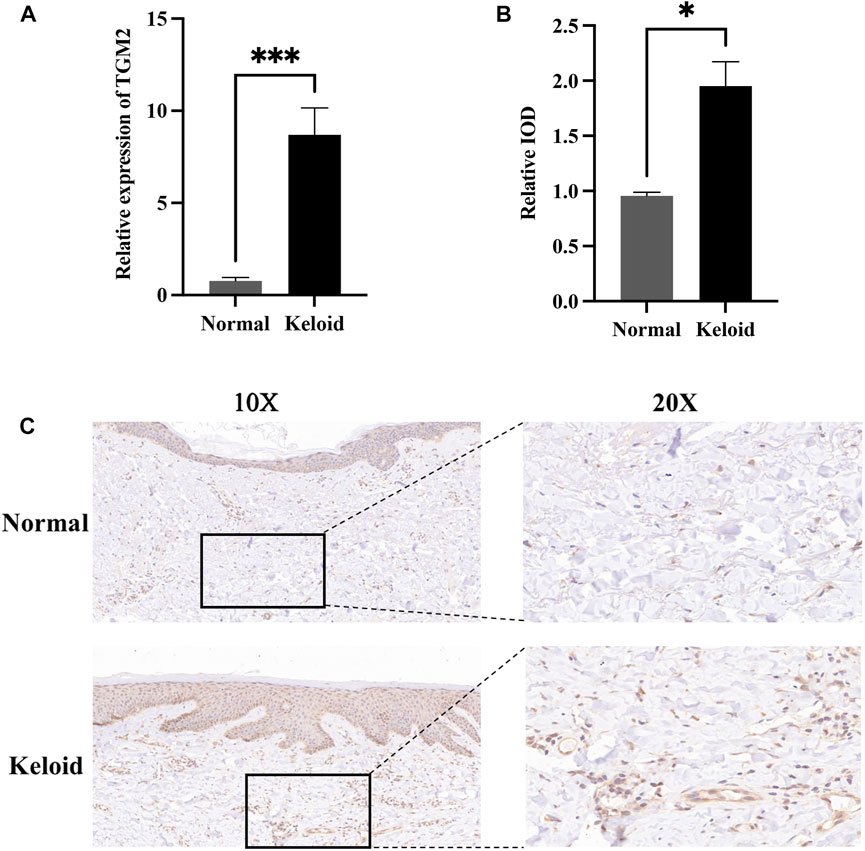
FIGURE 8. Expression of TGM2 in keloids and normal skin tissues. (A) The expression of TGM2 in keloid tissues confirmed by RT-qPCR. The expression of TGM2 mRNA in keloids was significantly higher than that in normal skin tissues (P.value = 0.0003). (B) The relative IOD (integrated optical density) value of TGM2 in keloids and normal skin tissues. (C) Immunohistochemical staining of TGM2 in keloids and normal skin tissues.
Keloid disorder is very common in the clinical work of plastic surgery, yet due to the lack of clear pathogenesis and effective treatment measures, it is a refractory disease (Lee and Jang 2018). Pathologically, keloids have tumor-like growth characteristics, which chiefly manifest as excessive fibrosis that is provoked by continuous inflammation, vigorous cell proliferation, and excessive accumulation of the extracellular matrix (Tan et al., 2019). Clinically, keloids have individual tendencies, and they are liable to occur in exposed areas such as the sternum, scapula, and earlobe and are accompanied by pain and itching (Lee et al., 2004). The formation of postoperative keloids can have some negative and even devastating consequences for cosmetic surgery due to the lack of effective laboratory indicators to screen susceptible individuals. The current diagnosis of keloids relies heavily on clinical presentation, which is highly subjective and uncertain and does not provide prevention or early diagnosis (Berman et al., 2017). We aimed to discover diagnostic markers of keloids that could objectively assess the physiological status of patients and evaluate whether they have a tendency to develop keloids. This will facilitate early screening, diagnosis and prevention of keloid scars, and early control of keloid growth can lead to significant clinical outcomes.
This study identified TGM2 as a key molecule in keloids. Previous studies have suggested that keloids are closely associated with a sustained inflammatory response and infiltration of inflammatory factors and chemokines (Wang et al., 2020c). Accompanied by activation of inflammatory factors like interleukin six and infiltration of neutrophils, the perivascular dermis appears to have nodular proliferation of fibroblasts and excessive deposition of extracellular matrix (Potter et al., 2019; Wang et al., 2020c). The arrangement is intricately followed by the formation of a mass of rotating collagen fibers, which eventually leads to keloids (Andrews et al., 2016; Chen et al., 2019). This process is consistent with the results of the correlation analysis of TGM2 with extracellular matrix gene set and IL6 in this paper.
Considering that certain autoimmune diseases can result in tissue damage by initiating an inflammatory response, a long-term inflammatory response eventually leads to tissue fibrosis, such as skin fibrosis induced by scleroderma (Wynn and Ramalingam 2012; Sziksz et al., 2015; Sunda and Arowolo 2020). Therefore, we speculated that keloids might be related to immune infiltration and supplemented the comparison of keloids and normal tissues at the level of immune cells. The results of immune infiltration analysis indicated that the screened TGM2 was positively correlated with monocyte and natural killer cell. There were significant differences in the proportion of eight immune cells in keloid and non-keloid tissues, which was consistent with previous studies (Bagabir et al., 2012; Wang et al., 2021).
Currently, the exploration of biomarkers in the field of keloids is generally derived from speculation of similar diseases. By way of example, since keloids have to some extent tumor characteristics, it is speculated that some tumor biomarkers may also be exploited as keloid markers (Gál et al., 2017; Ud-Din and Bayat 2020). The genes that control apoptosis and growth in some tumors may regulate the occurrence of keloids. For example, the tumor necrosis factor-related apoptosis-inducing ligand (TRAIL), which is differentially expressed in a variety of malignant tumors, such as lymphoma, bladder cancer, melanoma, and esophageal cancer, is capable of exerting a selective apoptotic effect (Fulda 2014; Alexiou et al., 2015). It has been confirmed that knocking down the expression of TRAIL aggravates the fibrosis of lung tissue, and upregulating TRAIL causes skin fibrosis to be considerably inhibited (Braithwaite et al., 2018; Jiang et al., 2019). Mutations in the oncogene PTEN (phosphatase and tensin homolog deleted on chromosome ten) are detected in hematological tumors, brain gliomas, osteosarcoma and many other tumors and can be the target for microRNA-21–5p to reduce the migration of keloid fibroblasts and govern autophagy (Worby and Dixon 2014; Chen et al., 2018; Yan et al., 2020). Further, some scholars have also postulated key genes in keloids based on liver injury, muscle injury, scleroderma, cardiac hypertrophy, and other diseases with similar fibrotic processes. For example, fussel-15 has the ability to regulate the fibroblasts of keloids and scleroderma (Arndt et al., 2011); microRNA-29 influences the fibrosis process of various organs, such as the heart, liver, lung and the growth of keloids (Deng et al., 2017; Gallant-Behm et al., 2019; Xu et al., 2020). Although some crucial genes in keloid can be revealed according to the above-mentioned ideas, their screening efficiency is relatively low and not accurate enough. Based on sequencing data and bioinformatics methods, the identification of possible biomolecules for diseases including keloid is more accurate and reliable, and more efficient.
TGM2 belongs to the TGM protein family, which consists of structural and functional enzymes and participates in the posttranscriptional modification process of proteins by inducing cross-linking, transamination and deamination between proteins (Li et al., 2018; Lee et al., 2021). TGM2 participates in many pathological reactions, including inflammation, chemotaxis of inflammatory factors, tumor progression, wound healing, tissue fibrosis, and immune diseases (Cho et al., 2020). The members of this family exhibit a variety of enzyme activities, such as protein kinase, GTPase and ATPase activities, disulfide isomerase activity, and participate in cell adhesion.
Keloids are the consequence of a series of intertwined pathological processes consisting of excessive fibroblast proliferation, extracellular matrix deposition, and dysregulated modulation of cell migration. TGM2 has been reported to regulate cell cycle protein expression levels in the tumor microenvironment to aid cell cycle progression and facilitate fibroblast proliferation (Nadalutti et al., 2011; Lee et al., 2015). The transamidase activity of TGM2 contributes to the maturation and stability of collagen and extracellular matrix by cross-linking with extracellular matrix proteins and is involved in wound healing and fibrosis in various tissues, such as scar tissue, liver and heart (Wang et al., 2020a; Wang et al., 2020b). During collagen lattice formation, TGM2 plays a dominant role in the initial formation of calcium-dependent morphology and is involved in early extracellular matrix formation (Li et al., 2018). In many tumors with high metastatic potential, TGM2 expressed above basal levels is found to be associated with loss of cell polarity and disruption of cell junctions, which makes epithelial cells motile and invasive (Pierce et al., 2013; Eckert et al., 2014). The action process of TGM2 is closely connected with the various stages of tumor growth, including the epithelial-mesenchymal transition, apoptosis, differentiation, and aggressive metastatic phenotype formation of cancer stem cells. TGM2 regulates the angiogenesis of digestive system tumors through the WntB-catenin pathway and interferes with the apoptosis of colon cancer cells (Zhang and McCarty 2017; Torres et al., 2019). TGM2 is overexpressed in esophageal adenocarcinoma and attaches to tumor staging (Leicht et al., 2014). Although the study of TGM2 in keloid pathogenesis lacks in-depth research, it is reasonable to believe that TGM2 is a very promising mechanistic molecule in keloids based on its regulation of fibroblast and extracellular matrix in tumors.
This study finally identified TGM2 as a promising biomolecule in keloids. However, the limitations of this study must be acknowledged. On the one hand, this is a retrospective study of expression profiling data. It is undeniable that age, gender, and race are important influencing factors in the development of keloids. The correlation between keloid biomarkers and these factors still needs to be elucidated by large sample and multicenter studies, which is a very promising research direction. On the other hand, the analysis of immune infiltration is based on limited genetic data. Therefore, it may deviate from the interactions of immune cells in specific diseases, disease-induced disorders or the actual situations of individuals, and further molecular experiments are necessary for verification.
TGM2 may be able to act as an auxiliary diagnostic indicator for keloids. TGM2 has been confirmed in previous studies to be associated with fibrosis and tumorigenesis; however, the role of TGM2 in keloids has not been adequately reported. Therefore, TGM2 may be developed as a new research hotspot and target for the prevention, diagnosis and treatment of keloids.
The datasets presented in this study can be found in online repositories. The names of the repository/repositories and accession number(s) can be found in the article.
The studies involving human participants were reviewed and approved by Bioethical Committee of Peking Union Medical College Hospital. The patients/participants provided their written informed consent to participate in this study.
YXia and YW conceived and designed the study; YXia and YXiao performed the computational analyses and wrote the draft manuscript; YH and LZ helped in the preparation of the tables and figures. MS was involved in the preparation of the important intellectual content and critical revision; MS supervised the whole study. All authors approved the final version for submission.
This study was supported by The National Natural Science Foundation of China (81871538) and Beijing Municipal Commission of Science and Technology (Z191100006619009).
The authors declare that the research was conducted in the absence of any commercial or financial relationships that could be construed as a potential conflict of interest.
All claims expressed in this article are solely those of the authors and do not necessarily represent those of their affiliated organizations, or those of the publisher, the editors and the reviewers. Any product that may be evaluated in this article, or claim that may be made by its manufacturer, is not guaranteed or endorsed by the publisher.
The authors thank the GEO database for providing open-source data and R software for computing support.
Alexiou, G. A., Tsamis, K. I., and Kyritsis, A. P. (2015). Targeting Tumor Necrosis Factor-Related Apoptosis-Inducing Ligand (TRAIL): A Promising Therapeutic Strategy in Gliomas. Semin. Pediatr. Neurol. 22, 35–39. doi:10.1016/j.spen.2014.12.002
Andrews, J. P., Marttala, J., Macarak, E., Rosenbloom, J., and Uitto, J. (2016). Keloids: The Paradigm of Skin Fibrosis - Pathomechanisms and Treatment. Matrix Biol. 51, 37–46. doi:10.1016/j.matbio.2016.01.013
Arndt, S., Schmidt, J., Wacker, E., Karrer, S., and Bosserhoff, A.-K. (2011). Fussel-15, a New Player in Wound Healing, Is Deregulated in Keloid and Localized Scleroderma. Am. J. Pathol. 178, 2622–2631. doi:10.1016/j.ajpath.2011.02.009
Bagabir, R., Byers, R. J., Chaudhry, I. H., Müller, W., Paus, R., and Bayat, A. (2012). Site-specific Immunophenotyping of Keloid Disease Demonstrates Immune Upregulation and the Presence of Lymphoid Aggregates. Br. J. Dermatol. 167, 1053–1066. doi:10.1111/j.1365-2133.2012.11190.x
Berman, B., Maderal, A., and Raphael, B. (2017). Keloids and Hypertrophic Scars: Pathophysiology, Classification, and Treatment. Dermatol. Surg. 43 Suppl 1 (Suppl. 1), S3–s18. doi:10.1097/DSS.0000000000000819
Bindea, G., Mlecnik, B., Tosolini, M., Kirilovsky, A., Waldner, M., Obenauf, A. C., et al. (2013). Spatiotemporal Dynamics of Intratumoral Immune Cells Reveal the Immune Landscape in Human Cancer. Immunity 39, 782–795. doi:10.1016/j.immuni.2013.10.003
Braithwaite, A. T., Marriott, H. M., and Lawrie, A. (2018). Divergent Roles for TRAIL in Lung Diseases. Front. Med. 5, 212. doi:10.3389/fmed.2018.00212
Chen, C.-Y., Chen, J., He, L., and Stiles, B. L. (2018). PTEN: Tumor Suppressor and Metabolic Regulator. Front. Endocrinol. 9, 338. doi:10.3389/fendo.2018.00338
Chen, Y., Jin, Q., Fu, X., Qiao, J., and Niu, F. (2019). Connection between T Regulatory Cell Enrichment and Collagen Deposition in Keloid. Exp. Cel Res. 383, 111549. doi:10.1016/j.yexcr.2019.111549
Cho, S.-Y., Oh, Y., Jeong, E. M., Park, S., Lee, D., Wang, X., et al. (2020). Amplification of Transglutaminase 2 Enhances Tumor-Promoting Inflammation in Gastric Cancers. Exp. Mol. Med. 52, 854–864. doi:10.1038/s12276-020-0444-7
Davis, S., and Meltzer, P. S. (2007). GEOquery: a Bridge between the Gene Expression Omnibus (GEO) and BioConductor. Bioinformatics 23, 1846–1847. doi:10.1093/bioinformatics/btm254
Deng, Z., He, Y., Yang, X., Shi, H., Shi, A., Lu, L., et al. (2017). MicroRNA-29: A Crucial Player in Fibrotic Disease. Mol. Diagn. Ther. 21, 285–294. doi:10.1007/s40291-016-0253-9
Eckert, R. L., Kaartinen, M. T., Nurminskaya, M., Belkin, A. M., Colak, G., Johnson, G. V. W., et al. (2014). Transglutaminase Regulation of Cell Function. Physiol. Rev. 94, 383–417. doi:10.1152/physrev.00019.2013
Fulda, S. (2014). Tumor-necrosis-factor-related Apoptosis-Inducing Ligand (TRAIL). Adv. Exp. Med. Biol. 818, 167–180. doi:10.1007/978-1-4471-6458-6_8
Gál, P., Varinská, L., Fáber, L., Novák, Š., Szabo, P., Mitrengová, P., et al. (2017). How Signaling Molecules Regulate Tumor Microenvironment: Parallels to Wound Repair. Molecules 22, 1818. doi:10.3390/molecules22111818
Gallant-Behm, C. L., Piper, J., Lynch, J. M., Seto, A. G., Hong, S. J., Mustoe, T. A., et al. (2019). A MicroRNA-29 Mimic (Remlarsen) Represses Extracellular Matrix Expression and Fibroplasia in the Skin. J. Invest. Dermatol. 139, 1073–1081. doi:10.1016/j.jid.2018.11.007
Gautier, L., Cope, L., Bolstad, B. M., and Irizarry, R. A. (2004). affy--analysis of Affymetrix GeneChip Data at the Probe Level. Bioinformatics 20, 307–315. doi:10.1093/bioinformatics/btg405
Grabowski, G., Pacana, M. J., and Chen, E. (2020). Keloid and Hypertrophic Scar Formation, Prevention, and Management. J. Am. Acad. Orthopaedic Surgeons 28, e408–e414. doi:10.5435/jaaos-d-19-00690
Horgan, D., Codacci Pisanelli, G., Esposito, G., and Moch, H. (2017). The Pros and Comms of Gene Sequencing. Biomed. Hub 2, 32–36. doi:10.1159/000481299
Ito, K., and Murphy, D. (2013). Application of Ggplot2 to Pharmacometric Graphics. CPT Pharmacometrics Syst. Pharmacol. 2, e79. doi:10.1038/psp.2013.56
Jiang, W., Wu, D.-B., Fu, S.-Y., Chen, E.-Q., Tang, H., and Zhou, T.-Y. (2019). Insight into the Role of TRAIL in Liver Diseases. Biomed. Pharmacother. 110, 641–645. doi:10.1016/j.biopha.2018.12.004
Lee, H. J., and Jang, Y. J. (2018). Recent Understandings of Biology, Prophylaxis and Treatment Strategies for Hypertrophic Scars and Keloids. Int. J. Mol. Sci. 19, 711. doi:10.3390/ijms19030711
Lee, H. J., Jung, Y. H., Choi, G. E., Kim, J. S., Chae, C. W., Lim, J. R., et al. (2021). Urolithin A Suppresses High Glucose-Induced Neuronal Amyloidogenesis by Modulating TGM2-dependent ER-Mitochondria Contacts and Calcium Homeostasis. Cell Death Differ 28, 184–202. doi:10.1038/s41418-020-0593-1
Lee, J., Condello, S., Yakubov, B., Emerson, R., Caperell-Grant, A., Hitomi, K., et al. (2015). Tissue Transglutaminase Mediated Tumor-Stroma Interaction Promotes Pancreatic Cancer Progression. Clin. Cancer Res. 21, 4482–4493. doi:10.1158/1078-0432.ccr-15-0226
Lee, J. Y.-Y., Yang, C.-C., Chao, S.-C., and Wong, T.-W. (2004). Histopathological Differential Diagnosis of Keloid and Hypertrophic Scar. The Am. J. Dermatopathology 26, 379–384. doi:10.1097/00000372-200410000-00006
Lee, Y. I., Kim, J., Yang, C. E., Hong, J. W., Lee, W. J., and Lee, J. H. (2019). Combined Therapeutic Strategies for Keloid Treatment. Ds 45, 802–810. doi:10.1097/dss.0000000000001695
Leicht, D. T., Kausar, T., Wang, Z., Ferrer-Torres, D., Wang, T. D., Thomas, D. G., et al. (2014). TGM2: a Cell Surface Marker in Esophageal Adenocarcinomas. J. Thorac. Oncol. 9, 872–881. doi:10.1097/jto.0000000000000229
Li, C., Cai, J., Ge, F., and Wang, G. (2018). TGM2 Knockdown Reverses Cisplatin Chemoresistance in Osteosarcoma. Int. J. Mol. Med. 42, 1799–1808. doi:10.3892/ijmm.2018.3753
Liberzon, A., Birger, C., Thorvaldsdóttir, H., Ghandi, M., Mesirov, J. P., and Tamayo, P. (2015). The Molecular Signatures Database Hallmark Gene Set Collection. Cel Syst. 1, 417–425. doi:10.1016/j.cels.2015.12.004
Mandrekar, J. N. (2010). Receiver Operating Characteristic Curve in Diagnostic Test Assessment. J. Thorac. Oncol. 5, 1315–1316. doi:10.1097/jto.0b013e3181ec173d
Min, S., Lee, B., and Yoon, S. (2017). Deep Learning in Bioinformatics. Brief Bioinform 18, 851–869. doi:10.1093/bib/bbw068
Nadalutti, C., Viiri, K. M., Kaukinen, K., Mäki, M., and Lindfors, K. (2011). Extracellular Transglutaminase 2 Has a Role in Cell Adhesion, whereas Intracellular Transglutaminase 2 Is Involved in Regulation of Endothelial Cell Proliferation and Apoptosis. Cell Prolif 44, 49–58. doi:10.1111/j.1365-2184.2010.00716.x
Pierce, A., Whetton, A. D., Meyer, S., Ravandi-Kashani, F., Borthakur, G., Coombes, K. R., et al. (2013). Transglutaminase 2 Expression in Acute Myeloid Leukemia: Association with Adhesion Molecule Expression and Leukemic Blast Motility. Proteomics 13, 2216–2224. doi:10.1002/pmic.201200471
Potter, D. A., Veitch, D., and Johnston, G. A. (2019). Scarring and Wound Healing. Br. J. Hosp. Med. 80, C166–c171. doi:10.12968/hmed.2019.80.11.c166
Ritchie, M. E., Phipson, B., Wu, D., Hu, Y., Law, C. W., Shi, W., et al. (2015). Limma powers Differential Expression Analyses for RNA-Sequencing and Microarray Studies. Nucleic Acids Res. 43, e47. doi:10.1093/nar/gkv007
Robin, X., Turck, N., Hainard, A., Tiberti, N., Lisacek, F., Sanchez, J.-C., et al. (2011). pROC: an Open-Source Package for R and S+ to Analyze and Compare ROC Curves. BMC Bioinformatics 12, 77. doi:10.1186/1471-2105-12-77
Subramanian, A., Tamayo, P., Mootha, V. K., Mukherjee, S., Ebert, B. L., Gillette, M. A., et al. (2005). Gene Set Enrichment Analysis: a Knowledge-Based Approach for Interpreting Genome-wide Expression Profiles. Proc. Natl. Acad. Sci. U.S.A. 102, 15545–15550. doi:10.1073/pnas.0506580102
Sunda, F., and Arowolo, A. (2020). A Molecular Basis for the Anti‐inflammatory and Anti‐fibrosis Properties of Cannabidiol. FASEB J. 34, 14083–14092. doi:10.1096/fj.202000975r
Sziksz, E., Pap, D., Lippai, R., Béres, N. J., Fekete, A., Szabó, A. J., et al. (2015). Fibrosis Related Inflammatory Mediators: Role of the IL-10 Cytokine Family. Mediators Inflamm. 2015, 764641. doi:10.1155/2015/764641
Szklarczyk, D., Morris, J. H., Cook, H., Kuhn, M., Wyder, S., Simonovic, M., et al. (2017). The STRING Database in 2017: Quality-Controlled Protein-Protein Association Networks, Made Broadly Accessible. Nucleic Acids Res. 45, D362–d368. doi:10.1093/nar/gkw937
Tan, S., Khumalo, N., and Bayat, A. (2019). Understanding Keloid Pathobiology from a Quasi-Neoplastic Perspective: Less of a Scar and More of a Chronic Inflammatory Disease with Cancer-like Tendencies. Front. Immunol. 10, 1810. doi:10.3389/fimmu.2019.01810
Torres, A., Pac-Sosińska, M., Wiktor, K., Paszkowski, T., Maciejewski, R., and Torres, K. (2019). CD44, TGM2 and EpCAM as Novel Plasma Markers in Endometrial Cancer Diagnosis. BMC Cancer 19, 401. doi:10.1186/s12885-019-5556-x
Ud-Din, S., and Bayat, A. (2020). Keloid Scarring or Disease: Unresolved Quasi-Neoplastic Tendencies in the Human Skin. Wound Repair Regen. 28, 422–426. doi:10.1111/wrr.12793
Wang, Z., Lachmann, A., and Ma′ayan, A. (2019). Mining Data and Metadata from the Gene Expression Omnibus. Biophys. Rev. 11, 103–110. doi:10.1007/s12551-018-0490-8
Wang, K., Zu, C., Zhang, Y., Wang, X., Huan, X., and Wang, L. (2020a). Blocking TG2 Attenuates Bleomycin-Induced Pulmonary Fibrosis in Mice through Inhibiting EMT. Respir. Physiol. Neurobiol. 276, 103402. doi:10.1016/j.resp.2020.103402
Wang, Y., Lin, C., Han, R., Lu, C., Li, L., Hu, C., et al. (2020b). Metformin Attenuates TGF-Β1-Induced Pulmonary Fibrosis through Inhibition of Transglutaminase 2 and Subsequent TGF-β Pathways. 3 Biotech. 10, 287. doi:10.1007/s13205-020-02278-2
Wang, Z.-C., Zhao, W.-Y., Cao, Y., Liu, Y.-Q., Sun, Q., Shi, P., et al. (2020c). The Roles of Inflammation in Keloid and Hypertrophic Scars. Front. Immunol. 11, 603187. doi:10.3389/fimmu.2020.603187
Wang, C.-H., Shan, M.-J., Liu, H., Hao, Y., Song, K.-X., Wu, H.-W., et al. (2021). Hyperbaric Oxygen Treatment on Keloid Tumor Immune Gene Expression. Chin. Med. J. (Engl). 134, 2205–2213. doi:10.1097/cm9.0000000000001780
Warde-Farley, D., Donaldson, S. L., Comes, O., Zuberi, K., Badrawi, R., Chao, P., et al. (2010). The GeneMANIA Prediction Server: Biological Network Integration for Gene Prioritization and Predicting Gene Function. Nucleic Acids Res. 38, W214–W220. doi:10.1093/nar/gkq537
Worby, C. A., and Dixon, J. E. (2014). PTEN. Annu. Rev. Biochem. 83, 641–669. doi:10.1146/annurev-biochem-082411-113907
Wynn, T. A., and Ramalingam, T. R. (2012). Mechanisms of Fibrosis: Therapeutic Translation for Fibrotic Disease. Nat. Med. 18, 1028–1040. doi:10.1038/nm.2807
Xu, M., Tian, G. L., Hao, C. C., Shi, M., Zha, D. J., and Liang, K. (2020). MicroRNA-29 Targets FGF2 and Inhibits the Proliferation, Migration and Invasion of Nasopharyngeal Carcinoma Cells via PI3K/AKT Signaling Pathway. Eur. Rev. Med. Pharmacol. Sci. 24, 7199. doi:10.26355/eurrev_202007_21849
Yan, L., Wang, L.-Z., Xiao, R., Cao, R., Pan, B., Lv, X.-Y., et al. (2020). Inhibition of microRNA-21-5p Reduces Keloid Fibroblast Autophagy and Migration by Targeting PTEN after Electron Beam Irradiation. Lab. Invest. 100, 387–399. doi:10.1038/s41374-019-0323-9
Keywords: keloid, diagnostic signature, immune cell infiltration, ssGSEA, TGM2
Citation: Xia Y, Wang Y, Xiao Y, Shan M, Hao Y and Zhang L (2022) Identification of a Diagnostic Signature and Immune Cell Infiltration Characteristics in Keloids. Front. Mol. Biosci. 9:879461. doi: 10.3389/fmolb.2022.879461
Received: 19 February 2022; Accepted: 13 April 2022;
Published: 20 May 2022.
Edited by:
Trayambak Basak, Indian Institute of Technology Mandi, IndiaReviewed by:
Kakali Ghoshal, Vanderbilt University Medical Center, United StatesCopyright © 2022 Xia, Wang, Xiao, Shan, Hao and Zhang. This is an open-access article distributed under the terms of the Creative Commons Attribution License (CC BY). The use, distribution or reproduction in other forums is permitted, provided the original author(s) and the copyright owner(s) are credited and that the original publication in this journal is cited, in accordance with accepted academic practice. No use, distribution or reproduction is permitted which does not comply with these terms.
*Correspondence: Youbin Wang, d3liZW56QHNpbmEuY29t
Disclaimer: All claims expressed in this article are solely those of the authors and do not necessarily represent those of their affiliated organizations, or those of the publisher, the editors and the reviewers. Any product that may be evaluated in this article or claim that may be made by its manufacturer is not guaranteed or endorsed by the publisher.
Research integrity at Frontiers
Learn more about the work of our research integrity team to safeguard the quality of each article we publish.