
95% of researchers rate our articles as excellent or good
Learn more about the work of our research integrity team to safeguard the quality of each article we publish.
Find out more
ORIGINAL RESEARCH article
Front. Mol. Biosci. , 19 August 2022
Sec. Molecular Diagnostics and Therapeutics
Volume 9 - 2022 | https://doi.org/10.3389/fmolb.2022.877320
This article is part of the Research Topic Multi-Omics Dissection of Cell Plasticity and Tumor Heterogeneity for Personalized Cancer Therapy - Volume II View all 4 articles
 Haibo Zhang1†Ziqing He1†Li Qiu1†
 Jinfen Wei1Xiaocheng Gong1Mingjian Xian2Zixi Chen1
 Ying Cui1
 Shuying Fu1
 Zihao Zhang2
 Bowen Hu2
 Xiquan Zhang2
 Shudai Lin1,3*
 Hongli Du1*
The upregulated proline rich 11 (PRR11) plays a critical role in cancer progression. The relevant biological functions of PRR11 in pan-cancer development are not well understood. In the current study, we found that PRR11 was upregulated in 19 cancer types compared with that of normal tissues and high-expressed PRR11 was a predictor of poor prognosis in 10 cancer types by bioinformatics. Then we showed that interfering PRR11 on three cancer cell lines could greatly inhibit cell proliferation and migration and arrest cells to S phase in vivo. Based on RNA-seq, downregulation of PRR11 expression could extremely suppress the expression of PTTG1 and the cell cycle pathway identified by a differentially expressed gene analysis and an enrichment analysis. The expression of PRR11 and PTTG1 was positively correlated in TCGA and independent GEO data sets. Importantly, we revealed that the PRR11 could express itself in the nucleus and interact with E2F1 on the PTTG1 promoter region to increase the expression of PTTG1. Further results indicated that the expression of PTTG1 was also associated with poor prognosis in 10 cancer types, while downregulation of PTTG1 expression could inhibit cancer cell proliferation and migration. Therefore, we found that PRR11 served as an oncogene in pan-cancer and could influence the cell cycle progression through regulating the expression of PTTG1 by interacting with the transcription factor E2F1.
Studies have shown that proline rich 11 (PRR11) contains a bivalent nuclear localization signal, two proline-rich regions, and a zinc finger domain, which is a well-known domain that can bind double-stranded DNA, modulate gene transcription (Zhou et al., 2019), and participate in cell signal transduction leading to a series of cancer-related events (Qiao et al., 2019).
Previous studies have suggested that PRR11 plays a vital role in numerous biological processes, such as cell cycle progression; cell proliferation, migration, and invasion; apoptosis; and cell autophagy of tumor cells by regulating cyclin genes (Ji et al., 2013; Zhang et al., 2018), p38 MAPK (Lin et al., 2020), Wnt/β-catenin (Qiao et al., 2019; Zhou et al., 2019), PI3K/AKT/β-catenin (Zhu et al., 2018), and Akt/mTOR autophagy (Zhang et al., 2018) signaling pathways. Many cyclins and cyclin-related genes, including CCNA1, RRM1, PCNA (Ji et al., 2013), CDK6, CCNE, CCNA2, and CCNB2, were inhibited when interfering with PRR11 (Zhang et al., 2018). In addition, the low-expressed PRR11 could also suppress the expression level of apoptotic proteins, such as P62 (Zhang et al., 2018). However, the precise molecular mechanisms underlying how PRR11 regulates the expression of genes involved in different signaling pathways and whether high-expressed PRR11 has a common regulatory mechanism in the development of different cancer types are yet to be elucidated. Therefore, finding out the molecular regulation mechanisms of PRR11 upregulation in promoting tumorigenesis and development of pan-cancers will help us understand its function and develop new diagnostic and therapeutic methods.
In this study, we examined the expression pattern of PRR11 in different types of cancers with ≥ 30 normal tissues from TCGA and explored its related clinical pathological, to clarify the application prospect of PRR11 as a prognostic marker of pan-cancers. In addition, we revealed the related regulation pathways by conjoint analyzing the differentially expressed genes (DEGs) from RNA-seq data of cell lines and TCGA datasets and evaluated the biological function and the molecular mechanism of PRR11 in pan-cancer development using ChIP-qPCR, Western blot, and a series of experimental techniques. Mechanically, PRR11 could regulate the expression of PTTG1 by interacting with E2F1 to the E2F1 binding site of the PTTG1 promoter region. These results demonstrated that PRR11 could play a key role during the development and progression of pan-cancer and might represent a novel and valuable prognostic marker and therapeutic target for pan-cancer progression.
Expression data and corresponding clinical information of different kinds of cancer patients were downloaded from The Cancer Genome Atlas (TCGA, https://portal.gdc.cancer.gov/). The GSE48075 set was downloaded from the Gene Expression Omnibus database (GEO, http://www.ncbi.nlm.nih.gov/geo/) and used to validate interested genes overall survival of patients.
The clinical outcome of patients with different types of cancers was determined using the Kaplan–Meier survival curves. For the overall survival, the samples were divided into two groups according to the median expression of the mRNAs (high vs low) with the use of R packages (survival, version 3.2.7; survminer, version 0.4.8). The p < 0.05 indicated statistically significant differences.
The samples of 11 types of cancers, which were PRR11, were remarkably upregulated and with normal tissues ≥ 30 in TCGA databases. The expression levels of PRR11 in all individuals in each kind of 11 types of cancers were ranked from high to low and then separated samples into 30% PRR11 high and 30% low groups to find out DEGs using the “DESeq2” package (version 1.28.1) in R language (version 4.0.2) (Love et al., 2014). |Fold Change| > 1.5 and FDR < 0.05 were set as the statistical threshold value of DEGs.
The Gene Ontology (GO) and Kyoto Encyclopedia of Genes and Genomes (KEGG) analyses were conducted by using the R package (clusterProfiler, version 3.16.1) to explore different molecular mechanisms and involved pathways between PRR11 high and low patients. The number of permutations was set at 1,000, and the cutoff P-adjust was 0.05 to filter the significant enrichment results. The protein–protein interaction (PPI) network of DEGs was obtained from the STRING (version 11.0) database (Szklarczyk et al., 2019). We used Cytoscape (version 3.5.1) software to visualize the PPI network and loaded the plug-in Molecular Complex Detection (MCODE) for a sub-network analysis, followed by extracting the densely connected areas in the PPI network, and built key modules (Bader and Hogue, 2003).
Spearman’s correlation coefficient analysis was performed to explore the correlation between PRR11 and PTTG1 in different cancers that ≥ 200 tumor tissues from the TCGA database.
The liver, lung, and pancreatic cancer cell lines (HepG2, NCI-H460, and BxPC3) were gifts from Dr. Peng Wang, Sun Yat-sen University Cancer Hospital, Guangzhou, China. HepG2 was isolated from a hepatocellular carcinoma of a 15-year-old, white, male with liver cancer. NCI-H460 cells were isolated from the pleural fluid of a male patient with large-cell lung cancer. In addition, BxPC3 was isolated from the pancreas tissue of a 61-year-old female patient with adenocarcinoma. HepG2 cells were cultured in DMEM/high glucose, and NCI-H460 and BxPC3 cells were cultured in the RPMI-1640 basic medium, separately supplemented with 10% fetal bovine serum (Gibco, NY, United States), 100 U/ml penicillin, and 100 μg/ml streptomycin at 37°C in air with 5% CO2.
The specific siRNAs of PRR11, E2F1, and PTTG1 genes and a nonsense siRNA were synthesized and purified by Hanheng (Shanghai, China) (Supplementary Table S1). A total of 5 × 10⁴, 2 × 10⁴, and 3 × 10³ cells per well were seeded in 6-well, 12-well, and 96-well plates, respectively. After 24 h, cells were transfected with siRNAs as 40 nM/ml (Supplementary Figure S1) using Lipofectamine 3000 (Thermo Fisher Scientific, Waltham, MA, United States), according to the manufacturer’s protocol.
Total RNA was extracted from the cells using the TRIzol reagent (Thermo Fisher Scientific, Waltham, MA, United States) and kept at −80°C. The complementary DNA (cDNA) libraries of each pooled RNA sample for single-end sequencing were generated using the NEBNext® UltraTM RNA Library Prep Kit for Illumina® (NEB, Cat. No. E7530L, New England Biolabs, United States), according to the manufacturer’s instructions. The cDNA libraries were subjected to the NovaSeq 6,000 system (Illumina, CA, United States), according to commercially available protocols. The changed RNAs were validated by quantitative PCR using the primers listed in Supplementary Table S2.
The raw sequencing data were evaluated by FAST-QC, while the transcriptional start site (TSS) and chromosomal distribution were obtained by custom java scripts. The potential genes were defined within +5 kilobases (kb) from the TSS and 50 kb downstream from the transcription end site. The clean reads from RNA-seq were aligned to the human reference genome sequence GRCH38.p13 using the HISAT2 program (v2.2.3) (Kim et al., 2019). The experimental data were first optimized for the alignment parameters to provide the largest information on the AS events. The potential genes sequenced were counted by HTseq and their relative expression levels were determined by GENCODE (v36) (Frankish et al., 2019).
Total RNA was reverse transcribed into cDNA by using the PrimeScript RT-polymerase (TaKaRa, Bao Biological Engineering (Dalian) Co., Ltd. China). Quantitative real-time PCR was performed on the cDNA templates using specific primers (Sangon Biotech, Shanghai, China) (Supplementary Table S2) and SYBR master mix (TaKaRa, Bao Biological Engineering (Dalian) Co., Ltd. China), according to the manufacturer’s protocols. The relative mRNA expression levels of interested genes were calculated as a ratio normalized to GAPDH expression. Comparative quantification was performed using the 2−ΔΔCt method.
After 48-h treatment of siNC and siPRR11-2, cells were washed twice with pre-cooled 1X phosphate-buffered saline (PBS) (Gibco, NY, United States), centrifuged at 1,200 rpm 4°C for 5 min, fixed with 70% ethanol, and then stained with propidium iodide, according to an established protocol. Then the cells’ cell cycle was analyzed on a BD FACS Calibur (Becton, Dickinson and Company, United States).
The influence of PRR11-specific siRNA on cell viability was first tested using a glass hemocytometer and coverslip. In brief, cells growing in the log phase were trypsinized and seeded in 6-well plates (2–6 × 10⁵ cells per well in a final volume of 2 ml) in four replicates and incubated at 37°C in air with 5%. After incubation for 0, 24, 48, 72, or 96 h, 200 µl of 0.25% trypsin (Gibco, NY, United States) was added per well to digest the cells, stop the digestion with 1.8 ml of complete cell cultural medium, and collect them in an Eppendorf tube. Furthermore, we took 50 ul of cell suspension into a new Eppendorf tube, added 50 ul 0.4% Trypan Blue (final concentration 0.2%), and mixed gently. We filled both chambers of glass hemocytometer underneath the coverslip and took 10 ul of trypan blue–treated cell suspension and applied to the hemocytometer. Using a microscope, we focused on the grid lines of the hemocytometer with a ×10 objective. We counted the live, unstained cells in all four sets of 16 squares using a hand tally counter. Finally, we calculated the number of viable cells per well: Number of cells = (the cell count from four sets of 16 squares/4) × 104 × 2 (dilution factor) × 2 (volume).
The effect of PRR11-specific siRNA on cell viability was tested using a CCK-8 assay kit (Beyotime Biotechnology, Shanghai, China), according to the manufacturer’s instructions. In brief, cells growing in the log phase were trypsinized and seeded in 96-well plates (3,000 cells per well in a final volume of 100 µl) in four to six replicates and incubated at 37°C in air with 5% CO2. After incubation for 0, 24, 48, 72, or 96 h, 10 µl of CCK-8 was added to each well and incubated at 37°C for an additional 1 h. The quantity of formazan product was measured by its absorbance at 450 nm using a 96-well plate reader (Molecular Devices). All experiments were repeated at least three times.
A wound healing assay was performed to detect the migration of three kinds of cancer cell lines. Cells growing in the log phase were trypsinized and seeded in 24-well plates until confluence. The cell layer was transfected with siPRR11-2 and wounded using a sterile tip. After incubation for 0, 24, 48, 72, and 96 h, cells were photographed under an inverted microscope, respectively. The distance between the two edges of the scratch (wound width) was measured at eight sites using ImageJ in each image (×40 magnification).
A total of 104 NCI-H460 cells were observed and pictures were taken every 24 h using a laser confocal microscope; washed twice with PBS after 48 h, 1 ml each time; and shook slowly for 3 min on a shaker. Then they were fixed with 1 ml of 4% paraformaldehyde for 30 min, washed with 1 ml PBS, and shook slowly for 5 min for three times, followed by 0.1% Triton X-100 (prepared in PBS) permeation for 10 min at room temperature, and washed three times with PBS as above. Furthermore, we added 1 ml of Quick-block solution (Beyotime Biotechnology, P0235, Shanghai, China) for 30 min at room temperature, washed three times with PBS as above, then removed the blocking solution, added 1 ml of diluted PRR11 primary antibody (Thermo Fisher Scientific, 1:1,000, Cat. No. PA5113175, Waltham, MA, United States), and incubated overnight at 4°C. Then we washed the cells with PBS three times for 5 min each time, added the diluted fluorescent secondary antibody (Thermo Fisher Scientific, 1:5,000, Cat. No. A11012, Waltham, MA, United States), incubated for 1 h at room temperature in the dark, followed by washing three times with PBS for 3 min each time. Then cells were stained with nucleus DAPI dropwise, incubated for 5 min in the dark, and washed four times with PBS for 5 min. We dropped the mounting solution containing an anti-fluorescence quencher (Thermo Fisher Scientific, Cat. No. MAN0010261, Waltham, MA, United States) and then observed and photographed the image under a fluorescence microscope (Leica TCS SP8 X, Germany).
Chromatin immunoprecipitation (ChIP) was performed according to the instructions of the Pierce Agarose ChIP Kit (Thermo Fisher Scientific, Cat. No. 26156, Waltham, MA, United States). The E2F1 binding site on the PTTG1 promoter region (NC_000005.10, 1,60419855–160421854) was predicted using the JASPAR online tool (http://jaspar.genereg.net/). A fluorescence quantitative PCR was carried out using PTTG1 promoter specific primers (Supplementary Table S2). The relative expression levels of interested PTTG1 promoter regions were calculated as a ratio normalized to GAPDH (primers are provided by the ChIP kit) expression when E2F1 was knocked down and negative control for 48 h in NCI-H460 cells. A comparative quantification was performed using the 2−ΔΔCt method.
Co-immunoprecipitation (Co-IP) was performed according to the instructions of the Pierce™ Classic Magnetic IP/Co-IP Kit (Thermo Fisher Scientific, Cat. No. 88804, Waltham, MA, United States). Proteins were quantified and resolved by 10% SDS-PAGE and electrotransferred to polyvinylidene difluoride (PVDF) membranes (Millipore, Bedford, MA, United States) followed by blocking in Quick-block solution (Beyotime Biotechnology, Shanghai, China) at room temperature for 30 min and incubation with primary antibodies against PRR11 (Thermo Fisher Scientific, 1:200, Cat. No. PA5113175, Waltham, MA, United States) and E2F1 (Thermo Fisher Scientific, 1:2,000, Cat. No. MA123202, Waltham, MA, United States) overnight at 4°C. Then the PVDF membranes were incubated with IgG horseradish peroxidase (HRP)–conjugated secondary antibodies (Beyotime Biotechnology, Cat. No. A0208 and A0216, Shanghai, China) and detected using the electrochemiluminescence (ECL) (Beyotime Biotechnology, Cat No. P0018FS, Shanghai, China) method, according to the manufacturer’s instructions. The group without any antibody was used as a mock control.
The analyses were carried out using “R” software (version 4.0.2) with corresponding packages and IBM SPSS Statistics 19. Error bars in graphs represent ±standard error of mean of more than triplicate values, and statistical significance was determined by Student’s t-test when only two groups were compared. The p value < 0.05 was considered statistically significant.
In total, 19 out of 33 cancer tissues were PRR11 upregulated in the TCGA database, compared with that of normal tissues (Figures 1A–L and Supplementary Figure S2. From the result of cancer tissue samples with corresponding normal tissue samples ≥ 30, except for thyroid carcinoma (THCA), the expression of PRR11 in the tumor tissues was significantly higher than that in normal tissues (FDR<0.003 in all cancers), including breast invasive carcinoma (BRCA), colon adenocarcinoma (COAD), head and neck squamous cell carcinoma (HNSC), kidney renal clear cell carcinoma (KIRC), kidney renal papillary cell carcinoma (KIRP), liver hepatocellular carcinoma (LIHC), lung adenocarcinoma (LUAD), lung squamous cell carcinoma (LUSC), prostate adenocarcinoma (PRAD), stomach adenocarcinoma (STAD), and uterine corpus endometrial carcinoma (UCEC) (Figures 1A–L). The other eight types of cancers with upregulated PRR11 include bladder urothelial carcinoma (BLCA), cervical squamous cell carcinoma and endocervical adenocarcinoma (CESC), cholangio carcinoma (CHOL), esophageal carcinoma (ESCA), glioblastoma multiforme (GBM), pheochromocytoma and paraganglioma (PCPG), rectum adenocarcinoma (READ), and sarcoma (SARC) (Supplementary Figure S2).
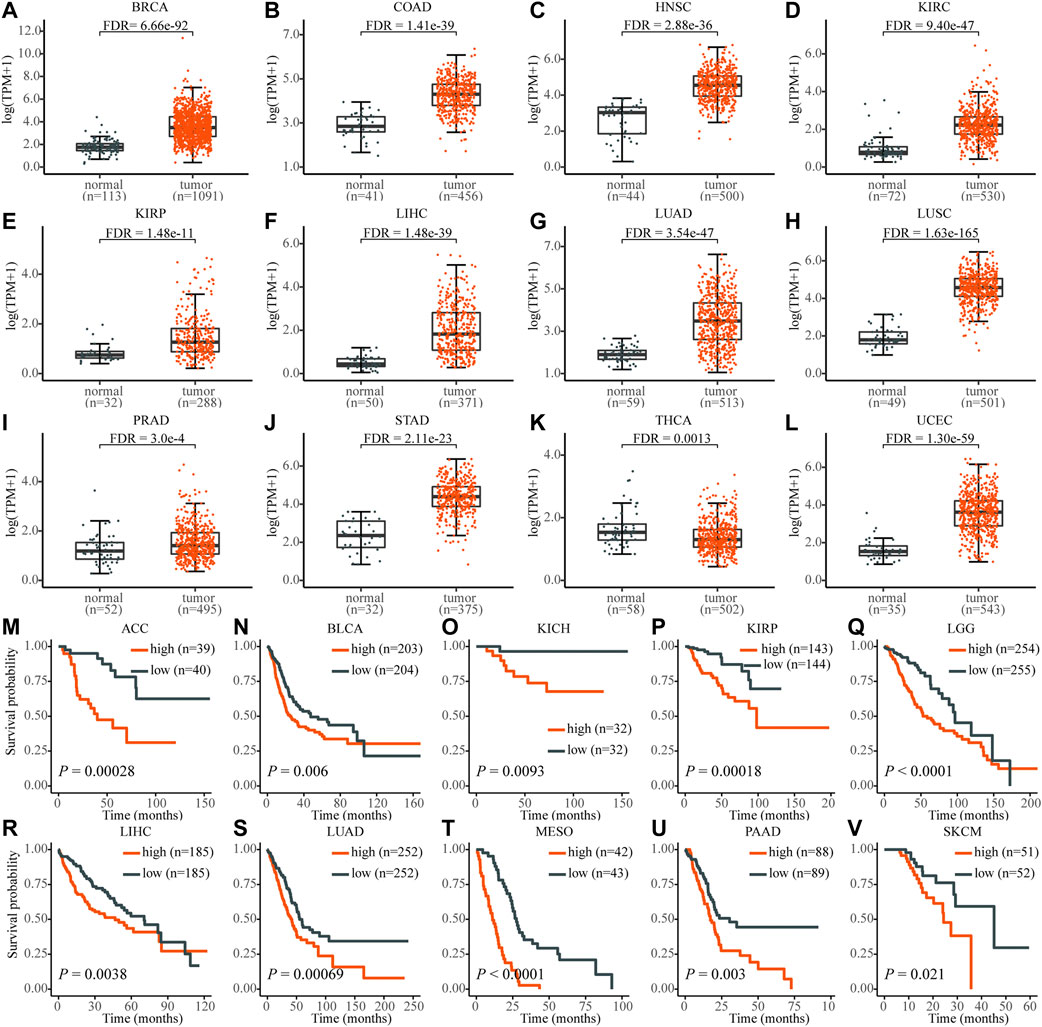
FIGURE 1. The expression level of PRR11 of normal tissues (black) and tumor tissues (red) in pan-cancer and its high expression are significantly associated with poor prognosis. (A) BRCA, breast invasive carcinoma; (B) COAD, colon adenocarcinoma; (C) HNSC, head and neck squamous cell carcinoma; (D) KIRC, kidney renal clear cell carcinoma; (E) KIRP, kidney renal papillary cell carcinoma; (F) LIHC, liver hepatocellular carcinoma; (G) LUAD, lung adenocarcinoma; (H) LUSC, lung squamous cell carcinoma; (I) PRAD, prostate adenocarcinoma; (J) STAD, stomach adenocarcinoma; (K) THCA, thyroid carcinoma; (L) UCEC, uterine corpus endometrial carcinoma; (M) ACC, adrenocortical carcinoma; (N) BLCA, bladder urothelial carcinoma; (O) KICH, kidney chromophobe; (P) KIRP; (Q) LGG, brain lower grade glioma; (R) LIHC; (S) LUAD; (T) MESO, mesothelioma; (U) PAAD, pancreatic adenocarcinoma; (V) SKCM, skin cutaneous melanoma.
In addition, the high expression level of PRR11 was associated with poor prognosis in 10 types of cancers, including adrenocortical carcinoma (ACC), BLCA, KICH, KIRP, brain lower grade glioma (LGG), LIHC, LUAD, mesothelioma (MESO), pancreatic adenocarcinoma (PAAD), and skin cutaneous melanoma (SKCM), which was identified using the Kaplan–Meier method and the log-rank test (Figures 1M–V). These findings demonstrated that PRR11 could play a pivotal role in pan-cancers development. Then we chose HepG2 (liver cancer cell line), NCI-H460 (lung cancer cell line), and BxPC3 (pancreatic cancer cell line) for the next experiment assay.
HepG2, NCI-H460, and BxPC3 cells were treated with siPRR11-2 for 0, 24, 48, 72, and 96 h. From the results of cell counts and CCK-8 assay, a 24-h treatment with siPRR11-2 caused a significant decrease of cell proliferation in HepG2 (Figure 2A) and NCI-H460 (Figure 2E) (*p < 0.05) cell lines, whereas 48, 72, and 96-h treatment with siPRR11-2 caused a remarkable decrease of cell proliferation in all three kinds of cell lines (*p < 0.05, **p < 0.01, ***p < 0.001, and ****p < 0.0001) (Figures 2A–F). In addition, in all three kinds of tumor cells, siPRR11-2 treatment led to a significant arrest of the cell cycle to S phase (*p < 0.05, Figures 2G–I). Moreover, siPRR11-2 treatment significantly inhibited the cell migration of HepG2 (Figure 2J and Supplementary Figure S3A), NCI-H460 (Figure 2K and Supplementary Figure S3B), and BxPC3 (Figure 2L and Supplementary Figure S3C) compared with that of siNC at 48, 72, and 96 h (*p < 0.05 and **p < 0.01).
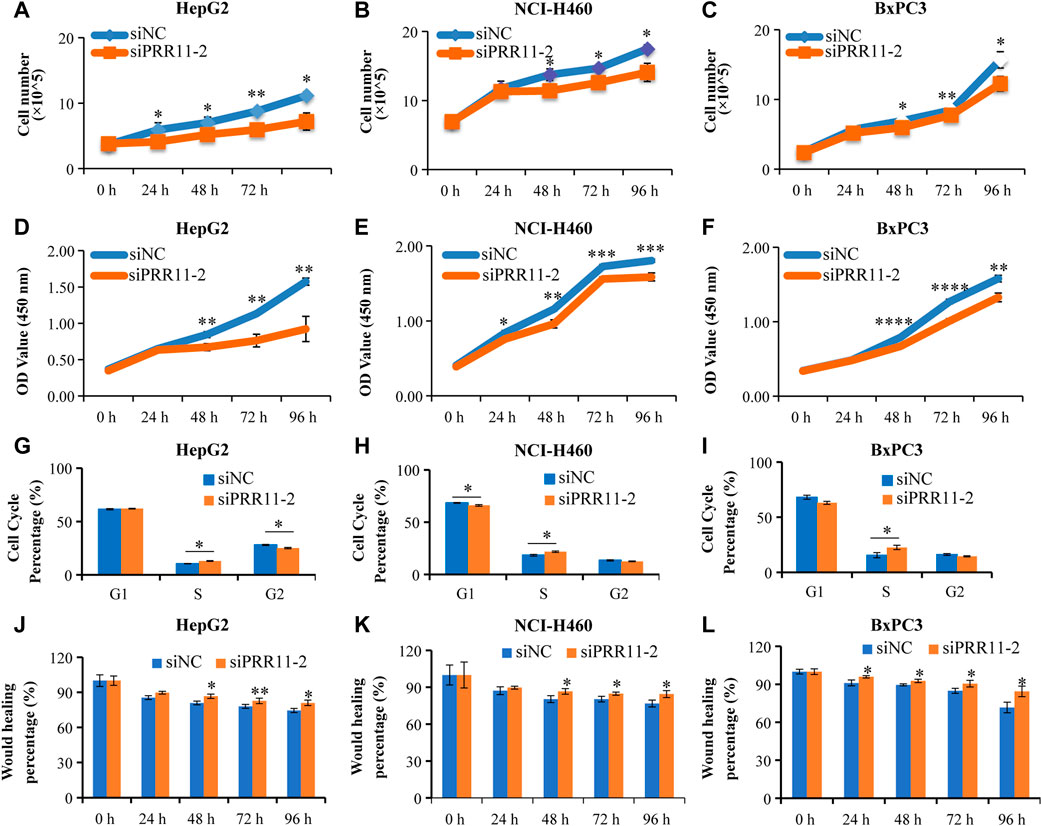
FIGURE 2. The low expression level of PRR11 strikingly inhibit tumor cell proliferation and migration. (A-C) Cell number of HepG2, NCI-H460, and BxPC3 after treating with siNC and siPRR11, respectively. (D-F) CCK-8 result of HepG2, NCI-H460, and BxPC3 after treating with siNC and siPRR11, respectively. (G-I) Cell cycle of HepG2, NCI-H460, and BxPC3 after treating with siNC and siPRR11, respectively. (J-L) Cell migration of HepG2, NCI-H460, and BxPC3 after treating with siNC and siPRR11, respectively. *p < 0.05, **p < 0.01, ***p < 0.001, and ****p < 0.0001.
First, we analyzed the DEGs with PRR11 high and low expression groups and found 1,320, 238, 327, 699, 1,127, 1944, 1,502, 362, 481, 841, and 1,127 DEGs in BRCA, COAD, HNSC, KIRC, KIRP, LIHC, LUAD, LUSC, STAD, PRAD, and UCEC, respectively (|FC| ≥ 1.5 and adjusted FDR < 0.05) (Supplementary Figure S4A). Among these 11 cancers in TCGA, 653 DEGs were screened out that occurred in more than four types of cancers (TCGA-4 Cs).
Then these 653 DEGs were analyzed by GO and KEGG analyses, and 10 enriched pathways of each analysis are shown in Supplementary Figure S5. The results indicated that DEGs were mainly enriched in the cell cycle pathway. For example, the GO_BP analysis showed that the DEGs were highly correlated to the cell cycle checkpoint, meiotic cell cycle, regulation of cell cycle G2/M phase transition, cell cycle G1/S phase transition, and DNA replication (Supplementary Figure S5A).
The KEGG result found that the DEGs were mainly enriched in the cell cycle, oocyte meiosis, complement and coagulation cascades, and IL-17 signaling pathway (Supplementary Figure S5B). The PPI analysis displayed that PTTG1 was highly correlated with cell division cycle 20 (CDC20), extra spindle pole bodies like 1, separase (ESPL1), cyclin-dependent kinase 1 (CDK1), aurora kinase A (AURKA), BUB1 mitotic checkpoint serine/threonine kinase (BUB1), BUB1 mitotic checkpoint serine/threonine kinase B (BUB1B), and cyclin B1 (CCNB1) with an interaction score ≥ 0.9 (Supplementary Figure S5C).
We analyzed the DEGs in 48 h siNC and siPRR11 treatment groups of HepG2, NCI-H460, and BxPC3 cancer cells. As a result, a total of 119, 2,234, and 1,052 DEGs in HepG2, NCI-H460, and BxPC3 cancer cells, including 64, 1,398, and 577 up-DEGs and 55, 836, and 475 down-DEGs were screened with |FC| > 1.2 and FDR < 0.1 (Supplementary Figure S4A; Figure 3A). As a result, PTTG1 was a common DEG between siNC and siPRR11 treatment groups across three cell lines. Intriguingly, it was found that the expression levels of both PRR11 and PTTG1 were extremely correlated to genes involved in the cell cycle across various cancer types (Supplementary Figure S6). In addition, the significant enriched pathways of GO_BP pathways of HepG2 were response to alcohol, response to ketone, and response to mineralocorticoid and renal system process (P.adj <0.05) while no significant KEGG pathway (data not shown). In addition, the significant enriched pathways of GO_BP and KEGG for NCI-H460 and BxPC3 RNA-seq DEGs are shown in Figures 3B–E.
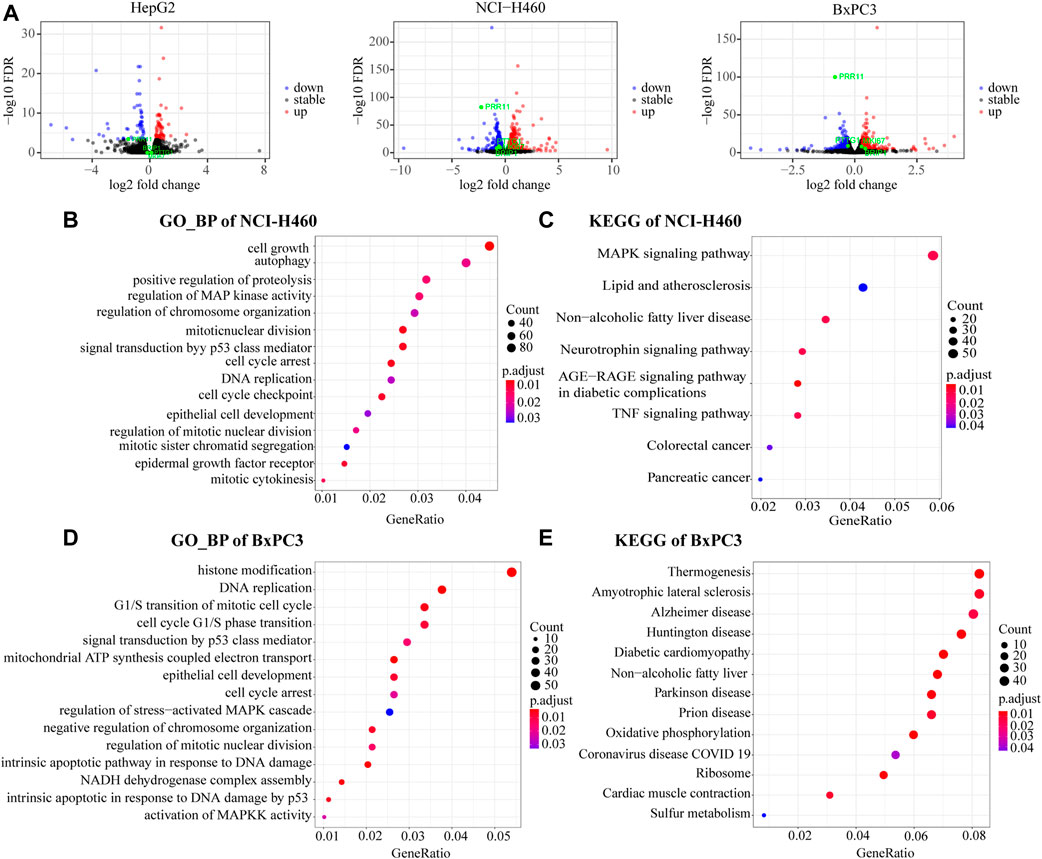
FIGURE 3. Functional enrichment analysis of RNA-Seq DEGs. (A) Volcano maps of HepG2 (left panel), NCI-H460 (middle panel), and BxPC3 (right panel). DEGs with threshold of |FC| > 1.2 and FDR < 0.1. PRR11, PTTG1, and MKI67 were marked in green. (B,C) GO_BP and KEGG pathways of NCI-H460 DEGs. (D,E) GO_BP and KEGG pathway of BxPC3 DEGs.
Collectively, the common significant GO_BP pathways for two out of three cell lines were cell cycle arrest, DNA replication, epithelial cell development, regulation of chromosome organization, regulation of mitotic nuclear division, MAPK signaling pathway, and signal transduction by the p53 class mediator.
In order to verify the reliability of the sequencing results, qRT-PCR was performed on 15 genes, including ADAM15, KDM2A, MESD, G3BP2, DCBLD2, SETD7, GBA, MAT2B, MPC2, NELFB, VPS11, CALM2, NDUFA12, TMEM14B, and PTTG1 in HepG2, NCI-H460, and BxPC3 cells (Figures 4A–C and Figure 5A). Notably, PRR11 was the only overlap gene among TCGA-4 Cs, HepG2, NCI-H460, and BxPC3 from RNA-seq DEGs at 48 h (Figure 5A). In addition, the heat map showed that the logFC value of cell cycle related genes between PRR11 high and low groups. It was found that PTTG1 involved in the cell cycle was upregulated in 10 out of 11 cancers and downregulated in NCI-H460 and BxPC3 cancer cell lines with interfering PRR11 (Figure 5B). In addition, the rescue assay verified PRR11/PTTG1 promoting cell proliferation in NCI-H460 (Supplementary Figure S4B). Thus, PRR11 silencing in pan-cancers could suppress the expression level of PTTG1.
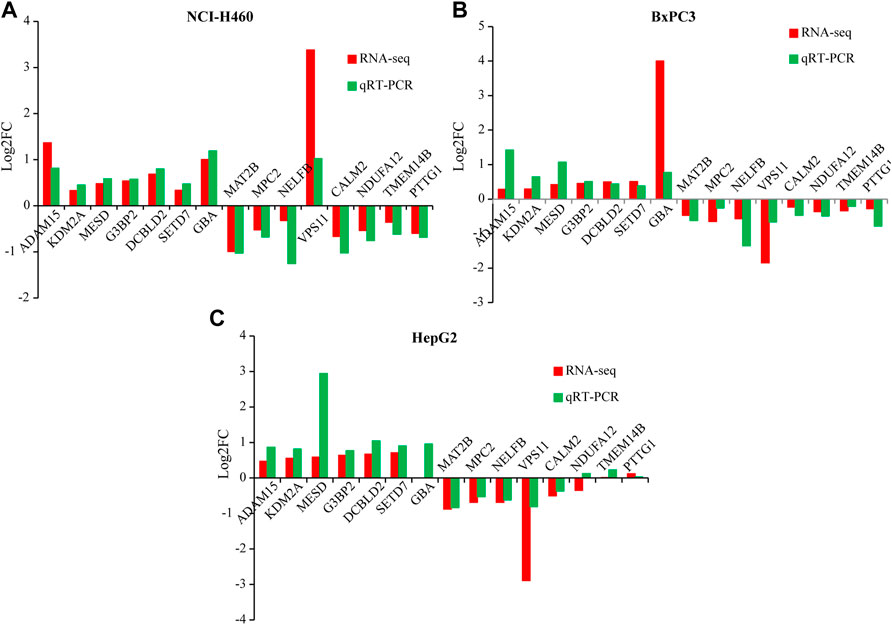
FIGURE 4. The qRT-PCR result verified the DEGs of RNA-seq from NCI-H460, BxPC3, and HepG2 with knocking down PRR11, respectively. (A) NCI-H460, (B) BxPC3, (C) HepG2.
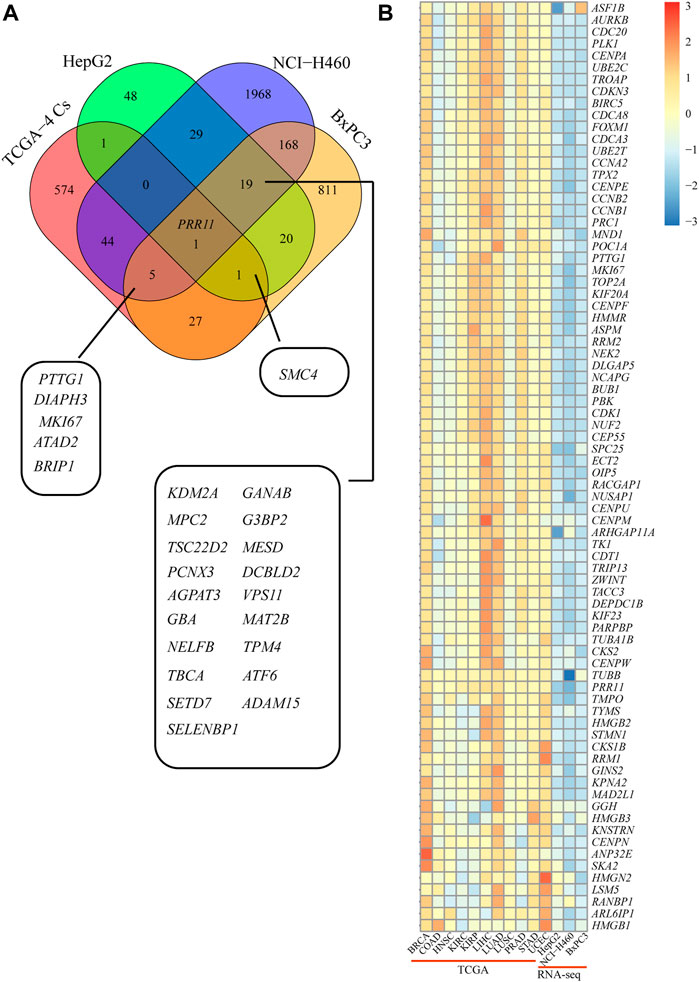
FIGURE 5. PTTG1 might be a candidate downstream gene of PRR11 and involved in the cell cycle. (A) Overlap DEGs between TCGA-4 Cs and RNA-seq. (B) Heat map of the cell cycle–related genes from both TCGA and RNA-seq. The colors represent the log2FC of different genes from 30% PRR11 high and low group in BRCA, COAD, HNSC, KIRC, KIRP, LIHC, LUAD, LUSC, PRAD, STAD, and UCEC and between siPRR11 and siNC groups of HepG2, NCI-H460, and BxPC3 cancer cell lines.
Given that PTTG1 showed the same decreased expression trend in NCI-H460 and BxPC3 after knockdown of PRR11 (Figure 3A, middle and right panels) and was involved in the cell cycle and sister chromatid separation events mentioned before, we speculated that PRR11 may be involved in the development of pan-cancer by regulating the expression of PTTG1. The Spearman correlation between PRR11 and PTTG1 was more than 0.3 in 16/33 types of cancer (with ≥200 samples) in TCGA (Supplementary Figure S7). Considering that the E2F1 transcription factor could enrich in the PTTG1 promoter region to activate PTTG1 expression (Wang et al., 2020) and PRR11 is located in the nucleus (using online website GeneCards®: The Human Gene Database, https://www.genecards.org/) (Figure 6A), we propose that PRR11 may regulate the expression level of PTTG1 by combining with E2F1. Hence, we used the immunofluorescence localization assay to verify that PRR11 was located in the nucleus (Figure 6B). In addition, we used the JASPAR online tool to predict the E2F1 binding site on the PTTG1 promoter region, followed by carrying out the qRT-PCR, ChIP-qPCR, and Co-IP assay when E2F1 was knocked down and negative control for 48 h in NCI-H460 cells. As a result, the expression levels of the PTTG1 gene was positively correlated with the expression level of E2F1 (Figure 6C). In addition, the Western blot analysis indicated that knockdown of PRR11 inhibited the expression of E2F1 (Figure 6E), and the PRR11 could co-act with E2F1 and both of them could enrich in the E2F1 binding site (5′-TTTGGGGC-3′) of the PTTG1 promoter region (−256/−124) in vitro (Figures 6D,F).
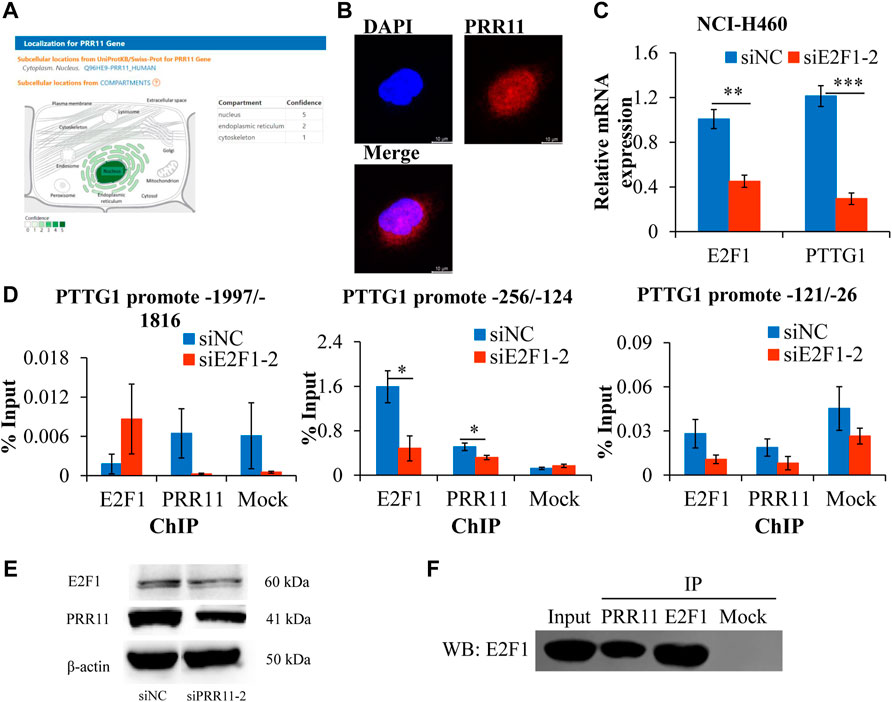
FIGURE 6. PRR11 promotes the expression level of PTTG1 by interacting with E2F1.(A) Localization for PRR11 gene was analyzed using GeneCards (https://www.genecards.org/). (B) Immunofluorescence localization of PRR11. (C) Expression levels of PTTG1 after interfering E2F1. (D) ChIP-qPCR of the PTTG1 promoter region. (E) Expression levels of E2F1 and PRR11 in NCI-H460 cells transfected with siNC or siPRR11 were examined by Western blotting. (F) Co-IP of PRR11 and E2F1 in NCI-H460 cells. N = 3. *p < 0.05, **p < 0.01, and ***p < 0.001.
The expression level of PTTG1 gene in pan-cancers is shown in Figure 7 and Supplementary Figure S6. Its expression in the tumor tissues was significantly higher than that in normal tissues, including BRCA, COAD, HNSC, KIRC, KIRP, LIHC, LUAD, LUSC, PRAD, STAD, and UCEC (Figures 7A–L). The other eight types of cancers with upregulated PTTG1 include BLCA, CESC, CHOL, ESCA, GBM, KICH, PCPG, and READ (Supplementary Figures S8A–H). Moreover, the expression level of PTTG1 was associated with poor prognosis in 10 kinds of cancers, including ACC, KIRC, KIRP, LGG LIHC, LUAD, MESO, PCPG, UCEC, and UVM (p ≤ 0.05) (Supplementary Figures S9A–J).
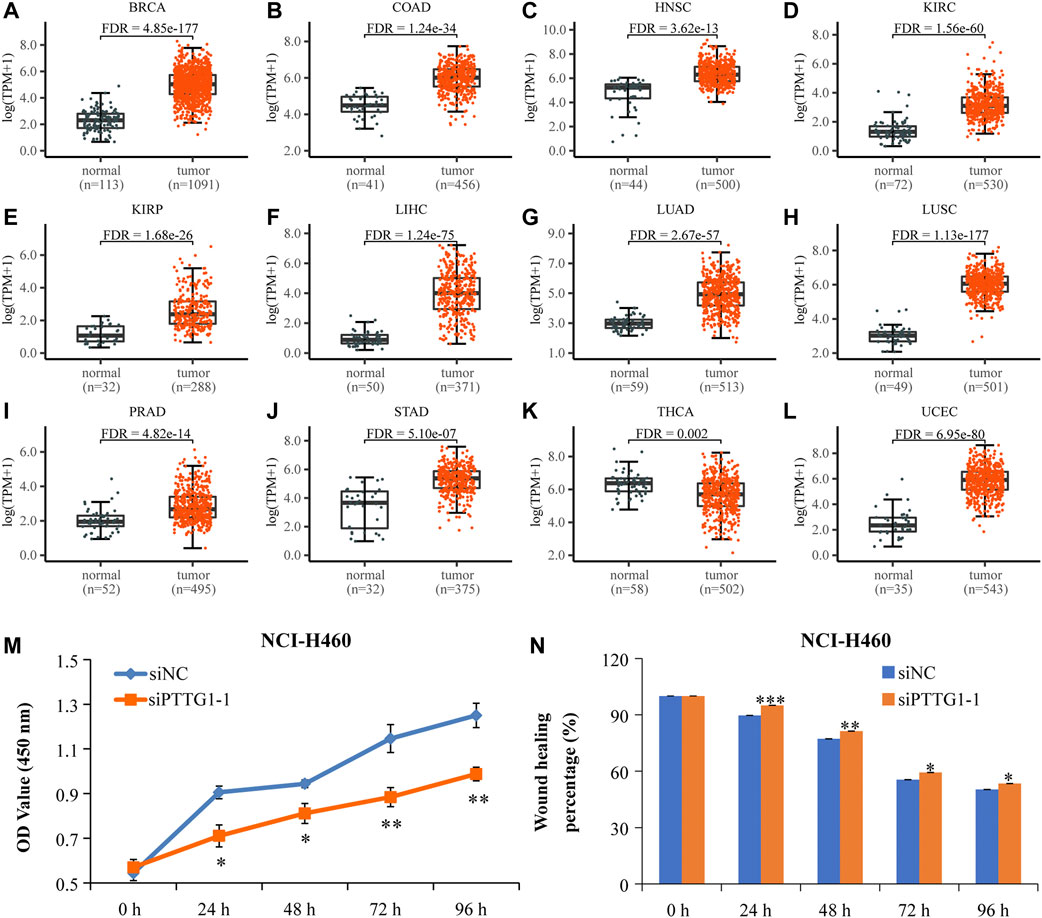
FIGURE 7. The high-expressed PTTG1 in pan-cancers and interfering PTTG1 could significantly suppress lung cancer cells’ proliferation and migration. (A-L) Scatter plots showing the expression levels of the PTTG1 gene of normal tissues (black) and tumor tissues (red) in pan-cancer. (M) The low expression level of PTTG1 strikingly repressed NCI-H460 cell proliferation. (N) The low-expressed PTTG1 could significantly repress cell mobility of NCI-H460 cells. N = 6–9. *p < 0.05, **p < 0.01, and ***p < 0.001.
In addition, a GEO data set (GSE48075) verified that high expression of PRR11 and PTTG1 was significantly related to the poor prognosis of cancer patients (Supplementary Figures S8I,J). In addition, the Spearman correlation coefficient suggested a significant positive correlation between PRR11 and PTTG1 (Supplementary Figure S8K). All these results indicated that PTTG1 showed the same trends of expression and poor outcome as PRR11 and may be an oncogene in pan-cancer.
In order to observe the effect of PTTG1 expression on cell proliferation and migration, NCI-H460 cells were treated with siPTTG1-1 for 0, 24, 48, 72, and 96 h. From the result of the CCK-8 assay, the 24- to 96-h treatment with siPTTG1-1 caused a dramatic decrease of cell proliferation in NCI-H460 (Figure 7M) (*p < 0.05, **p < 0.01). In addition, siPTTG1-1 treatments significantly repressed the cell migration of NCI-H460 (Figure 7N and Supplementary Figure S9K) compared with that of siNC at 24, 48, 72, and 96 h (*p <0.05, **p <0.01, and ***p <0.001). All these results implied that PTTG1 might play an important role in tumor development.
PRR11 has been found highly expressed in various cancer types and strongly correlated with their poor outcome. In the present study, PRR11 was highly expressed in 19 out of 33 kinds of cancers in TCGA. Our data have also shown that its upregulation was significant with poor outcome of various cancer patients. Recent evidence suggested that its upregulation may promote pan-cancer development by influencing cyclin genes and p38 MAPK (Lin et al., 2020), Wnt/β-catenin (Qiao et al., 2019; Zhou et al., 2019), PI3K/AKT/β-catenin (Zhu et al., 2018), and Akt/mTOR autophagy (Zhang et al., 2018) signaling pathways. Our findings confirmed that downregulated PRR11 could inhibit the proliferation and migration of different cancer cells, which were consistent with previous results in the lung (Ji et al., 2013; Wang et al., 2015), pancreatic (Tan et al., 2017), and gastric (Song et al., 2015; Hu et al., 2018) cancer cells. Furthermore, our results also supported that inhibited PRR11 could cause cell arrest in S phase, which is similar to that in lung cancer cells (Ji et al., 2013) and tongue squamous carcinoma (Wang et al., 2019).
In the current study, we performed RNA-seq in three tumor cell lines after interfering with PRR11 for the first time. In order to thoroughly explore the cancer-promoting effects of PRR11, we integrated and analyzed the RNA-seq generated by ourselves and the TCGA pan-cancer data. Although it was reported that PRR11 could mediate the Akt/mTOR signaling pathway in non-small-cell lung cancer (Zhang et al., 2018), p38 MAPK signaling in pancreatic cancer cells (Lin et al., 2020), as well as Wnt/β-catenin signal transduction in both esophageal cancer (Zhou et al., 2019) and hepatic carcinoma (Qiao et al., 2019) to participate in cancer development, all of them do not significantly enrich in our GO and KEGG results of both TCGA and RNA-seq. For example, Zhang et al. (2018) showed that PRR11 knockdown decreased AKT and mTOR phosphorylation levels. In contrast, RNA-seq analyses revealed the gene expression changes, but did not provide any information about the phosphorylation status of the AKT/mTOR pathway. Lin et al. (2019) showed that downregulation of USP34 could inhibit proliferation and migration in pancreatic cancer cells and inactivate p38 MAPK signaling via inhibiting PRR11. It demonstrated that these signaling pathways are not common pathways for PRR11 to play a promotional role in pan-cancer. However, the cell cycle pathway was found in GO and KEGG results of both TCGA and RNA-seq. Furthermore, recent evidences (Ji et al., 2013; Zhang et al., 2015; Wang et al., 2019) and our results provided a strong case for PRR11 regulation in S phase of the cell cycle in many cancers. These findings demonstrated that PRR11 might take part in development of pan-cancer by affecting genes involved in the cell cycle.
Unexpectedly, we did not find significant changes in the expression of cyclin genes with downregulation of PRR11, except cyclin D3 (CCND3) in BxPC3. Moreover, the early growth response protein 1 (EGR1) gene was also significantly suppressed after interfering PRR11 in NCI-H460, which is consistent with the result of a previous study (Chen et al., 2015). From the result of the overlap genes between TCGA-4 Cs and RNA-seq, four genes were found to be influenced by PRR11 downregulation, including PTTG1, BRCA2, ATAD2, and BRIP1. PTTG1 has been reported as one of the cell cycle–related genes (Horning et al., 2018; Deng et al., 2021) and to be upregulated in breast, pituitary, ovarian, and uterine cancers (Vlotides et al., 2007). Previous research works have shown that high PTTG1 expression could enhance breast cancer malignancy by augmenting breast cancer stem cell population and epithelial mesenchymal transition in a manner dependent on activation of the PI3K/AKT pathway (Yoon et al., 2012). In the current study, to gain mechanistic insights of how PRR11 regulates the expression of PTTG1, we used ChIP-qPCR and Co-IP to prove that PRR11 was expressed in the nucleus and can interact with and be recruited by E2F1 to the E2F1 binding site (5′-TTTGGGGC-3′) of the PTTG1 promoter region (−256/−142), consequently stimulate the expression of PTTG1. This study provided new ideas for future exploration of the function of PRR11 in promoting tumor development. Moreover, the novel role of PRR11 in modulating PTTG1 expression showing its positive function in the cell cycle will likely encourage people to study the functions of PRR11 in the development of pan-cancer.
In summary, our results revealed that PRR11 affect cancer development through cell apoptosis and autophagy, DNA replication, nuclear division, sister chromatid separation, MAPK signal pathway, and signal transduction by p53 class mediator signal pathways. Notably, PRR11 may play an oncogenic role in pan-cancer progression by regulating the expression of PTTG1 to involve in the cell cycle. In mechanism, PRR11 could combine with E2F1 to the E2F1 binding site of the PTTG1 promoter region, which consequently could stimulate the expression of PTTG1. To our knowledge, this is the first study demonstrating the common regulation role of PRR11 on PTTG1 in different human cancer cells.
The datasets presented in this study can be found in online repositories. The names of the repository/repositories and accession number(s) can be found in the article/Supplementary Material.
HD, SL, and HZ participated in study design. HZ performed the bioinformatic analysis. ZH assisted in the bioinformatic analysis and revised the manuscript. LQ performed the experiments. SL performed in the experiments and wrote the manuscript. The remaining authors gave necessary support. All authors read and approved the final manuscript.
This work was supported by the National Key R&D Program of China (2018YFC0910200) and the Key R&D Program of Guangdong province (2019B020226001).
The authors declare that the research was conducted in the absence of any commercial or financial relationships that could be construed as a potential conflict of interest.
All claims expressed in this article are solely those of the authors and do not necessarily represent those of their affiliated organizations, or those of the publisher, the editors and the reviewers. Any product that may be evaluated in this article, or claim that may be made by its manufacturer, is not guaranteed or endorsed by the publisher.
The Supplementary Material for this article can be found online at: https://www.frontiersin.org/articles/10.3389/fmolb.2022.877320/full#supplementary-material
TCGA-4 Cs, more than four types of cancers in 11 cancers with normal tissues ≥ 30 in TCGA.
Bader, G. D., and Hogue, C. W. (2003). An automated method for finding molecular complexes in large protein interaction networks. BMC Bioinforma. 4, 2. doi:10.1186/1471-2105-4-2
Chen, Y., Cha, Z., Fang, W., Qian, B., Yu, W., Li, W., et al. (2015). The prognostic potential and oncogenic effects of PRR11 expression in hilar cholangiocarcinoma. Oncotarget 6 (24), 20419–20433. doi:10.18632/oncotarget.3983
Deng, P., Tan, M., Zhou, W., Chen, C., Xi, Y., Gao, P., et al. (2021). Bisphenol a promotes breast cancer cell proliferation by driving miR-381-3p-PTTG1-dependent cell cycle progression. Chemosphere 268, 129221. doi:10.1016/j.chemosphere.2020.129221
Frankish, A., Diekhans, M., Ferreira, A. M., Johnson, R., Jungreis, I., Loveland, J., et al. (2019). GENCODE reference annotation for the human and mouse genomes. Nucleic Acids Res. 47 (D1), D766-D773–d773. doi:10.1093/nar/gky955
Horning, A. M., Wang, Y., Lin, C. K., Louie, A. D., Jadhav, R. R., Hung, C. N., et al. (2018). Single-cell RNA-seq reveals a subpopulation of prostate cancer cells with enhanced cell-cycle-related transcription and attenuated androgen response. Cancer Res. 78 (4), 853–864. doi:10.1158/0008-5472.Can-17-1924
Hu, H., Song, Z., Yao, Q., Geng, X., Jiang, L., Guo, C., et al. (2018). Proline-rich protein 11 regulates self-renewal and tumorigenicity of gastric cancer stem cells. Cell. Physiol. biochem. 47 (4), 1721–1728. doi:10.1159/000491005
Ji, Y., Xie, M., Lan, H., Zhang, Y., Long, Y., Weng, H., et al. (2013). PRR11 is a novel gene implicated in cell cycle progression and lung cancer. Int. J. Biochem. Cell Biol. 45 (3), 645–656. doi:10.1016/j.biocel.2012.12.002
Kim, D., Paggi, J. M., Park, C., Bennett, C., and Salzberg, S. L. (2019). Graph-based genome alignment and genotyping with HISAT2 and HISAT-genotype. Nat. Biotechnol. 37 (8), 907–915. doi:10.1038/s41587-019-0201-4
Lin, C., Xia, J., Gu, Z., Meng, Y., Gao, D., and Wei, S. (2020). Downregulation of USP34 inhibits the growth and migration of pancreatic cancer cells via inhibiting the PRR11. Onco. Targets. Ther. 13, 1471–1480. doi:10.2147/ott.S228857
Love, M. I., Huber, W., and Anders, S. (2014). Moderated estimation of fold change and dispersion for RNA-seq data with DESeq2. Genome Biol. 15 (12), 550. doi:10.1186/s13059-014-0550-8
Qiao, W., Wang, H., Zhang, X., and Luo, K. (2019). Proline-rich protein 11 silencing inhibits hepatocellular carcinoma growth and epithelial-mesenchymal transition through beta-catenin signaling. Gene 681, 7–14. doi:10.1016/j.gene.2018.09.036
Song, Z., Liu, W., Xiao, Y., Zhang, M., Luo, Y., Yuan, W., et al. (2015). PRR11 is a prognostic marker and potential oncogene in patients with gastric cancer. PLoS One 10 (8), e0128943. doi:10.1371/journal.pone.0128943
Szklarczyk, D., Gable, A. L., Lyon, D., Junge, A., Wyder, S., Huerta-Cepas, J., et al. (2019). STRING v11: protein-protein association networks with increased coverage, supporting functional discovery in genome-wide experimental datasets. Nucleic Acids Res. 47 (D1), D607-D613–d613. doi:10.1093/nar/gky1131
Tan, S., Jiang, Z., Hou, A., Wang, J., Zhang, J., and Dai, L. (2017). Expression of PRR11 protein and its correlation with pancreatic cancer and effect on survival. Oncol. Lett. 13 (6), 4117–4122. doi:10.3892/ol.2017.5974
Vlotides, G., Eigler, T., and Melmed, S. (2007). Pituitary tumor-transforming gene: physiology and implications for tumorigenesis. Endocr. Rev. 28 (2), 165–186. doi:10.1210/er.2006-0042
Wang, C., Yu, L., Ren, X., Wu, T., Chen, X., Huang, Y., et al. (2019). The oncogenic potential of PRR11 gene in tongue squamous cell carcinoma cells. J. Cancer 10 (11), 2541–2551. doi:10.7150/jca.29265
Wang, K., Li, F., Yuan, Y., Shan, L., Cui, Y., Qu, J., et al. (2020). Synovial mesenchymal stem cell-derived EV-packaged miR-31 downregulates histone demethylase KDM2A to prevent knee osteoarthritis. Mol. Ther. Nucleic Acids 22, 1078–1091. doi:10.1016/j.omtn.2020.09.014
Wang, Y., Zhang, Y., Zhang, C., Weng, H., Li, Y., Cai, W., et al. (2015). The gene pair PRR11 and SKA2 shares a NF-Y-regulated bidirectional promoter and contributes to lung cancer development. Biochim. Biophys. Acta 1849 (9), 1133–1144. doi:10.1016/j.bbagrm.2015.07.002
Yoon, C. H., Kim, M. J., Lee, H., Kim, R. K., Lim, E. J., Yoo, K. C., et al. (2012). PTTG1 oncogene promotes tumor malignancy via epithelial to mesenchymal transition and expansion of cancer stem cell population. J. Biol. Chem. 287 (23), 19516–19527. doi:10.1074/jbc.M111.337428
Zhang, C., Zhang, Y., Li, Y., Zhu, H., Wang, Y., Cai, W., et al. (2015). PRR11 regulates late-S to G2/M phase progression and induces premature chromatin condensation (PCC). Biochem. Biophys. Res. Commun. 458 (3), 501–508. doi:10.1016/j.bbrc.2015.01.139
Zhang, L., Lei, Y., Zhang, Y., Li, Y., Bu, Y., Song, F., et al. (2018). Silencing of PRR11 suppresses cell proliferation and induces autophagy in NSCLC cells. Genes Dis. 5 (2), 158–166. doi:10.1016/j.gendis.2017.12.003
Zhou, L., Deng, Z. Z., Li, H. Y., Jiang, N., Wei, Z. S., Hong, M. F., et al. (2019). Overexpression of PRR11 promotes tumorigenic capability and is associated with progression in esophageal squamous cell carcinoma. Onco. Targets. Ther. 12, 2677–2693. doi:10.2147/ott.S180255
Keywords: proline rich 11 (PRR11), pituitary tumor-transforming gene 1 (PTTG1), cell cycle, cell migration, pan-cancer
Citation: Zhang H, He Z, Qiu L, Wei J, Gong X, Xian M, Chen Z, Cui Y, Fu S, Zhang Z, Hu B, Zhang X, Lin S and Du H (2022) PRR11 promotes cell proliferation by regulating PTTG1 through interacting with E2F1 transcription factor in pan-cancer. Front. Mol. Biosci. 9:877320. doi: 10.3389/fmolb.2022.877320
Received: 16 February 2022; Accepted: 18 July 2022;
Published: 19 August 2022.
Edited by:
Xin Zhang, Jiangmen Central Hospital, ChinaReviewed by:
Tatsuo Kido, University of California San Francisco, United StatesCopyright © 2022 Zhang, He, Qiu, Wei, Gong, Xian, Chen, Cui, Fu, Zhang, Hu, Zhang, Lin and Du. This is an open-access article distributed under the terms of the Creative Commons Attribution License (CC BY). The use, distribution or reproduction in other forums is permitted, provided the original author(s) and the copyright owner(s) are credited and that the original publication in this journal is cited, in accordance with accepted academic practice. No use, distribution or reproduction is permitted which does not comply with these terms.
*Correspondence: Hongli Du, aGxkdUBzY3V0LmVkdS5jbg==; Shudai Lin, bGluc2Q4OXN5bHZpYUAxNjMuY29t
†These authors have contributed equally to this work and share first authorship
Disclaimer: All claims expressed in this article are solely those of the authors and do not necessarily represent those of their affiliated organizations, or those of the publisher, the editors and the reviewers. Any product that may be evaluated in this article or claim that may be made by its manufacturer is not guaranteed or endorsed by the publisher.
Research integrity at Frontiers
Learn more about the work of our research integrity team to safeguard the quality of each article we publish.