
94% of researchers rate our articles as excellent or good
Learn more about the work of our research integrity team to safeguard the quality of each article we publish.
Find out more
ORIGINAL RESEARCH article
Front. Mol. Biosci., 14 April 2022
Sec. Molecular Diagnostics and Therapeutics
Volume 9 - 2022 | https://doi.org/10.3389/fmolb.2022.806727
This article is part of the Research TopicCancer Diagnostics in Solid Tumors - From Pathology to Precision OncologyView all 20 articles
 Weicheng Zheng1,2†
 Ruolan Zhang2†
 Ziru Huang2†
 Jianpeng Li2Haonan Wu2
 Yuwei Zhou2Jinwei Zhu2
 Xianlong Wang2*
Background: Telomerase reverse transcriptase promoter (TERT-p) mutation has been frequently found, but associated with contrary prognosis, in both low-grade gliomas and glioblastomas. For the low-grade gliomas (Grades II-III), TERT-p mutant patients have a better prognosis than the wildtype patients, whereas for the GBMs (Grade IV), TERT-p mutation is related to a poor prognosis. We hypothesize that there exist high-risk patients in LGGs who share GBM-like molecular features, including TERT-p mutation, and need more intensive treatment than other LGGs. A molecular signature is needed to identify these high-risk patients for an accurate and timely treatment.
Methods: Using the within-sample relative expression orderings of gene pairs, we identified the gene pairs with significantly stable REOs, respectively, in both the TERT-p mutant LGGs and GBMs but with opposite directions in the two groups. These reversely stable gene pairs were used as the molecular signature to stratify the LGGs into high-risk and low-risk groups.
Results: A signature consisting of 21 gene pairs was developed, which can classify LGGs into two groups with significantly different overall survival. The high-risk group has a similar genetic mutation profile and a similar survival profile as GBMs, and these high-risk tumors may progress to a more malignant state.
Conclusion: The 21 gene-pair signature based on REOs is capable of identifying high-risk patients in LGGs and guiding the clinical choice for appropriate and timely intervention.
Primary tumors account for more than half of central nervous system tumors, of which gliomas are the most frequent, accounting for 45–50% of all primary malignant brain tumors (Williams et al., 2018; Ostrom et al., 2019). Based on histopathological criteria, gliomas are classified into low-grade gliomas (LGGs) and glioblastoma (GBMs, Grade IV). The LGGs consist of oligodendroglioma (OD, Grades II-III) and astrocytoma (A, Grades II-III) (Louis et al., 2016). A frustrating reality is that not much progress has been made in prediction and treatment of gliomas for a long time (Filbin and Suva, 2016). Gliomas have a characteristic diffusely infiltrative pattern of growth in brain, and it is impossible to achieve complete resection (Cancer Genome Atlas Research et al., 2015). Prediction of the clinical outcome is often inaccurate because current standards are often subjective and dependent on pathologists’ experience, and it is almost impossible to distinguish the mixed histological appearance of glioma tissues (Cancer Genome Atlas Research et al., 2015). High interobserver variability results in high risk of misclassification, which has documented serious clinical consequences and may affect the choice of treatment options and prognosis of patients (Foote et al., 2015).
In recent years, various molecular markers have been discovered for gliomas, including isocitrate dehydrogenase 1 and 2 (IDH 1/2) mutations (Lu et al., 2012), codeletion of chromosome arms 1p and 19q (1p19q co-del) (Cairncross et al., 2013; van den Bent et al., 2013; Buckner et al., 2017) and telomerase reverse transcriptase promoter (TERT-p) hotspot mutations (Chan et al., 2015; Foote et al., 2015; Heidenreich et al., 2015; Masui et al., 2018). The 2016 World Health Organization (WHO) Classification of Tumors of the Central Nervous System (CNS) integrated IDH and 1p/19q co-del into clinical diagnosis (Louis et al., 2016). These molecular diagnostic markers are challenging our prior assumptions concerning the definitions of gliomas and becoming one of the most important factors for glioma prognosis (Buckner et al., 2017).
TERT is an enzyme that maintains the length of telomeres (O'Sullivan and Karlseder, 2010; Heidenreich and Kumar, 2017). Approximately 83% of primary GBMs (Killela et al., 2013) and 79.3% of OD (Killela et al., 2014) harbor a mutation of C to T in a mutually exclusive manner in the promoter of TERT at either -124 or -146 bp upstream from the transcription start site (Heidenreich et al., 2015). The mutations result in an additional ETS (E26 transformation-specific family transcription factor) binding site recognized by GABPA (GA-binding protein A), which facilitates reactivation of telomerases (Bollam et al., 2018). Previous research found that mutations of TERT-p lead to an increase in transcriptional activity by 2–4 times (Heidenreich et al., 2015).
The TERT-p mutations mainly occur in tumors from tissues with low rates of self-renewal (Heidenreich and Kumar, 2017). While being first discovered in melanoma, the TERT-p mutations have been found defining subsets of patients with adverse disease outcomes in hepatocellular carcinoma, urothelial carcinoma and other tumors (Heidenreich and Kumar, 2017; Heidenreich and Kumar, 2017). The prognostic impact of TERT-p mutation in diffuse gliomas appears to be ambivalent (Arita et al., 2016). In LGGs, TERT-p mutation is a hallmark for better prognosis, whereas in GBM it tends to be associated with poor prognosis (Reitman et al., 2013; Simon et al., 2015). Therefore, the consequence of TERT-p mutation and its interaction with other molecular markers in glioma pathogenesis remain to be fully understood (Bollam et al., 2018). High-throughput genomic sequencing is often used for the detection of TERT-p mutations, but the sensitivity is affected by the proportion of tumor cells and sequencing depth.
Treatment of glioma patients is critical to the prognosis. Gliomas of different grades or specific molecular states should receive corresponding treatments. For example, LGGs especially OD are known to be sensitive to procarbazine, lomustine and vincristine (PCV)-based chemotherapy. The response rate of LGG to PCV as an initial therapy ranges from 52 to 100% (Buckner et al., 2017). GBMs are generally treated with temozolomide (TMZ) after resection (Hegi et al., 2005). While TERT-p mutations mainly occur in OD and GBM, accurate classification to distinguish them is critical for choosing the right treatment. Misclassified patients are at risk of either over-treatment or under-treatment, which is detrimental to clinical decision-making and patient survival. Under-treatment is one of the most serious problems in cancer treatment and directly related to the survival. There is already ample evidence that some gliomas are misclassified as LGGs. They have malignant molecular alterations, but not yet exhibit histopathological characteristics (Bruner et al., 1997; Olar and Sulman, 2015). These gliomas usually have a strong tendency to develop into more malignant states, but indistinguishable due to their mixed histological appearance. Conventional histopathological diagnosis may suffer from morphological ambiguity and interobserver discordance (Arita et al., 2016). It is necessary to develop a robust and objective molecular marker to identify them.
In this study, we aim to develop a robust molecular marker by comparing the transcriptional profiles of LGGs and GBMs, in order to identify patients with high-grade characteristics (GBM-like patients) from LGGs. For these patients, a more aggressive treatment is recommended.
The gene expression profiles used in this study were downloaded from various databases. Datasets GSE61374, GSE16011, GSE43388 and GSE68848 were downloaded from the Gene Expression Omnibus (Barrett et al., 2007) (GEO, http://www.ncbi.nlm.nih.gov/geo/). Datasets TCGA-LGG and TCGA-GBM were downloaded from The Cancer Genome Atlas (TCGA, https://cancergenome.nih.gov/) (Hoadley et al., 2018). Dataset E-MTAB-3892 was downloaded from ArrayExpress (http://www.ebi.ac.uk/arrayexpress/). Dataset CGGA was downloaded from the Chinese Glioma Genome Atlas (CGGA, http://www.cgga.org.cn/) (Bao et al., 2014; Zhao et al., 2017; Hu et al., 2018). The GBM-cohort include 301 sample with TERT mutant status (Arita et al., 2016). Clinical information for each dataset is shown in Table 1 and Supplementary Table S1. The TCGA dataset was used as the training set, which include 130 grades II and III samples and 23 grade IV samples. The TERT-p mutation status of grade IV samples is unknown. In order to further improve the transferability of the classification signature on different profiling platforms, two GEO datasets, GSE16011 (n = 159) and GSE61374 (n = 133, low-grade samples only) were also used for training.
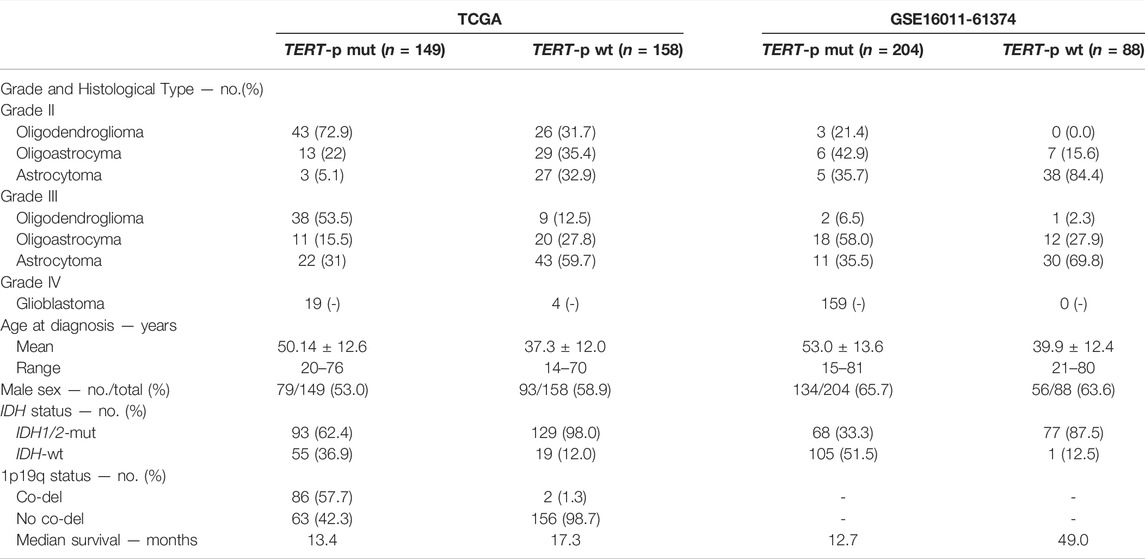
TABLE 1. Clinical characteristics of the training datasets.
Differentially expressed genes (DEGs) were selected between the TERT-p mutant low-grade gliomas (LGGs) and TERT-p mutant GBM (high-grade gliomas) samples using the following procedure. Genes in each sample were ranked by their expression levels while excluding those with a median value of 0 in a training set. The median rank of each gene was then calculated in the two groups of the training set and top 200 genes were selected with the largest difference in the median rank between the LGG group and the GBM group (100 genes up-regulated in the LGG group and 100 genes up-regulated in the GBM group). The common DEGs obtained from the two training sets (TCGA dataset and GEO dataset) were selected as the candidate gene set to develop the gene-pair signature.
The relationship between a pair of genes is denotated as G1 > G2 if the expression level of G1 is greater than that of G2 in a sample. In a cohort of n samples, the probability to observe this relative expression ordering (REO) (Li et al., 2016) in m samples can be represented using the binomial distribution model,
where P0 (P0 = 50%) is the probability to observe the REO in a sample by chance. A gene pair with p < 0.01 was considered with a significantly stable REO.
A reversely stable gene pair refers to a gene pair which is significantly stable in both the GBM cohort and the LGG cohort but with the reversal REO directions, e.g., G1 > G2 in one cohort but G1 < G2 in the other.
Candidate gene pairs with reversely stable REOs were identified in each train set and the overlapping pairs were considered as consistent reversal gene pairs. The binomial distribution model was used to evaluate the significance of consistency between the two groups of gene pairs.
Reclassification of a glioma sample into high-risk and low-risk groups is based on how many gene pairs in the signature showing the REO patterns of the GBM cohort using the majority voting rule. If more than 10 gene pairs among 21 pairs in a sample showing the REO patterns of GBM, the sample is classified as high-risk and also called as the GBM-like sample. Otherwise, it is reclassified as a low-risk sample.
The Kaplan-Meier method was used to estimate the survival curves. The significance of the difference between two survival curves was tested using the log-rank method (Jones and Crowley, 1989). The Cox proportional-hazards model was used to evaluate the hazard ratios of the signature and other factors. All analyses were performed using Python 3.4.1 or R 3.5.1.
In order to investigate the potential of TERT promoter mutation status as a prognostic factor, we compared the overall survival (OS) of TERT-p mutant and wildtype gliomas using E-MTAB-3892 (Kamoun et al., 2016) dataset and a GBM cohort from a previous study (Arita et al., 2016) (Figure 1). In LGGs, we observed a survival advantage of TERT-p mutant patients (p = 6.4E-03, Figure 1A). On the contrary, in the GBM cohort, TERT-p mutant patients showed a significantly shorter OS than the wildtype patients (p < 1E-04, Figure 1B). The median OS of low-grade samples with TERT-p mutations in the TCGA training dataset is shorter than 20 months, which leads us to suspect that there exist GBM-like patients in the low-grade TERT-p mutant samples.
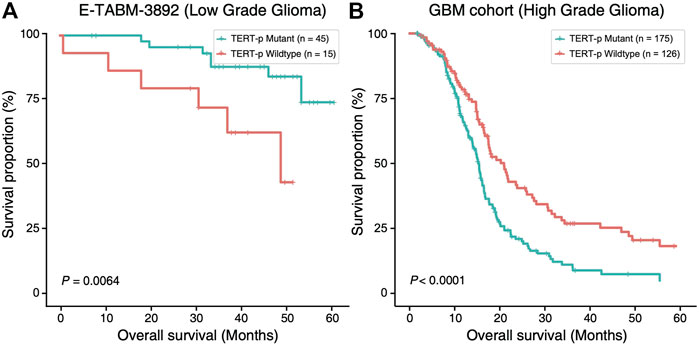
FIGURE 1. Ambivalent prognostic impact of TERT-p mutation. In LGGs (E-TABM-3892 dataset), (A) TERT-p mutant samples have a significantly longer OS than the wildtype samples whereas in GBMs (GBM cohort dataset), (B) TERT-p mutant samples have a significantly shorter OS.
Top 200 DEGs with the largest differences in the median ranks between the LGGs and the GBMs were selected in the two training datasets, respectively. There exist 48 genes shared by the two training datasets with the same differential expression pattern. They were used to develop the classification signature based on REOs. From the GSE61374-GSE16011 dataset and the TCGA dataset, 559 and 485 reversal gene pairs were identified (adjusted p = 0.01), respectively, and with an intersection of 483 gene pairs. The maximum matching algorithm in graph theory is applied to remove the redundancy in the 483 pairs. Finally, 21 pairs of disjoint gene pairs were obtained, which are denoted as 21-GPS. For each gene pair in 21-GPS, the REO patterns (Gene A > Gene B) in Supplementary Table S2 are associated with a worse survival. If more than 10 gene pairs in a sample have these patterns, this sample was classified into the high-risk (GBM-like) group; otherwise, it was classified into the low-risk group. A scheme is given in Figure 2 to show the classification process.
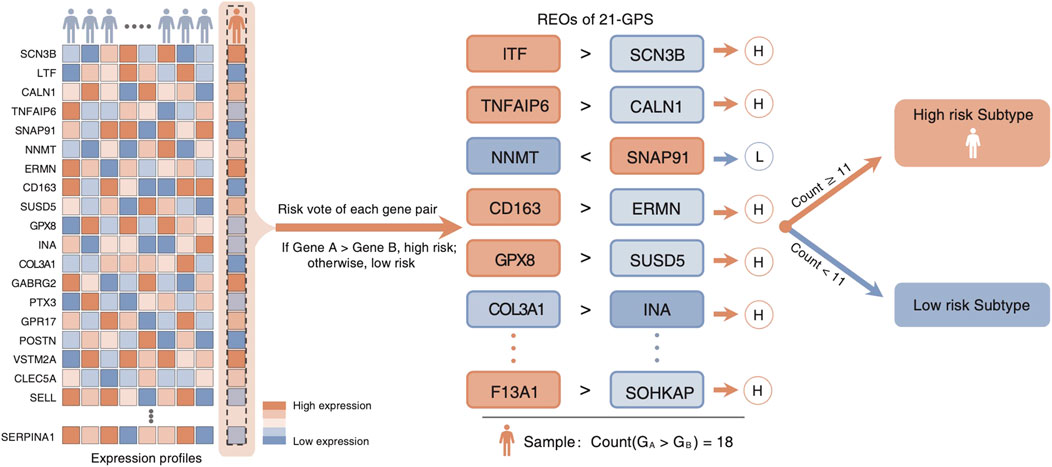
FIGURE 2. Classification scheme of the 21-GPS signature. For a given sample, we evaluate the REO of 21 gene pairs of the signature. If more than or equal to 11 pairs have a REO of gene A > gene B, which is the high-risk pattern, the sample is identified as a high-risk sample.
The 21-GPS signature was first applied to the TERT-p mutant LGGs in both the TCGA training set and an independent validation dataset of CGGA (Figure 3). A group of high-risk samples was identified, respectively, in each dataset (32 in TCGA and 19 in CGGA), which even has a worse OS than the TERT-p wildtype samples. Furthermore, the OS is similar as that of the GBM samples. These samples should receive a more aggressive and early treatment.
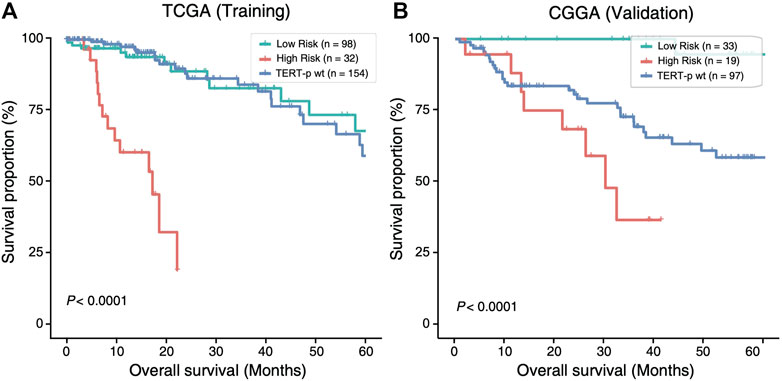
FIGURE 3. The high-risk samples identified by 21-GPS have significantly worse prognosis than the low-risk samples in the TERT-p mutant samples of the training TCGA dataset (A) and the validation CGGA dataset (B). The survival curves of TERT-p wildtype samples are also shown for comparison.
In four datasets without TERT-p mutation status (Supplementary Table S1), 81, 53, 22 and 50 high-risk samples were identified, respectively, in CGGA, GSE68848, GSE43388 and GSE16011, using 21-GPS. All the high-risk samples have a significantly worse OS than the low-risk samples in each dataset (Figure 4). The median OS is shorter than 20 months in GSE68848, GSE43388 and GSE16011.
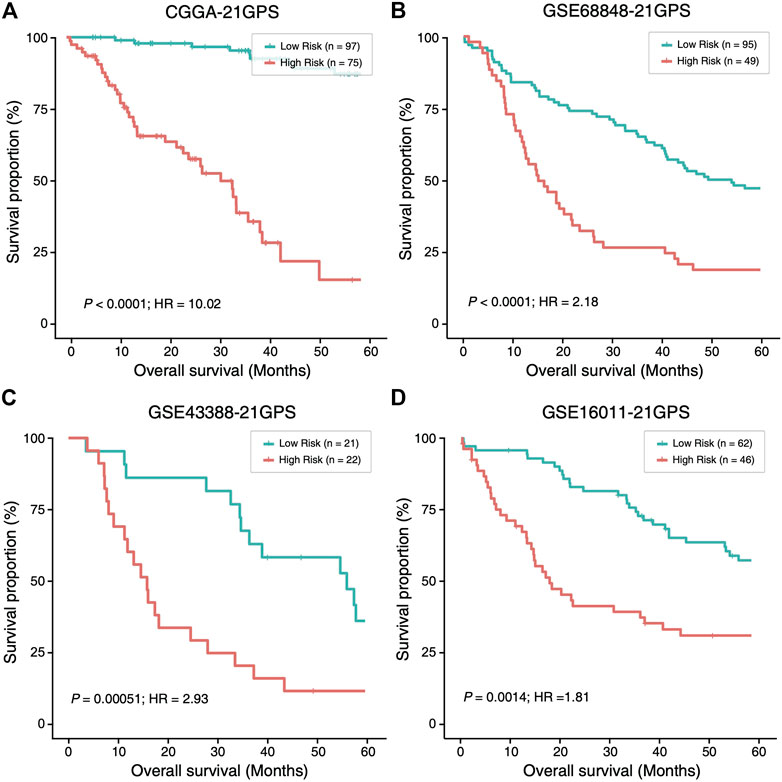
FIGURE 4. The high-risk samples identified by 21-GPS also have significantly worse prognosis than the low-risk samples in four independent datasets without the TERT-p mutation information, CGGA (A), GSE68848 (B), GSE43388 (C) and GSE16011 (D). Hazard ratio (HR) associated with IDH mutation is comparing the wildtype ones with respect to the mutant ones in this figure and Figure 5.
In the CGGA dataset, approximately 45% of LGGs were reclassified as high-risk samples. Among the high-risk samples, the proportion of IDH wildtype samples is significantly higher than that in the low-risk group (39.5 vs. 17.0%) and the proportion of grade III patients is also significantly higher (60.5 vs. 4.2%). Therefore, the high-risk group is enriched with grade III and IDH wildtype patients who have a greater survival risk.
Mutation statuses of IDH and TERT promoter have been used to classify gliomas in previous studies. Therefore, we sought to investigate the prognostic value of 21-GPS in comparison with the classification results based on the IDH and TERT-p mutation statuses using survival analysis. In the CGGA dataset of LGGs, a similar classification performance was observed between 21-GPS and IDH mutation status in the TERT-p mutant group (p < 0.0001 vs. p < 0.0001, log-rank test, Figures 5A,B). However, in the TERT-p wildtype samples, the 21-GPS classifier showed a much better classification performance than IDH mutation status (p < 0.0001 vs. p = 0.023, log-rank test, Figures 5C,D). In both the TERT-p mutant and wildtype groups, the 21-GPS classifier achieved higher hazard ratios than the IDH mutation status. Furthermore, we also carried out receiver operating characteristic (ROC) curve analysis to evaluate the classification performance of 21-GPS and IDH mutation status, using 3-year survival as the threshold to distinguish the reference high risk and low-risk groups (Supplementary Figure S1). The area under the ROC curve (AUC) is also higher for 21-GPS than for IDH mutation in both the TERT-p mutant group (0.955 vs. 0.886) and the TERT-p wildtype group (0.862 vs. 0.660). Thus, 21-GPS has a higher prognostic value than IDH mutation in stratifying LGGs.
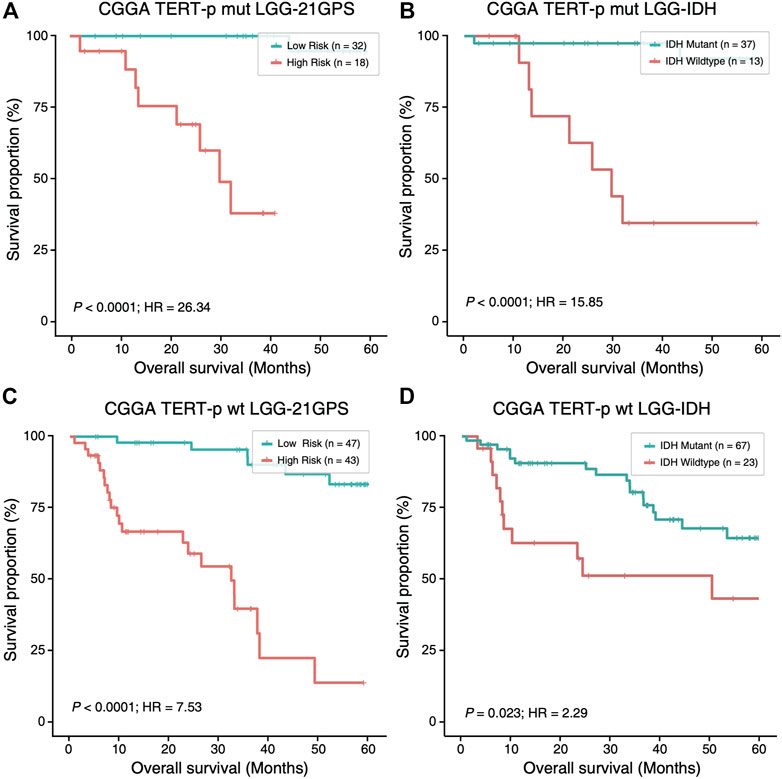
FIGURE 5. Comparison of the survival curves of the 21-GPS classification with the IDH-based classification in the TERT-p mutant samples (A,B) and wildtype samples (C,D). The survival of the high-risk samples is significantly shorter than the low-risk samples in both the TERT-p mutated (A) and wildtype (C) LGGs. The survival of the IDH wildtype samples is also shorter than the IDH mutant samples in the TERT-p mutant LGGs or in the TERT-p wildtype LGGs (D). But the hazard ratios and the significance levels are higher in the 21-GPS classification than the IDH classification.
Univariate and multivariate Cox regression models were used to evaluate the prognostic value of 21-GPS along common clinicopathological factors such as age, gender and IDH mutation status (Supplementary Table S3). In the TCGA and CGGA datasets, the Cox regression analysis were performed separately in the TERT-p mutant samples and wildtype samples. As the multivariate Cox regression result shows, the 21-GPS classification result is an independent prognostic factor in all five subsets, including both the training set and independent validation set (TCGA-LGG: HR = 11.33, p < 0.0001; CGGA: HR = 28.11, p < 0.0001; GSE16011-LGG: HR = 1.96, p = 0.0017; GSE68848-LGG: HR = 2.32, p < 0.0001; GSE43388-LGG: HR = 3.39, p = 0.0009). In the multivariate Cox regression result, the 21-GPS classification still shows an excellent prediction performance as an independent prognostic factor. The significance of 21-GPS in predicting OS is stronger than that of IDH mutation. In addition, the classification performance of 21-GPS is stable not only in the datasets obtained on RNA-sequencing platform and but also in the datasets obtained on microarray platforms.
In order to further reveal the molecular characteristics of the high-risk group identified by 21-GPS, somatic mutational landscape is compared between the low-risk and high-risk samples in the TCGA dataset in which the somatic mutation information is available (Figure 6). In Figure 6, we selected the top 10 genes with mutation frequency greater than 3%, e.g., IDH, TERT-p and O-6-methylguanine-DNA methyltransferase promoter (MGMT-p) and some tumor-specific genes, e.g., tumor protein p53 (TP53) and phosphatase and tensin homolog (PTEN). The samples were grouped either by the original high- and low-grade labels (left two panels in Figure 6B) or by the combined IDH and TERT-p mutation statuses (right two panels in Figure 6B). For the latter classification method, only the IDH wildtype and TERT-p mutant subsets are displayed, which are expected to have the worst and best prognosis, respectively, among four possible subsets.
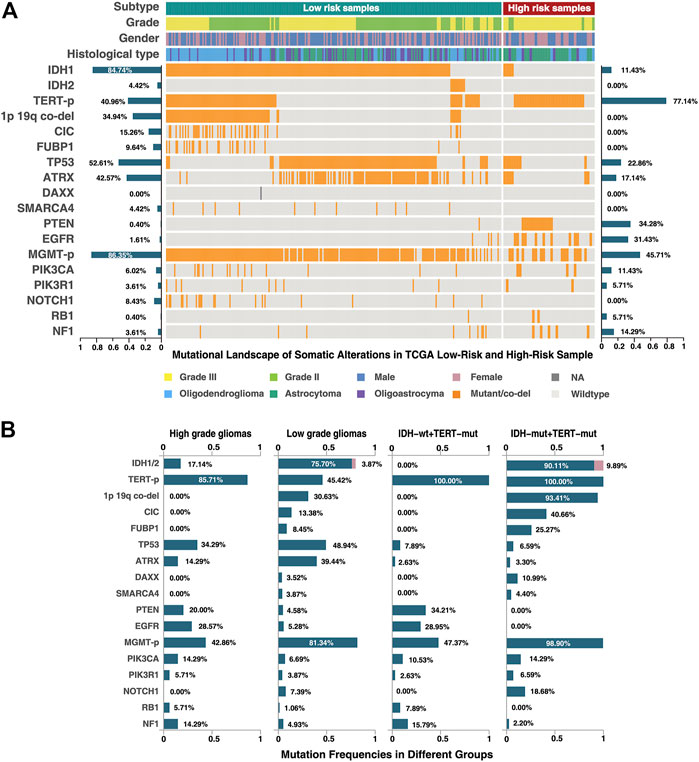
FIGURE 6. Mutational landscape of the low-risk and high-risk samples of the TCGA dataset classified by 21-GPS. The mutation frequencies are shown on the left-side for the low-risk group and on the right-side for the high-risk group in panel (A). The mutation frequencies are also shown for the high-grade (GBM) and low-grade gliomas (left-two panels in (B)) and for the IDH wildtype and mutant groups in the TERT-p mutant panels (right two panels in (B)).
Among the low-risk samples, the proportion of IDH1 and IDH2 mutations, in a mutually exclusive state, is very high (91.6%). The ATRX chromatin remodeler gene (ATRX) and TP53 show a tendency of co-mutation, similar as in low-grade astrocytoma. The proportions of malignant prognostic factors, e.g., mutations of PTEN and the epidermal growth factor receptor gene (EGFR), are very low. In short, the mutational landscape of the low-risk samples shows the classic molecular characteristics of LGGs.
In the high-risk group, we found that most of samples are IDH wildtype, and most of IDH mutant samples are accompanied with ATRX and TP53 mutations or TP53 mutations alone. The TERT-p mutation frequency is more than 80% in the high-risk group. ATRX mutations and TERT-p mutations show a mutually exclusive trend. In the WHO-2016 CNS classification system, primary GBM is characterized by IDH wildtype, and secondary GBM by IDH and ATRX mutations. If we only use the IDH and TERT-p mutation statuses to select the high-risk samples, a significant proportion of samples will be ignored, which can be identified by 21-GPS. Additionally, the landscape also revealed some interesting features in the high-risk samples. For example, IDH wildtype samples are frequently accompanied by EGFR mutations, and PTEN and TP53 mutations tend to be mutually exclusive.
The mutation frequency plots of the high-risk group and the low-risk group (Figure 6A) are similar, respectively, with the high-grade and low-grade subsets. For example, in the high-grade or high-risk groups, the frequency of malignant mutations such as those of PTEN, EGFR and neurofibromin 1 (NF1), are higher while in the low-grade or low-risk groups the frequency of IDH mutations is higher. In the classification system based on the IDH and TERT-p mutation statuses, the samples with ATRX and TP53 mutations are ignored, which represent a significant proportion of LGGs. EGFR mutations appear only in the IDH wildtype samples, but a proportion of EGFR mutated samples were found in the low-grade or low-risk groups. The prognostic value of these less-frequent mutations is ignored by the IDH and TERT-p mutation classification system, but not by our signature.
Diffuse glioma is a highly heterogeneous malignant tumor, which sees no much progress in its classification for more than 10 years (Filbin and Suva, 2016). With the advancement of high-throughput sequencing technologies, molecular markers have become important complements to histological features which make clinical classification of gliomas more accurate. However, we found that some low-grade gliomas have poor survival (less than 20 months), which may be related to inappropriate treatment. Previous study found that TERT-p mutation has a “bivalent” prognostic effect in diffuse gliomas (Arita et al., 2016). The low-grade gliomas especially oligodendrogliomas have the best prognosis and the mutation rate of TERT-p is close to 80%, while GBMs, which have the worst survival, also have a high mutation rate of more than 80% (Arita et al., 2013; Killela et al., 2014; Eckel-Passow et al., 2015). The mechanism of this opposite prognostic impact remains unexplained. One possible reason is due to high heterogeneity in gliomas and the classification based on the mutation status of a single-gene could lead wrong results. For example, if a tumor is mixed with IDH-mutated oligodendrogliomas and IDH-wildtype GBM, it will be classified as IDH-mutated oligodendrogliomas because the high sensitivity of next-generation sequencing technique enables us to detect the mutation at a very low tumor cell purity. But GBMs usually progress at a much higher rate and the tumor should be treated as GBM instead of oligodendroglioma. Our signature is based on the relative expression orderings of 21 gene pairs and uses the principle of majority voting to classify a sample. It has more robust performance than the classification based on genetic mutation statuses against tumor heterogeneity and sampling uncertainty.
Mutant (mut) or wildtype (wt) statuses of IDH and TERT-p have been used to classify gliomas into four categories (both mut, both wt, IDH mut and TERT-p wt, and IDH wt and TERT-p mut) (Zhang et al., 2015; Arita et al., 2016; Akyerli et al., 2018), which were shown significantly associated with prognosis. But this simple molecular classification does not consider the influence of tumor grades and cannot explain the biological mechanism of these two molecules. We show that the classification efficiency of IDH is not significant in the TERT-p wt samples. But our signature can classify both TERT-p wt samples and the mutation-status unknown samples robustly.
Using our signature to analyze the TCGA cohort, we found that the proportion of grade III samples is significantly greater than that of grade II in the high-risk group (Figure 6) and the IDH mutation frequency is significantly lower (15.9%) in the high-risk group than in the low-risk group while the frequencies of other malignant mutations are significantly higher. Among the high-risk samples, we found no samples with co-mutations of IDH and TERT-p, and those IDH mutated and TERT-p wildtype samples are usually accompanied by ATRX and TP53 mutations. This is consistent with our understanding on GBM. In the IDH mutated high-risk samples, most of them are co-mutated with ATRX, which represents a typical molecular state of recurrent glioblastoma. In IDH wildtype high-risk samples, most of them carry the mutations of PTEN and/or EGFR, which are the characteristics of primary GBMs. The result is consistent with the telomere replacement extension mechanism discussed in previous studies (Heaphy et al., 2011; Akter and Kamijo, 2021; Rachakonda et al., 2021; Valenzuela et al., 2021). This indicates that our signature is capable of identifying the high-risk samples with either primary or recurrent malignant GBM characteristics.
In the fifth edition of the World Health Organization (WHO) Classification of Tumors of the Central Nervous System (WHO CNS5), which was released recently (Louis et al., 2021; Wen and Packer, 2021), IDH wildtype diffuse and astrocytic gliomas are classified as “GBM (IDH wildtype subtype)" with the presence of TERT-p mutation or EGFR gene amplification. This change reflects that there exist high-risk samples similar to GBM in grade II/III gliomas, even if they do not show the histological characteristics of GBM. In Figure 6, 77% of the reclassified high-risk group have TERT-p mutations, and 31.43% have EGFR mutations (EGFR mutation rate is only 1.61% in the low-risk group). This result is consistent with the new classification of WHO CNS5. In addition, in the low-risk group, almost all samples with TERT-p mutations are oligodendrogliomas, which characterizes the “oligodendroglioma, IDH mutant, TERT-p mutant” group in CNS5. In the reclassified TCGA cohort, approximately 90% of the high-risk group are IDH wildtype, and most of them were labeled as astrocytoma. In the other 10% of samples with IDH mutation did not include oligodendrogliomas, and they are likely to be classified as “Astrocytoma, IDH-mutant, grade IV” in CNS5. Therefore, our signature can screen out high-risk samples with GBM-like characteristics from all glioma samples, which has high potential in clinical application.
In conclusion, we developed a molecular signature based on the relative expression orderings of 21 gene pairs which can identify high-risk samples from gliomas, without relying on WHO grade and IDH status. These high-risk tumors show GBM-like characteristics and should receive more aggressive treatment. The 21-GPS has great potential to be applied to clinical diagnosis in the future.
Publicly available datasets were analyzed in this study. This data can be found here: The datasets GSE16011, GSE61374, GSE68848, GSE43388 for this study can be found in the Gene Expression Omnibus, https://www.ncbi.nlm.nih.gov/geo/. The datasets TCGA for this study can be found in The Cancer Genome Atlas, https://cancergenome.nih.gov/. The datasets CGGA for this study can be found in the Chinese Glioma Genome Atlas, http://www.cgga.org.cn/. The datasets E-MTAB-3892 for this study can be found in ArrayExpress, https://www.ebi.ac.uk/arrayexpress/.
WZ designed the experiments; RZ and ZH performed the analysis and drafted the manuscript; JL, HW, YZ and JZ contributed to data collection, analysis and results discussion; and X.W. supervised the project and revised the manuscript.
XW acknowledges the financial support from Fujian Medical University (Grant No. XRCZX2017001) and the Natural Science Foundation of Fujian Province (Grant No. 2019J01294).
The authors declare that the research was conducted in the absence of any commercial or financial relationships that could be construed as a potential conflict of interest.
All claims expressed in this article are solely those of the authors and do not necessarily represent those of their affiliated organizations, or those of the publisher, the editors and the reviewers. Any product that may be evaluated in this article, or claim that may be made by its manufacturer, is not guaranteed or endorsed by the publisher.
Professor Zhen Guo from Harbin Medical University supervised the project initially but passed away in 2019 unfortunately.
The Supplementary Material for this article can be found online at: https://www.frontiersin.org/articles/10.3389/fmolb.2022.806727/full#supplementary-material
Akter, J., and Kamijo, T. (2021). How Do Telomere Abnormalities Regulate the Biology of Neuroblastoma? Biomolecules 11 (8), 1112. doi:10.3390/biom11081112
Akyerli, C. B., Yüksel, Ş., Can, Ö., Erson-Omay, E. Z., Oktay, Y., Coşgun, E., et al. (2018). Use of Telomerase Promoter Mutations to Mark Specific Molecular Subsets with Reciprocal Clinical Behavior in IDH Mutant and IDH Wild-type Diffuse Gliomas. J. Neurosurg. 128 (4), 1102–1114. doi:10.3171/2016.11.JNS16973
Arita, H., Narita, Y., Fukushima, S., Tateishi, K., Matsushita, Y., Yoshida, A., et al. (2013). Upregulating Mutations in the TERT Promoter Commonly Occur in Adult Malignant Gliomas and Are Strongly Associated with Total 1p19q Loss. Acta Neuropathol. 126 (2), 267–276. doi:10.1007/s00401-013-1141-6
Arita, H., Yamasaki, K., Matsushita, Y., Nakamura, T., Shimokawa, A., Takami, H., et al. (2016). A Combination of TERT Promoter Mutation and MGMT Methylation Status Predicts Clinically Relevant Subgroups of Newly Diagnosed Glioblastomas. Acta Neuropathol. Commun. 4 (1), 79. doi:10.1186/s40478-016-0351-2
Bao, Z.-S., Chen, H.-M., Yang, M.-Y., Zhang, C.-B., Yu, K., Ye, W.-L., et al. (2014). RNA-seq of 272 Gliomas Revealed a Novel, Recurrent PTPRZ1-MET Fusion Transcript in Secondary Glioblastomas. Genome Res. 24 (11), 1765–1773. doi:10.1101/gr.165126.113
Barrett, T., Troup, D. B., Wilhite, S. E., Ledoux, P., Rudnev, D., Evangelista, C., et al. (2007). NCBI GEO: Mining Tens of Millions of Expression Profiles-Ddatabase and Tools Update. Nucleic Acids Res. 35, D760–D765. doi:10.1093/nar/gkl887
Bollam, S. R., Berens, M. E., and Dhruv, H. D. (2018). When the Ends Are Really the Beginnings: Targeting Telomerase for Treatment of GBM. Curr. Neurol. Neurosci. Rep. 18 (4), 15. doi:10.1007/s11910-018-0825-7
Bruner, J. M., Inouye, L., Fuller, G. N., and Langford, L. A. (1997). Diagnostic Discrepancies and Their Clinical Impact in a Neuropathology Referral Practice. Cancer 79 (4), 796–803. doi:10.1002/(sici)1097-0142(19970215)79:4<796::aid-cncr17>3.0.co;2-v
Buckner, J., Giannini, C., Eckel-Passow, J., Lachance, D., Parney, I., Laack, N., et al. (2017). Management of Diffuse Low-Grade Gliomas in Adults - Use of Molecular Diagnostics. Nat. Rev. Neurol. 13 (6), 340–351. doi:10.1038/nrneurol.2017.54
Cairncross, G., Wang, M., Shaw, E., Jenkins, R., Brachman, D., Buckner, J., et al. (2013). Phase III Trial of Chemoradiotherapy for Anaplastic Oligodendroglioma: Long-Term Results of RTOG 9402. Jco 31 (3), 337–343. doi:10.1200/JCO.2012.43.2674
Cancer Genome Atlas Research, N., Brat, D. J., Verhaak, R. G., Aldape, K. D., Yung, W. K., Salama, S. R., et al. (2015). Comprehensive, Integrative Genomic Analysis of Diffuse Lower-Grade Gliomas. N. Engl. J. Med. 372 (26), 2481–2498. doi:10.1056/NEJMoa1402121
Chan, A. K.-Y., Yao, Y., Zhang, Z., Chung, N. Y.-F., Liu, J. S.-M., Li, K. K.-W., et al. (2015). TERT Promoter Mutations Contribute to Subset Prognostication of Lower-Grade Gliomas. Mod. Pathol. 28 (2), 177–186. doi:10.1038/modpathol.2014.94
Eckel-Passow, J. E., Lachance, D. H., Molinaro, A. M., Walsh, K. M., Decker, P. A., Sicotte, H., et al. (2015). Glioma Groups Based on 1p/19q,IDH, andTERTPromoter Mutations in Tumors. N. Engl. J. Med. 372 (26), 2499–2508. doi:10.1056/NEJMoa1407279
Filbin, M. G., and Suvà, M. L. (2016). Gliomas Genomics and Epigenomics: Arriving at the Start and Knowing it for the First Time. Annu. Rev. Pathol. Mech. Dis. 11, 497–521. doi:10.1146/annurev-pathol-012615-044208
Foote, M. B., Papadopoulos, N., and Diaz, L. A. (2015). Genetic Classification of Gliomas: Refining Histopathology. Cancer Cell 28 (1), 9–11. doi:10.1016/j.ccell.2015.06.014
Heaphy, C. M., de Wilde, R. F., Jiao, Y., Klein, A. P., Edil, B. H., Shi, C., et al. (2011). Altered Telomeres in Tumors with ATRX and DAXX Mutations. Science 333 (6041), 425. doi:10.1126/science.1207313
Hegi, M. E., Diserens, A.-C., Gorlia, T., Hamou, M.-F., de Tribolet, N., Weller, M., et al. (2005). MGMTGene Silencing and Benefit from Temozolomide in Glioblastoma. N. Engl. J. Med. 352 (10), 997–1003. doi:10.1056/NEJMoa043331
Heidenreich, B., and Kumar, R. (2017). TERT Promoter Mutations in Telomere Biology. Mutat. Research/Reviews Mutat. Res. 771, 15–31. doi:10.1016/j.mrrev.2016.11.002
Heidenreich, B., Rachakonda, P. S., Hosen, I., Volz, F., Hemminki, K., Weyerbrock, A., et al. (2015). TERT Promoter Mutations and Telomere Length in Adult Malignant Gliomas and Recurrences. Oncotarget 6 (12), 10617–10633. doi:10.18632/oncotarget.3329
Hoadley, K. A., Yau, C., Hinoue, T., Wolf, D. M., Lazar, A. J., Drill, E., et al. (2018). Cell-of-Origin Patterns Dominate the Molecular Classification of 10,000 Tumors from 33 Types of Cancer. Cell 173 (2), 291–e6. doi:10.1016/j.cell.2018.03.022
Hu, H., Mu, Q., Bao, Z., Chen, Y., Liu, Y., Chen, J., et al. (2018). Mutational Landscape of Secondary Glioblastoma Guides MET-Targeted Trial in Brain Tumor. Cell 175 (6), 1665–1678. doi:10.1016/j.cell.2018.09.038
Jones, M. P., and Crowley, J. (1989). A General Class of Nonparametric Tests for Survival Analysis. Biometrics 45 (1), 157–170. doi:10.2307/2532042
Kamoun, A., Idbaih, A., Idbaih, A., Dehais, C., Elarouci, N., Carpentier, C., et al. (2016). Integrated Multi-Omics Analysis of Oligodendroglial Tumours Identifies Three Subgroups of 1p/19q Co-deleted Gliomas. Nat. Commun. 7, 11263. doi:10.1038/ncomms11263
Killela, P. J., Pirozzi, C. J., Healy, P., Reitman, Z. J., Lipp, E., Rasheed, B. A., et al. (2014). Mutations in IDH1, IDH2, and in the TERT Promoter Define Clinically Distinct Subgroups of Adult Malignant Gliomas. Oncotarget 5 (6), 1515–1525. doi:10.18632/oncotarget.1765
Killela, P. J., Reitman, Z. J., Jiao, Y., Bettegowda, C., Agrawal, N., Diaz, L. A., et al. (2013). TERT Promoter Mutations Occur Frequently in Gliomas and a Subset of Tumors Derived from Cells with Low Rates of Self-Renewal. Proc. Natl. Acad. Sci. U.S.A. 110 (15), 6021–6026. doi:10.1073/pnas.1303607110
Li, X., Cai, H., Zheng, W., Tong, M., Li, H., Ao, L., et al. (2016). An Individualized Prognostic Signature for Gastric Cancer Patients Treated with 5-Fluorouracil-Based Chemotherapy and Distinct Multi-Omics Characteristics of Prognostic Groups. Oncotarget 7 (8), 8743–8755. doi:10.18632/oncotarget.7087
Louis, D. N., Perry, A., Reifenberger, G., von Deimling, A., Figarella-Branger, D., Cavenee, W. K., et al. (2016). The 2016 World Health Organization Classification of Tumors of the Central Nervous System: a Summary. Acta Neuropathol. 131 (6), 803–820. doi:10.1007/s00401-016-1545-1
Louis, D. N., Perry, A., Wesseling, P., Brat, D. J., Cree, I. A., Figarella-Branger, D., et al. (2021). The 2021 WHO Classification of Tumors of the Central Nervous System: a Summary. Neuro Oncol. 23 (8), 1231–1251. doi:10.1093/neuonc/noab106
Lu, C., Ward, P. S., Kapoor, G. S., Rohle, D., Turcan, S., Abdel-Wahab, O., et al. (2012). IDH Mutation Impairs Histone Demethylation and Results in a Block to Cell Differentiation. Nature 483 (7390), 474–478. doi:10.1038/nature10860
Masui, K., Komori, T., Kato, Y., Masutomi, K., Ichimura, K., Ogasawara, S., et al. (2018). Elevated TERT Expression in TERT-Wildtype Adult Diffuse Gliomas: Histological Evaluation with a Novel TERT-specific Antibody. Biomed. Res. Int. 2018, 1–12. doi:10.1155/2018/7945845
O'Sullivan, R. J., and Karlseder, J. (2010). Telomeres: Protecting Chromosomes against Genome Instability. Nat. Rev. Mol. Cel Biol 11 (3), 171–181. doi:10.1038/nrm2848
Olar, A., and Sulman, E. P. (2015). Molecular Markers in Low-Grade Glioma-Toward Tumor Reclassification. Semin. Radiat. Oncol. 25 (3), 155–163. doi:10.1016/j.semradonc.2015.02.006
Ostrom, Q. T., Cioffi, G., Gittleman, H., Patil, N., Waite, K., Kruchko, C., et al. (2019). CBTRUS Statistical Report: Primary Brain and Other Central Nervous System Tumors Diagnosed in the United States in 2012-2016. Neuro Oncol. 21 (Suppl. 5), v1–v100. doi:10.1093/neuonc/noz150
Rachakonda, S., Hoheisel, J. D., and Kumar, R. (2021). Occurrence, Functionality and Abundance of the TERT Promoter Mutations. Intl J. Cancer 149 (11), 1852–1862. doi:10.1002/ijc.33750
Reitman, Z. J., Pirozzi, C. J., and Yan, H. (2013). Promoting a New Brain Tumor Mutation: TERT Promoter Mutations in CNS Tumors. Acta Neuropathol. 126 (6), 789–792. doi:10.1007/s00401-013-1207-5
Simon, M., Hosen, I., Gousias, K., Rachakonda, S., Heidenreich, B., Gessi, M., et al. (2015). TERT Promoter Mutations: a Novel Independent Prognostic Factor in Primary Glioblastomas. Neuro Oncol. 17 (1), 45–52. doi:10.1093/neuonc/nou158
Valenzuela, M., Amato, R., Sgura, A., Antoccia, A., and Berardinelli, F. (2021). The Multiple Facets of ATRX Protein. Cancers 13 (9), 2211. doi:10.3390/cancers13092211
van den Bent, M. J., Brandes, A. A., Taphoorn, M. J. B., Kros, J. M., Kouwenhoven, M. C. M., Delattre, J.-Y., et al. (2013). Adjuvant Procarbazine, Lomustine, and Vincristine Chemotherapy in Newly Diagnosed Anaplastic Oligodendroglioma: Long-Term Follow-Up of EORTC Brain Tumor Group Study 26951. Jco 31 (3), 344–350. doi:10.1200/JCO.2012.43.2229
Wen, P. Y., and Packer, R. J. (2021). The 2021 WHO Classification of Tumors of the Central Nervous System: Clinical Implications. Neuro Oncol. 23 (8), 1215–1217. doi:10.1093/neuonc/noab120
Williams, E. A., Miller, J. J., Tummala, S. S., Penson, T., Iafrate, A. J., Juratli, T. A., et al. (2018). TERT Promoter Wild-type Glioblastomas Show Distinct Clinical Features and Frequent PI3K Pathway Mutations. Acta Neuropathol. Commun. 6 (1), 106. doi:10.1186/s40478-018-0613-2
Zhang, Z.-Y., Chan, A. K.-Y., Ding, X.-J., Qin, Z.-Y., Hong, C. S., Chen, L.-C., et al. (2015). TERTpromoter Mutations Contribute toIDHmutations in Predicting Differential Responses to Adjuvant Therapies in WHO Grade II and III Diffuse Gliomas. Oncotarget 6 (28), 24871–24883. doi:10.18632/oncotarget.4549
Keywords: glioma, TERT promoter, biomarker, transcriptome, relative expression orderings
Citation: Zheng W, Zhang R, Huang Z, Li J, Wu H, Zhou Y, Zhu J and Wang X (2022) A Qualitative Signature to Identify TERT Promoter Mutant High-Risk Tumors in Low-Grade Gliomas. Front. Mol. Biosci. 9:806727. doi: 10.3389/fmolb.2022.806727
Received: 01 November 2021; Accepted: 07 March 2022;
Published: 14 April 2022.
Edited by:
Umberto Malapelle, University of Naples Federico II, ItalyReviewed by:
Pankaj Pathak, National Institutes of Health (NIH), United StatesCopyright © 2022 Zheng, Zhang, Huang, Li, Wu, Zhou, Zhu and Wang. This is an open-access article distributed under the terms of the Creative Commons Attribution License (CC BY). The use, distribution or reproduction in other forums is permitted, provided the original author(s) and the copyright owner(s) are credited and that the original publication in this journal is cited, in accordance with accepted academic practice. No use, distribution or reproduction is permitted which does not comply with these terms.
*Correspondence: Xianlong Wang, d2FuZy54aWFubG9uZ0AxMzkuY29t
†These authors have contributed equally to this work and share first authorship
Disclaimer: All claims expressed in this article are solely those of the authors and do not necessarily represent those of their affiliated organizations, or those of the publisher, the editors and the reviewers. Any product that may be evaluated in this article or claim that may be made by its manufacturer is not guaranteed or endorsed by the publisher.
Research integrity at Frontiers
Learn more about the work of our research integrity team to safeguard the quality of each article we publish.