 Ruojing Bai1†
 Zhen Li
 Wei Hua
 Hao Wu
 Lili Dai
- 1Beijing Key Laboratory for HIV/AIDS Research, Center for Infectious Diseases, Beijing Youan Hospital, Capital Medical University, Beijing, China
- 2Institute of Neurology, Tianjin Third Central Hospital Affiliated to Nankai University, Tianjin, China
- 3Travel Clinic, Center for Infectious Diseases, Beijing Youan Hospital, Capital Medical University, Beijing, China
Background: HIV-infected immunological non-responders (INRs) are characterized by their inability to reconstitute CD4+ T cell pools after antiretroviral therapy. The risk of non-AIDS-related diseases in INRs is increased, and the outcome and prognosis of INRs are inferior to that of immunological responders (IRs). However, few markers can be used to define INRs precisely. In this study, we aim to identify further potential diagnostic markers associated with INRs through bioinformatic analyses of public datasets.
Methods: This study retrieved the microarray data sets of GSE106792 and GSE77939 from the Gene Expression Omnibus (GEO) database. After merging two microarray data and adjusting the batch effect, differentially expressed genes (DEGs) were identified. Gene Ontology (GO) resource and Kyoto Encyclopedia of Genes and Genomes (KEGG) resource were conducted to analyze the biological process and functional enrichment. We performed receiver operating characteristic (ROC) curves to filtrate potential diagnostic markers for INRs. Gene Set Enrichment Analysis (GSEA) was conducted to perform the pathway enrichment analysis of individual genes. Single sample GSEA (ssGSEA) was performed to assess scores of immune cells within INRs and IRs. The correlations between the diagnostic markers and differential immune cells were examined by conducting Spearman’s rank correlation analysis. Subsequently, miRNA-mRNA-TF interaction networks in accordance with the potential diagnostic markers were built with Cytoscape. We finally verified the mRNA expression of the diagnostic markers in clinical samples of INRs and IRs by performing RT-qPCR.
Results: We identified 52 DEGs in the samples of peripheral blood mononuclear cells (PBMC) between INRs and IRs. A few inflammatory and immune-related pathways, including chronic inflammatory response, T cell receptor signaling pathway, were enriched. FAM120AOS, LTA, FAM179B, JUN, PTMA, and SH3YL1 were considered as potential diagnostic markers. ssGSEA results showed that the IRs had significantly higher enrichment scores of seven immune cells compared with IRs. The miRNA-mRNA-TF network was constructed with 97 miRNAs, 6 diagnostic markers, and 26 TFs, which implied a possible regulatory relationship.
Conclusion: The six potential crucial genes, FAM120AOS, LTA, FAM179B, JUN, PTMA, and SH3YL1, may be associated with clinical diagnosis in INRs. Our study provided new insights into diagnostic and therapeutic targets.
Introduction
Acquired immunodeficiency syndrome (AIDS) refers to a serious chronic infectious disease attributed to the human immunodeficiency virus (HIV). Antiretroviral therapy (ART) has been the most common method for treating AIDS. ART is capable of inhibiting HIV replication, restoring the number of CD4+ T cells, and reducing AIDS morbidity and mortality effectively (Saksena et al., 2007; Sabin and Lundgren, 2013).
However, in nearly 15–30% of the infected patients, the number of CD4+ T cells has been at a low level for a long time even after HIV is overall suppressed after long-term ART. These patients are termed immunological non-responders (INRs) (Gazzola et al., 2009; Corbeau and Reynes, 2011). Compared with the immunological responders (IRs), the INRs have elevated levels of immune activation, inflammation, and autoantibodies. To be specific, the morbidity and mortality of non-AIDS-related diseases (e.g., cardiovascular disease, non-AIDS-related tumors, and HIV-related neurocognitive disorders) significantly increased (Engsig et al., 2014; Takuva et al., 2014; Pacheco et al., 2015). Therefore, the early diagnosis of INR is imperative for the prevention and treatment of patients’ clinical diseases. At present, the judgment of immune non-response mainly depends on the count of CD4 while the indicator of CD4 count has some defects. If there is no uniform standard for the specific definition of the CD4 count in immunologically non-responsive patients, it is impossible to completely distinguish between INR and IR. Therefore, it is urgent to explore the diagnostic biomarkers of INR, so as to lay a foundation for elucidating the mechanism of immune non-response and clinical diagnosis.
The occurrence of immune non-response in HIV infected persons might be correlated with numerous factors (e.g., age, duration of HIV infection (Baker, et al., 2008a), CD4+ T cell counts nadir (Moore and Keruly, 2007), inflammation and adverse reaction to IL-7). As reported in existing studies, INRs achieve high levels of T cell activation, which is defined as the co-expression of CD38 and HLA-DR on CD4+ and CD8+ T cells and the up-regulated expression of inflammatory markers in plasma (Lederman et al., 2011). However, INRs diagnostic markers have been rarely studied.
Hence, based on the samples of IRs and INRs obtained from the GEO database, several bioinformatics methods are employed to obtain diagnostic markers that can assess immune response and immune non-response. This can be considered an attempt to present novel auxiliary targets for defining immune non-response.
Materials and Methods
Data Source and Preprocessing
Raw files of two registered microarray data sets, i.e., GSE106792 and GSE77939, originated from the NCBI GEO database (https://www.ncbi.nlm.nih.gov/geo/). A total of 12 INRs and 12 IRs samples of peripheral blood mononuclear cells (PBMC) were covered in GSE106792 data sets. INR subjects were defined as having CD4+ T cell counts below 350 cells/μl, and IRs were defined as possessing CD4+ T cell counts above 350/μL after at least 2 years of ART with virologic control. GSE77939 data sets involved 7 INRs and 5 IRs samples of PBMC. IR subjects were defined as undergoing ART for at least one year or more and showing signs of response to the treatment with an increase of over 150 cells/μL in CD4+ T cell counts and current CD4 counts above 250 cells/μL. Moreover, INRs included HIV-positive individuals on ART for at least one year or more showing undetectable viral load (<40 copies/mL) and CD4+ T cell counts below 250 cells/μL. The combat function in the sva package was adopted to remove the batch effects while normalizing and merging the mentioned two data sets (Leek et al., 2012). Principal component analysis (PCA) was conducted to visualize the spatial distribution of the samples and examine the results of the treatment of the batch effects (Jolliffe and Cadima, 2016).
Patients and Collection of Clinical Samples
The study subjects comprised two populations, i.e., 20 HIV-1-infected patients on ART with undetectable viremia (HIV-RNA < 50 copies/mL) more than 2 years, consisting of 10 HIV-IRs (with CD4+ T cell counts above 350 cells/μL) and 10 HIV-INRs (with CD4+ T cell counts below 250 cells/μL) in the sexually transmitted disease (STD) and AIDS Clinic, Beijing Youan Hospital, Capital Medical University. The exclusion criteria included the coinfection with HBV and HCV, pregnancy, as well as moribund status. Specific information on the patients is listed in Supplementary Table S1.
Identification of Differentially Expressed Genes
The DEGs were determined between INRs and IRs samples with the “limma” R package (Ritchie et al., 2015; Phipson et al., 2016). The |log2 fold change (FC)| > 0.5 and adj. p-Value < 0.05 were considered the cut-off criteria. The results of DEGs were introduced to the heatmap and the volcano map. The location of DEGs on chromosomes was illustrated with the “OmicCircos” package from R software (Zhu et al., 2020).
Functional and Pathway Enrichment Analyses of Differentially Expressed Genes
Gene Ontology (GO) enrichment analysis and Kyoto Encyclopedia of Genes and Genomes (KEGG) pathway analysis were conducted with the DEGs by adopting the “clusterProfiler” package (Yu et al., 2012). On the whole, GO enrichment analysis expresses the biological processes (BP), cellular components (CC), and molecular functions (MF) correlated with DEGs. The biological pathways correlated with DEGs were revealed from KEGG pathway analysis. The threshold for enrichment significance was p-value < 0.05.
Screening of the Diagnostic Markers
After the expression data of the DEGs were extracted from the batch-processed data set, the receiver operating characteristic (ROC) curves of the mentioned DEGs were plotted with the pROC in R package Genes. To be specific, the AUC values over 0.9 showed diagnostic significance and could be considered the diagnostic markers (Obuchowski and Bullen, 2018; Cao and López-de-Ullibarri, 2019). The expression of the diagnostic markers in the merged GEO series was drawn into a box plot and the difference was compared by the Wilcoxon test. The p-value < 0.05 was defined to be statistically significant.
Gene Set Enrichment Analysis
To identify the pathways and processes differently activated or suppressed by the diagnostic markers, GSEA was performed for the single diagnostic marker in GSEA software (v3.0). The expression values of the respective diagnostic marker acted as the phenotype files, and the correlation coefficients of the respective diagnostic marker with each gene in the gene sets were ranked. Furthermore, the “h.all.v7.4.symbols.gmt (hallmarks)” and “c7.all.v7.4.symbols.gmt (Immunologic signatures)” from Molecular Signatures Database (MSigDB) (Xiao et al., 2021) were adopted as the reference gene sets. The threshold for enrichment significance was NOM p-value < 0.05.
Evaluation of Immune Cell Infiltration
The enrichment scores of 28 immune cells in the respective sample were determined with single-sample gene set enrichment analysis (ssGSEA) (Bindea et al., 2013). A box plot was generated to visualize the differences in 28 immune cells infiltration between the INRs and the IRs. By adopting ‘Spearman’ correlation analysis, the correlations between the diagnostic markers and the differential immune cells were analyzed. The correlation coefficient |cor| > 0.3 and p-value < 0.05 was considered with statistical significance.
Construction of miRNA-mRNA-TF Regulatory Network
Target miRNAs of the diagnostic markers were estimated according to miRWalk and miRDB databases. The miRNAs identified in both two databases were considered the target miRNAs. The target TFs of the diagnostic markers were predicted by Network Analyst database. Subsequently, the miRNA-mRNA, mRNA-TF, and miRNA-mRNA-TF interaction networks were built with Cytoscape (Li et al., 2020).
RNA Extraction and Quantitative Real-Time Polymerase Chain Reaction
Total RNA from the 10 INRs and 10 IRs samples was extracted by adopting Nuclezol LS RNA Isolation Reagent following the manufacturer’s instructions (ABP Biosciences Inc.). Subsequently, total RNA was reversely transcribed into cDNA with the SureScript-First-strand-cDNA-synthesis-kit (GeneCopoeia) by complying with the manufacturers’ protocol. qPCR was subsequently performed with the BlazeTaq™ SYBR® Green qPCR Mix 2.0 (GeneCopoeia). The thermocycling conditions below were employed for qPCR, 1 cycle at 95°C for 30 s (initial denaturation), followed by 40 cycles of 10 s at 95°C (denaturation), 20 s at 60°C (annealing), and 30 s at 72°C (extension). Table 1 lists the sequences of the primers. The relative expression level was normalized to the endogenous control GAPDH and then calculated by applying the 2−ΔΔCq method (Livak and Schmittgen, 2001). The student’s t-test was performed to compare the differences between the two groups. The two-tailed p-value < 0.05 in the statistical analysis was defined to be statistically significant.
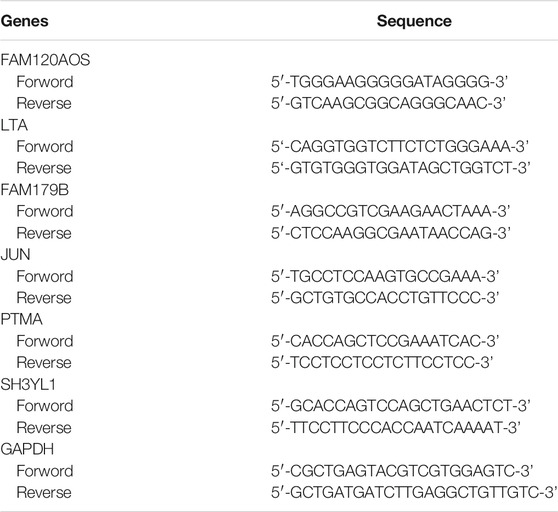
TABLE 1. The relationship in the miRNA-mRNA-TF regulatory network.
Results
Identification of Differentially Expressed Genes
Gene expression levels of merged GEO series with batch effects adjusted were standardized, and the results of PCA before and after processing are presented in Supplementary Figures S1A–C. Merged data sets covered 19 INRs and 17 IRs samples. In total 52 DEGs with |log2 FC| > 0.5 in the INRs samples compared with the IRs samples were identified, i.e., 43 up-regulated genes and 9 down-regulated genes (Supplementary Table S2). Figures 1A,B presents the heatmap plot and volcano plot of 52 DEGs recruited in subsequent analyses. Moreover, the chromosomal locations and expression patterns of the mentioned DEGs are presented in Figure 1C.
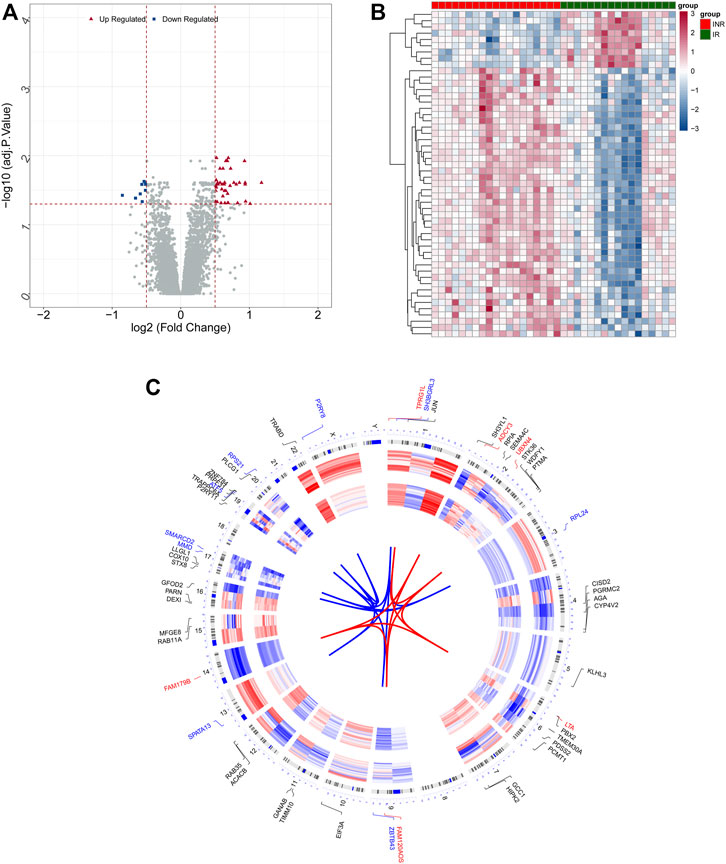
FIGURE 1. Identification of DEGs between INRs and 17 IRs. (A,B) Volcano plot (A) and Heatmap (B) presented the expression of DEGs. (C) The chromosomal locations and expression patterns of DEGs.
Functional Enrichment Analyses of Differentially Expressed Genes
To explore the biological functions of the 52 DEGs in-depth, functional enrichment analyses were conducted, and the results are listed in Supplementary Table S3. GO annotation of DEGs consisted of three parts (i.e., BP, CC, and MF), and the top 10 significantly enriched pathways in accordance with the p-value of the respective category are illustrated (Figures 2A–C). Inflammatory and immune-related pathways were enriched in the BP ontology (e.g., positive regulation of monocyte, regulation of humoral immune response mediated by circulating immunoglobulin, positive regulation of inflammatory response to an antigenic stimulus, chronic inflammatory response, positive regulation of humoral immune response, toll-like receptor three signaling pathways). In the CC ontology, the DEGs were significantly correlated with the endosome membrane, transcription factor complex, trans-Golgi network, transport vesicle membrane, etc. For MF, the DEGs were significantly correlated with phospholipid binding, activating transcription factor binding, electron transfer activity, etc. Next, KEGG analysis was conducted to investigate the vital pathways involved, and the results are displayed in Supplementary Table S4. Figure 2D lists the top 10 enriched terms based on p-values. It was reported that inflammatory and immune-related pathways were enriched (e.g., Th1 and Th2 cell differentiation, inflammatory mediator regulation of TRP channels, NF-kappaB signaling pathway, T cell receptor signaling pathway, Th17 cell differentiation, and Th17 cell differentiation).
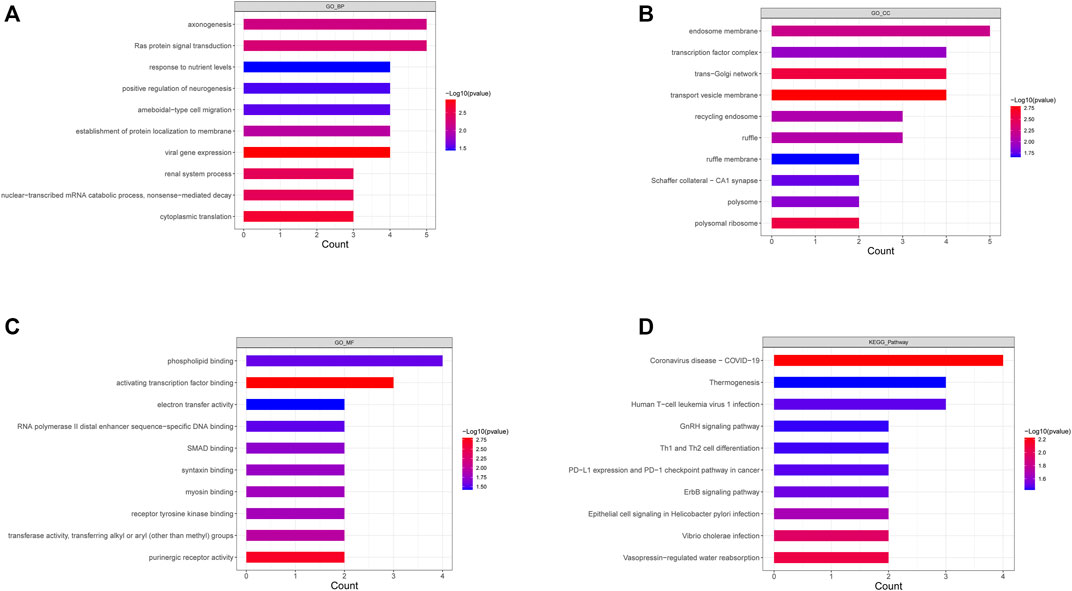
FIGURE 2. Go annotation an KEGG enrichment analysis of DEGs. (A–C) The top 10 terms of BP (A), CC (B), and MF (C) of GO annotation were enriched by DEGs. (D) The top 10 KEGG pathways enriched by DEGs.
Identification of the Diagnostic Markers and Gene Set Enrichment Analysis
ROC analysis was conducted on the 52 DEGs and excavated six genes (FAM120AOS, LTA, FAM179B, JUN, PTMA, SH3YL1) with AUC values over 0.9 (Figures 3A–F), thereby illustrating that the mentioned genes exhibited a powerful discrimination ability to discriminate INRs samples from the IRs samples. GSEA analysis is applicable to the pathway enrichment analysis of individual genes. Subsequently, GSEA was conducted for a single diagnostic marker in the expression data of merged data set in accordance with hallmark gene sets and immunologic signature gene sets (Xiao, et al., 2021). Supplementary Table S5 presents the enrichment results of hallmark and immunologic signature function terms for the respective diagnostic marker. Given NOM p-value, inflammatory signaling pathway, HALLMARK_TGF_BETA_SIGNALING was significantly correlated with LTA expression (Figure 4A). Treg cell-related terms: TREG_VS_TCONV_UP and TREG_VS_TCONV_DN were significantly correlated with PTMA and LTA expressions, respectively (Figures 4B,C). Thus, the genes involved in the mentioned three gene sets(HALLMARK_TGF_BETA_SIGNALING, TREG_VS_TCONV_UP, TREG_VS_TCONV_DN) were obtained, and their expression patterns in the INRs and IRs groups were demonstrated with heatmaps (Younes et al., 2018) (Figures 4D,E).
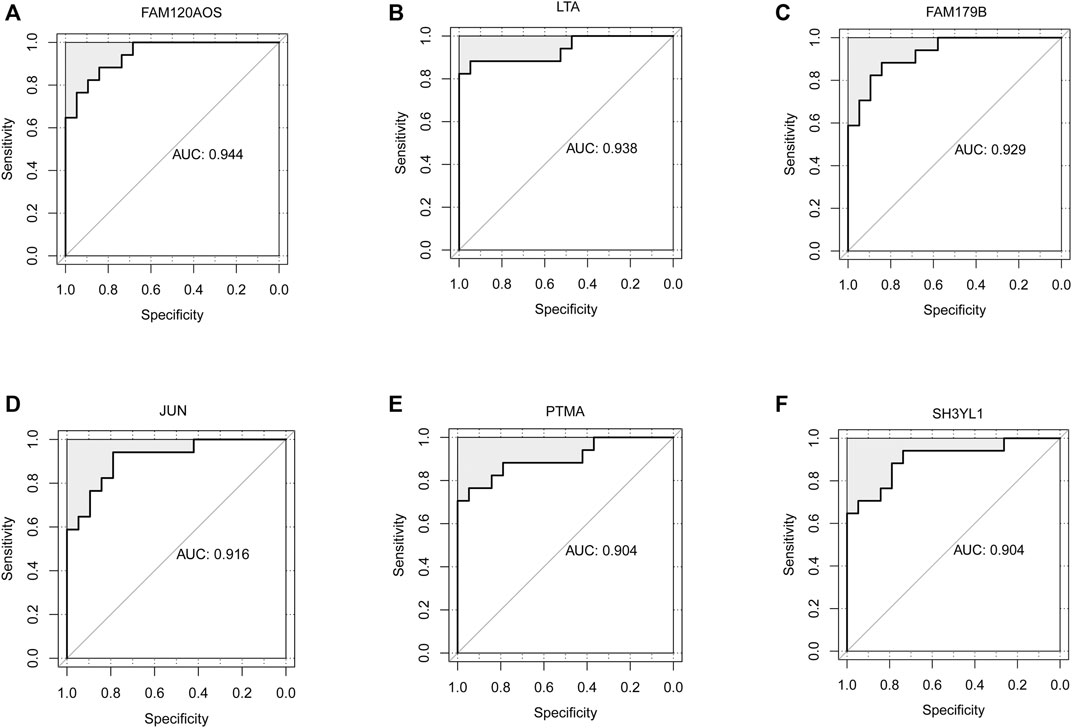
FIGURE 3. Identification of diagnostic markers by ROC analysis. (A–F) ROC curves showed the AUC values of FAM120AOS (A), LTA (B), FAM179B (C), JUN (D), PTMA (E), SH3YL1 (F).
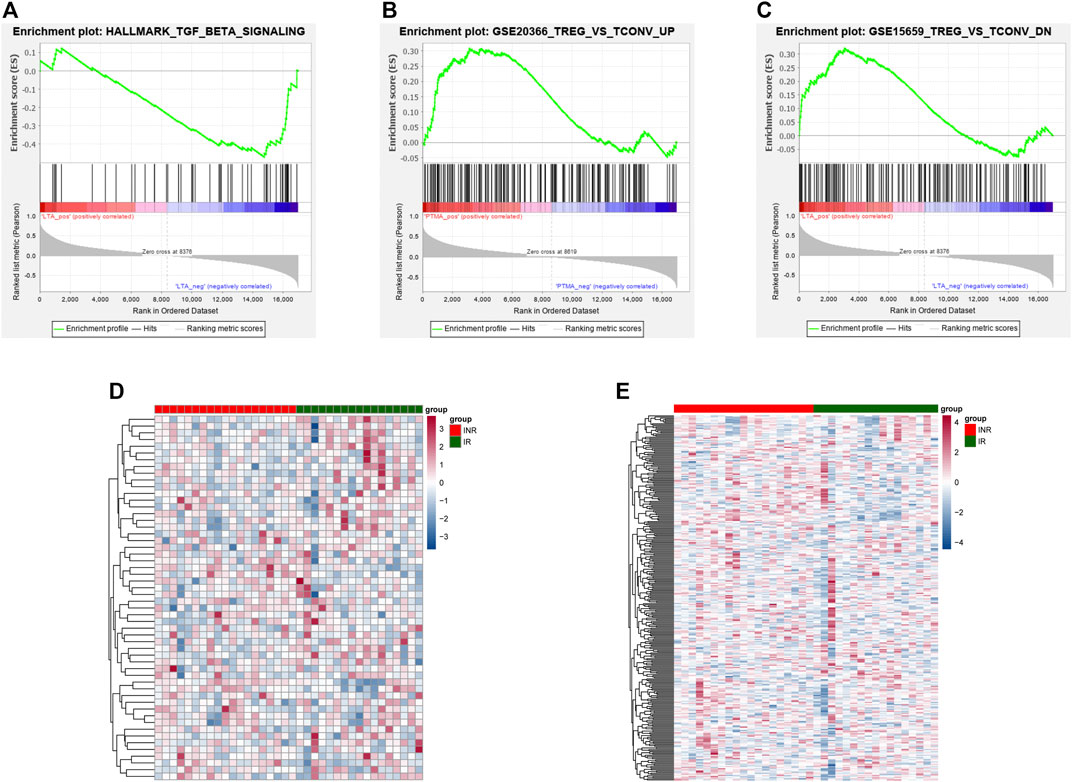
FIGURE 4. The results of enrichment analyses of diagnostic markers. (A) HALLMARK_TGF_BETA_SIGNALING pathway enriched by LTA. (B–C) TREG_VS_TCONV_UP and TREG_VS_TCONV_DN pathway enriched by PTMA (B) and LTA (C). (D) The expression of genes in the HALLMARK_TGF_BETA_SIGNALING pathway between INRs and IRs. (E) The expression of genes in TREG_VS_TCONV_UP and TREG_VS_TCONV_DN pathway between INRs and IRs.
Comparison of the Immune Microenvironment in INRs and IRs Samples
To assess the discrepancy of immune microenvironment between the INRs and IRs samples, the enrichment scores of 28 immune cells were estimated by employing the ssGSEA algorithm. As indicated from the results, the IRs achieved significantly higher enrich scores of activated dendritic cell, CD56dim natural killer (NK) cell, effector memory CD8 T cell, immature B cell, natural killer T cell, plasmacytoid dendritic cell, as well as T follicular helper cell (Figure 5A). As revealed from the mentioned findings, the difference of immune cells can be inferred that there are significant differences in immune microenvironment between INRs and IRs.
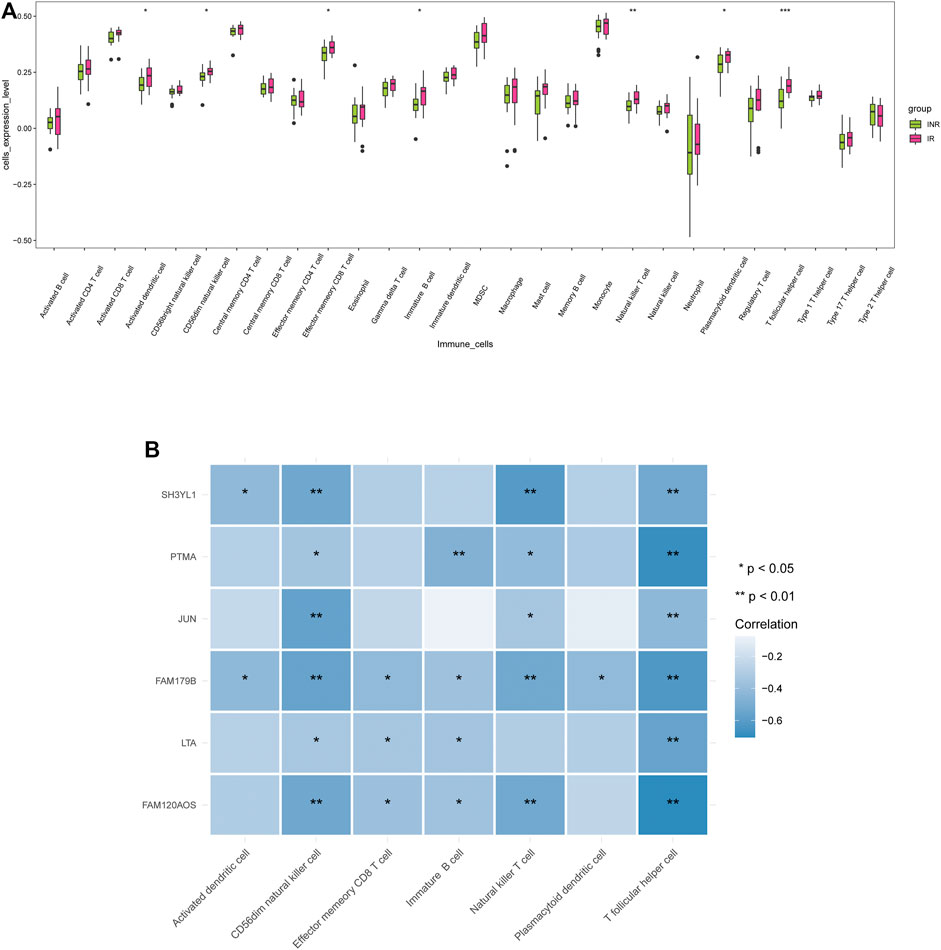
FIGURE 5. Correlations between diagnostic markers and immune cells. (A) The discrepancy of enrichment scores for 28 immune cells between the INRs and IRs samples. (B) The correlation heatmap of 6 diagnostic markers and 7 differential immune cells.
The spearman correlation between six diagnostic markers and differential immune cells between INRs and IRs was further analyzed (Supplementary Table S6). According to Figure 5B, all six diagnostic markers were negatively correlated with T follicular helper cell and CD56dim NK cell. SH3YL1 and FAM179B were negatively correlated with activated dendritic cell; FAM179B, LTA, and FAM120AOS were negatively correlated with effector memory CD8 T cell; PTMA, FAM179B, LTA, and FAM120AOS were negatively correlated with immature B cell; SH3YL1, PTMA, JUN, FAM179B and FAM120AOS were negatively correlated with natural killer T cell; FAM179B was negatively correlated with plasmacytoid dendritic cell.
miRNA-mRNA-TF Regulatory Network Analysis
The regulated networks have been recognized to critically help understand the mechanisms of disease. To explore the regulatory mechanisms involved in INRs in-depth, miRNAs targeting the diagnostic markers were estimated by the miRDB and miRWalk databases. On the whole, 97 putative miRNAs and 106 miRNA-mRNA pairs were identified (Supplementary Table S7). A miRNA-mRNA regulatory network was built with 97 miRNAs, six diagnostic markers, and 106 edges (Figure 6A). Likewise, mRNA and TF-mediated regulatory networks were built as well. In general, 26 TFs were predicted by using the Network Analyst database, and the mRNA-TF regulatory network consisted of 38 mRNA-TF pairs (Figure 6B, Supplementary Table S8). Given the predicted miRNA-mRNA and mRNA-TF networks above, the miRNA-mRNA-TF network was built by applying Cytoscape software and displayed in Figure 6C. The detailed information of Figure 6C was listed in Table 2. In such a regulatory network, PTMA, SH3YL1, and JUN were targeted by Sp1 transcription factor (SP1), SH3YL1 was targeted by nuclear factor kappa B subunit 1 (NFKB1), and PTMA and JUN were targeted by transcription factor AP-2 alpha (TFAP2A). Furthermore, FAM179B was regulated by hsa-miR-101-3p, and FAM179B was regulated by hsa-miR-24-1-5p and hsa-miR-24-2-5p, probably correlated with HIV progression.
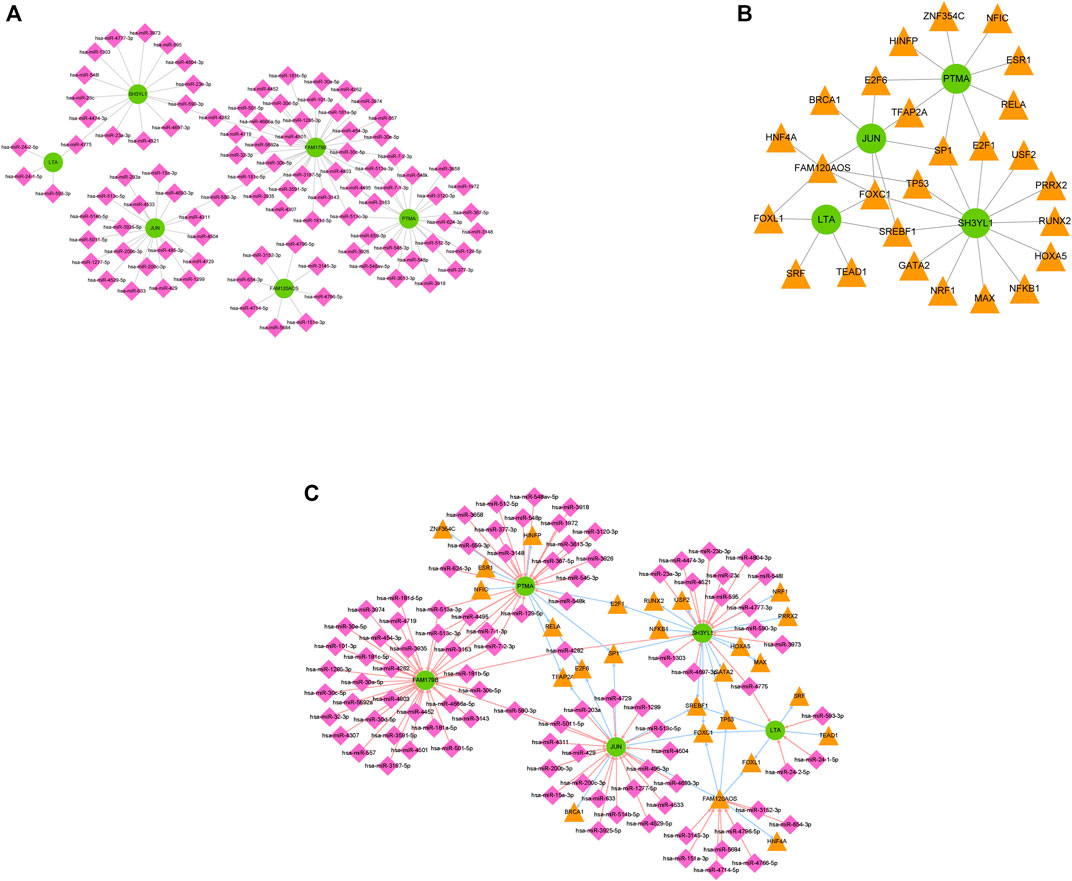
FIGURE 6. The regulating mechanisms of diagnostic markers. (A) The miRNA mRNA regulatory network comprising 97 miRNAs, 6 diagnostic markers, and 106 edges. (B) The mRNA-TF regulatory network comprising 38 mRNA TF pairs. (C) The miRNA-mRNA-TF network of 6 diagnostic markers.

TABLE 2. The relationship in the miRNA-mRNA-TF regulatory network.
Validation of the Expression of the Diagnostic Markers Through RT-qPCR
The mRNA expression of the diagnostic markers in clinical 10 INRs and 10 IRs samples were detected by performing RT-qPCR. As revealed in Figures 7A–F, the expressions of FAM120AOS, LTA, FAM179B, JUN, PTMA, and SH3YL1 were significantly up-regulated in INRs compared with IRs, thereby further verifying the expression of the diagnostic markers in the merged data sets from the public database (Figure 7G).
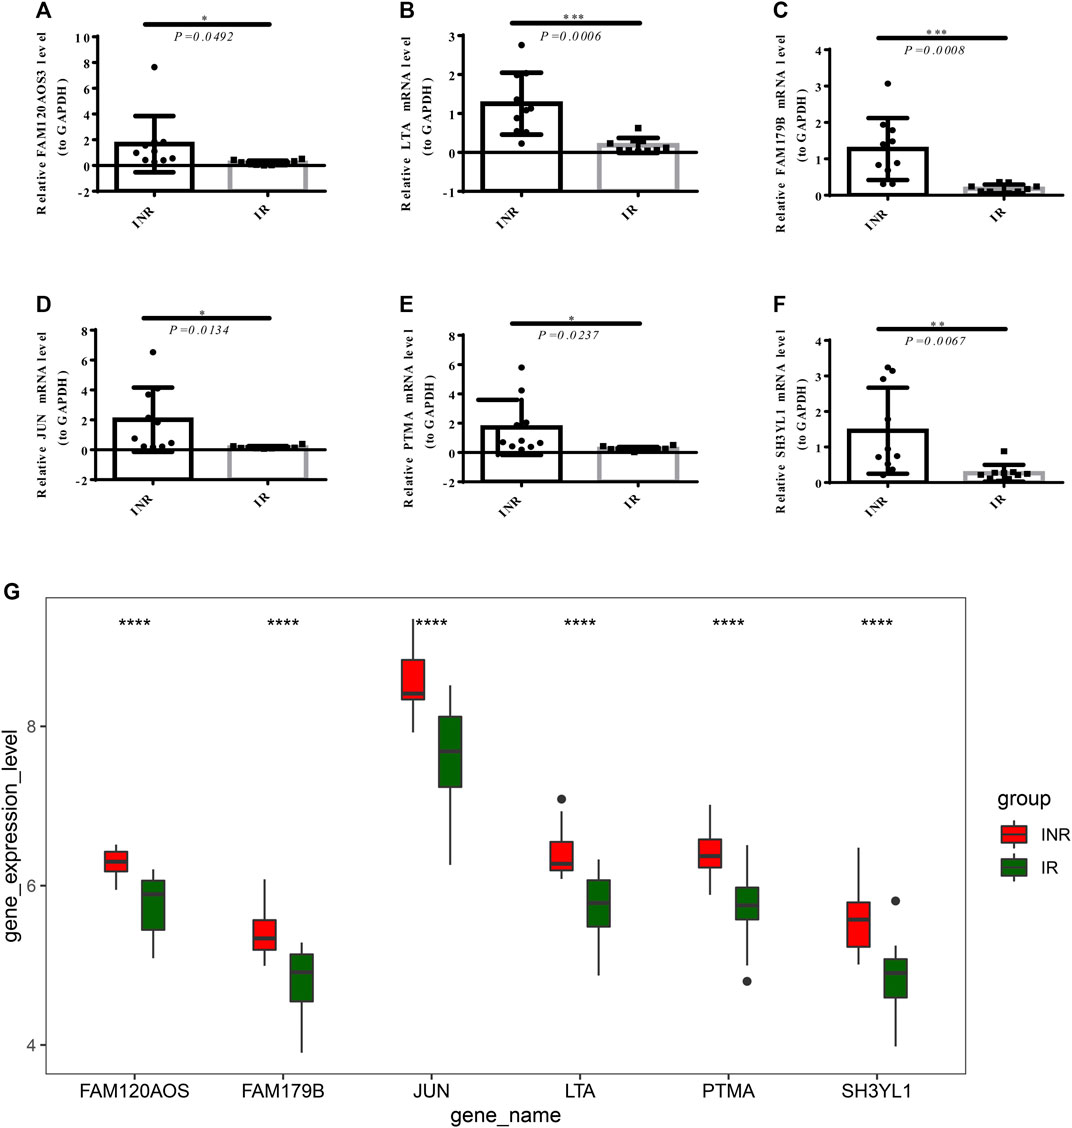
FIGURE 7. The mRNA expression of diagnostic markers in clinical 10 INRs and 10 IRs samples were detected by RT-PCR. The expression of FAM120AOS, LTA, FAM179B, JUN, PTMA, and SH3YL1 (A–F) between the INRs and IRs samples (*p < 0.05, **p < 0.01, ***p < 0.001). (G) The expression of the diagnostic markers in merged GEO series (****p < 0.0001).
Discussion
Although ART can effectively inhibit HIV replication (Bai et al., 2020) and promote the recovery of immune function of infected persons, there are still 20–30% of HIV-infected persons (Li et al., 2011). Moreover, the number of CD4+ T cells remains at a low level (<350 cells/μL) for a long time even after the virus is completely suppressed (Yang et al., 2020). This phenomenon is called poor immune reconstitution. Such patients are called INRs. Compared with IRs, the incidence and mortality of INRs non-AIDS-related diseases (such as cardiovascular diseases, tumors, and neurocognitive disorders) and AIDS-related diseases (such as infections and tumors) have increased significantly, resulting in an increase in the medical and economic burden on the family and society (Baker, et al., 2008b; Liu et al., 2021; Pacheco, et al., 2015; Young et al., 2012). However, there is still a lack of biomarkers for early prediction or diagnosis of immune non-response. Thus, early prediction or diagnostic biomarkers of INR should be explored urgently to provide a foundation for clinical diagnosis of INR, so as to improve the immune reconstitution status of HIV-infected patients.
In the present study, we firstly identified 52 differentially expressed genes in the samples of immune non-responders and immune responders of HIV-infected individuals. As revealed from the subsequent functional enrichment analysis, the mentioned genes were largely involved in inflammatory and immune response-related pathways. (Figures 2A,D). To be specific, the higher level of inflammatory response and immune activation of INRs primarily accounts for why they are more likely to develop AIDS than IRs after ART treatment (Lu et al., 2018). For instance, sCD14, a marker of acute phase response, monocyte and macrophage activation, was reported to be significantly elevated in INRs (Ruiz-Briseño et al., 2020). In addition, sCD163 levels, another marker of monocyte activation and inflammatory response, were noticeably regulated after the treatment with ART (McKibben et al., 2015). More importantly, higher immune activation and systemic inflammatory biomarkers (sST2 and hsCRP) levels were found to be directly correlated with the presence of arterial hypertension and diastolic dysfunction in INRs (Scherzer et al., 2018). Besides, Hunt et al. reported that for every 5% increase in the percentage of activated CD4+ T cells, the number of CD4+ T cells decreased by 45 cells/µl in the first 3 months of antiretroviral therapy. Likewise, for each 5% increase in the percentage of activated CD8+ T cells, CD4+ T cells decreased by 35 cells/µl (Hunt et al., 2003). Furthermore, plasma levels of sCD14 and sCD163 and activated CD4+ and CD8+ T ratio was significantly higher in HIV-infected individuals on ART compared with the healthy controls (Cobos Jiménez et al., 2016). Accordingly, the aforementioned differentially expressed 52 genes might be vital molecules in the regulation of immune activation and inflammatory response, probably acting as markers of immune non-response after ART treatment.
Moreover, as demonstrated by ROC analysis, FAM120AOS, LTA, FAM179B, JUN, PTMA, and SH3YL1 could act as the markers for the diagnosis of INRs (Figures 3A–F). It is gratifying that LTA in the mentioned six markers were significantly enriched in the TGF-Beta signaling pathway and immune signaling pathway (TREGVSTCONVUP, TREGVSTCONVDN), and PTMA was involved in the mentioned two immune-related signaling pathways as well (Figures 4A–C). Interestingly, FAM120AOS was suggested to be able to regulate the expression of ITGB1 (CD29) (Tao et al., 2006), whereas ITGB1 has already been reported to be correlated with HIV-1 infection (Diagbouga et al., 2001; Martin-Jaular et al., 2021). In addition, ITGB1 has been found to be involved in T cell apoptosis (Fukumori et al., 2003). LTA is capable of exhibiting identical inflammatory properties to lipopolysaccharide by interacting with toll-like receptors (TLRs) (Kengatharan et al., 1998; Chang et al., 2010), i.e., eliciting different inflammatory responses in resident cells via different signaling cascades (Akira et al., 2006). More importantly, LTA was indicated to be able to facilitate HIV infection of primary oral cells (Dai et al., 2014). JUN could participate in the process of differentiation of naïve T cells into Th1 and Th2, thereby bringing critical to T cell-mediated diseases (Rincón et al., 1997; Zenz et al., 2008). Next, JUN can stimulate HIV-1 transcription in precursor cells of monocytes and primary macrophages (Varin et al., 2005). Besides, JUN can regulate the inflammatory response by activating antioxidant response elements (Jackson et al., 2011). According to existing studies, exogenous PTMA is capable of effectively inhibiting HIV-1 replication in primary macrophages by regulating some genes that inhibit HIV-1 replication when applied to growth mediators of primary macrophages (Mosoian et al., 2006; Mosoian et al., 2007). As proven by recent studies, SH3YL1 expression can affect T cell activation in multiple sclerosis patients (Fernandes et al., 2019). However, to the extent of our knowledge, there are no studies on FAM179B in relation to immunization or HIV. Thus, this study indicated initially that FAM179B might influence ART treatment in HIV-infected individuals. In brief, this study hypothesized that FAM120AOS, LTA, FAM179B, JUN, PTMA, and SH3YL1 may affect ART treatment by regulating immune or inflammatory responses.
Further, it was found that the mentioned diagnostic genes were correlated with differential immune cells in ART-responsive and non-responsive patients. Particularly, it was demonstrated that CD56dimCD16+ NK cell subsets are the main subpopulation of peripheral blood NK cells. They express FcγR IIIa (CD16), which makes NK cells cytotoxic (Caligiuri, 2008). Notably, CD56dimCD16+ subsets have been verified to play a role in HIV pathogenesis. A study revealed that compared to IRs, INRs exhibited more CD56dimCD16dim/− NK cells and higher activity levels after ART treatment, suggesting that the increase in CD56dimCD16dim/− NK cell subsets might be a negative factor in immune reconstitution (Zhang et al., 2020). Besides, Giuliani et al. discovered that the changes of NK cells in INRs may involve disease progression and impaired CD4+ T cell recovery. It indicated an increase in the proportion of regulatory CD56bright NK cell subsets in INRs and a negative correlation with CD4+ T cell counts (Giuliani et al., 2017). Furthermore, the activity and functional markers of CD56dimCD16+ NK cells with immune unresponsiveness increased compared to the healthy control group. In the antiviral treatment of HIV, the activation level of CD56dimCD16+ NK cells and the increase of functional markers were negatively associated with the CD4+ T cell counts (Luo et al., 2017). Therefore, FAM120AOS, LTA, FAM179B, JUN, PTMA, and SH3YL1 may significantly affect ART therapy outcomes by regulating activated dendritic cells, CD56dim NK cells, effector memory CD8 T cells, immature B cells, natural killer T cells, plasmacytoid dendritic cells, and T follicular helper cells. However, in-depth studies should be conducted to determine the mechanism of action of the mentioned genes.
Notably, in the miRNA-mRNA-TF networks, the transcription factor SP1 could regulate the expressions of PTMA, SH3YL1, and JUN. The transcription factor NFKB1 could regulate the expression of SH3YL1, and TFAP2A could regulate the expressions of PTMA and JUN. Consistent with the results here, it was shown that SP1 could enhance JUN expression (Yi et al., 2020). Since other regulatory mechanisms have not been reported, in-depth experiments should be conducted to verify the regulatory mechanisms of the mentioned genes.
Taken together, we have identified six genes associated with immunological non-response in HIV-infected individuals. Single or combination of these genes might be used as diagnostic markers for INRs. Thus, our findings provide some clues for exploring the mechanisms of incomplete immune reconstitution in HIV-infected individuals and may help to guide ART treatment in HIV-infected individuals. However, the expression of these six genes should be verified in larger samples. In addition, to further elucidate the regulatory mechanisms of the mentioned genes, considerable experimental studies should be conducted.
Data Availability Statement
The original contributions presented in the study are included in the article/Supplementary Material, further inquiries can be directed to the corresponding author.
Ethics Statement
The studies involving human participants were reviewed and approved by Beijing You’an Hospital of Capital Medical University. The patients/participants provided their written informed consent to participate in this study.
Author Contributions
RB, ZL, YH conceived, designed, and performed the analysis. SL, RW verified the analytical methods. RB, ZL, YH wrote the manuscript. WH edited the manuscript. HW, LD revised the manuscript. All authors agreed with the submitted version.
Funding
This work was supported by the National 13th Five-Year Grand Program on Key Infectious Disease Control (2018ZX10721102–003-003 to LD, 2018ZX10302-102 to LD, 2018ZX10301-102 to ZL); National Natural Science Foundation of China (82072294 to ZL), the Beijing Key Laboratory for HIV/AIDS Research (BZ0089). The funders had no role in study design, data collection and analysis, decision to publish, or preparation of the manuscript.
Conflict of Interest
The authors declare that the research was conducted in the absence of any commercial or financial relationships that could be construed as a potential conflict of interest.
Publisher’s Note
All claims expressed in this article are solely those of the authors and do not necessarily represent those of their affiliated organizations, or those of the publisher, the editors, and the reviewers. Any product that may be evaluated in this article, or claim that may be made by its manufacturer, is not guaranteed or endorsed by the publisher.
Acknowledgments
Thanks to all authors for their contributions to this manuscript.
Supplementary Material
The Supplementary Material for this article can be found online at: https://www.frontiersin.org/articles/10.3389/fmolb.2021.809085/full#supplementary-material
Supplementary Figure 1 | The batch effect correction of the GSE106792 and GSE77939 datasets. (A) The distribution of samples before correlation in the GSE106792 and GSE77939 datasets. (B) The distribution of samples after correlation in the GSE106792 and GSE77939 datasets. (C) The distribution of INRs and IRs after correlation.
References
Akira, S., Uematsu, S., and Takeuchi, O. (2006). Pathogen Recognition and Innate Immunity. Cell. 124, 783–801. doi:10.1016/j.cell.2006.02.015
Bai, R.-J., Dai, L.-L., and Wu, H. (2020). Advances and Challenges in Antiretroviral Therapy for Acquired Immunodeficiency Syndrome. Chin. Med. J. (Engl.) 133, 2775–2777. doi:10.1097/CM9.0000000000001226
Baker, J. V., Peng, G., Rapkin, J., Abrams, D. I., Silverberg, M. J., MacArthur, R. D., et al. (2008a). CD4+ Count and Risk of Non-AIDS Diseases Following Initial Treatment for HIV Infection. AIDS 22, 841–848. doi:10.1097/QAD.0b013e3282f7cb76
Baker, J. V., Peng, G., Rapkin, J., Krason, D., Reilly, C., Cavert, W. P., et al. (2008b). Poor Initial CD4+ Recovery with Antiretroviral Therapy Prolongs Immune Depletion and Increases Risk for AIDS and Non-AIDS Diseases. J. Acquir. Immune. Defic. Syndr. 48, 541–546. doi:10.1097/QAI.0b013e31817bebb3
Bindea, G., Mlecnik, B., Tosolini, M., Kirilovsky, A., Waldner, M., Obenauf, A. C., et al. (2013). Spatiotemporal Dynamics of Intratumoral Immune Cells Reveal the Immune Landscape in Human Cancer. Immunity 39, 782–795. doi:10.1016/j.immuni.2013.10.003
Caligiuri, M. A. (2008). Human Natural Killer Cells. Blood 112, 461–469. doi:10.1182/blood-2007-09-077438
Cao, R., and López-de-Ullibarri, I. (2019). ROC Curves for the Statistical Analysis of Microarray Data. Methods Mol. Biol. 1986, 245–253. doi:10.1007/978-1-4939-9442-7_11
Chang, H.-C., Lin, K.-H., Tai, Y.-T., Chen, J.-T., and Chen, R.-M. (2010). Lipoteichoic Acid-Induced Tnf-α and Il-6 Gene Expressions and Oxidative Stress Production in Macrophages Are Suppressed by Ketamine through Downregulating Toll-like Receptor 2-mediated Activation of Erk1/2 and Nfκb. Shock 33, 485–492. doi:10.1097/shk.0b013e3181c3cea5
Cobos Jiménez, V., Jiménez, V. C., Wit, F. W. N. M., Joerink, M., Maurer, I., Harskamp, A. M., et al. (2016). T-cell Activation Independently Associates with Immune Senescence in HIV-Infected Recipients of Long-Term Antiretroviral Treatment. J. Infect. Dis. 214, 216–225. doi:10.1093/infdis/jiw146
Corbeau, P., and Reynes, J. (2011). Immune Reconstitution under Antiretroviral Therapy: the New challenge in HIV-1 Infection. Blood 117, 5582–5590. doi:10.1182/blood-2010-12-322453
Dai, L., DeFee, M. R., Cao, Y., Wen, J., Wen, X., Noverr, M. C., et al. (2014). Lipoteichoic Acid (LTA) and Lipopolysaccharides (LPS) from Periodontal Pathogenic Bacteria Facilitate Oncogenic Herpesvirus Infection within Primary Oral Cells. PLoS One 9, e101326. doi:10.1371/journal.pone.0101326
Diagbouga, S., Chiron, J.-P., Sanou, O., and Ledru, E. (2001). Alteration in CD29high CD4+ Lymphocyte Subset Is a Common Feature of Early HIV Disease and of Active Tuberculosis. Scand. J. Immunol. 53, 79–84. doi:10.1046/j.1365-3083.2001.00832.x
Engsig, F. N., Zangerle, R., Katsarou, O., Dabis, F., Reiss, P., Gill, J., et al. (2014). Long-term Mortality in HIV-Positive Individuals Virally Suppressed for >3 Years with Incomplete CD4 Recovery. Clin. Infect. Dis. 58, 1312–1321. doi:10.1093/cid/ciu038
Fernandes, S. J., Morikawa, H., Ewing, E., Ruhrmann, S., Joshi, R. N., Lagani, V., et al. (2019). Non-parametric Combination Analysis of Multiple Data Types Enables Detection of Novel Regulatory Mechanisms in T Cells of Multiple Sclerosis Patients. Sci. Rep. 9, 11996. doi:10.1038/s41598-019-48493-7
Fukumori, T., Takenaka, Y., Yoshii, T., Kim, H. R., Hogan, V., Inohara, H., et al. (2003). CD29 and CD7 Mediate Galectin-3-Induced Type II T-Cell Apoptosis. Cancer Res. 63, 8302–8311.
Gazzola, L., Tincati, C., Bellistrì, G. M., d’Arminio Monforte, A., and Marchetti, G. (2009). The Absence of CD4+T Cell Count Recovery Despite Receipt of Virologically Suppressive Highly Active Antiretroviral Therapy: Clinical Risk, Immunological Gaps, and Therapeutic Options. Clin. Infect. Dis. 48, 328–337. doi:10.1086/595851
Giuliani, E., Vassena, L., Di Cesare, S., Malagnino, V., Desimio, M. G., Andreoni, M., et al. (2017). NK Cells of HIV-1-Infected Patients with Poor CD4+ T-Cell Reconstitution Despite Suppressive HAART Show Reduced IFN-γ Production and High Frequency of Autoreactive CD56bright Cells. Immunol. Lett. 190, 185–193. doi:10.1016/j.imlet.2017.08.014
Hunt, P. W., Martin, J. N., Sinclair, E., Bredt, B., Hagos, E., Lampiris, H., et al. (2003). T Cell Activation Is Associated with Lower CD4+T Cell Gains in Human Immunodeficiency Virus-Infected Patients with Sustained Viral Suppression during Antiretroviral Therapy. J. Infect. Dis. 187, 1534–1543. doi:10.1086/374786
Jackson, R. L., Greiwe, J. S., and Schwen, R. J. (2011). Ageing Skin: Oestrogen Receptor β Agonists Offer an Approach to Change the Outcome. Exp. Dermatol. 20, 879–882. doi:10.1111/j.1600-0625.2011.01362.x
Jolliffe, I. T., and Cadima, J. (2016). Principal Component Analysis: a Review and Recent Developments. Phil. Trans. R. Soc. A. 374, 20150202. doi:10.1098/rsta.2015.0202
Kengatharan, K. M., De Kimpe, S., Robson, C., Foster, S. J., and Thiemermann, C. (1998). Mechanism of Gram-Positive Shock: Identification of Peptidoglycan and Lipoteichoic Acid Moieties Essential in the Induction of Nitric Oxide Synthase, Shock, and Multiple Organ Failure. J. Exp. Med. 188, 305–315. doi:10.1084/jem.188.2.305
Lederman, M. M., Calabrese, L., Funderburg, N. T., Clagett, B., Medvik, K., Bonilla, H., et al. (2011). Immunologic Failure Despite Suppressive Antiretroviral Therapy Is Related to Activation and Turnover of Memory CD4 Cells. J. Infect. Dis. 204, 1217–1226. doi:10.1093/infdis/jir507
Leek, J. T., Johnson, W. E., Parker, H. S., Jaffe, A. E., and Storey, J. D. (2012). The Sva Package for Removing Batch Effects and Other Unwanted Variation in High-Throughput Experiments. Bioinformatics 28, 882–883. doi:10.1093/bioinformatics/bts034
Li, J., Li, Z., Zhao, S., Song, Y., Si, L., and Wang, X. (2020). Identification Key Genes, Key miRNAs and Key Transcription Factors of Lung Adenocarcinoma. J. Thorac. Dis. 12, 1917–1933. doi:10.21037/jtd-19-4168
Li, T., Wu, N., Dai, Y., Qiu, Z., Han, Y., Xie, J., et al. (2011). Reduced Thymic Output Is a Major Mechanism of Immune Reconstitution Failure in HIV-Infected Patients after Long-Term Antiretroviral Therapy. Clin. Infect. Dis. 53, 944–951. doi:10.1093/cid/cir552
Liu, J., Hou, Y., Sun, L., Wang, L., He, Y., Zhou, Y., et al. (2021). High Population-Attributable Fractions of Traditional Risk Factors for Non-AIDS-defining Diseases Among People Living with HIV in China: a Cohort Study. Emerging Microbes & Infections 10, 416–423. doi:10.1080/22221751.2021.1894904
Livak, K. J., and Schmittgen, T. D. (2001). Analysis of Relative Gene Expression Data Using Real-Time Quantitative PCR and the 2−ΔΔCT Method. Methods 25, 402–408. doi:10.1006/meth.2001.1262
Lu, W., Feng, Y., Jing, F., Han, Y., Lyu, N., Liu, F., et al. (2018). Association between Gut Microbiota and CD4 Recovery in HIV-1 Infected Patients. Front. Microbiol. 9, 1451. doi:10.3389/fmicb.2018.01451
Luo, Z., Li, Z., Martin, L., Hu, Z., Wu, H., Wan, Z., et al. (2017). Increased Natural Killer Cell Activation in HIV-Infected Immunologic Non-responders Correlates with CD4+ T Cell Recovery after Antiretroviral Therapy and Viral Suppression. PLoS One 12, e0167640. doi:10.1371/journal.pone.0167640
Martin‐Jaular, L., Nevo, N., Schessner, J. P., Tkach, M., Jouve, M., Dingli, F., et al. (2021). Unbiased Proteomic Profiling of Host Cell Extracellular Vesicle Composition and Dynamics upon HIV‐1 Infection. EMBO J. 40, e105492. doi:10.15252/embj.2020105492
McKibben, R. A., Margolick, J. B., Grinspoon, S., Li, X., Palella, F. J., Kingsley, L. A., et al. (2015). Elevated Levels of Monocyte Activation Markers Are Associated with Subclinical Atherosclerosis in Men with and Those without HIV Infection. J. Infect. Dis. 211, 1219–1228. doi:10.1093/infdis/jiu594
Moore, R. D., and Keruly, J. C. (2007). CD4+ Cell Count 6 Years after Commencement of Highly Active Antiretroviral Therapy in Persons with Sustained Virologic Suppression. Clin. Infect. Dis. 44, 441–446. doi:10.1086/510746
Mosoian, A., Teixeira, A., Burns, C. S., Khitrov, G., Zhang, W., Gusella, L., et al. (2007). Influence of Prothymosin- on HIV-1 Target Cells. Ann. New York Acad. Sci. 1112, 269–285. doi:10.1196/annals.1415.043
Mosoian, A., Teixeira, A., High, A. A., Christian, R. E., Hunt, D. F., Shabanowitz, J., et al. (2006). Novel Function of Prothymosin Alpha as a Potent Inhibitor of Human Immunodeficiency Virus Type 1 Gene Expression in Primary Macrophages. J. Virol. 80, 9200–9206. doi:10.1128/JVI.00589-06
Obuchowski, N. A., and Bullen, J. A. (2018). Receiver Operating Characteristic (ROC) Curves: Review of Methods with Applications in Diagnostic Medicine. Phys. Med. Biol. 63, 07TR01. doi:10.1088/1361-6560/aab4b1
Pacheco, Y. M., Jarrin, I., Rosado, I., Campins, A. A., Berenguer, J., Iribarren, J. A., et al. (2015). Increased Risk of Non-AIDS-related Events in HIV Subjects with Persistent Low CD4 Counts Despite cART in the CoRIS Cohort. Antiviral Res. 117, 69–74. doi:10.1016/j.antiviral.2015.03.002
Phipson, B., Lee, S., Majewski, I. J., Alexander, W. S., and Smyth, G. K. (2016). Robust Hyperparameter Estimation Protects against Hypervariable Genes and Improves Power to Detect Differential Expression. Ann. Appl. Stat. 10, 946–963. doi:10.1214/16-AOAS920
Rincón, M., Dérijard, B., Chow, C. W., Davis, R., and Flavell, R. (1997). Reprogramming the Signalling Requirement for AP‐1 (Activator Protein‐1) Activation during Differentiation of Precursor CD4 + T‐cells into Effector Th1 and Th2 Cells. Genes Funct. 1, 51–68. doi:10.1046/j.1365-4624.1997.00007.x
Ritchie, M. E., Phipson, B., Wu, D., Hu, Y., Law, C. W., Shi, W., et al. (2015). Limma powers Differential Expression Analyses for RNA-Sequencing and Microarray Studies. Nucleic Acids Res. 43, e47. doi:10.1093/nar/gkv007
Ruiz-Briseño, M. D. R., De Arcos-Jiménez, J. C., Ratkovich-González, S., Sánchez-Reyes, K., González-Hernández, L. A., Andrade-Villanueva, J. F., et al. (2020). Association of Intestinal and Systemic Inflammatory Biomarkers with Immune Reconstitution in HIV+ Patients on ART. J. Inflamm. 17, 32. doi:10.1186/s12950-020-00262-4
Sabin, C. A., and Lundgren, J. D. (2013). The Natural History of HIV Infection. Curr. Opin. HIV AIDS 8, 1–317. doi:10.1097/COH.0b013e328361fa66
Saksena, N. K., Rodes, B., Wang, B., and Soriano, V. (2007). Elite HIV Controllers: Myth or Reality? AIDS Rev. 9, 195–207.
Scherzer, R., Shah, S. J., Secemsky, E., Butler, J., Grunfeld, C., Shlipak, M. G., et al. (2018). Association of Biomarker Clusters with Cardiac Phenotypes and Mortality in Patients with HIV Infection. Circ. Heart Fail. 11, e004312. doi:10.1161/CIRCHEARTFAILURE.117.004312
Takuva, S., Maskew, M., Brennan, A. T., Long, L., Sanne, I., and Fox, M. P. (2014). Poor CD4 Recovery and Risk of Subsequent Progression to AIDS or Death Despite Viral Suppression in a South African Cohort. J. Int. AIDS Soc. 17, 18651. doi:10.7448/IAS.17.1.18651
Tao, Y., Wei, Q., Xu, Z., Bai, R., Li, Y., Luo, C., et al. (2006). Holistic and Network Analysis of Meningioma Pathogenesis and Malignancy. Biofactors 28, 203–219. doi:10.1002/biof.5520280307
Varin, A., Decrion, A.-Z., Sabbah, E., Quivy, V., Sire, J., Van Lint, C., et al. (2005). Synthetic Vpr Protein Activates Activator Protein-1, C-Jun N-Terminal Kinase, and NF-Κb and Stimulates HIV-1 Transcription in Promonocytic Cells and Primary Macrophages. J. Biol. Chem. 280, 42557–42567. doi:10.1074/jbc.m502211200
Xiao, R., Yang, M., Tan, Y., Ding, R., and Li, D. (2021). Identification of Five Immune-Related lncRNAs Predicting Survival and Tumor Microenvironment Characteristics in Breast Cancer. Comput. Math. Methods Med. 2021, 1–12. doi:10.1155/2021/6676692
Yang, X., Su, B., Zhang, X., Liu, Y., Wu, H., and Zhang, T. (2020). Incomplete Immune Reconstitution in HIV/AIDS Patients on Antiretroviral Therapy: Challenges of Immunological Non‐responders. J. Leukoc. Biol. 107, 597–612. doi:10.1002/JLB.4MR1019-189R
Yi, R., Yang, S., Lin, X., Zhong, L., Liao, Y., Hu, Z., et al. (2020). miR‐5188 Augments Glioma Growth, Migration and Invasion through an SP1‐modulated FOXO1‐PI3K/AKT‐c‐JUN‐positive Feedback Circuit. J. Cel. Mol. Med. 24, 11800–11813. doi:10.1111/jcmm.15794
Younes, S.-A., Talla, A., Pereira Ribeiro, S., Saidakova, E. V., Korolevskaya, L. B., Shmagel, K. V., et al. (2018). Cycling CD4+ T Cells in HIV-Infected Immune Nonresponders Have Mitochondrial Dysfunction. J. Clin. Invest. 128, 5083–5094. doi:10.1172/JCI120245
Young, J., Psichogiou, M., Meyer, L., Ayayi, S., Grabar, S., Raffi, F., et al. (2012). CD4 Cell Count and the Risk of AIDS or Death in HIV-Infected Adults on Combination Antiretroviral Therapy with a Suppressed Viral Load: a Longitudinal Cohort Study from COHERE. Plos Med. 9, e1001194. doi:10.1371/journal.pmed.1001194
Yu, G., Wang, L.-G., Han, Y., and He, Q.-Y. (2012). clusterProfiler: an R Package for Comparing Biological Themes Among Gene Clusters. OMICS: A J. Integr. Biol. 16, 284–287. doi:10.1089/omi.2011.0118
Zenz, R., Eferl, R., Scheinecker, C., Redlich, K., Smolen, J., Schonthaler, H. B., et al. (2007). Activator Protein 1 (Fos/Jun) Functions in Inflammatory Bone and Skin Disease. Arthritis Res. Ther. 10, 201. doi:10.1186/ar2338
Zhang, Q.-Y., Zhang, X., Su, B., Liu, L.-F., Yang, X.-D., Tang, B., et al. (2020). Increased Early Activation of CD56dimCD16dim/- Natural Killer Cells in Immunological Non-responders Correlates with CD4+ T-Cell Recovery. Chin. Med. J. (Engl.) 133, 2928–2939. doi:10.1097/CM9.0000000000001262
Keywords: INRs, IRs, bioinformatic gene analysis, gene expression omnibus, diagnostic markers
Citation: Bai R, Li Z, Hou Y, Lv S, Wang R, Hua W, Wu H and Dai L (2021) Identification of Diagnostic Markers Correlated With HIV+ Immune Non-response Based on Bioinformatics Analysis. Front. Mol. Biosci. 8:809085. doi: 10.3389/fmolb.2021.809085
Received: 04 November 2021; Accepted: 24 November 2021;
Published: 22 December 2021.
Edited by:
Pier Paolo Piccaluga, University of Bologna, ItalyReviewed by:
Tae Jin Lee, Augusta University, United StatesBasavaraj Mallikarjunayya Vastrad, Soniya Education Trust’s College of Pharmacy, India
Copyright © 2021 Bai, Li, Hou, Lv, Wang, Hua, Wu and Dai. This is an open-access article distributed under the terms of the Creative Commons Attribution License (CC BY). The use, distribution or reproduction in other forums is permitted, provided the original author(s) and the copyright owner(s) are credited and that the original publication in this journal is cited, in accordance with accepted academic practice. No use, distribution or reproduction is permitted which does not comply with these terms.
*Correspondence: Hao Wu, d2hkb2NAY2NtdS5lZHUuY24=; Lili Dai, bGlseWRhaWVyQGNjbXUuZWR1LmNu
†These authors have contributed equally to this work