 Enchong Zhang
 Fujisawa Shiori2
95% of researchers rate our articles as excellent or good
Learn more about the work of our research integrity team to safeguard the quality of each article we publish.
Find out more
ORIGINAL RESEARCH article
Front. Mol. Biosci. , 28 May 2021
Sec. Molecular Diagnostics and Therapeutics
Volume 8 - 2021 | https://doi.org/10.3389/fmolb.2021.676138
This article is part of the Research Topic Molecular Biomarkers for the Diagnosis, Prognosis, and Risk Prediction of Cancer View all 88 articles
Prostate cancer (PCa) is the most common malignancy among men worldwide. However, its complex heterogeneity makes treatment challenging. In this study, we aimed to identify PCa subtypes and a gene signature associated with PCa prognosis. In particular, nine PCa-related pathways were evaluated in patients with PCa by a single-sample gene set enrichment analysis (ssGSEA) and an unsupervised clustering analysis (i.e., consensus clustering). We identified three subtypes with differences in prognosis (Risk_H, Risk_M, and Risk_L). Differences in the proliferation status, frequencies of known subtypes, tumor purity, immune cell composition, and genomic and transcriptomic profiles among the three subtypes were explored based on The Cancer Genome Atlas database. Our results clearly revealed that the Risk_H subtype was associated with the worst prognosis. By a weighted correlation network analysis of genes related to the Risk_H subtype and least absolute shrinkage and selection operator, we developed a 12-gene risk-predicting model. We further validated its accuracy using three public datasets. Effective drugs for high-risk patients identified using the model were predicted. The novel PCa subtypes and prognostic model developed in this study may improve clinical decision-making.
Prostate cancer (PCa) is highly intractable and incurable after metastasis. It is the leading type of noncutaneous cancer in males globally (Lee et al., 2017; Wang et al., 2018). Conventional therapeutic strategies for PCa are insufficient owing to tumor heterogeneity and complex molecular mechanisms of metastasis, leading to wide variation in outcomes (Wang et al., 2018). The clinical management of PCa includes surgery, androgen-deprivation therapy, ablative therapies, chemotherapy, radiation therapy, and immune therapy (Evans, 2018). Despite progress in therapeutic strategies, the treatment efficacy for advanced PCa is still low (Vlachostergios et al., 2017). In the context of precision medicine, the classification of PCa according to molecular features and prognosis will undoubtedly unlock effective targeted treatment strategies.
The mechanism underlying PCa heterogeneity and metastasis is highly complex; even within the same tumor, distinct phenotypes and characteristics exist (Meacham and Morrison, 2013). Multiple genomic changes contribute to PCa progression at the early stage and could define molecular subtypes. In our previous study (Zhang et al., 2020), we identified four subtypes of PCa based on immune-related gene sets. Labrecque et al., 2019 defined four novel subtypes of metastatic castration-resistant prostate cancer based on a 26-gene signature as well as distinct features of androgen receptor responses and NEUROI and NEUROII gene expression levels (Labrecque et al., 2019). Multiple molecular mechanisms work together to influence the development, progression, and outcome of PCa and thus precise molecular characterization can improve the accuracy of clinical decision-making.
For patients with PCa, an elevated hypoxic status is related to a more aggressive and advanced disease; hypoxia reduction could increase immunity and the response to specific immunotherapies (Jayaprakash et al., 2018). Additionally, prostate is an androgen-dependent organ, and androgen interactions with androgen receptors play a key role in the progression of PCa. Endocrine therapy in PCa is aimed at lowering serum androgen levels and inhibiting androgen receptor; when this approach fails, PCa advances to a hormone-resistant state (Heinlein and Chang, 2004; Shafi et al., 2013). The PI3K-AKT-mTOR pathway interacts with multiple cellular cascades, further promoting PCa progression and aggression, and drugs targeting this pathway are employed in clinical settings (Shorning et al., 2020). E2F and MYC synergistically contribute to cell cycle regulation and are involved in tumorigenesis (Liu et al., 2015). Metabolic adaptation is pivotal for malignancy given the high energy demand, and glycolytic, fatty acid biosynthesis, and oxidative phosphorylation contribute to proliferation and worse outcomes in PCa (Schöpf et al., 2016; Xiao et al., 2018; Balusamy et al., 2020). Machine learning has become increasingly advantageous in cancer research in the era of big data, enhancing disease prediction and prognosis (Kourou et al., 2015; Qiu et al., 2020a; Qiu et al., 2020b). We classified samples into three subtypes with different patterns of pathway enrichment. We hypothesized that a multi-pathway approach could enable the subclassification of PCa with different phenotypes, functions, and clinical characteristics. Here, we exploited nine pivotal PCa-related pathways based on a literature review to divide PCa samples into three subtypes, Risk_H, Risk_M, and Risk_L, with high, middle, and low risks, respectively. Next, we explored the characteristics of subtypes with respect to the tumor microenvironment, proliferation, single nucleotide variation, and copy number variation. Then, we explored the factors contributing to the observed differences in prognosis. We constructed a risk-predicting model based on genes associated with the high-risk subtype to make the prognosis calculable. Finally, we validated the efficacy of the risk model in an internal and three external validation cohorts and predicted drugs with high sensitivity in patients with PCa classified as high risk.
RNA sequencing (RNA-seq) data (Workflow type: HTSeq-Counts), single nucleotide variants (SNV) (Workflow type: MuSE Variant Aggregation and Masking), copy number variants (CNV) (Data type: Masked Copy Number Segment), and clinical phenotypes for patients with PCa in TCGA were downloaded. RNA-seq data were normalized using the DESeq2 R package (Love et al., 2014). Tumor mutational burden (TMB) for each patient was determined from SNV data using the maftools R package. Patients with incomplete survival data or a follow-up duration of less than 30°days were excluded. In total, 484 patients were retained for the clustering analysis. The progression-free interval (PFI) was obtained from an integrated TCGA pan-cancer Clinical Data Resource (Liu et al., 2018). The clinical phenotypes of 484 patients are shown in Table 1. Survival outcomes are shown in Supplementary Table S1. The proliferation scores for patients in TCGA were obtained from Thorsson et al. (Thorsson et al., 2018). For the identification of a prognostic model, patients in TCGA were randomly divided into a training group and internal validation group using the caret R package (Kuhn, 2008). Furthermore, the AR activity scores and TMPRSS2−ERG fusion status of patients with PCa were obtained from cBioPortal (https://www.cbioportal.org/) and The Tumor Fusion Gene Data Portal (https://www.tumorfusions.org/) (Cerami et al., 2012; Gao et al., 2013; Yoshihara et al., 2015).
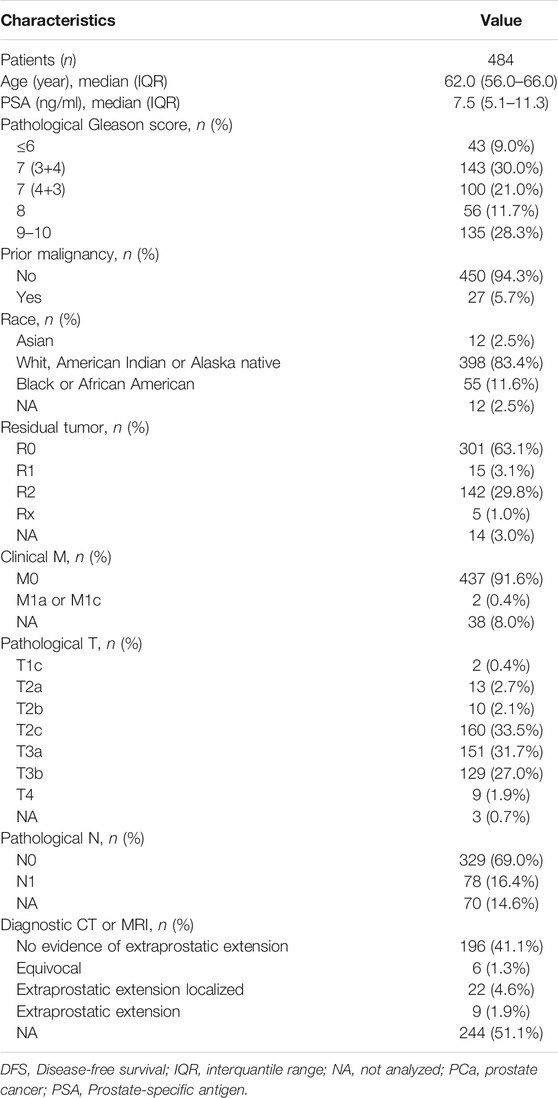
TABLE 1. The disease-related clinical information of patients with PCa included in the study.
Data sets from Gene Expression Omnibus (GEO) and cBioPortal for Cancer Genomics were used to validate the accuracy of the prognostic model (Barrett et al., 2009; Cerami et al., 2012; Gao et al., 2013). GSE70769 was obtained using the GEOquery R package from the GEO database (Davis and Meltzer, 2007; Ross-Adams et al., 2015). The datasets DKF2018 and MSKCC2010 were downloaded from the cBioPortal database. Patients with incomplete survival data or a follow-up duration of less than 30°days were excluded.
Based on a literature review, nine gene sets associated with PCa were selected (Gann et al., 1994; Heinlein and Chang, 2004; Kaseb et al., 2007; Koh et al., 2010; Milosevic et al., 2012; Edlind and Hsieh, 2014; Ippolito et al., 2016; Xiao et al., 2018). HALLMARK_ANDROGEN_RESPONSE, HALLMARK_E2F_TARGETS, HALLMARK_FATTY_ACID_METABOLISM, 'HALLMARK_GLYCOLYSIS, HALLMARK_HYPOXIA, HALLMARK_MYC_TARGETS_V1, HALLMARK_MYC_TARGETS_V2, HALLMARK_OXIDATIVE_PHOSPHORYLATION, and HALLMARK_PI3K_AKT_MTOR_SIGNALING gene sets were downloaded from the Molecular Signatures Database v7.2 (Liberzon et al., 2015). ssGSEA based on these nine gene sets was performed using the GSVA R package (Hänzelmann et al., 2013). The parameter settings were as follows: method = “ssgsea,” kcdf = “Gaussian,” abs.ranking = TRUE. Patients from TCGA (n = 484) were evaluated using the ssGSEA algorithm and enrichment scores were obtained for each gene set.
Consensus clustering was performed with the ssGSEA scores for patients (TCGA, n = 484) using the ConsensusClusterPlus R package (Wilkerson and Hayes, 2010). The number of subsamples was 100, proportion of items per sample was 0.8, and proportion of features per sample was 1. Hierarchical clustering was used. The adjacency distance matrix was determined as (1-Pearson correlation coefficient). Default settings were used for other parameters.
RNA-seq data in Counts were normalized using the DESeq2 R package (Love et al., 2014) and used in a principal coordinate analysis (PCA). The normalized Counts matrix was transformed into a Bray–Curtis dissimilarity matrix using the vegan R package. Then, PCA was conducted using the ape R package. Owing to the large sample size, means and standard errors of principal coordinate values were used to display the separation among subtypes, as described previously (Wu et al., 2020). Finally, PERMANOVA with 10,000 permutations was performed to determine the statistical significance of the separation in PCA.
CIBERSORTx was used to analyze the immune composition in the microenvironment of PCa tissues from TCGA (Steen et al., 2020) assuming two modules. RNA-seq data in TPM format were uploaded as the mixture file. Impute Cell Fractions and LM22 (22 immune cell types) were selected for the signature matrix file. Additionally, 100 permutations were performed for the statistical analysis. Other parameters were set according to Tutorial 2 on the CIBERSORTx website.
xCell is a web-tool for cell type enrichment analyses of gene expression data for 64 immune and stroma cell types (Aran et al., 2017). According to the recommended guidelines, RNA-seq data were input in TPM format into xCell and “xCell (N = 64)” was selected as the gene signature.
The ESTIMATE algorithm can estimate tumor purity by calculating the ratio of stromal to immune cells based on gene expression data (Yoshihara et al., 2013). The Estimate R package was used to analyze. normalized RNA-seq data by this algorithm.
A weighted correlation network analysis (WGCNA) can be used find phenotype-associated gene modules (Langfelder and Horvath, 2008; Li et al., 2019). RNA-seq data in TPM format were used as the input for a WGCNA. Twelve was set as the soft power threshold to construct a network that simultaneously satisfied a scale-free topology and high connectivity. Pearson correlation coefficients for the relationships between ssGSEA scores and gene modules were calculated. The correlations between the gene significance value and module membership of genes in a module were explored by a Pearson correlation analysis.
LASSO regression was performed on data for patients in training group using the glmnet R package (Fonti and Belitser, 2017). Genes most highly related to E2F and MYC ssGSEA scores were used as inputs. During the selection of genes, the C-index after 10-fold cross-validation indicated the effect of different screening strategies. Genes with the maximal C-index values were included in the prognostic model with the following parameter settings: family = Cox, type.measure = C, parallel = TRUE, with default settings for other parameters.
The accuracy of the prognostic model was determined by a tdROC analysis using the survivalROC R package. The endpoints were follow-up times of 1, 3, and 5°years. The area under the curve in the tdROC analysis was used to quantify accuracy. AUC values were obtained for the training group, internal validation group, and three external validation groups (GSE70769, DKF 2018, and MSKCC 2010).
The log-rank test and Cox regression for survival analyses were completed using the survival R package. The survival curve was plotted using the survminer R package. DFS, PFI, and biochemical recurrence-free survival were used as clinical outcomes. Follow-up time was evaluated in units of years. Finally, univariate and multivariate Cox regression analyses were used to explore whether the prognostic model is an independent predictor of prognosis.
Based on CTRP version 2 and PRISM databases, drug sensitivities of high-risk patients identified using the model were predicted by ridge regression based on gene expression levels. The analysis was implemented in the pRRophetic R package (Geeleher et al., 2014). Components with significantly lower areas under the dose–response curve (dr-AUC) in high-risk patients were selected first. Next, Spearman’s correlation coefficients for the relationship between the dr-AUC and risk score were obtained. Components with significantly negative rho (less than −0.3) were retained.
All statistical analyses were completed in R version 3.6.3. Chi-squared tests and Fischer’s exact tests were used to compare discrete variables between or among groups. Continuous variables were compared using the Wilcoxon test (two groups) and the Kruskal–Wallis test (three or more groups). p < 0.05 was considered significant.
Based on ssGSEA scores for nine PCa-associated gene sets, a consensus clustering analysis was performed for subtype identification. The cumulative distribution function (CDF) and relative change in the area under the CDF curve are shown in Figures 1A,B, respectively. According to Monti et al. (Qiu et al., 2020b), the optimal k-value is determined by a number of factors; one criterion is that when the optimal k-value is reached, the area under the CDF curve will not increase significantly with increases in k. We first set k = 4, indicating that the cohort could be divided into up to four subtypes. However, one cluster consisted of only a single patient when k = 4. Additionally, the cluster-consensus value for each cluster was not large enough under k = 4 (Supplementary Figure S1). Therefore, we focused on k = 3, dividing patients into three clusters (Figure 1C). In particular, according to prognostic features shown in Figures 1D,E, the clusters were defined as a high-risk subtype (Risk_H), moderate-risk subtype (Risk_M), and low-risk subtype (Risk_L). In a PCA, there was significant separation among the three subtypes (Figure 1F, PERMANOVA p < 0.05). Since these subtypes were identified based on ssGSEA scores, the levels of nine PCa-associated gene sets in the three subtypes were displayed in a heatmap in Figure 1G. We found that HALLMARK_HYPOXIA, HALLMARK_ANDROGEN_RESPONSE, and HALLMARK_PI3K_AKT_MTOR_SIGNALING were enriched in Risk_M. HALLMARK_E2F_TARGETS, HALLMARK_MYC_TARGETS_V1, and HALLMARK_MYC_TARGETS_V2 were enriched in Risk_H. HALLMARK_GLYCOLYSIS, HALLMARK_FATTY_ACID_METABOLISM, and HALLMARK_OXIDATIVE_PHOSPHORYLATION were enriched in Risk_L. As shown in Figures 1H–J, the ssGSEA scores for HALLMARK_E2F_TARGETS, HALLMARK_MYC_TARGETS_V1, and HALLMARK_MYC_TARGETS_V2 were significantly higher in Risk_H than in Risk_L and Risk_M (Wilcoxon test p < 0.001). Furthermore, the PSA, Gleason score, residual tumor, pathological T, and survival outcome were associated with the subtype status (Table 2). Collectively, these data indicated that PCa could be divided into three subtypes based on the degree of enrichment of factors related to the androgen response, hypoxia, PI3K/AKT/MTOR signaling, E2F activity, MYC activity, glycolysis, fatty acid metabolism, and oxidative phosphorylation. The Risk_H subtype, with enrichment for E2F and MYC activity, showed a worse prognosis.
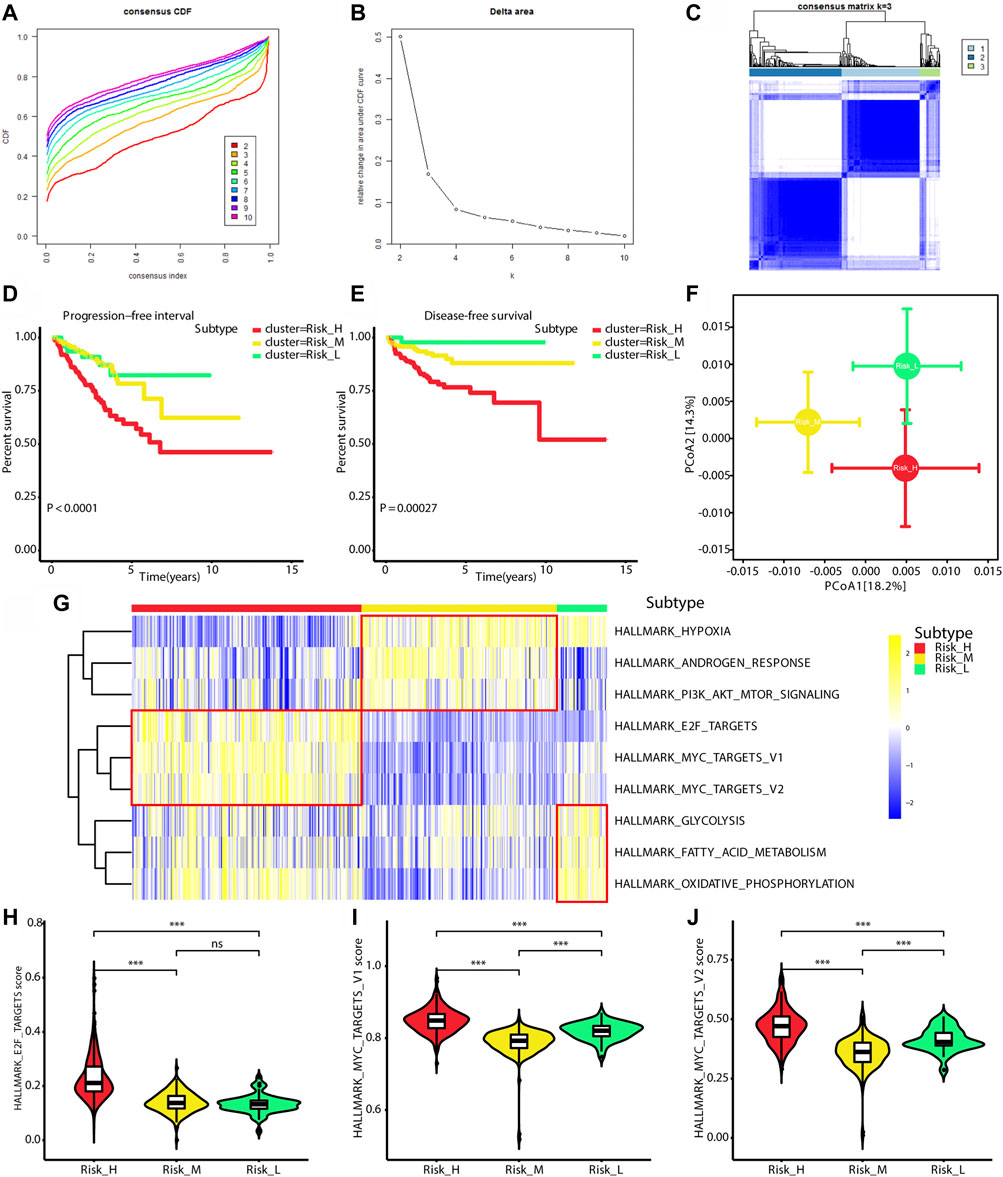
FIGURE 1. Identification of three subtypes with different prognosis. (A) The CDF curve under different values of k. The value of k represents the number of clusters during the consensus cluster. When the optimal k value is reached, the area under the CDF curve will not significantly increase with the increase of k value. (B) Relative change in area under CDF curve under different values of k. (C) The consensus matrix obtained when k = 3. Consistency values range from 0 to 1, 0 means never clustering together (white), 1 means always clustering together (dark blue). (D) Survival curves for progression-free interval of patients in the different subtypes. (E) Survival curves for disease-free survival of patients in the different subtypes. (F) PCA of Bray-Curtis dissimilarities obtained for the transcriptional profiles. The circles and error bars indicate the mean and standard errors of the mean. PERMANOVA test with 10,000 permutations were performed to calculate p value. (G) The heatmap shows ssGSEA scores levels among three subtypes. (H) The violin plot shows ssGSEA score of HALLMARK_E2F_TARGETS is significantly highest in Risk_H subtype. (I) The violin plot shows ssGSEA score of HALLMARK_MYC_TARGETS_V1 is significantly highest in Risk_H subtype. (J) The violin plot shows ssGSEA score of HALLMARK_MYC_TARGETS_V2 is significantly highest in Risk_H subtype. (PCa, prostate cancer; CDF, cumulative distribution function; PCA, principal coordinate analysis. * means p < 0.05, ** means p < 0.01, *** means p < 0.001, ns means p > 0.05, and p < 0.05 is defined as statistically significant).
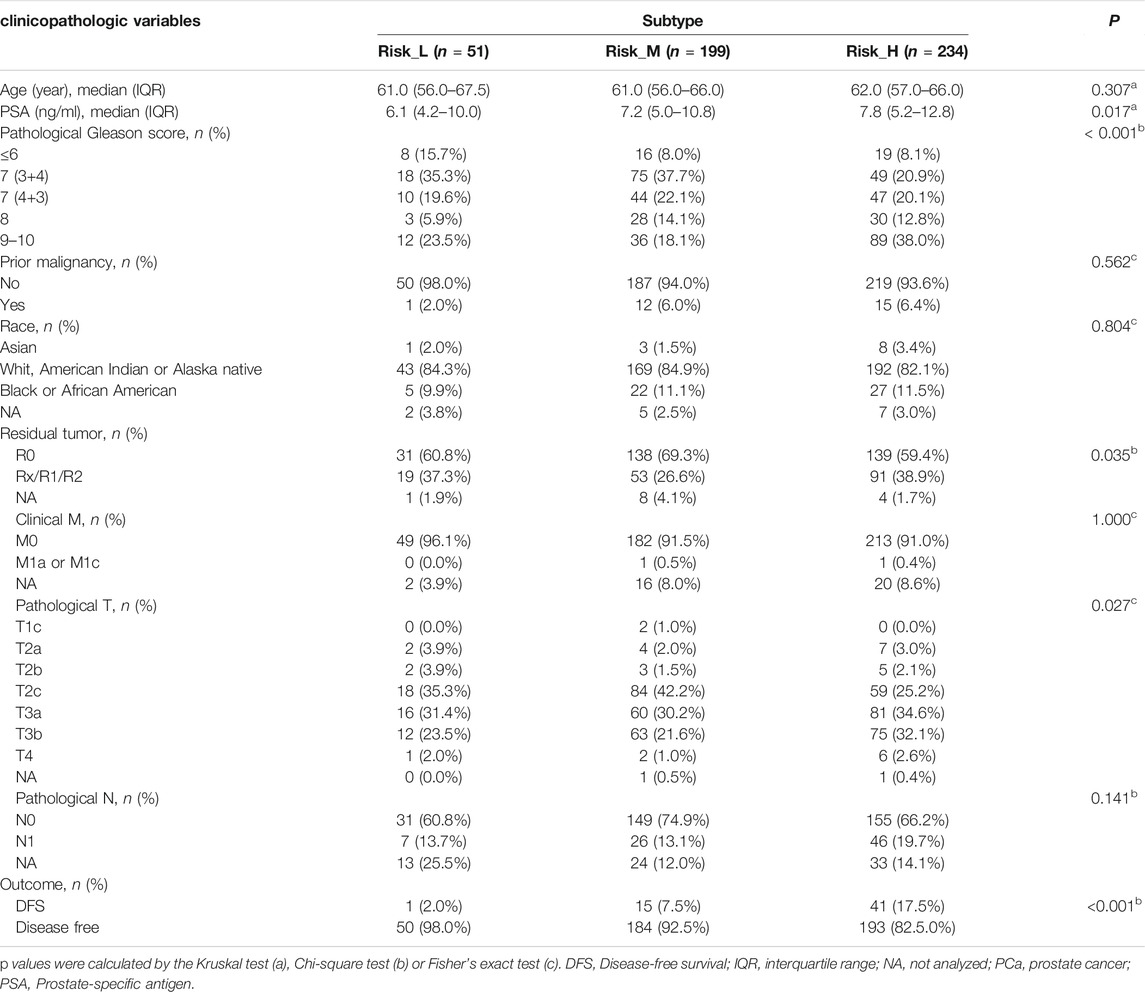
TABLE 2. The association between subtypes and clinicopathologic variables of prostate cancer.
We found that the ssGSEA scores for the E2F and MYC gene sets were positively correlated with proliferation scores (E2F score: rho = 0.88, p < 0.01; MYC_V1 score: rho = 0.49, p < 0.01; MYC_V2 score: rho = 0.35, p < 0.01), as shown in Figures 2A–C. Owing to the close relationship between KI67 expression and proliferation, the correlation between the expression of MKI67 and ssGSEA scores was also explored. The levels of MKI67 were positively correlated with ssGSEA scores for the E2F and MYC gene sets (E2F score: rho = 0.74, p < 0.01; MYC_V1 score: rho = 0.29, p < 0.01; MYC_V2 score: rho = 0.21, p < 0.01), as shown in Figures 2D–F. Finally, the proliferation scores and MKI67 levels were highest in Risk_H among the three subtypes (Kruskal–Wallis test p < 0.001), as shown in Figures 2G,H. Taken together, tumors classified as Risk_H had higher levels of proliferation.
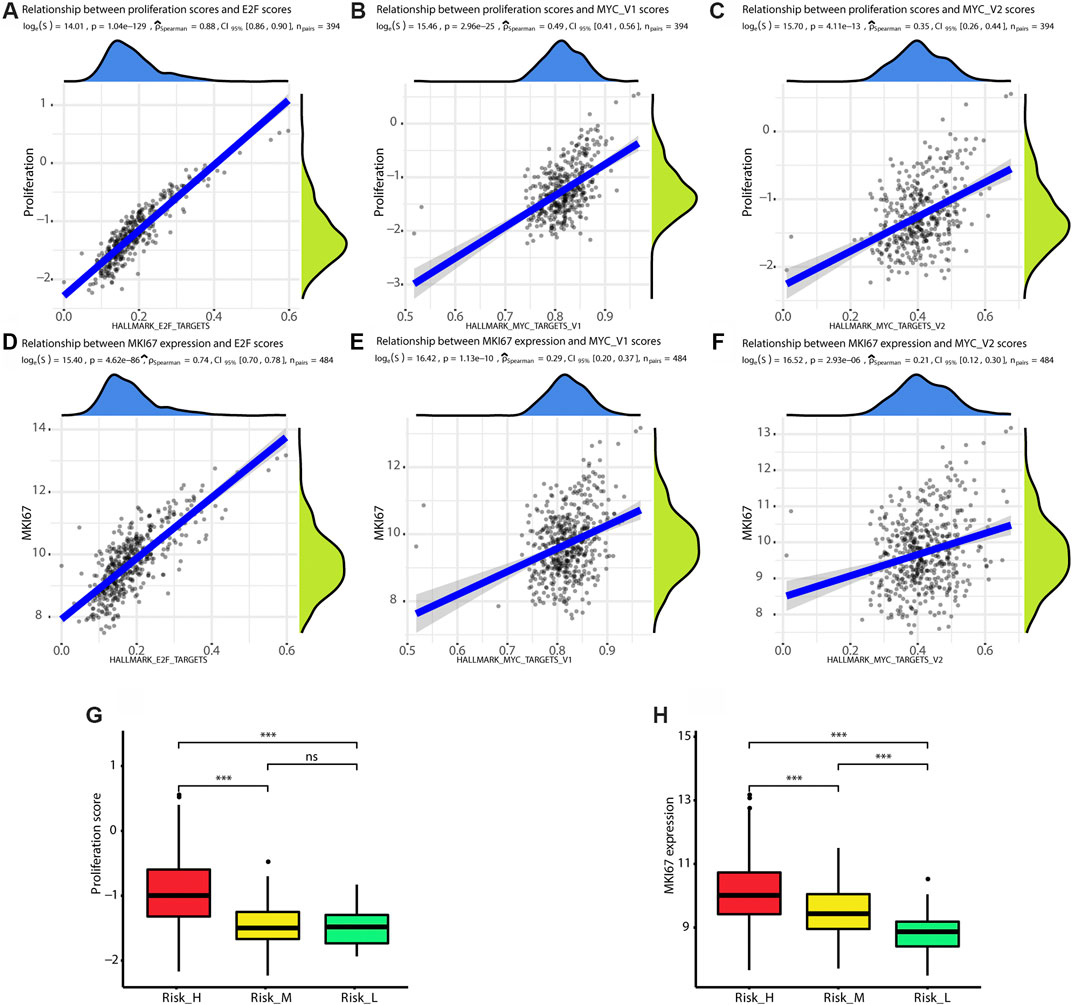
FIGURE 2. Risk_H subtype shows high proliferation status. (A) The scatter plot shows ssGSEA score of HALLMARK_E2F_TARGETS is positively correlated with proliferation score (Spearman rho = 0.88, p < 0.01). (B) The scatter plot shows ssGSEA score of HALLMARK_MYC_TARGETS_V1 is positively correlated with proliferation score (Spearman rho = 0.49, p < 0.01). (C) The scatter plot shows ssGSEA score of HALLMARK_MYC_TARGETS_V2 is positively correlated with proliferation score (Spearman rho = 0.35, p < 0.01). (D) The scatter plot shows ssGSEA score of HALLMARK_E2F_TARGETS is positively correlated with expression of MKI67 (Spearman rho = 0.74, p < 0.01). (E) The scatter plot shows ssGSEA score of HALLMARK_MYC_TARGETS_V1 is positively correlated with expression of MKI67 (Spearman rho = 0.29, p < 0.01). (F) The scatter plot shows ssGSEA score of HALLMARK_MYC_TARGETS_V2 is positively correlated with expression of MKI67 (Spearman rho = 0.21, p < 0.01). (G) The boxplot shows the proliferation score is the highest in Risk_H subtype. (H) The boxplot shows the expression of MKI67 is the highest in Risk_H subtype. (PCa, prostate cancer. * means p < 0.05, ** means p < 0.01, *** means p < 0.001, ns means p > 0.05, and p < 0.05 is defined as statistically significant).
Seven subtypes were previously defined based on ETS fusions or mutations in SPOP, FOXA1, and IDH1 (Abeshouse et al., 2015). We found that SPOP mutations were overrepresented in the Risk_H subtype (chi-square test p < 0.05, Figures 3A–C). Furthermore, we found that the Risk_L subtype had lower heterogeneity than other subtypes, including only four subtypes (Figure 3C). Furthermore, based on previously established immune-based subtypes, we found that the Risk_H subtype was mainly composed of the C1 subtype (Zhang et al., 2020), which is associated with a poor prognosis; however, Risk_M and Risk_L subtypes were mainly composed of the C3 subtype, associated with a relatively favorable prognosis (Figures 3D–F). In addition, based on subtypes differing in methylation patterns (Zhang et al., 2021), we found that the Risk_H subtype was mainly composed of the Methylation_H subtype, associated with a poor prognosis; however, Risk_M and Risk_L subtypes were mainly composed of the Methylation_L subtype, associated with a better prognosis (Figures 3G–I). Taken together, SPOP mutations, which are associated with a poor prognosis in PCa, were positively correlated with the Risk_H subtype; the SPOP mutation frequency in our subtypes decreased in the following order: Risk_H > Risk_M > Risk_L. Our previous studies all support the poor prognostic characteristics of the Risk_H subtype.
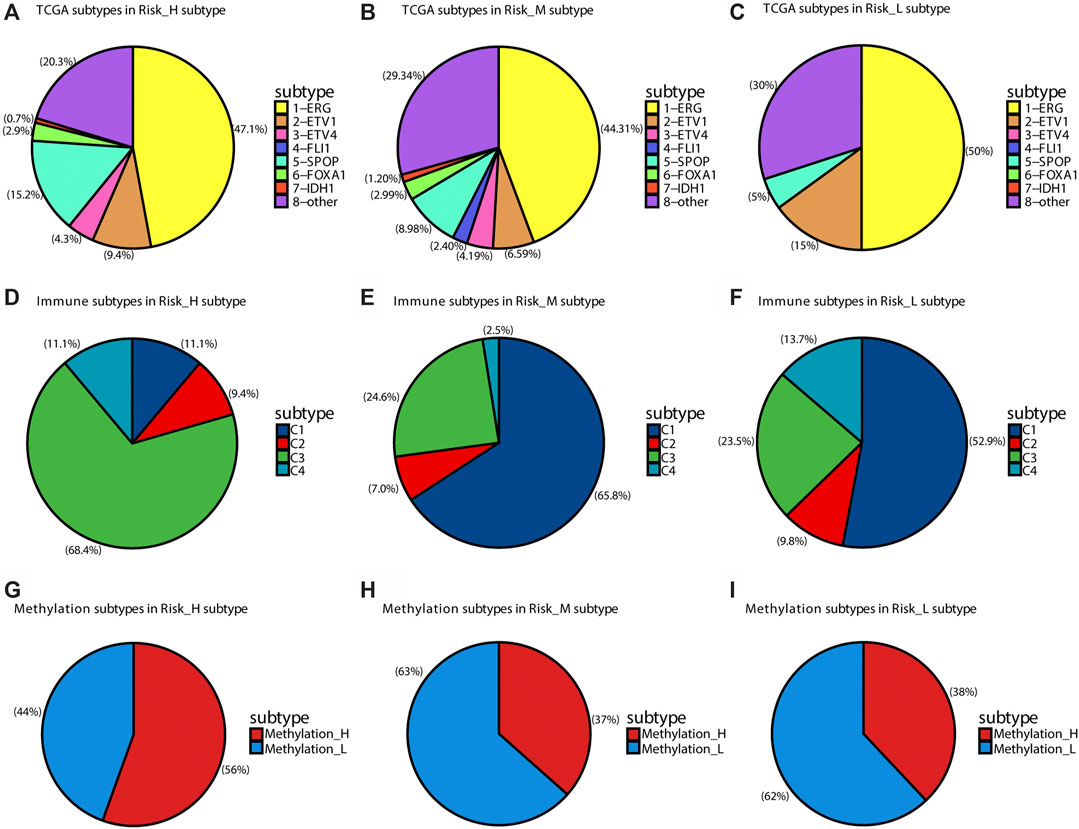
FIGURE 3. The distribution of other TCGA subtypes in subtypes of this research. (A) The distribution of TCGA subtypes in Risk_H subtype. (B) The distribution of TCGA subtypes in Risk_M subtype. (C) The distribution of TCGA subtypes in Risk_L subtype. (D) The distribution of immune subtypes in Risk_H subtype. (E) The distribution of immune subtypes in Risk_M subtype. (F) The distribution of immune subtypes in Risk_L subtype. (G) The distribution of DNA methylation subtypes in Risk_H subtype. (H) The distribution of DNA methylation subtypes in Risk_M subtype. (I) The distribution of DNA methylation subtypes in Risk_L subtype.
According to the ESTIMATE algorithm, the Risk_H subtype had lower immune, stromal, and ESTIMATE scores (Figures 4A,B) and a higher tumor purity (Figure 4D). Based on the CIBERSORTx algorithm, which predicts the immune cell composition in the tumor microenvironment based on gene expression data for 22 kinds of immune cells, we found that activated NK cells and regulatory T cells (Tregs) were significantly less frequent in the Risk_H type than in the other types (Kruskal–Wallis test p < 0.05, Figures 4E,F). According to the xCell algorithm, we found that NK T cells were also significantly less frequent in the Risk_H type than in the other types (Kruskal–Wallis test p < 0.05, Figure 4G). However, we found that the frequency of Tregs did not differ significantly among subtypes (Kruskal–Wallis test p > 0.05, Figure 4H). Collectively, these findings indicated that the Risk_H subtype had greater tumor purity and a smaller immune cell component. With respect to immune cell infiltration, activated NK cells and Tregs were reduced in the Risk_H type.
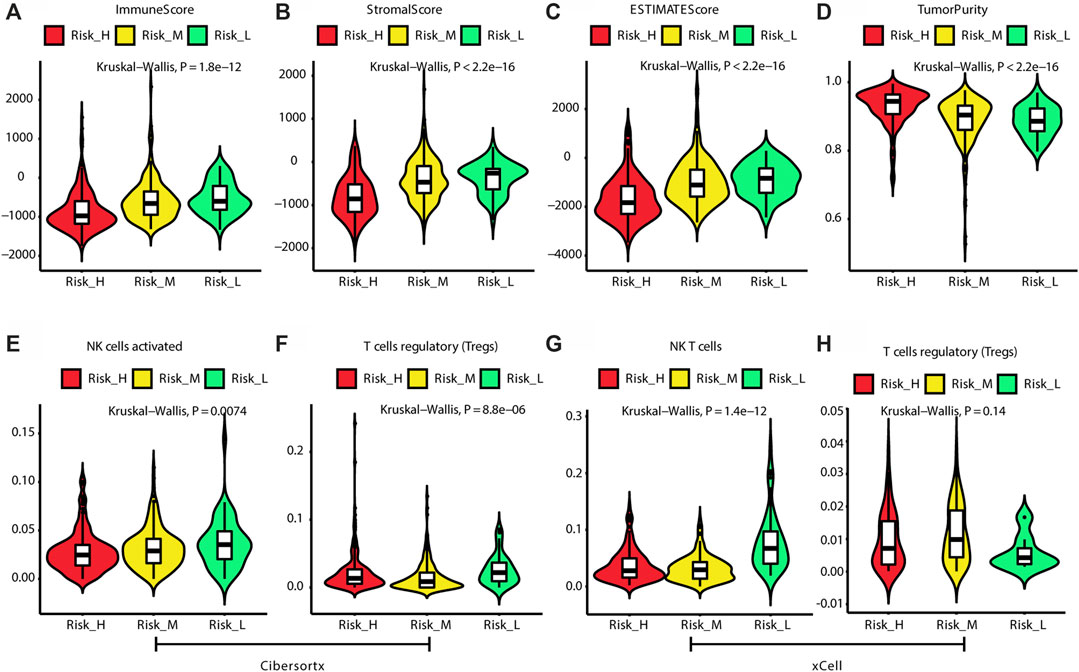
FIGURE 4. The difference of tumor microenvironment among three subtypes. (A) The violin plot shows immune score is the lowest in Risk_H subtype. (B) The violin plot shows stromal score is the lowest in Risk_H subtype. (C) The violin plot shows ESTIMATE score is the lowest in Risk_H subtype. (D) The violin plot shows tumor purity is the highest in Risk_H subtype. (E) The violin plot shows content of NK cells activated is the lowest in Risk_H subtype. (F) The violin plot shows content of Treg cells is the lowest in Risk_H subtype. (G) The violin plot shows content of NK T cells is the lowest in Risk_H subtype. (H) The violin plot shows content of Treg cells is not significantly different among subtypes. (p < 0.05 is defined as statistically significant).
As shown in Figures 5A–C, we found that the frequencies of SNVs in SPOP were higher in Risk_H and Risk_M than in Risk_L (chi-squared test p < 0.05). More single-copy deletion events were observed in the Risk_H subtype for RHOBTB2 and TNFRSF10C (chi-squared test p < 0.05). As shown in Figures 5E,H, the single deletions of RHOBTB2 and TNFRSF10C were associated with lower expression levels (Kruskal–Wallis test p < 0.05). Consistent with these findings, lower expression levels of RHOBTB2 and TNFRSF10C were detected in the Risk_H subtype (Kruskal–Wallis test p < 0.001, Figures 5F,I). Furthermore, as shown in Figure 5J, TMB values for patients were highest in the Risk_H subtype. Although the frequency of the TMPRSS2-ERG fusion did not differ significantly among subtypes, it was highest in the Risk_H subtype (Figure 5K). Additionally, AR scores for patients were higher in the Risk_H and Risk_M subtypes than in the Risk-L subtype (Figure 5L, Wilcoxon p < 0.001). These data suggest that SNVs in SPOP and CNVs in RHOBTB2 and TNFRSF10C are more common in the Risk_H subtype than in other subtypes. Low expression levels of RHOBTB2 and TNFRSF10C in Risk_H could be associated with single deletion CNV events.
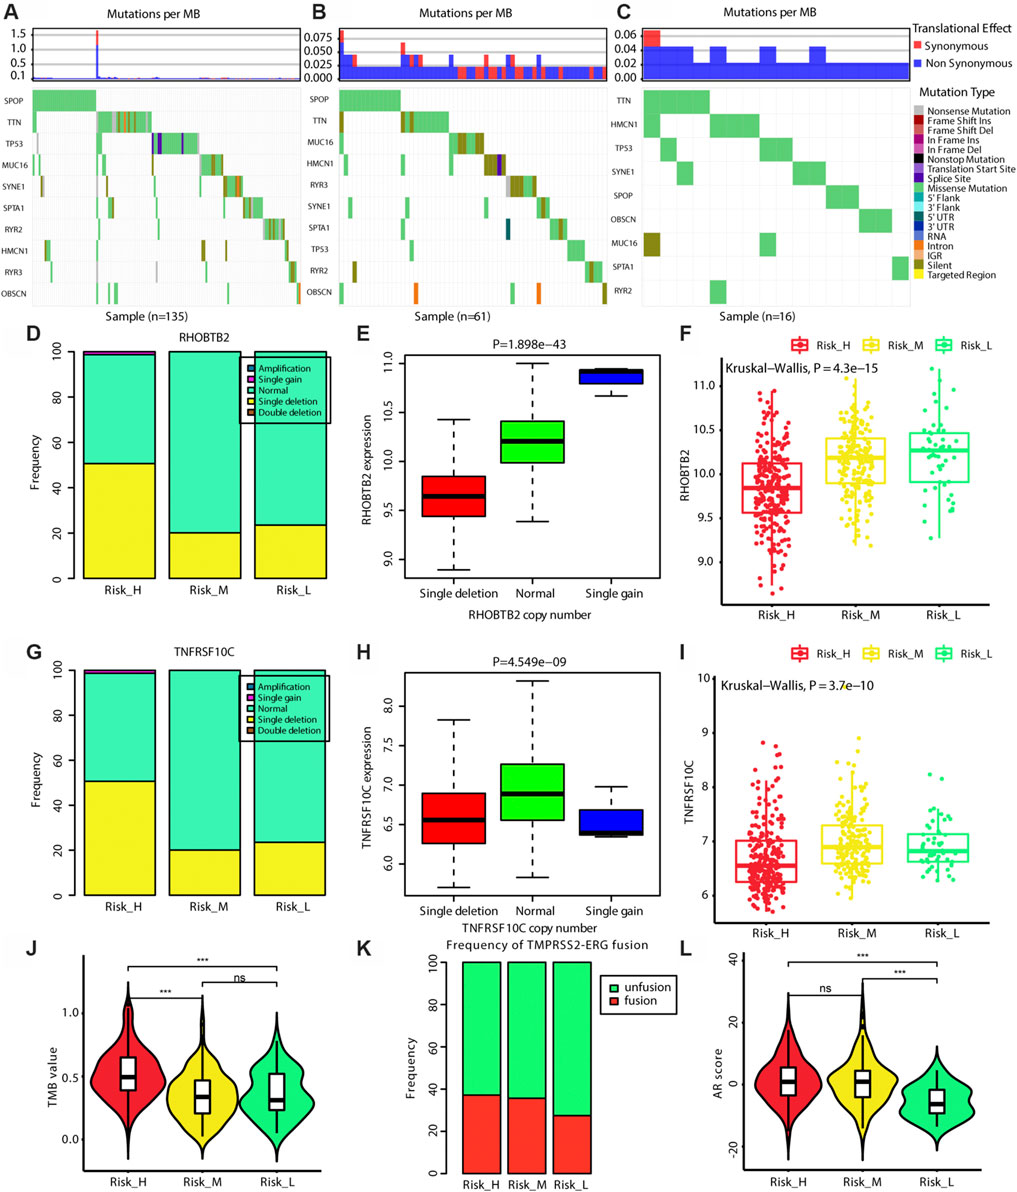
FIGURE 5. The genomic differences among three subtypes. (A) The map of waterfall for the Risk_H subtype. (B) The map of waterfall for the Risk_M subtype. (C) The map of waterfall for the Risk_L subtype. (D) The frequency of CNV in RHOBTB2 in Risk_H subtype is significantly higher than that in other subtype. (E) The expression level of RHOBTB2 is significantly correlated with its CNV, and the expression level of RHOBTB2 is decreased with single deletion. (F) The expression level of RHOBTB2 is the lowest in Risk_H subtype. (G) The frequency of CNV in TNFRSF10C in Risk_H subtype is significantly higher than that in other subtype. (H) The expression level of TNFRSF10C is significantly correlated with its CNV, and the expression level of TNFRSF10C is decreased with single deletion. (I) The expression level of TNFRSF10C is the lowest in Risk_H subtype. (J) The violin plot shows TMB values of patients are the highest in Risk_H subtype. Wilcoxon p values were calculated. (K) The bar graph shows TMPRSS2−ERG fusion status among three subtypes. (L) The violin plot shows AR scores of patients are the higher in Risk_H and Risk_M subtypes. Wilcoxon p values were calculated. (PCa, prostate cancer; CNV, copy number variation; AR, androgen receptor. And p < 0.05 is defined as statistically significant).
As shown in Figure 6A, the soft threshold value was set to 8. Eleven gene interaction networks were finally defined (Figure 6B). The midnight blue network shown in Figure 6C was mostly correlated with ssGSEA scores for E2F and MYC, indicating that this gene network best represents the Risk_H subtype. As shown in Figures 6D–F, values for gene significance and module membership were significantly associated (E2F: rho = 0.98, p < 0.001; MYC_V1: rho = 0.52, p < 0.001; MYC_V2: rho = 0.35, p = 0.0011). Taken together, we identified a single group of genes that effectively reflects the Risk_H subtype.
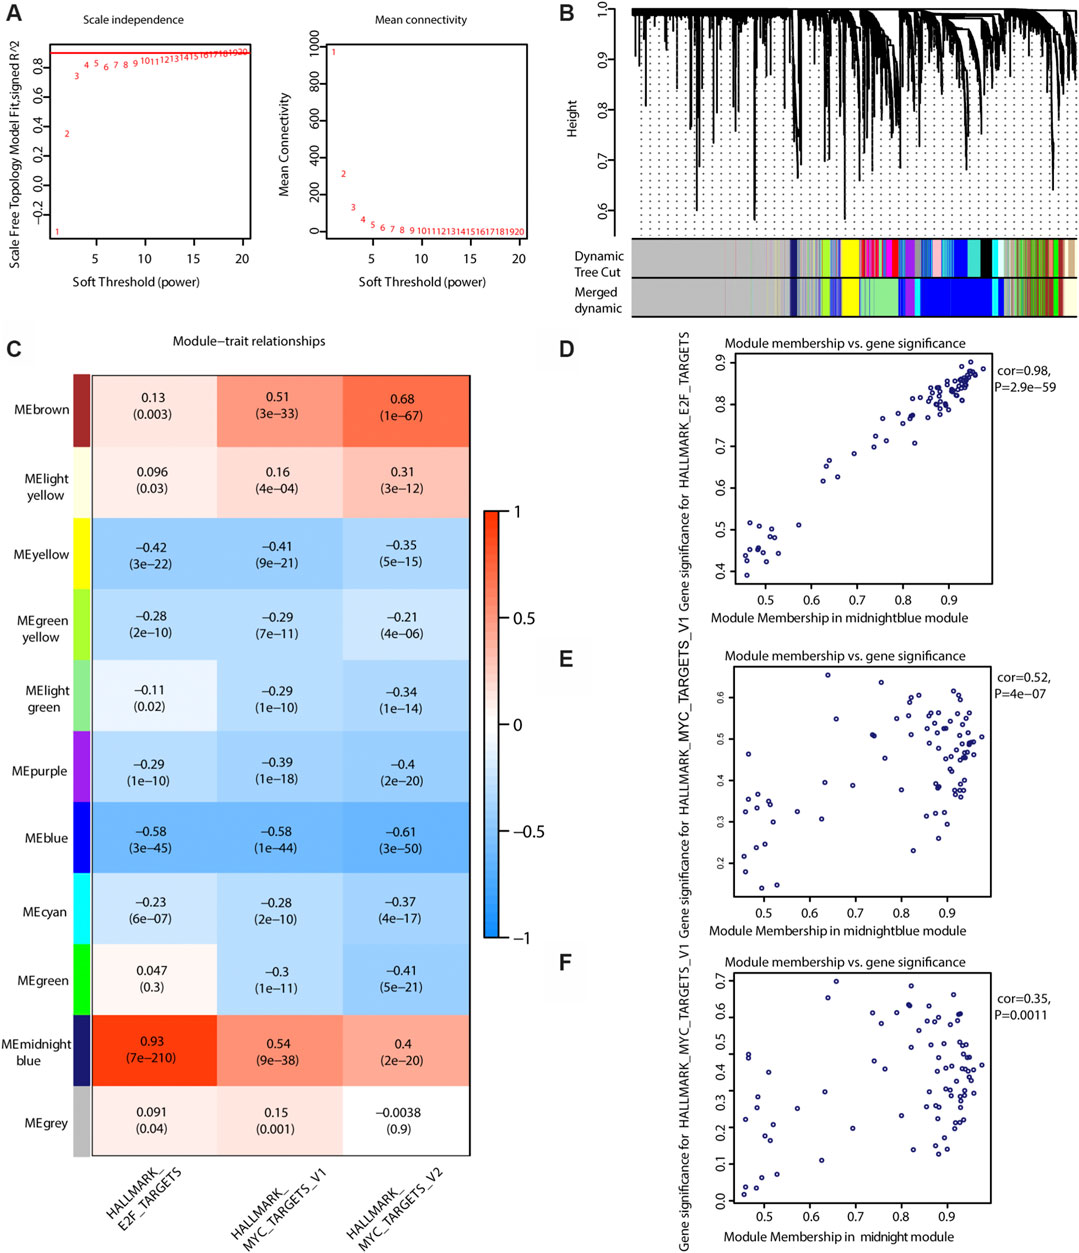
FIGURE 6. WGCNA to find the genes for the development of the model. (A) The relationship of soft threshold and TOM-based dissimilarity (left). The relationship of soft threshold and mean connectivity (right). (B) After the dynamic of cut and merged, a total of 11 gene modules were finally generated. (C) Heat map for the correlation of gene modules and phenotypes. (D) The scatter plot shows the gene significance for E2F ssGSEA score is correlated with module membership in midnightblue module (Pearson rho = 0.98, p < 0.01). (E) The scatter plot shows the gene significance for MYC_V2 ssGSEA score is correlated with module membership in midnightblue module (Pearson rho = 0.35, p < 0.01). (WGCNA, weighted correlation network analysis; TOM, topological overlap matrix. And p < 0.05 is defined as statistically significant).
Since the Risk_H subtype was associated with a poor prognosis, the midnight gene network was chosen to train a prognostic model via LASSO. In the training group, one 12-gene combination had the highest cross-validated C-index (Figure 7A). Changes in gene coefficients during the selection procedure are shown in Figure 7B. Risk scores were obtained for patients as follows:
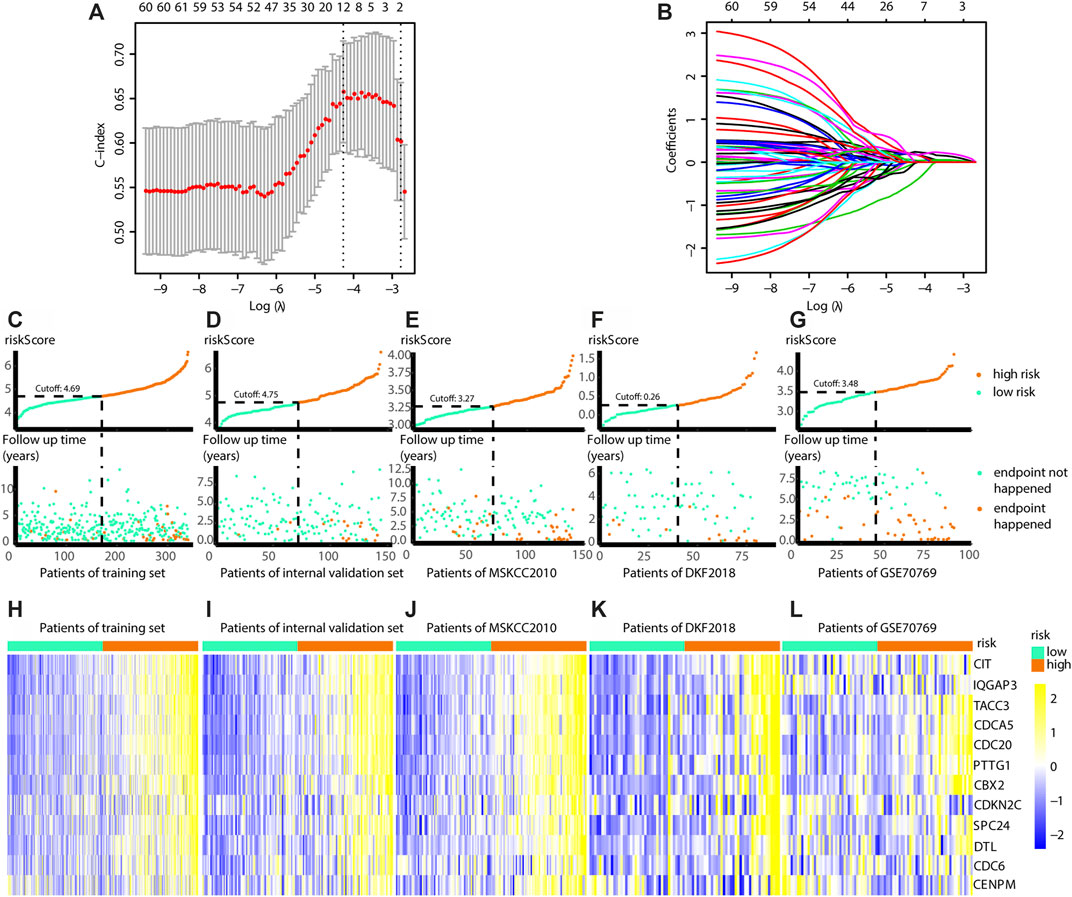
FIGURE 7. Build the risk model by LASSO. (A) Cross validation based on C-index to determine the best choice of genes in the model. (B) Genes in the different combinations and their corresponding coefficients. (C) Patients of training set are arranged in the same ascending order of the risk score. (D) Patients of internal validation set are arranged in the same ascending order of the risk score. (E) Patients of MSKCC2010 data set are arranged in the same ascending order of the risk score. (F) Patients of DKF2018 data set are arranged in the same ascending order of the risk score. (G) Patients of GSE70769 data set are arranged in the same ascending order of the risk score. (C–G) Patients are divided into different risk levels according to the median of the risk scores in their respective data sets (upward). The relationship between the survival outcome and risk levels of patients. Low-risk patients are shown on the left side of the dotted line and high-risk patients are shown on the right side (downward). (H–L) Heatmaps show the expression levels of genes in the model, and indicate the model is robust in these data sets. (LASSO, least absolute shrinkage and selection operator. And p < 0.05 is defined as statistically significant).
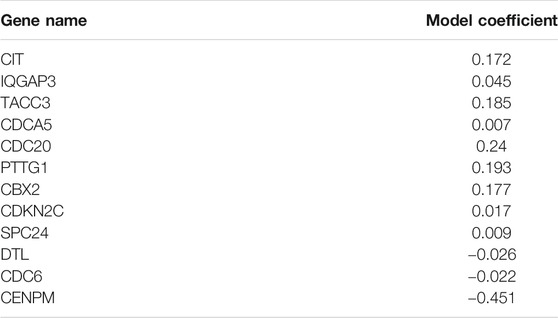
TABLE 3. LASSO coefficients of genes in model.
To validate the accuracy of the model, a tdROC analysis was performed. In the training group, 1°year AUC = 0.733, 3°year AUC = 0.713, and 5°year AUC = 0.714 (Figure 8A). In the internal validation group, 1°year AUC = 0.788, 3°year AUC = 0.778, 5°year AUC = 0.778 (Figure 8B); in the MSKCC2010 data set, 1°year AUC = 0.829, 3°year AUC = 0.748, 5°year AUC = 0.747 (Figure 8C); in the DKF2018 data set, 1°year AUC = 0.834, 3°year AUC = 0.698, 5°year AUC = 0.687 (Figure 8D); in the GSE70769 data set, 1°year AUC = 0.723, 3°year AUC = 0.788, 5°year AUC = 0.740 (Figure 8E). Subsequently, we found that the high-risk patients identified by this model had worse survival in the training group (log-rank test p = 0.006, Cox test p < 0.001), internal validation group (log-rank test p = 0.005, Cox test p = 0.001), MSKCC2010 data set (log-rank test p = 0.024, Cox test p < 0.001), DKF2018 data set (log-rank test p = 0.019, Cox test p < 0.001), and GSE70769 data set (log-rank test p < 0.001, Cox test p < 0.001), as shown in Figures 8F–J. Furthermore, we found that patients who died or experienced recurrence had higher risk scores in the training group (Wilcoxon test p < 0.001), internal validation group (Wilcoxon test p < 0.001), MSKCC2010 data set (Wilcoxon test p < 0.001), DKF2018 data set (Wilcoxon test p < 0.05), and GSE70769 data set (Wilcoxon test p < 0.001). According to univariate and multivariate Cox regression analyses (Table 4), this model and the Gleason grade were independent predictors of prognosis. Taken together, the prognostic model had high accuracy.
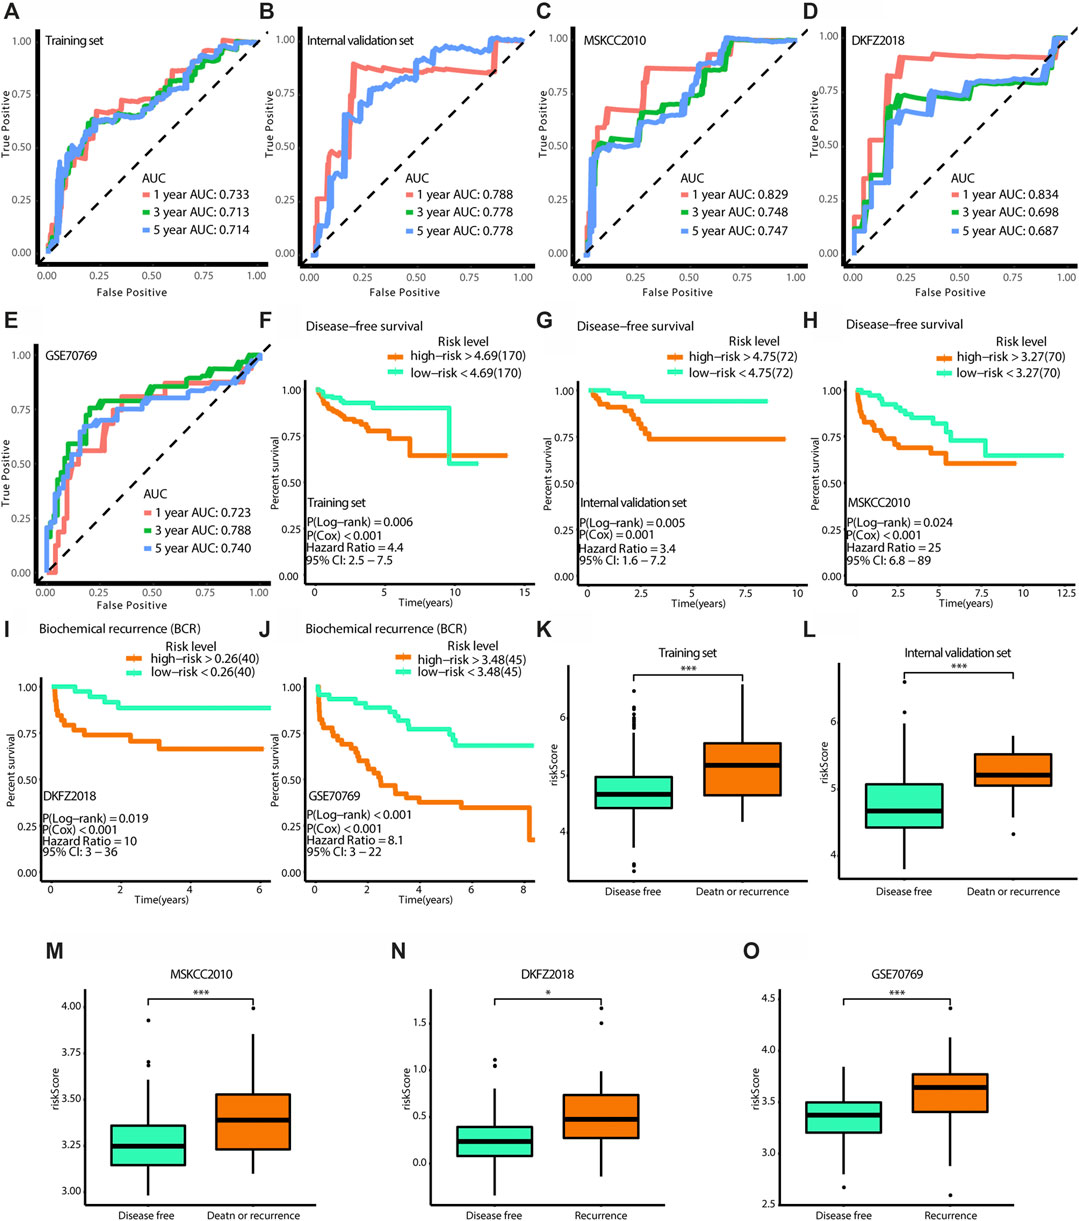
FIGURE 8. Verification of the effectiveness of the model. (A–E) The ROC curves of 1-year, 3-year, and 5-year follow-up time. (F–J) Kaplan-Meier curves for survival analysis. (K–O) The boxplots show the difference of risk score between survival outcomes. (A,F,K) The results in the training set. (B,G,L) The results in the internal validation set. (C,H,M) The results in MSKCC 2010. (D,I,N) The results in DKFZ 2018. (E,J,O) The results in GSE70769. (AUC, area under curve. * means p < 0.05, ** means p < 0.01, *** means p < 0.001, ns means p > 0.05, and p < 0.05 is defined as statistically significant. And p < 0.05 is defined as statistically significant).
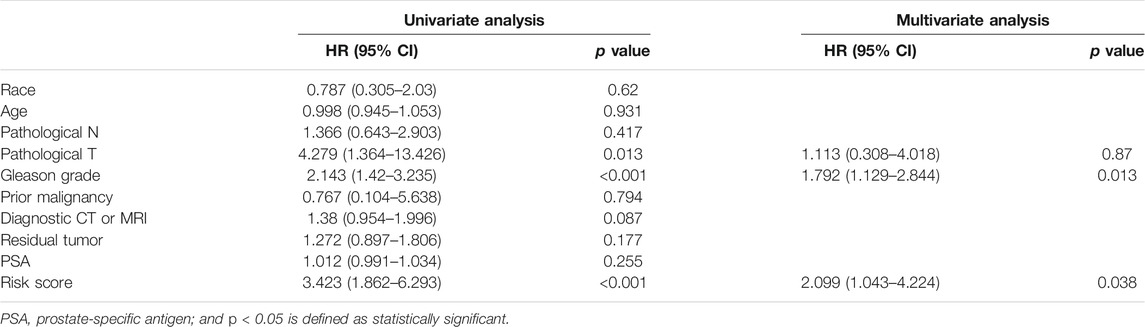
TABLE 4. Results of univariate and multivariate Cox regression.
Using compounds from the CTRP and PRISM databases, we predicted drug sensitivity for patients with high risk scores. As shown in Figure 9A, 3-CI-AHPC, CD-437, CR-1-31B, leptomycin B, SR-II-138A, and YM-155 sensitivities were high for patients with high risk scores (Spearman correlation rho < −0.3, Spearman correlation test p < 0.001, and Wilcoxon test p < 0.001). As shown in Figure 9B, elesclomol, LY2606368, obatoclax, topotecan, VE-822, and vincristine sensitivities were high for patients with high risk scores (Spearman correlation test rho < −0.3, Spearman correlation test p < 0.001, and Wilcoxon test p < 0.001). Collectively, we identified ten target drugs predicted to be effective for high-risk patients, and leptomycin B, LY2606368, and vincristine showed particularly high effectiveness.
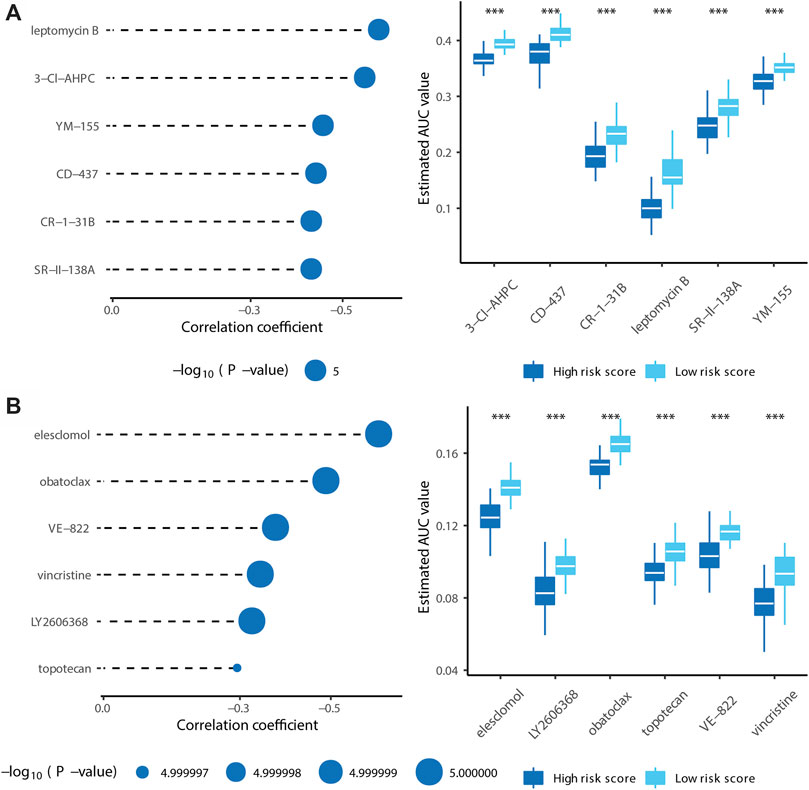
FIGURE 9. Identification of candidate agents with higher drug sensitivity in patients with high risk score. (A) The results of Spearman’s correlation analysis and differential drug response analysis of six CTRP-derived compounds. (B) The results of Spearman’s correlation analysis and differential drug response analysis of six PRISM-derived compounds. Note that lower values on the y-axis of boxplots imply greater drug sensitivity. (* means p < 0.05, ** means p < 0.01, *** means p < 0.001, ns means p > 0.05, and p < 0.05 is defined as statistically significant. And p < 0.05 is defined as statistically significant).
The mechanism underlying PCa progression is complex and cannot be explained by a single pathway. Accordingly, in this study, we used gene expression information for eight PCa-related pathways (i.e., hypoxia, androgen response, PI3K-AKT-mTOR signaling, E2F targets, MYC targets V1, MYC targets V2, glycolysis, fatty acid metabolism, and oxidative phosphorylation pathways) extracted from Molecular Signatures Database v7.2 and data for PCa cohorts from multiple platforms (TCGA, GSE70769, DKF 2018, and MSKCC 2010) to identify three PCa subtypes (Risk_H, Risk_M and Risk_L). These subtypes were then used to construct a risk-predicting model and drug sensitivity prediction was performed for the high-risk group.
For patients with PCa, an elevated hypoxic status is related to a more aggressive and advanced disease; hypoxia reduction could increase immunity and the response to specific immunotherapies (Jayaprakash et al., 2018). Additionally, prostate is an androgen-dependent organ, and androgen interactions with androgen receptors play a key role in the progression of PCa. Endocrine therapy in PCa is aimed at lowering serum androgen levels and inhibiting androgen receptor; when this approach fails, PCa advances to a hormone-resistant state (Heinlein and Chang, 2004; Shafi et al., 2013). The PI3K-AKT-mTOR pathway interacts with multiple cellular cascades, further promoting PCa progression and aggression, and drugs targeting this pathway are employed in clinical settings (Shorning et al., 2020). E2F and MYC synergistically contribute to cell cycle regulation and are involved in tumorigenesis (Liu et al., 2015). Metabolic adaptation is pivotal for malignancy given the high energy demand, and glycolytic, fatty acid biosynthesis, and oxidative phosphorylation contribute to proliferation and worse outcomes in PCa (Schöpf et al., 2016; Xiao et al., 2018; Balusamy et al., 2020). We classified samples into three subtypes with different patterns of pathway enrichment.
Among the three subtypes, the cluster with enrichment for the E2F and MYC pathways was identified as high-risk group (Risk_H), which was associated with the worst clinical outcomes. Further analyses of the proliferation scores and MKI67 gene expression level support the highly proliferative feature of the Risk_H cohort. Additionally, the proportions of immune and stromal cells were highest in the Risk_L cohort. NK cells, which possesses important anti-cancer functions (Abel et al., 2018), were most abundant in the Risk_L group. Thus, the poor prognosis in the Risk_H group can be explained from the perspective of immune activity. Additionally, RhoBTB2, a candidate tumor suppressor, has been implicated in various cancers, such as breast cancer and lung cancer (McKinnon et al., 2008). However, little is known about its role in PCa. We found that the single copy deletion of RhoBTB2 was most frequent in the Risk_H group, while its overall expression was highest in the Risk_L group. This finding may provide an entry point for future PCa research. The TNFRSF10C gene, also known as TRAIL-R3, is a decoy receptor for tumor necrosis factor-related apoptosis-inducing ligand, inducing tumor apoptosis in multiple malignancies (Almodóvar et al., 2004). We detected copy number variation distinguishing the Risk_H and Risk_L subtypes, and this may further explain the poor prognosis in the Risk_H group.
After establishing the prognostic value and properties of the subtypes, we constructed a twelve gene-based risk-prediction model. This model could supplement current strategies for clinical decision-making and prognostic predictions. Finally, we filtered twelve drugs expected to show high sensitivity in high-risk patients with PCa, 3-CI-HPC, CD-437, CR-1-31B, leptomycin B, SR-II-138A, YM-155, elesclomol, LY2606368, obatoclax, topotecan, VE-822, and vincristine.
As a complex and heterogeneous disease, PCa is difficult to manage by a universal treatment approach. In this study, we divided PCa into three clusters based on eight pivotal pathways, allowing for more innovative and objective results than those obtained by analyses of single pathways. Moreover, we translated the results into a clinically useful tool and identified potentially effective drugs for high-risk patients, providing direct guidance for clinical strategies aimed at precision medicine. However, our study had limitations. First, the results are based on retrospective investigations of cohorts from multiple platforms; prospective explorations are needed to validate our results. Further clinical studies of the drug candidates are needed. Despite these drawbacks, our results provide novel ideas for PCa management.
The original contributions presented in the study are included in the article/Supplementary Material, further inquiries can be directed to the corresponding author.
EZ, LS, and YS were responsible for the design and conception of the research project; EZ, FS, MZ, PW, JH, YG, and YS and contributed to data acquisition, or data analysis and data cleaning; EZ and LS participated in the drafting of the manuscript and the rigorous modification of the manuscript to clearly convey the research contents. All authors are responsible for the authenticity and reliability of this study and have no objection to the final submitted manuscript.
This research was supported by the National Natural Science Foundation of China (No. 81802540), the Natural Science Foundation of Liaoning Province (No. 20180550985), the Shenyang Science and Technology Program for Young Innovative Talents (No. RC190386), and the 345 Talent Project of Shengjing Hospital of China Medical University. The 345 Talent Project includes the 30 project and the 50 project.
The authors declare that the research was conducted in the absence of any commercial or financial relationships that could be construed as a potential conflict of interest.
We thank the Medical Research Center of Shengjing Hospital for providing us with laboratories.
The Supplementary Material for this article can be found online at: https://www.frontiersin.org/articles/10.3389/fmolb.2021.676138/full#supplementary-material
Abel, A. M., Yang, C., Thakar, M. S., and Malarkannan, S. (2018). Natural Killer Cells: Development, Maturation, and Clinical Utilization. Front. Immunol. 9, 1869. doi:10.3389/fimmu.2018.01869
Abeshouse, A., Ahn, J., Akbani, R., Ally, A., Amin, S., Andry, C. D., et al. (2015). The Molecular Taxonomy of Primary Prostate Cancer. Cell 163 (4), 1011–1025. doi:10.1016/j.cell.2015.10.025
Almodóvar, C. R. d., López-Rivas, A., Redondo, J. M., and Rodríguez, A. (2004). Transcriptional Regulation of the TRAIL-R3 Gene. Vitam Horm. 67, 51–63. doi:10.1016/s0083-6729(04)67004-x
Aran, D., Hu, Z., and Butte, A. J. (2017). xCell: Digitally Portraying the Tissue Cellular Heterogeneity Landscape. Genome Biol. 18 (1), 220. doi:10.1186/s13059-017-1349-1
Balusamy, S. R., Perumalsamy, H., Veerappan, K., Huq, M. A., Rajeshkumar, S., Lakshmi, T., et al. (2020). Citral Induced Apoptosis through Modulation of Key Genes Involved in Fatty Acid Biosynthesis in Human Prostate Cancer Cells: In Silico and In Vitro Study. Biomed. Res. Int. 2020, 1–15. doi:10.1155/2020/6040727
Barrett, T., Troup, D. B., Wilhite, S. E., Ledoux, P., Rudnev, D., Evangelista, C., et al. (2009). NCBI GEO: Archive for High-Throughput Functional Genomic Data. Nucleic Acids Res. 37 (Suppl. l_1), D885–D890. doi:10.1093/nar/gkn764
Cerami, E., Gao, J., Dogrusoz, U., Gross, B. E., Sumer, S. O., Aksoy, B. A., et al. (2012). The cBio Cancer Genomics Portal: An Open Platform for Exploring Multidimensional Cancer Genomics Data: Figure 1. Cancer Discov. 2 (5), 401–404. doi:10.1158/2159-8290.CD-12-0095
Davis, S., and Meltzer, P. S. (2007). GEOquery: a Bridge Between the Gene Expression Omnibus (GEO) and BioConductor. Bioinformatics 23 (14), 1846–1847. doi:10.1093/bioinformatics/btm254
Edlind, M. P., and Hsieh, A. C. (2014). PI3K-AKT-mTOR Signaling in Prostate Cancer Progression and Androgen Deprivation Therapy Resistance. Asian J. Androl. 16 (3), 378–386. doi:10.4103/1008-682X.122876
Evans, A. J. (2018). Treatment Effects in Prostate Cancer. Mod. Pathol. 31 (S1), 110–121. doi:10.1038/modpathol.2017.158
Fonti, V., and Belitser, E. (2017). Feature Selection Using Lasso. VU Amsterdam Res. Paper Business Analytics 30, 1–25.
Gann, P. H., Hennekens, C. H., Sacks, F. M., Grodstein, F., Giovannucci, E. L., and Stampfer, M. J. (1994). Prospective Study of Plasma Fatty Acids and Risk of Prostate Cancer. JNCI J. Natl. Cancer Inst. 86 (4), 281–286. doi:10.1093/jnci/86.4.281
Gao, J., Aksoy, B. A., Dogrusoz, U., Dresdner, G., Gross, B., Sumer, S. O., et al. (2013). Integrative Analysis of Complex Cancer Genomics and Clinical Profiles Using the cBioPortal. Sci. Signaling 6 (269), pl1. doi:10.1126/scisignal.2004088
Geeleher, P., Cox, N., and Huang, R. S. (2014). pRRophetic: an R Package for Prediction of Clinical Chemotherapeutic Response from Tumor Gene Expression Levels. PLoS One 9 (9), e107468. doi:10.1371/journal.pone.0107468
Hänzelmann, S., Castelo, R., and Guinney, J. (2013). GSVA: Gene Set Variation Analysis for Microarray and RNA-Seq Data. BMC bioinformatics 14 (1), 1–15. doi:10.1186/1471-2105-14-7
Heinlein, C. A., and Chang, C. (2004). Androgen Receptor in Prostate Cancer. Endocr. Rev. 25 (2), 276–308. doi:10.1210/er.2002-0032
Ippolito, L., Marini, A., Cavallini, L., Morandi, A., Pietrovito, L., Pintus, G., et al. (2016). Metabolic Shift Toward Oxidative Phosphorylation in Docetaxel Resistant Prostate Cancer Cells. Oncotarget 7 (38), 61890–61904. doi:10.18632/oncotarget.11301
Jayaprakash, P., Ai, M., Liu, A., Budhani, P., Bartkowiak, T., Sheng, J., et al. (2018). Targeted Hypoxia Reduction Restores T Cell Infiltration and Sensitizes Prostate Cancer to Immunotherapy. J. Clin. Invest. 128 (11), 5137–5149. doi:10.1172/jci96268
Kaseb, A. O., Chinnakannu, K., Chen, D., Sivanandam, A., Tejwani, S., Menon, M., et al. (2007). Androgen Receptor- and E2F-1-Targeted Thymoquinone Therapy for Hormone-Refractory Prostate Cancer. Cancer Res. 67 (16), 7782–7788. doi:10.1158/0008-5472.can-07-1483
Koh, C. M., Bieberich, C. J., Dang, C. V., Nelson, W. G., Yegnasubramanian, S., and De Marzo, A. M. (2010). MYC and Prostate Cancer. Genes & Cancer 1 (6), 617–628. doi:10.1177/1947601910379132
Kourou, K., Exarchos, T. P., Exarchos, K. P., Karamouzis, M. V., and Fotiadis, D. I. (2015). Machine Learning Applications in Cancer Prognosis and Prediction. Comput. Struct. Biotechnol. J. 13, 8–17. doi:10.1016/j.csbj.2014.11.005
Kuhn, M. (2008). Building Predictive Models in R Using the Caret Package. J. Stat. Softw. 28 (5), 1–26. doi:10.18637/jss.v028.i05
Labrecque, M. P., Coleman, I. M., Brown, L. G., True, L. D., Kollath, L., Lakely, B., et al. (2019). Molecular Profiling Stratifies Diverse Phenotypes of Treatment-Refractory Metastatic Castration-Resistant Prostate Cancer. J. Clin. Invest. 129 (10), 4492–4505. doi:10.1172/jci128212
Langfelder, P., and Horvath, S. (2008). WGCNA: an R Package for Weighted Correlation Network Analysis. BMC Bioinformatics 9, 559. doi:10.1186/1471-2105-9-559
Lee, D. J., Mallin, K., Graves, A. J., Chang, S. S., Penson, D. F., Resnick, M. J., et al. (2017). Recent Changes in Prostate Cancer Screening Practices and Epidemiology. J. Urol. 198 (6), 1230–1240. doi:10.1016/j.juro.2017.05.074
Li, G., Jiang, Y., Lyu, X., Cai, Y., Zhang, M., Wang, Z., et al. (2019). Deconvolution and Network Analysis of IDH-Mutant Lower Grade Glioma Predict Recurrence and Indicate Therapeutic Targets. Epigenomics 11 (11), 1323–1333. doi:10.2217/epi-2019-0137
Liberzon, A., Birger, C., Thorvaldsdóttir, H., Ghandi, M., Mesirov, J. P., and Tamayo, P. (2015). The Molecular Signatures Database Hallmark Gene Set Collection. Cel Syst. 1 (6), 417–425. doi:10.1016/j.cels.2015.12.004
Liu, H., Tang, X., Srivastava, A., Pécot, T., Daniel, P., Hemmelgarn, B., et al. (2015). Redeployment of Myc and E2f1-3 Drives Rb-Deficient Cell Cycles. Nat. Cel Biol 17 (8), 1036–1048. doi:10.1038/ncb3210
Liu, J., Lichtenberg, T., Hoadley, K. A., Poisson, L. M., Lazar, A. J., Cherniack, A. D., et al. (2018). An Integrated TCGA Pan-Cancer Clinical Data Resource to Drive High-Quality Survival Outcome Analytics. Cell 173 (2), 400–416.e11. doi:10.1016/j.cell.2018.02.052
Love, M. I., Huber, W., and Anders, S. (2014). Moderated Estimation of Fold Change and Dispersion for RNA-Seq Data with DESeq2. Genome Biol. 15 (12), 1–21. doi:10.1186/s13059-014-0550-8
McKinnon, C. M., Lygoe, K. A., Skelton, L., Mitter, R., and Mellor, H. (2008). The Atypical Rho GTPase RhoBTB2 Is Required for Expression of the Chemokine CXCL14 in normal and Cancerous Epithelial Cells. Oncogene 27 (54), 6856–6865. doi:10.1038/onc.2008.317
Meacham, C. E., and Morrison, S. J. (2013). Tumour Heterogeneity and Cancer Cell Plasticity. Nature 501 (7467), 328–337. doi:10.1038/nature12624
Milosevic, M., Warde, P., Ménard, C., Chung, P., Toi, A., Ishkanian, A., et al. (2012). Tumor Hypoxia Predicts Biochemical Failure Following Radiotherapy for Clinically Localized Prostate Cancer. Clin. Cancer Res. 18 (7), 2108–2114. doi:10.1158/1078-0432.ccr-11-2711
Qiu, H., Hu, X., He, C., Yu, B., Li, Y., and Li, J. (2020a). Identification and Validation of an Individualized Prognostic Signature of Bladder Cancer Based on Seven Immune Related Genes. Front. Genet. 11, 12. doi:10.3389/fgene.2020.00012
Qiu, H., Li, Y., Cheng, S., Li, J., He, C., and Li, J. (2020b). A Prognostic Microenvironment-Related Immune Signature via ESTIMATE (PROMISE Model) Predicts Overall Survival of Patients with Glioma. Front. Oncol. 10, 580263. doi:10.3389/fonc.2020.580263
Ross-Adams, H., Lamb, A. D., Dunning, M. J., Halim, S., Lindberg, J., Massie, C. M., et al. (2015). Integration of Copy Number and Transcriptomics Provides Risk Stratification in Prostate Cancer: A Discovery and Validation Cohort Study. EBioMedicine 2 (9), 1133–1144. doi:10.1016/j.ebiom.2015.07.017
Schöpf, B., Schäfer, G., Weber, A., Talasz, H., Eder, I. E., Klocker, H., et al. (2016). Oxidative Phosphorylation and Mitochondrial Function Differ between Human Prostate Tissue and Cultured Cells. FEBS J. 283 (11), 2181–2196. doi:10.1111/febs.13733
Shafi, A. A., Yen, A. E., and Weigel, N. L. (2013). Androgen Receptors in Hormone-dependent and Castration-Resistant Prostate Cancer. Pharmacol. Ther. 140 (3), 223–238. doi:10.1016/j.pharmthera.2013.07.003
Shorning, B. Y., Dass, M. S., Smalley, M. J., and Pearson, H. B. (2020). The PI3K-AKT-mTOR Pathway and Prostate Cancer: At the Crossroads of AR, MAPK, and WNT Signaling. Int. J. Mol. Sci. 21 (12), 4507. doi:10.3390/ijms21124507
Steen, C. B., Liu, C. L., Alizadeh, A. A., and Newman, A. M. (2020). Profiling Cell Type Abundance and Expression in Bulk Tissues with CIBERSORTx. Methods Mol. Biol. 2117, 135–157. doi:10.1007/978-1-0716-0301-7_7
Thorsson, V., Gibbs, D. L., Brown, S. D., Wolf, D., Bortone, D. S., Ou Yang, T. H., et al. (2018). The Immune Landscape of Cancer. Immunity 48 (4), 812–830.e14. doi:10.1016/j.immuni.2018.03.023
Vlachostergios, P. J., Puca, L., and Beltran, H. (2017). Emerging Variants of Castration-Resistant Prostate Cancer. Curr. Oncol. Rep. 19 (5), 32. doi:10.1007/s11912-017-0593-6
Wang, G., Zhao, D., Spring, D. J., and DePinho, R. A. (2018). Genetics and Biology of Prostate Cancer. Genes Dev. 32 (17-18), 1105–1140. doi:10.1101/gad.315739.118
Wilkerson, M. D., and Hayes, D. N. (2010). ConsensusClusterPlus: a Class Discovery Tool with Confidence Assessments and Item Tracking. Bioinformatics 26 (12), 1572–1573. doi:10.1093/bioinformatics/btq170
Wu, H., Tremaroli, V., Schmidt, C., Lundqvist, A., Olsson, L. M., Krämer, M., et al. (2020). The Gut Microbiota in Prediabetes and Diabetes: A Population-Based Cross-Sectional Study. Cel Metab. 32 (3), 379–390. doi:10.1016/j.cmet.2020.06.011
Xiao, H., Wang, J., Yan, W., Cui, Y., Chen, Z., Gao, X., et al. (2018). GLUT1 Regulates Cell Glycolysis and Proliferation in Prostate Cancer. Prostate 78 (2), 86–94. doi:10.1002/pros.23448
Xiao, H., Wang, J., Yan, W., Cui, Y., Chen, Z., Gao, X., et al. (2018). GLUT1 Regulates Cell Glycolysis and Proliferation in Prostate Cancer. Prostate 78 (2), 86–94. doi:10.1002/pros.23448
Yoshihara, K., Shahmoradgoli, M., Martínez, E., Vegesna, R., Kim, H., Torres-Garcia, W., et al. (2013). Inferring Tumour Purity and Stromal and Immune Cell Admixture from Expression Data. Nat. Commun. 4 (1), 1–11. doi:10.1038/ncomms3612
Yoshihara, K., Wang, Q., Torres-Garcia, W., Zheng, S., Vegesna, R., Kim, H., et al. (2015). The Landscape and Therapeutic Relevance of Cancer-Associated Transcript Fusions. Oncogene 34 (37), 4845–4854. doi:10.1038/onc.2014.406
Zhang, E., He, J., Zhang, H., Shan, L., Wu, H., Zhang, M., et al. (2020). Immune-Related Gene-Based Novel Subtypes to Establish a Model Predicting the Risk of Prostate Cancer. Front. Genet. 11, 595657. doi:10.3389/fgene.2020.595657
Zhang, E., He, J., Zhang, H., Shan, L., Wu, H., Zhang, M., et al. (2020). Immune-Related Gene-Based Novel Subtypes to Establish a Model Predicting the Risk of Prostate Cancer. Front. Genet. 11, 595657. doi:10.3389/fgene.2020.595657
Keywords: prostate cancer, predictive model, prognosis, RhoBTB2, TNFRSF10C, systems biology
Citation: Zhang E, Shiori F, Zhang M, Wang P, He J, Ge Y, Song Y and Shan L (2021) Establishment of Novel Prostate Cancer Risk Subtypes and A Twelve-Gene Prognostic Model. Front. Mol. Biosci. 8:676138. doi: 10.3389/fmolb.2021.676138
Received: 06 April 2021; Accepted: 14 May 2021;
Published: 28 May 2021.
Edited by:
Xin Wang, City University of Hong Kong, ChinaReviewed by:
Hongpan Zhang, Capital Medical University, ChinaCopyright © 2021 Zhang, Shiori, Zhang, Wang, He, Ge, Song and Shan. This is an open-access article distributed under the terms of the Creative Commons Attribution License (CC BY). The use, distribution or reproduction in other forums is permitted, provided the original author(s) and the copyright owner(s) are credited and that the original publication in this journal is cited, in accordance with accepted academic practice. No use, distribution or reproduction is permitted which does not comply with these terms.
*Correspondence: Liping Shan, c2xwdXJvQDE2My5jb20=, c2hhbmxwQHNqLWhvc3BpdGFsLm9yZw==
Disclaimer: All claims expressed in this article are solely those of the authors and do not necessarily represent those of their affiliated organizations, or those of the publisher, the editors and the reviewers. Any product that may be evaluated in this article or claim that may be made by its manufacturer is not guaranteed or endorsed by the publisher.
Research integrity at Frontiers
Learn more about the work of our research integrity team to safeguard the quality of each article we publish.