 Tong Lin
 Wenya Peng1
- 1The Fourth Clinical Medical School, Guangzhou University of Chinese Medicine, Shenzhen, China
- 2Department of Science and Education, Shenzhen Traditional Chinese Medicine Hospital, Shenzhen, China
The prognosis of patients with gastric cancer (GC) is still unsatisfying. Numerous markers of gastric cancer stem cells (GCSCs) have been identified and were thought to be related to cancer aggressiveness. However, the roles of GCSC markers in GC patients’ prognosis and immune infiltration remain unknown. Expression of GCSC markers was analyzed using Oncomine and Gene Expression Profiling Interactive Analysis (GEPIA). Their associations with clinicopathological parameters were analyzed using UALCAN and LinkedOmics. Alternations and protein expression of GCSC markers were analyzed by cBioPortal and the Human Protein Atlas databases, respectively. The prognostic significance of GCSC markers was evaluated using Kaplan-Meier plotter. Correlations between the expression of GCSC markers and immune infiltration along with biomarkers of tumor-infiltrating immune cells (TIICs) were assessed combined Tumor Immune Estimation Resource and GEPIA. GeneMANIA was used to discover the interactive genes of GCSC markers, and enrichment analysis was performed using Database for Annotation, Visualization, and Integrated Discovery server. We identified six GCSC markers significantly up-expressed in GC, compared with normal stomach tissues. Among them, the overexpression of ICAM1, THY1, and CXCR4 significantly indicated adverse, while EPCAM indicated beneficial clinicopathological features of GC patients. The up-regulation of CXCR4 showed unfavorable prognostic significance, whereas EPCAM and TFRC showed the opposite. The six GCSC markers were all correlated with the infiltration and activation of distinct TIICs. Especially, ICAM1, THY1, and CXCR4 showed strongly positive correlations with tumor-associated macrophages. Besides, chemokine, Toll-like receptor, NF-kappa B, and HIF-1 signaling pathways might be involved in the regulation of GCSC markers on cancer development. This study proposed that GCSC markers might be promising targets of GC treatment to weaken cancer stem-like properties and strengthen anticancer immunity.
Introduction
Gastric cancer (GC) is the fifth most frequently diagnosed and the third leading cause of cancer mortality in the world (Bray et al., 2018). Due to the occult symptoms, over 60% of GC patients are diagnosed at advanced stages where curative surgery is impossible (Thrift and El-Serag, 2020). Chemotherapy and targeted therapy can improve survival and quality of life of unresectable or metastatic GC patients, while drug resistance frequently leads to poor outcomes (Jones and Smyth, 2020; Wei et al., 2020). Over the last 10 years, immunotherapy has revolutionized the field of cancer, especially immune checkpoint inhibitors. However, the clinical efficacy is still unsatisfying in most GC patients (Smyth et al., 2020).
Cancer stem cells (CSCs) are proposed to be a small population of the tumor mass with stem cell properties, which are believed to be responsible for generation, heterogeneity, and sustaining growth of cancer, as well as treatment resistance, recurrence, and metastasis (O’Connor et al., 2014). Abundant studies demonstrated that CSCs share markers with tissue stem cells, and biomarkers of gastric CSCs (GCSCs) have been explored in recent decades (Nguyen et al., 2017). CD44 (CD44) was the first identified marker of human GCSC in 2009. After that, epithelial cell adhesion molecules (EPCAM), intercellular adhesion molecule 1 (ICAM1, also known as CD54), aldehyde dehydrogenase 1 (ALDH1), CD90 (THY1), CD133 (PROM1), transferrin receptor protein 1 (TFRC, also known as CD71), signal transducer CD24 (CD24), octamer-binding transcription factor 4 (OCT4), sex determining region Y-box transcription factor 2 (SOX2), leucine-rich repeat-containing G-protein coupled receptor 5 (LGR5 or GPR49), homeobox protein NANOG (NANOG), ATP-binding cassette subfamily B member 1 (ABCB1), ATP-binding cassette subfamily G member 2 (ABCG2), C-X-C motif chemokine receptor 4 (CXCR4), CD166 (ALCAM), doublecortin-like kinase (DCLK1), integrin alpha-6 (ITGA6, also known as CD49f), and RNA-binding protein Musashi homolog 1 (MSI1) were identified (Ishimoto et al., 2014; Brungs et al., 2016; Bekaii-Saab and El-Rayes, 2017; Nguyen et al., 2017; Fu et al., 2020; Lizárraga-Verdugo et al., 2020). The CSC theory provides a meaningful pointcut that targeting the vital markers or pathways involved in the maintenance of CSCs might influence their stem cell-like properties to eliminate cancer.
Accumulating evidence proved that tumor-infiltrating immune cells (TIICs) in the tumor microenvironment (TME) play critical roles in immune escape and cancer progression, and could serve as prognostic biomarkers. For example, higher infiltrating density of CD4+, CD8+ T cells, and fewer FOXP3+ regulatory T cells (Tregs) could predict improved survival of postsurgical GC patients (Nguyen et al., 2017). Tumor-associated macrophages (TAMs) constitute over half of the immune cells in the TME, and a high density of which are associated with unfavorable outcomes of various cancers (Zhang et al., 2017). Additionally, it was reported that interplays between TIICs and GCSCs might promote cancer (Sainz et al., 2016; Sultan et al., 2017). A better understanding of the interactions between GCSCs and immune infiltration may empower new CSC-directed immunotherapeutic strategies. As yet, the knowledge has not been fully clarified.
In this study, we comprehensively analyzed the expression, alternations, clinicopathological relevance, prognostic value, and correlations with immune infiltration of GCSC markers in GC. Moreover, the interactive genes of GCSC markers were discovered and their biological functions were elucidated to learn the potential regulatory mechanisms of GCSC markers on GC. The findings of our study will uncover the prognostic values of GCSC markers in GC patients, and provide novel insights into the relationships between GCSCs and cancer immunity.
Materials and Methods
Analysis of Expression of GCSC Markers in GC
Oncomine1 is an online server analyzing microarrays of 18,000 cancer samples integrating data from published literature, the Stanford Microarray Database, and the NCBI Gene Expression Omnibus (GEO) (Rhodes et al., 2007). A meta-analysis of the mRNA expression of GCSC markers in GC and normal stomach tissues was performed by the Oncomine server. The threshold was set as fold change of 1.5, P-value of 0.01, and a rank of the top 10% of genes.
Gene Expression Profiling Interactive Analysis (GEPIA)2 is a web portal to analyze transcriptome data, based on 9,736 tumors and 8,587 normal samples from the Cancer Genome Atlas (TCGA) and the GTEx projects (Tang et al., 2017). The expression of GCSC markers was further confirmed by GEPIA using GC dataset, with the threshold as P-value of 0.01 and fold change of 1.5. The significantly high-expressed GCSC markers overlapping between Oncomine and GEPIA databases were identified using a Venn diagram, which were included in the further investigations.
UALCAN (Chandrashekar et al., 2017)3 and LinkedOmics (Vasaikar et al., 2018)4 are both interactive platforms for in-depth analysis of cancer omics data from TCGA. Here, these two databases were used to evaluate the expression of GCSC markers in GC patients with distinct clinicopathological parameters, UALCAN was for genders, ages, major stages, and tumor grades; and LinkedOmics was for TNM stages.
Analysis of Alternations and Protein Expression of GCSC Markers in GC
cBioPortal5 is a comprehensive web resource providing visual and multidimensional cancer genomics data (Cerami et al., 2012; Gao et al., 2013). The “TCGA and Firehose Legacy” dataset including data of 478 GC cases was selected in this study. The alternation profiles including mutations, putative copy-number alterations, mRNA expression (z-scores relative to diploid samples with a score threshold of ±2.0), and protein expression (z-scores with a score threshold of ±2.0) were analyzed.
The Human Protein Atlas (HPA) is a program aiming to map all the human proteins in cells, tissues, and organs, the resource of which is openly accessible at https://www.Proteinatlas.org/ (Edfors et al., 2017). The protein expression of GCSC markers in GC tissues and normal stomach tissues were analyzed using immunohistochemistry (IHC) staining data from the HPA. The expression levels of the GCSC markers were quantitated by staining intensity, categorized into negative (none), weak (<25%), medium (25–75%), and strong (>75%).
Analysis of Prognostic Significance of GCSC Markers in GC Patients
Kaplan-Meier (KM) Plotter6 is an online tool for survival analysis of 54 k genes in 21 types of cancers, the data sources of which include the GEO, European Genome-phenome Archive, and TCGA (Györffy et al., 2010). KM Plotter was applied to evaluate the associations between the expression of GCSC markers and overall survival (OS) and relapse-free survival (RFS) of all GC patients, as well as GC patients with distinct clinical parameters. All cases were split into two groups by the median of a gene’s expression.
Analysis of Correlations Between Expression of GCSC Markers and Immune Infiltration in GC
Tumor Immune Estimation Resource (TIMER)7 is a web server for the investigation of tumor-immune interactions, which incorporates 10,897 samples across 32 kinds of cancers from TCGA (Li et al., 2017). The correlations between the expression of GCSC markers and infiltration levels of diverse TIICs, including CD8+ T cells, CD4+ T cells, B cells, neutrophils, macrophages, dendritic cells (DCs), and myeloid-derived suppressor cells (MDSCs) in GC were assessed by TIMER. Furthermore, correlations between expression of GCSC markers and biomarkers of TIICs were studied using GEPIA. Correlation strength was measured by correlation coefficient value referring to the previous studies: 0.00–0.19 is “very weak”, 0.20–0.39 is “weak”, 0.40–0.59 is “moderate”, 0.60–0.79 is “strong”, and 0.80–1.0 is “very strong” (Pan et al., 2019; Xiao et al., 2020).
Gene Interaction Networks of GCSC Markers and Functional Enrichment Analysis
GeneMANIA8 is a web tool for the investigation into associated genes for quired genes through analysis of physical and functional associations, such as co-expression, co-localization, and physical interaction (Franz et al., 2018). We constructed gene interaction networks for every single GCSC marker gene using GeneMANIA. Then, Gene Ontology (GO) and Kyoto Encyclopedia of Genes and Genomes (KEGG) pathway enrichment analysis was performed for the component genes in each gene interaction network, using Database for Annotation, Visualization, and Integrated Discovery (DAVID) server9 (Huang et al., 2009). GO enrichment analysis predicted the biological functions of genes in three aspects: biological process (BP), cellular component (CC), and molecular function (MF).
Statistical Analysis
The comparison of gene expression level in cancer and normal tissues by Oncomine and UALCAN platforms was conducted using student’s t-test, that by GEPIA platform was conducted using one-way ANOVA test, and that by LinkedOmics platform was conducted using Kruskal–Wallis test. The association of gene expression and patients’ survival was analyzed using log-rank test, and the survival curve, hazard ratio (HR), 95% confidence interval (CI), and P-value were generated. Spearman’s method was applied to evaluate the correlation of gene expression with immune infiltration level or biomarkers’ expression of TIICs. For all the analyses, P < 0.05 was considered statistically significant, and a false discovery rate (FDR) <0.05 was an additional criterion for functional enrichment analysis.
Results
Expression of GCSC Markers in GC Patients
Firstly, to determine the differential expression of GCSC markers, the mRNA expression of EPCAM, ICAM1, ALDH1, THY1, PROM1, TFRC, CD24, OCT4, SOX2, LGR5, NANOG, ABCB1, ABCG2, CXCR4, ALCAM, DCLK1, ITGA6, and MSI1 in GC and normal stomach tissues were analyzed using the Oncomine and GEPIA databases, respectively. It turned out that eight GCSC markers were significantly higher expressed in GC than normal stomach tissues in Oncomine (Figure 1A) and GEPIA (Figure 1B), respectively. Even though there were some differences in the results from the two databases, the expressions of EPCAM, ICAM1, THY1, TFRC, LGR5, and CXCR4 were consistently significantly elevated in both databases, so the six GCSC markers were included in our following study (Figure 1C). As shown in Figure 1A, significant overexpression of the six GCSC markers was observed in a total of 29 GC datasets (Supplementary Table 1). Additionally, they were elevated in numerous datasets of various cancers.
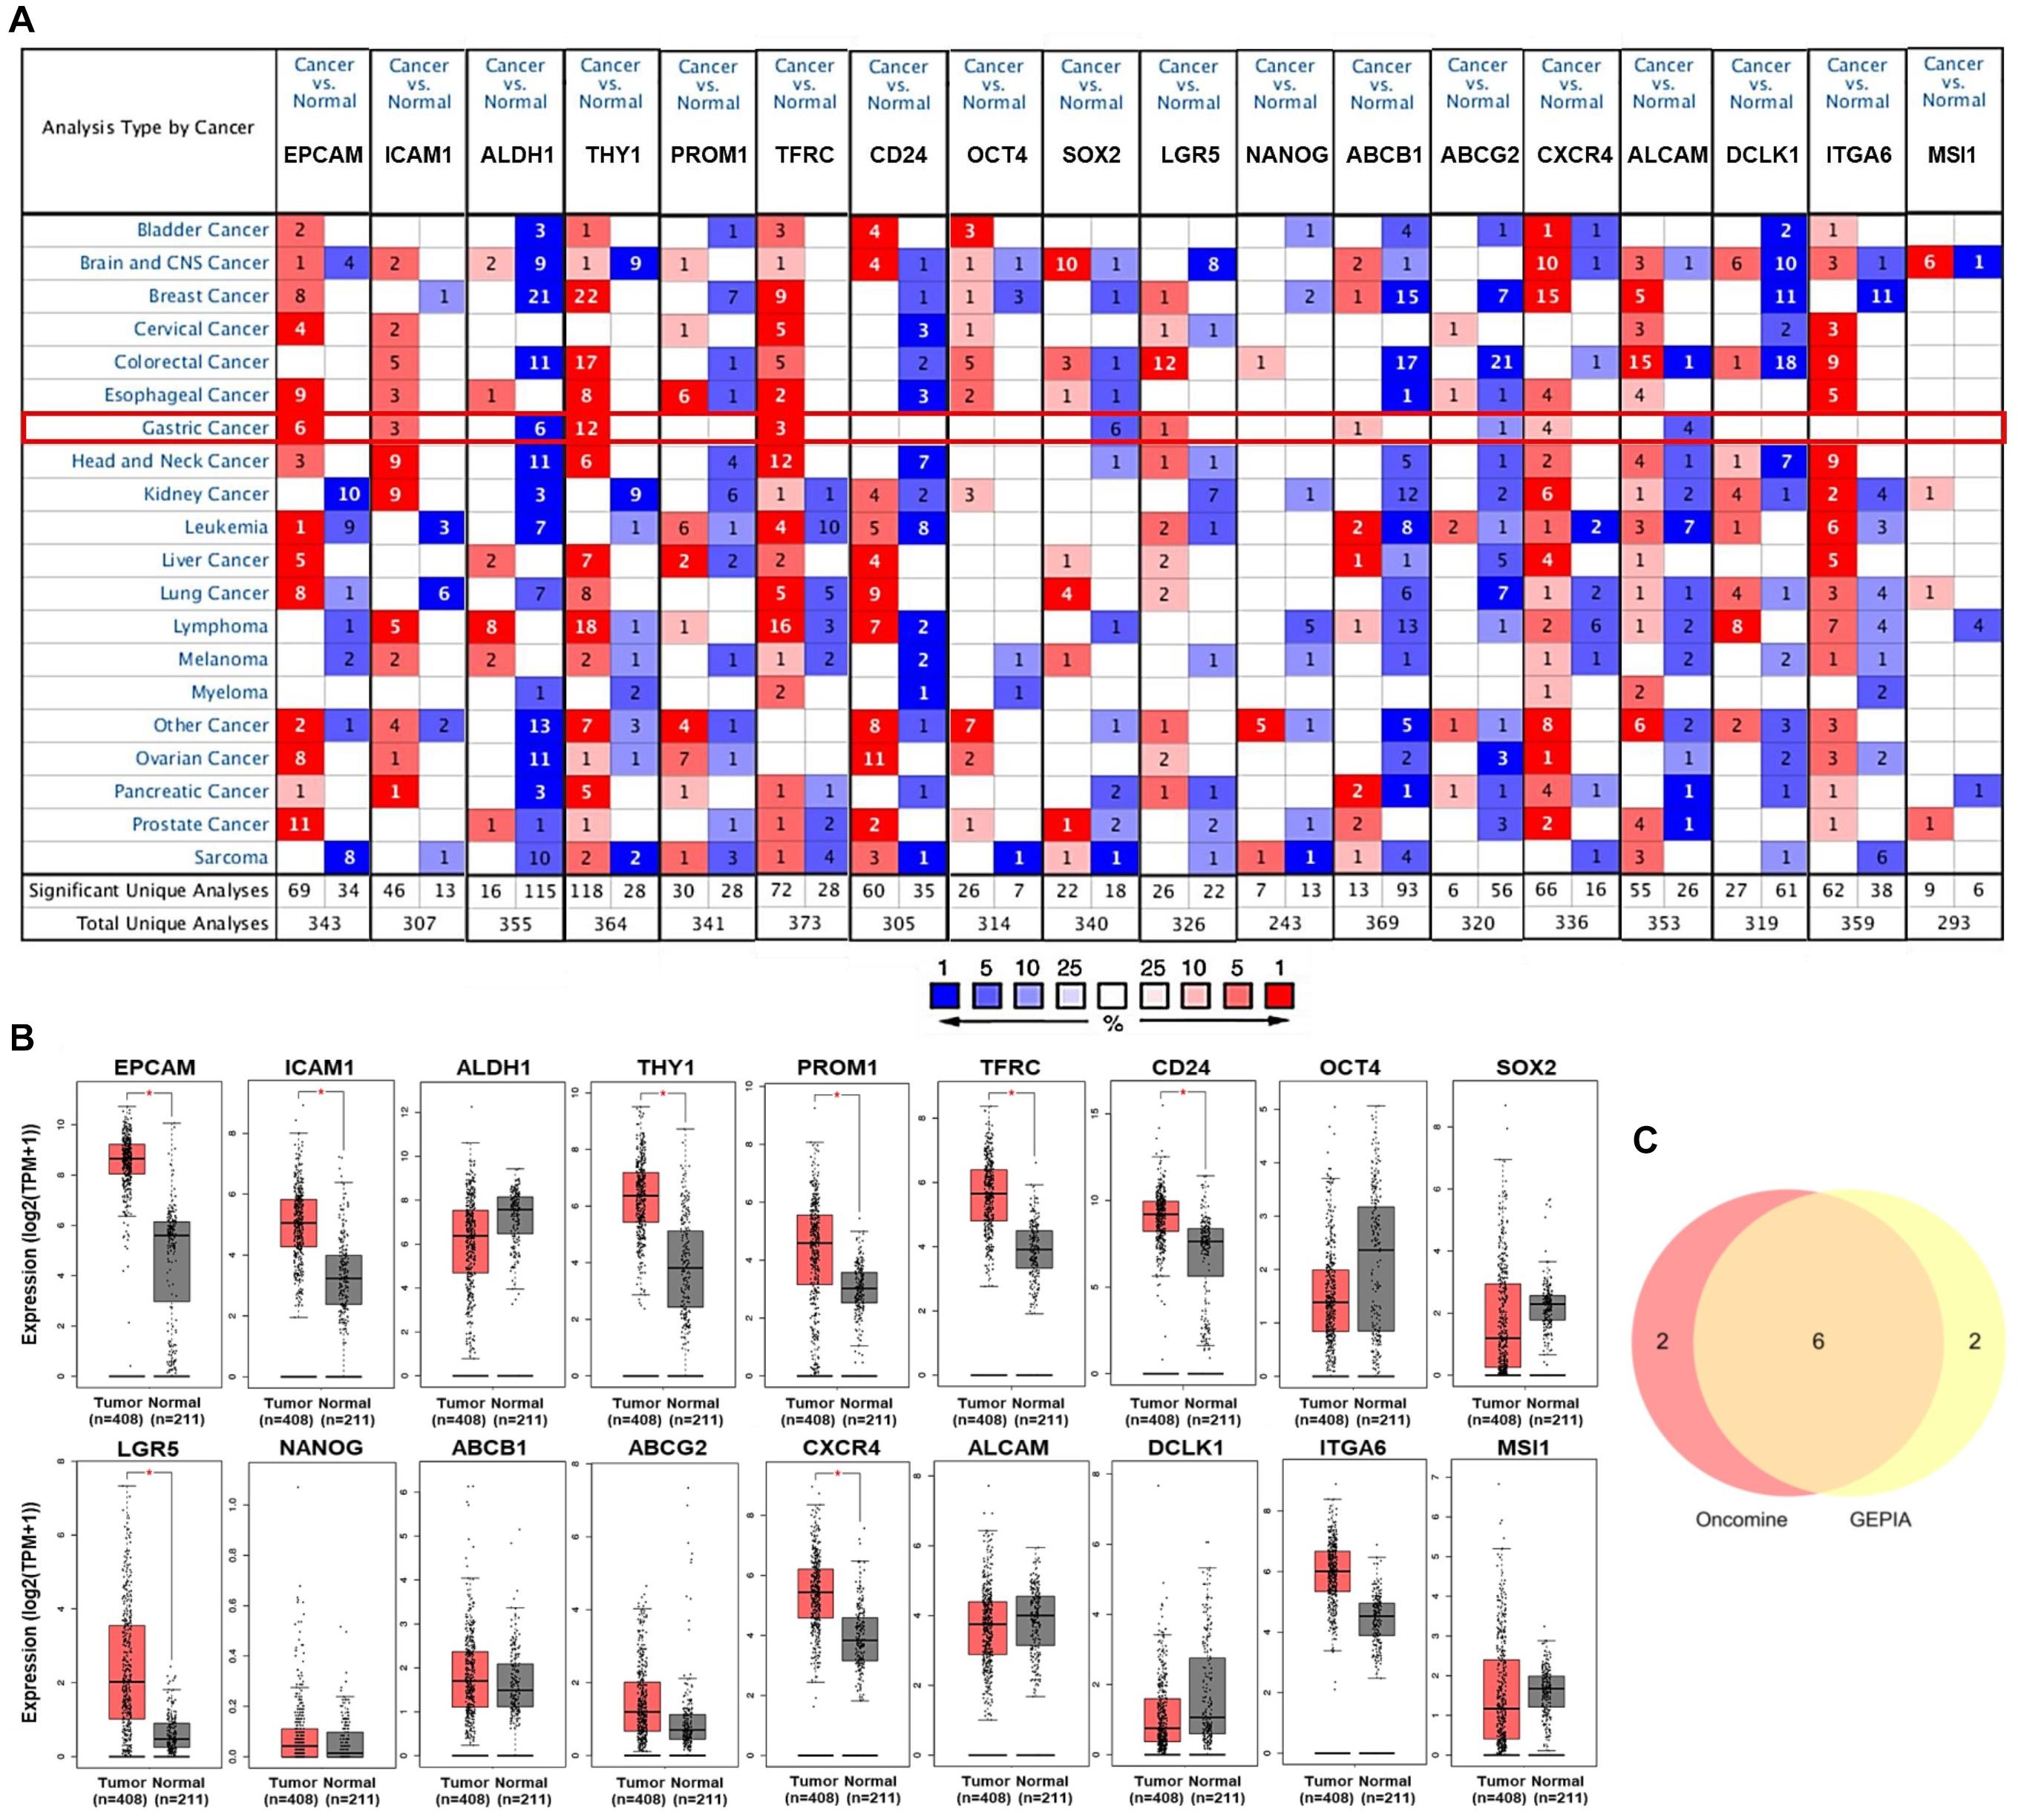
Figure 1. Transcriptional expression of GCSC markers in GC and normal stomach tissues. (A) A summary of the datasets in which GCSC markers were significantly up- (red) or down- (blue) expressed in various cancers, compared with the corresponding normal tissues (Oncomine). Numbers in colored cells represent the counts of datasets. The color depth is paralleled with the median rank of a gene across all the included datasets. (B) Transcriptional expression of GCSC markers in GC and normal stomach tissues (GEPIA). TPM, transcript per million; *P < 0.01. (C) A Venn diagram identified six highly expressed GCSC markers overlapped between Oncomine and GEPIA databases.
Expression of GCSC Markers in GC Patients With Distinct Clinicopathological Features
Subsequently, the associations of expression of EPCAM, ICAM1, THY1, TFRC, LGR5, and CXCR4 with clinicopathological characteristics in GC patients were investigated using UALCAN and LinkedOmics platforms. The expression of the six GCSC markers showed no significant difference in GC patients with distinct genders. In terms of age, EPCAM and TFRC were up-expressed, whereas CXCR4 was down-expressed in senile (61–100 years old) patients, compared with that in middle-aged (41–60 years old) patients (P < 0.05) (Table 1). Generally, the six GCSC markers were significantly elevated in GC samples with diverse pathological stages and histological grades, compared with normal stomach samples (P < 0.05). In particular, ICAM1, THY1, and CXCR4 were higher expressed in GC patients in Stage II–IV, compared with that in Stage-I patients (P < 0.01) (Figure 2A); and they were expressed higher in Grade-3 tumors than that in Grade-2 tumors (P < 0.01) (Figure 2B). In contrast, a declining trend of EPCAM expression was observed in patients in advanced stages (Stage II–IV), compared with that in Stage-I patients. Besides, the expression of EPCAM, TFRC, and LGR5 was higher in Grade-2 tumors, compared with that in Grade-3 tumors (P < 0.05) (Figures 2A,B and Supplementary Table 2).
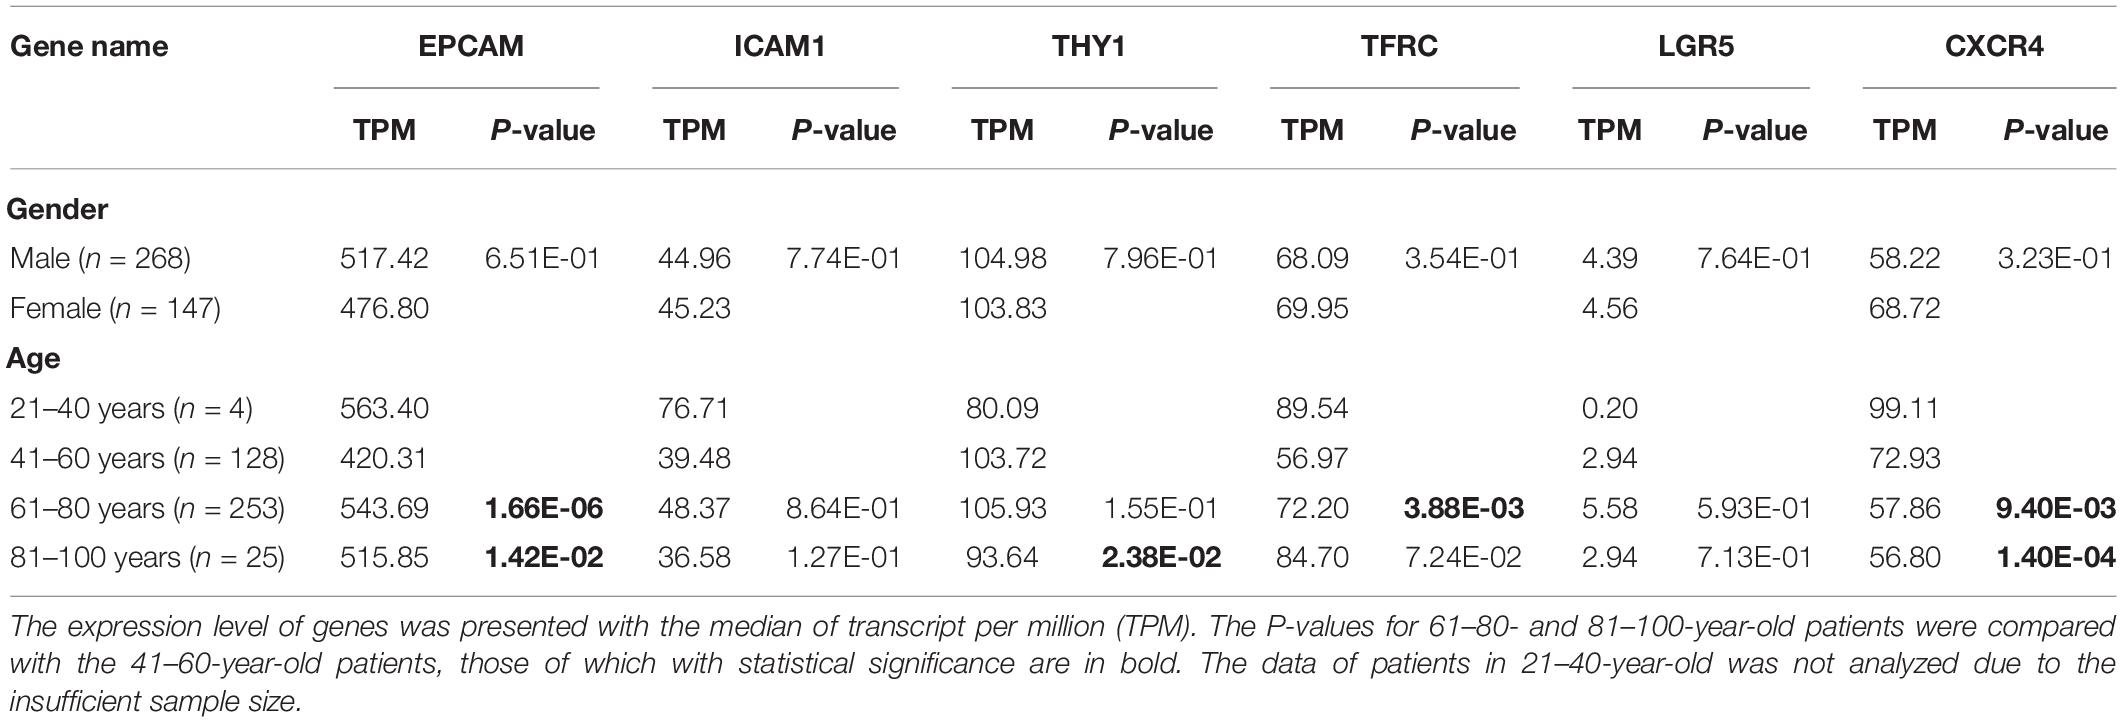
Table 1. Expression of GCSC markers in GC patients with distinct genders and ages (UALCAN).
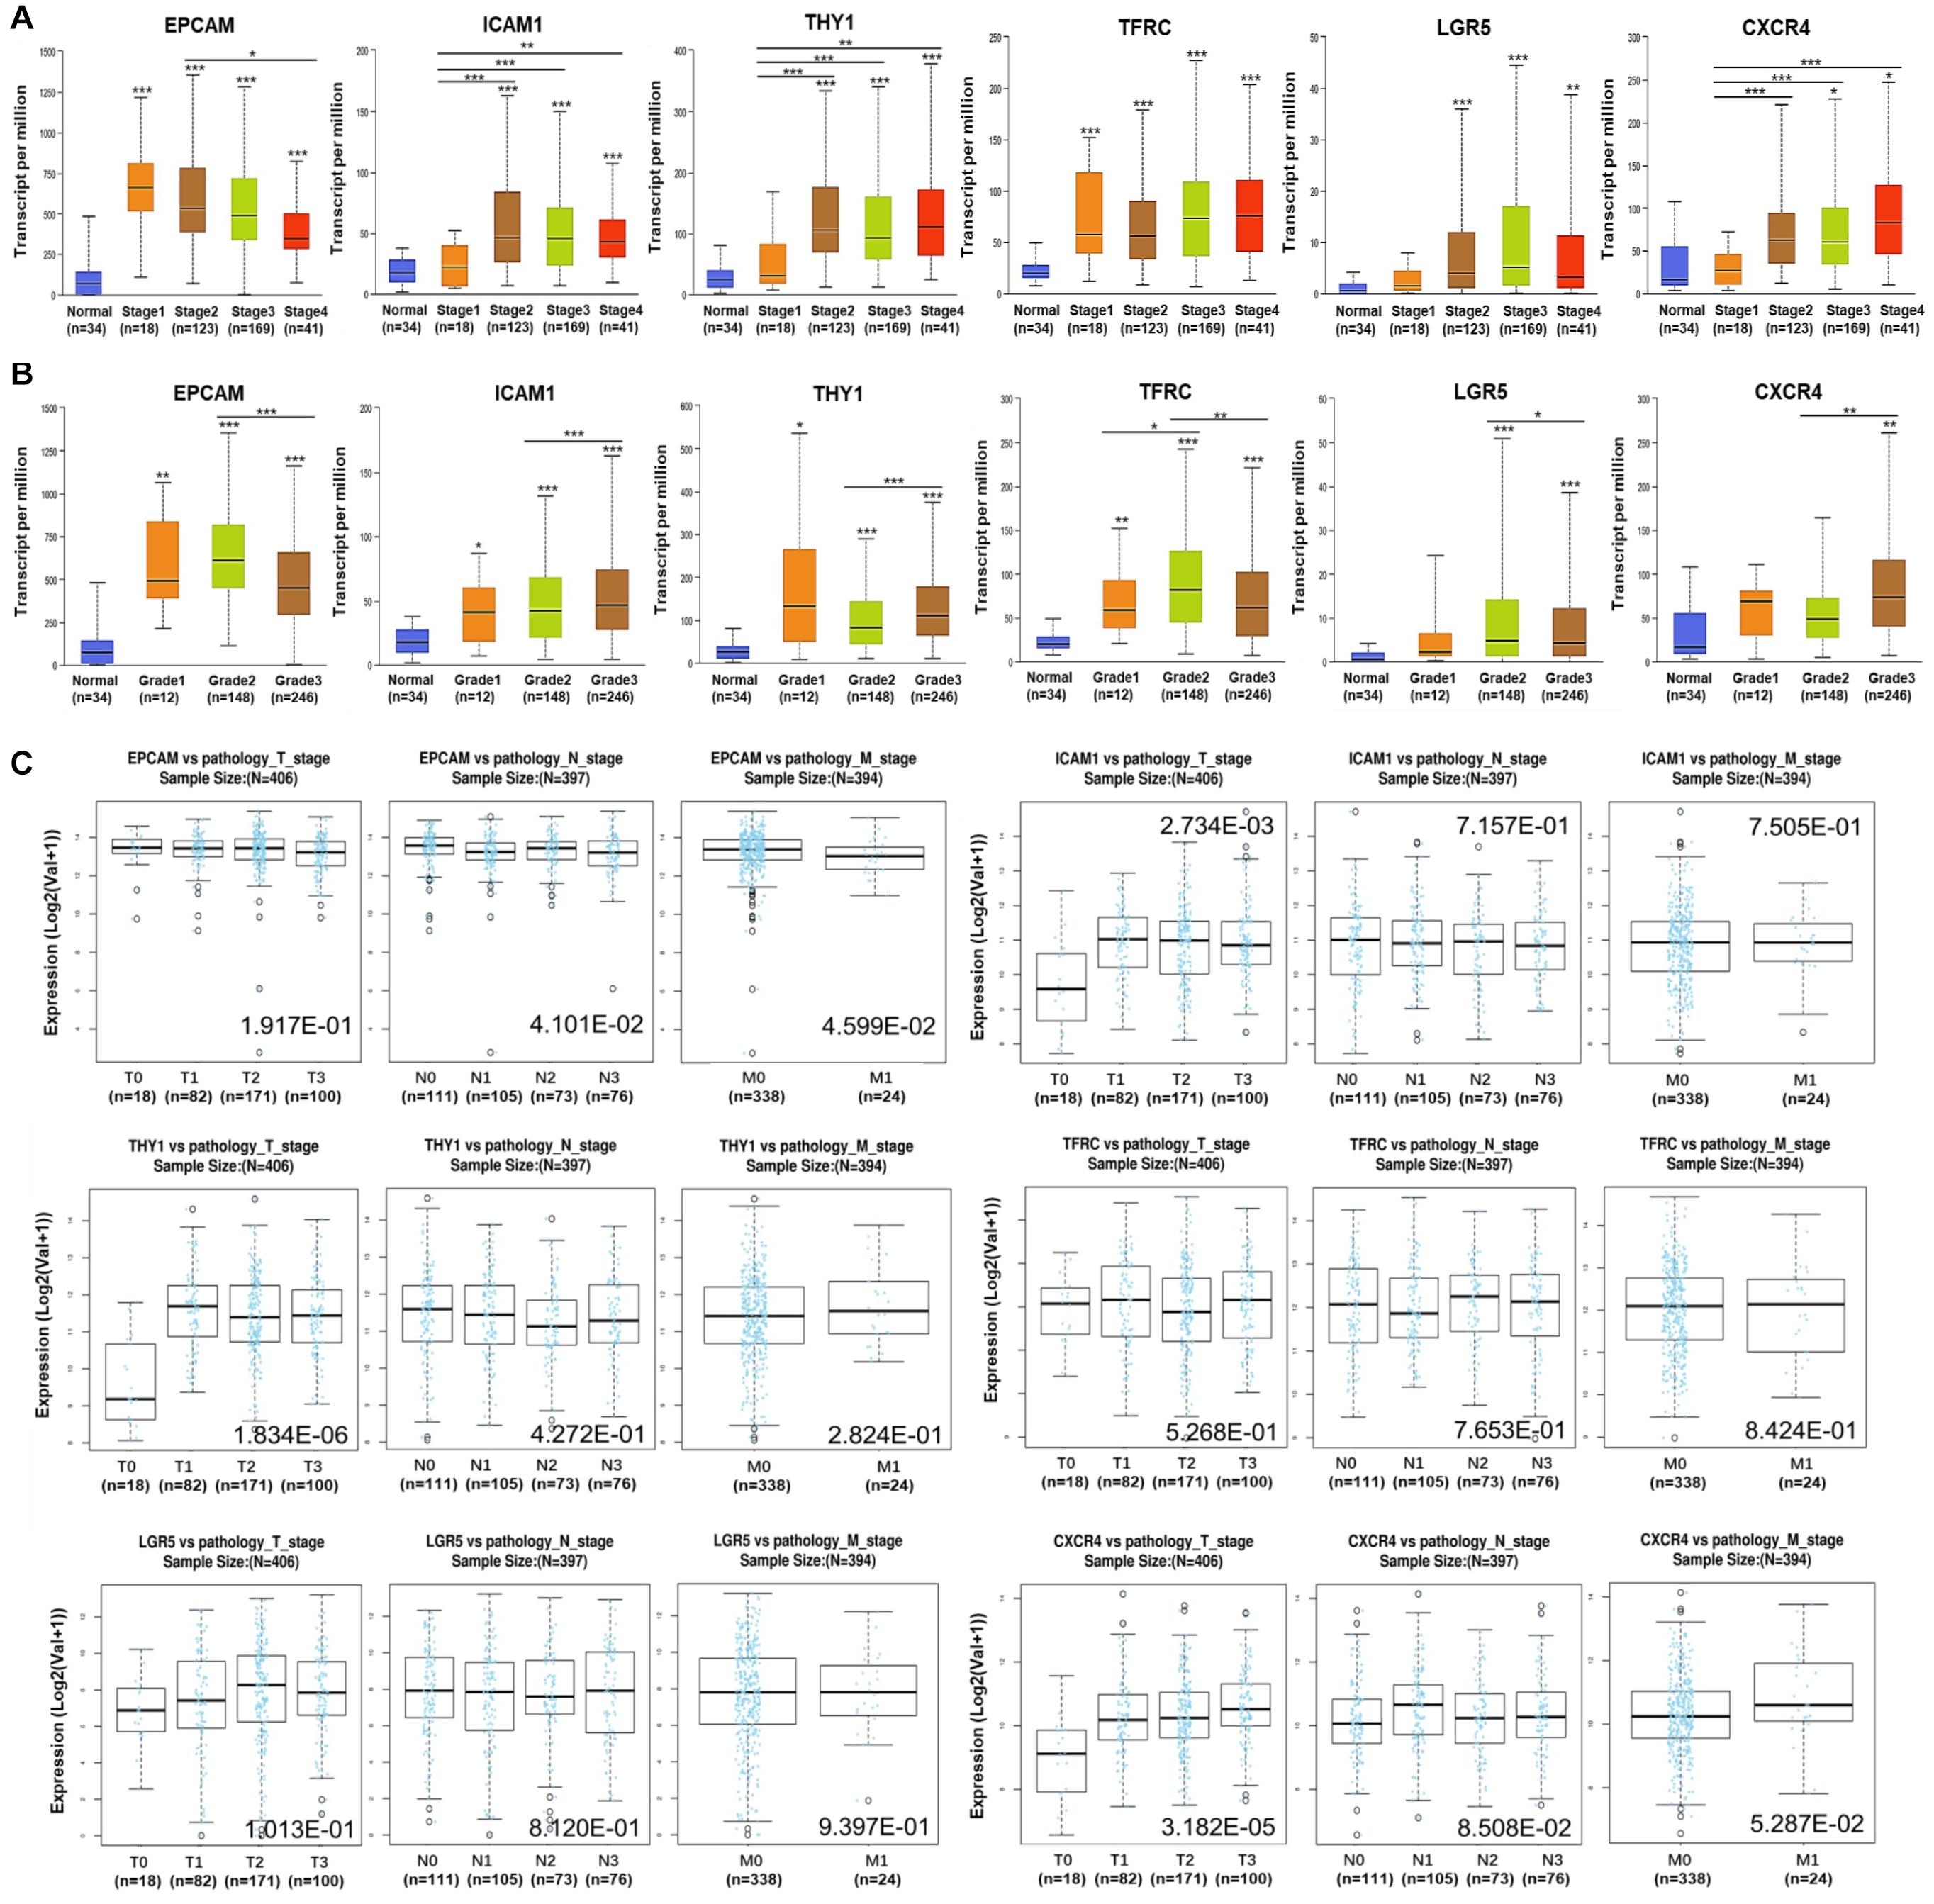
Figure 2. Expression of GCSC markers in GC patients with distinct clinicopathological parameters. Expression of GCSC markers in GC patients with diverse (A) pathological stages, (B) tumor grades, and (C) pathological TNM stages. The box plots and P-values in graphs A and B were from UALCAN, while those in graph C were from LinkedOmics; *P < 0.05, **P < 0.01, ***P < 0.001.
Moreover, the results from LinkedOmics showed elevated expression of ICAM1 (P = 2.73E-03), THY1 (P = 1.83E-06), and CXCR4 (P = 3.18E-05) were significantly associated with advanced T stages (Figure 2C). Overexpression of EPCAM was linked with favorable N stages (P = 4.101E-02) and M stage (P = 4.60E-02). No significant finding of TFRC and LGR5 was identified here. All the above illustrated that the overexpression of ICAM1, THY1, and CXCR4 significantly implied adverse outcomes, whereas EPCAM implied more optimistic clinicopathological characteristics of GC patients.
Alternations and Protein Expression of GCSC Markers in GC
Alternations of the GCSC markers in GC patients were analyzed using cBioPortal. In general, seven types of alternations, including missense mutation, truncating mutation, amplification, deep deletion, mRNA overexpression, protein high-expression, and protein low-expression of the GCSC markers were observed in a total of 174 out of 478 (36%) of GC samples; and mRNA overexpression occurred the most frequently. EPCAM, ICAM1, THY1, TFRC, LGR5, and CXCR4 were altered in 31 (6.5%), 23 (4.8%), 23 (4.8%), 60 (12.6%), 50 (10.5%), and 17 (3.6%) of all samples, respectively (Figures 3A,B).
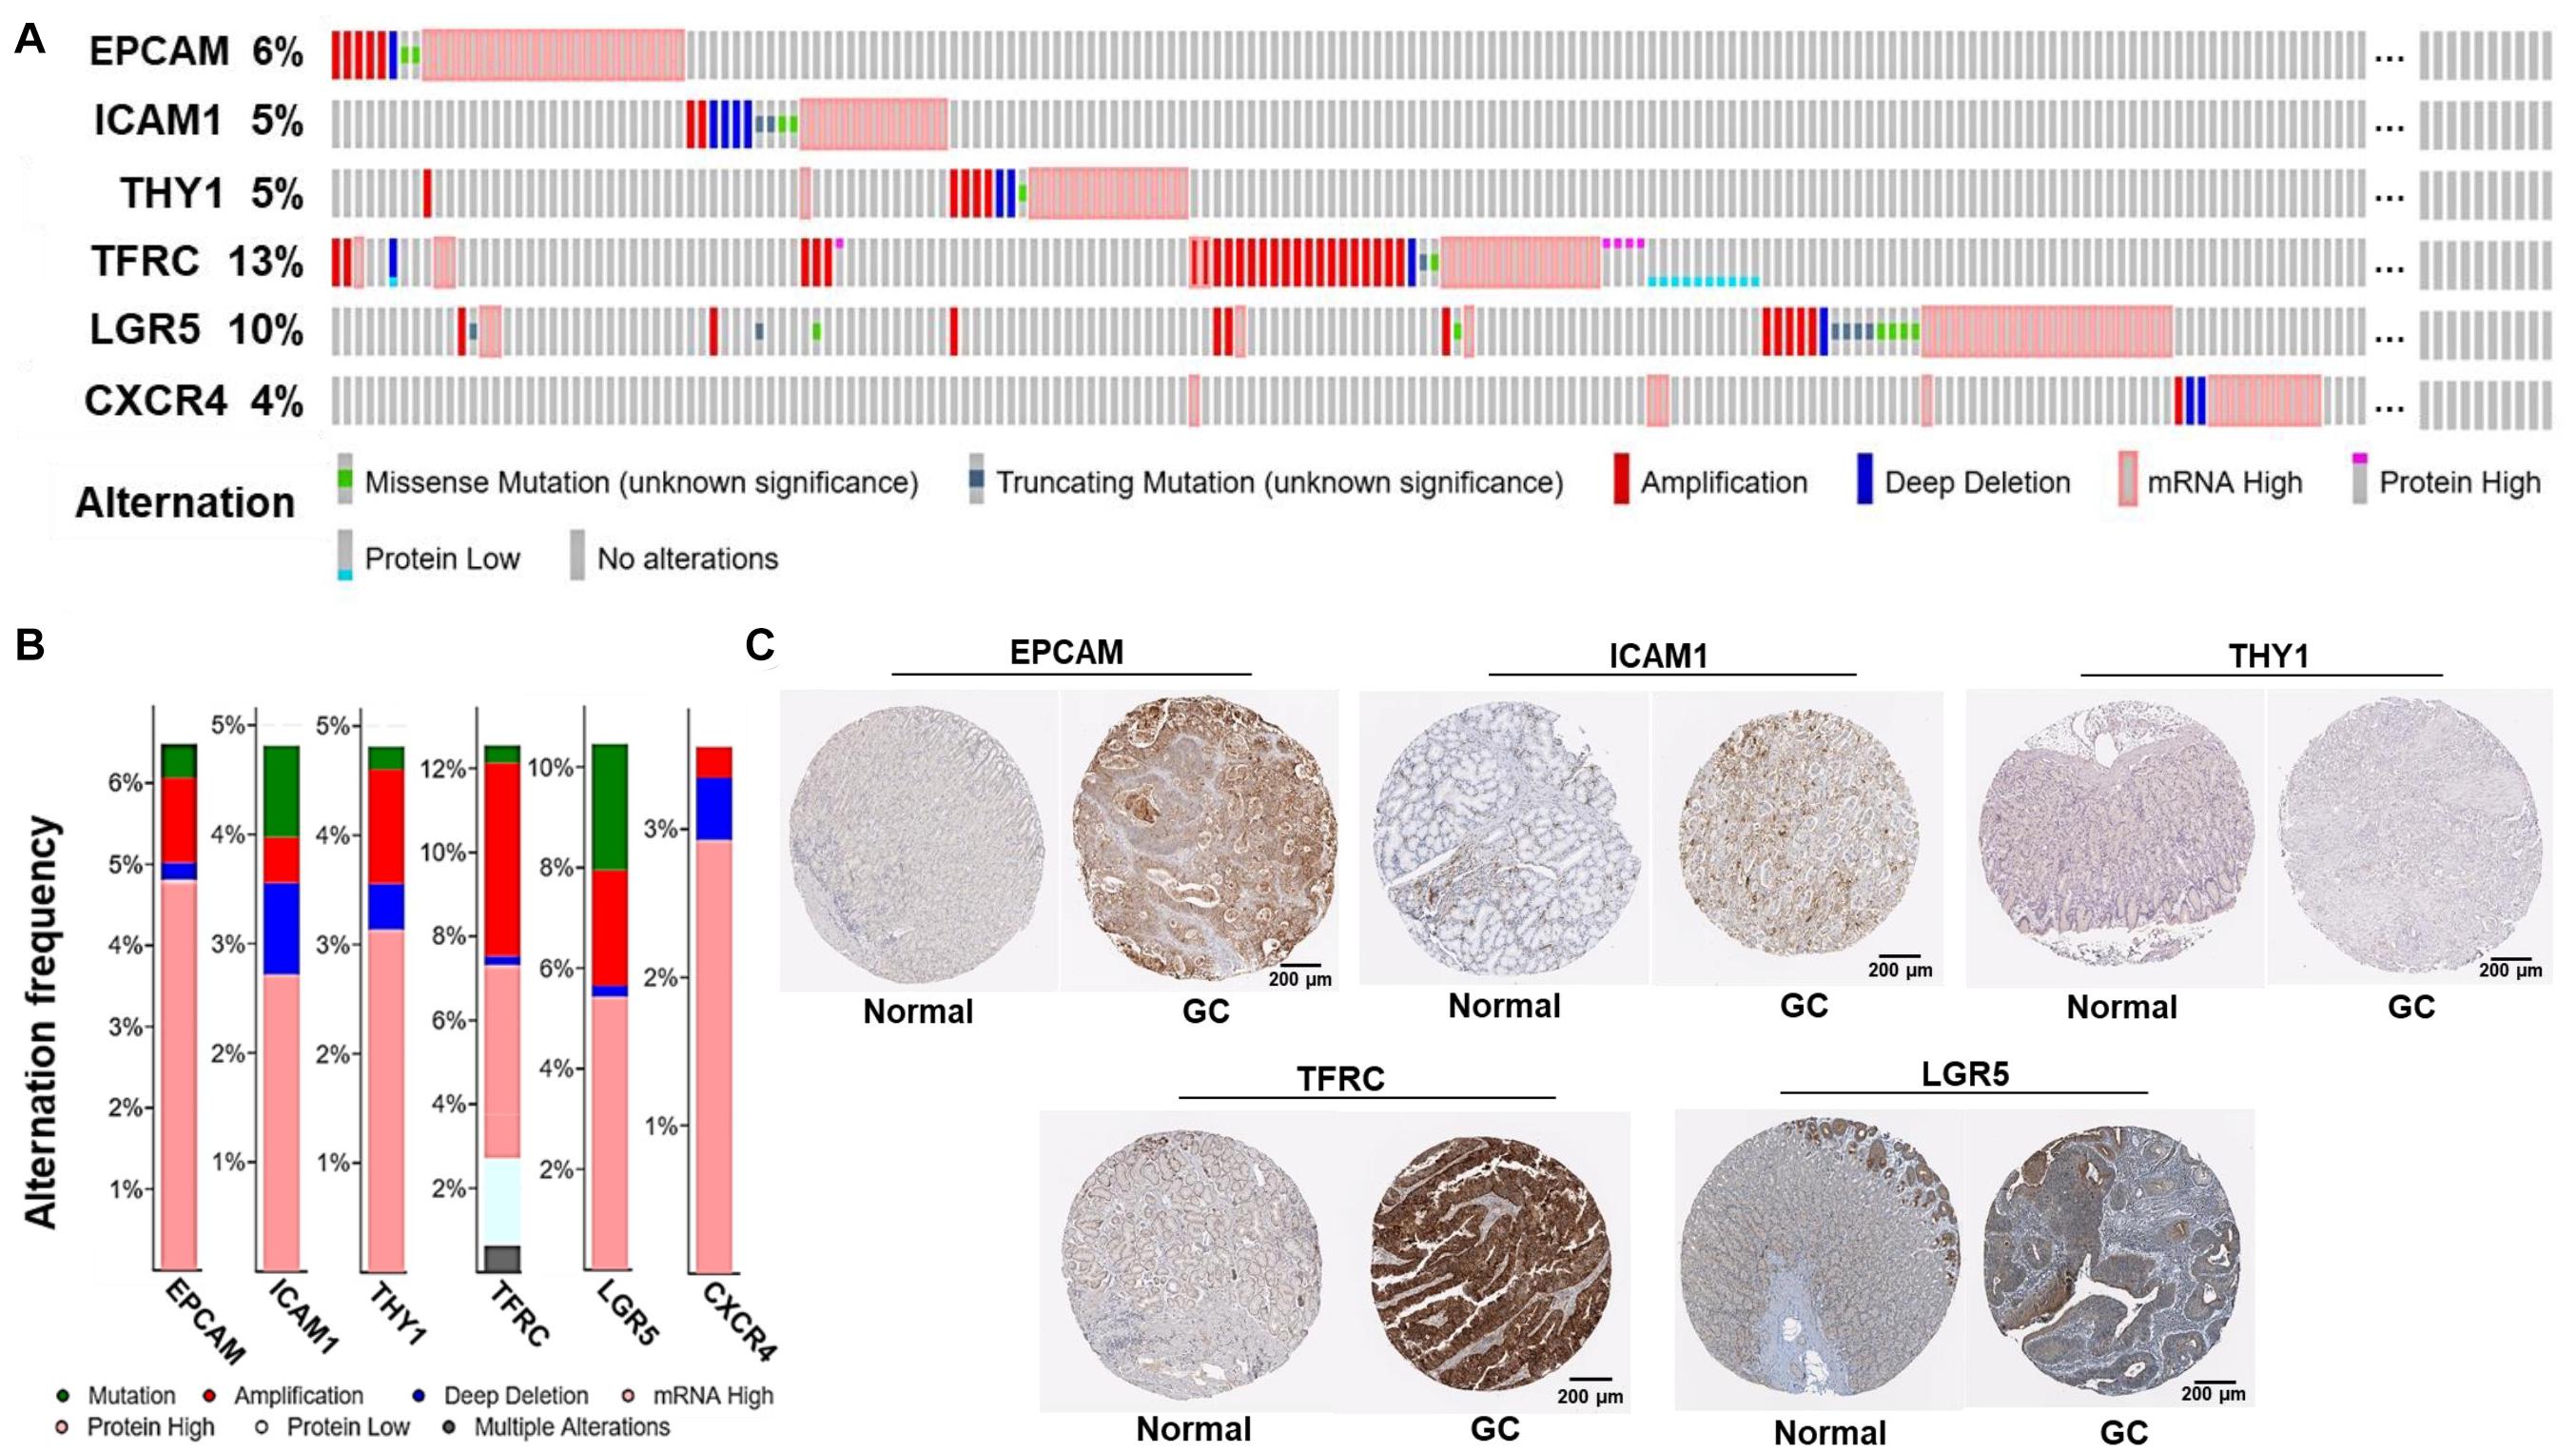
Figure 3. Alternations and protein expression of GCSC markers in GC. (A) An overview of the genomic and proteomic alternations of GCSC markers in GC samples from “TCGA, Firehose Legacy” dataset (cBioPortal). (B) A summary graph of the alternation frequency of GCSC markers in GC samples (cBioPortal). (C) The intensity of IHC staining of GCSC markers in normal stomach and GC tissues (the HPA database). The antibodies for EPCAM, ICAM1, THY1, TFRC, and LGR5 were CAB030012, HPA004877, CAB068244, HPA028598, and HPA012530, respectively. The IHC data of CXCR4 was still in preparation.
Following this, the expression of GCSC marker protein in normal stomach and GC tissues was verified using IHC data from the HPA database, except for CXCR4, whose data was still in preparation. As exhibited in Figure 3C, EPCAM, ICAM1, THY1, TFRC, and LGR5 proteins were strongly, moderately, negatively, strongly, and moderately expressed in GC tissues; which were weakly, negatively, weakly, moderately, and moderately expressed in normal stomach tissues, respectively. In a word, EPCAM, ICAM1, and TFRC proteins were expressed higher in GC than normal stomach tissues, while THY1 and LGR5 proteins were expressed at similar levels in two kinds of tissues.
Prognostic Significance of GCSC Markers in GC Patients
Wondering whether the expression of GCSC markers affects GC patients’ prognosis, survival analysis was performed using KM Plotter. As shown in Figure 4A, GC patients with high expression of EPCAM (OS: HR = 0.69, P = 0.024; RFS: HR = 0.41, P = 0.012) and TFRC (OS: HR = 0.71, P = 0.043; RFS: HR = 0.4, P = 0.0067) had both better OS and RFS. Nevertheless, high expression of CXCR4 (OS: HR = 1.64, P = 0.0032) was associated with worse survival of GC patients. No significant prognostic indication was found for ICAM1, THY1, and LGR5.
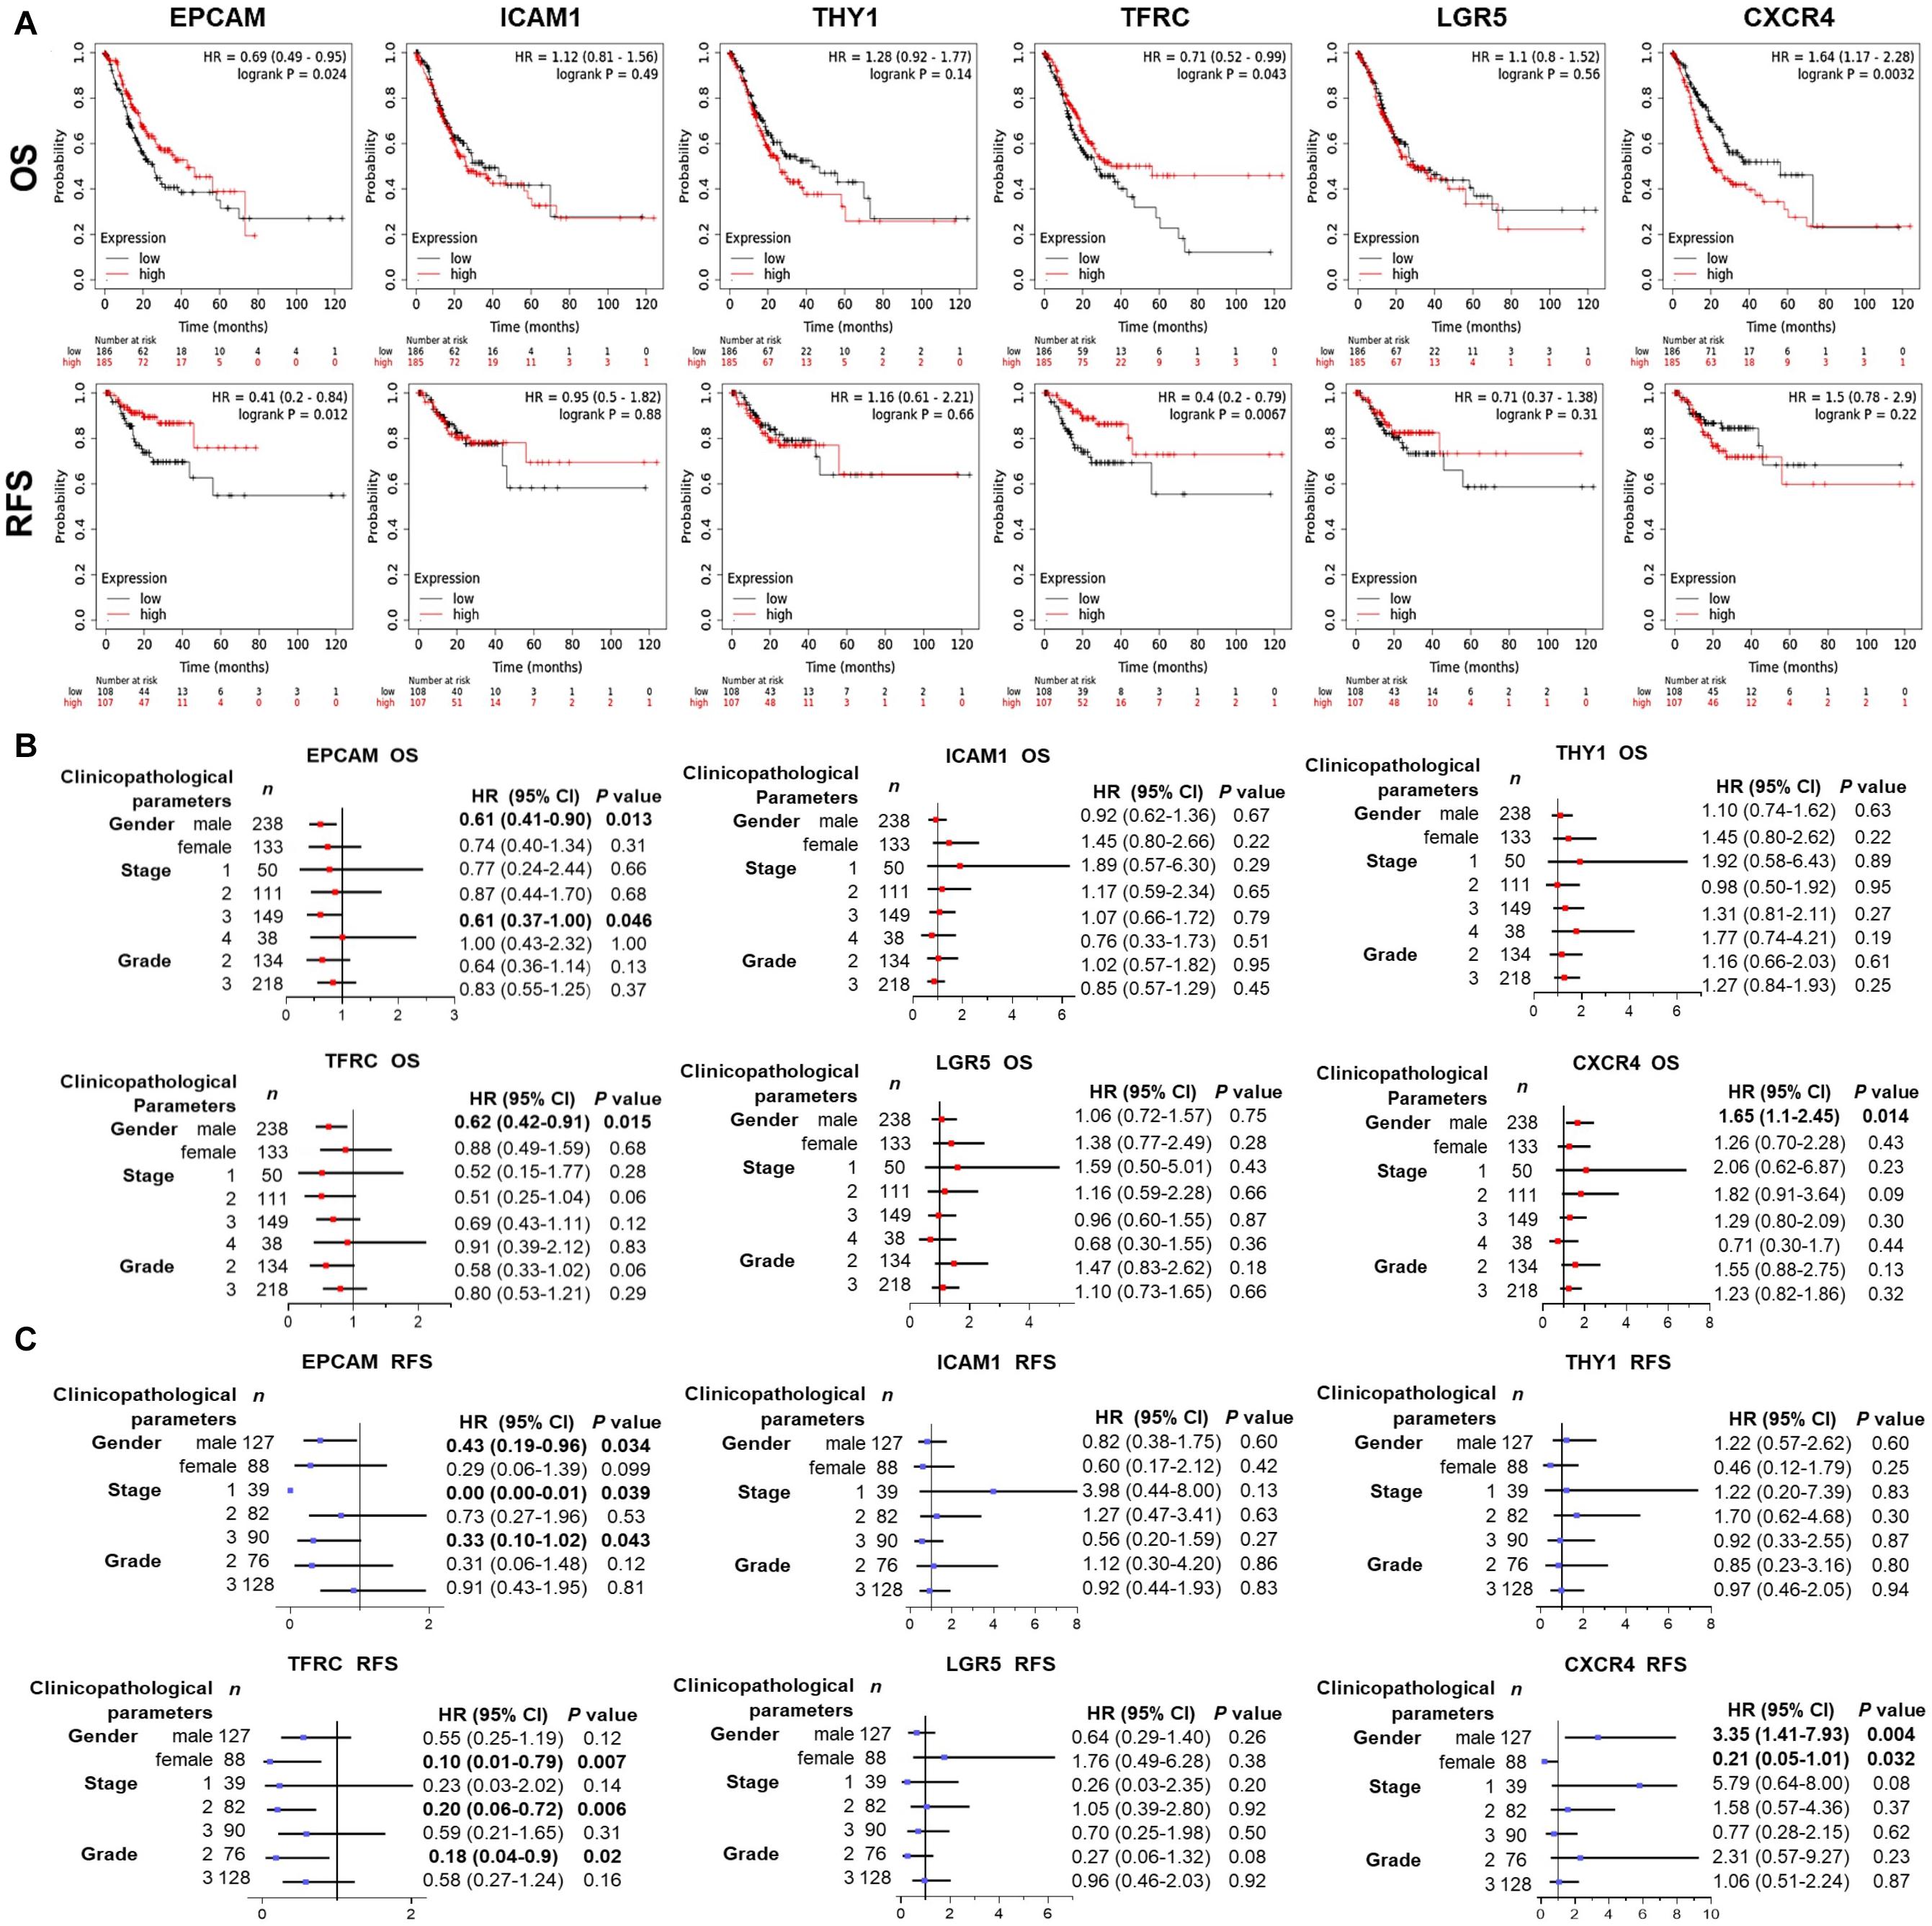
Figure 4. Prognostic significance of GCSC markers in GC patients (KM Plotter). (A) The survival curves show the associations between the expression of GCSC markers with OS and RFS of all GC patients. Forest plots show the associations between the expression of GCSC markers with (B) OS and (C) RFS of GC patients with different clinicopathological parameters. P-values with statistical significance are in bold. OS, overall survival; RFS, relapse free survival; HR, hazard ratio; CI, confidence interval.
Since the outcomes of cancer patients differ greatly with the clinical parameters, we further assessed the prognostic value of GCSC markers in GC patients with distinct clinicopathological statuses. Concisely, EPCAM upregulation indicated both favorable OS and RFS of male GC patients and patients in advanced stage (Stage III) (P < 0.05). High-expression of TFRC was associated with better OS of male GC patients, and better RFS of GC patients in Stage II, patients with Grade 2 tumors, as well as females (P < 0.05). Overexpression of CXCR4 was correlated with both unfavorable OS and RFS of male patients; paradoxically, it implied better RFS of female patients (P < 0.05). Besides, no prognostic significance of ICAM1, THY1, and LGR5 was found in this part (Figures 4B,C). Taken together, the findings suggested that up-expressed EPCAM and TFRC might serve as favorable prognostic indicators, while CXCR4 might be an unfavorable one for GC patients.
Correlations Between Expression of GCSCs Markers and Immune Infiltration in GC
Subsequently, correlations between expression of GCSC markers and immune infiltration in GC were investigated by TIMER server. Tumor purity is defined as the proportion of cancer cells in tumor admixture, which can influence the evaluation of immune infiltration. In this study, all the correlation analyses about immune infiltration had been adjusted with the corresponding tumor purity (Aran et al., 2015). It turned out that the expression of EPCAM (P = 2.31E-02) was positively, while ICAM1 (P = 8.02E-05), THY1 (P = 1.95E-04), and CXCR4 (P = 6.38E-05) were negatively correlated to the tumor purity (Figure 5A), suggesting the expression of EPCAM might be mainly from cancer cells, while the latter three genes might be from the cells in the TME.
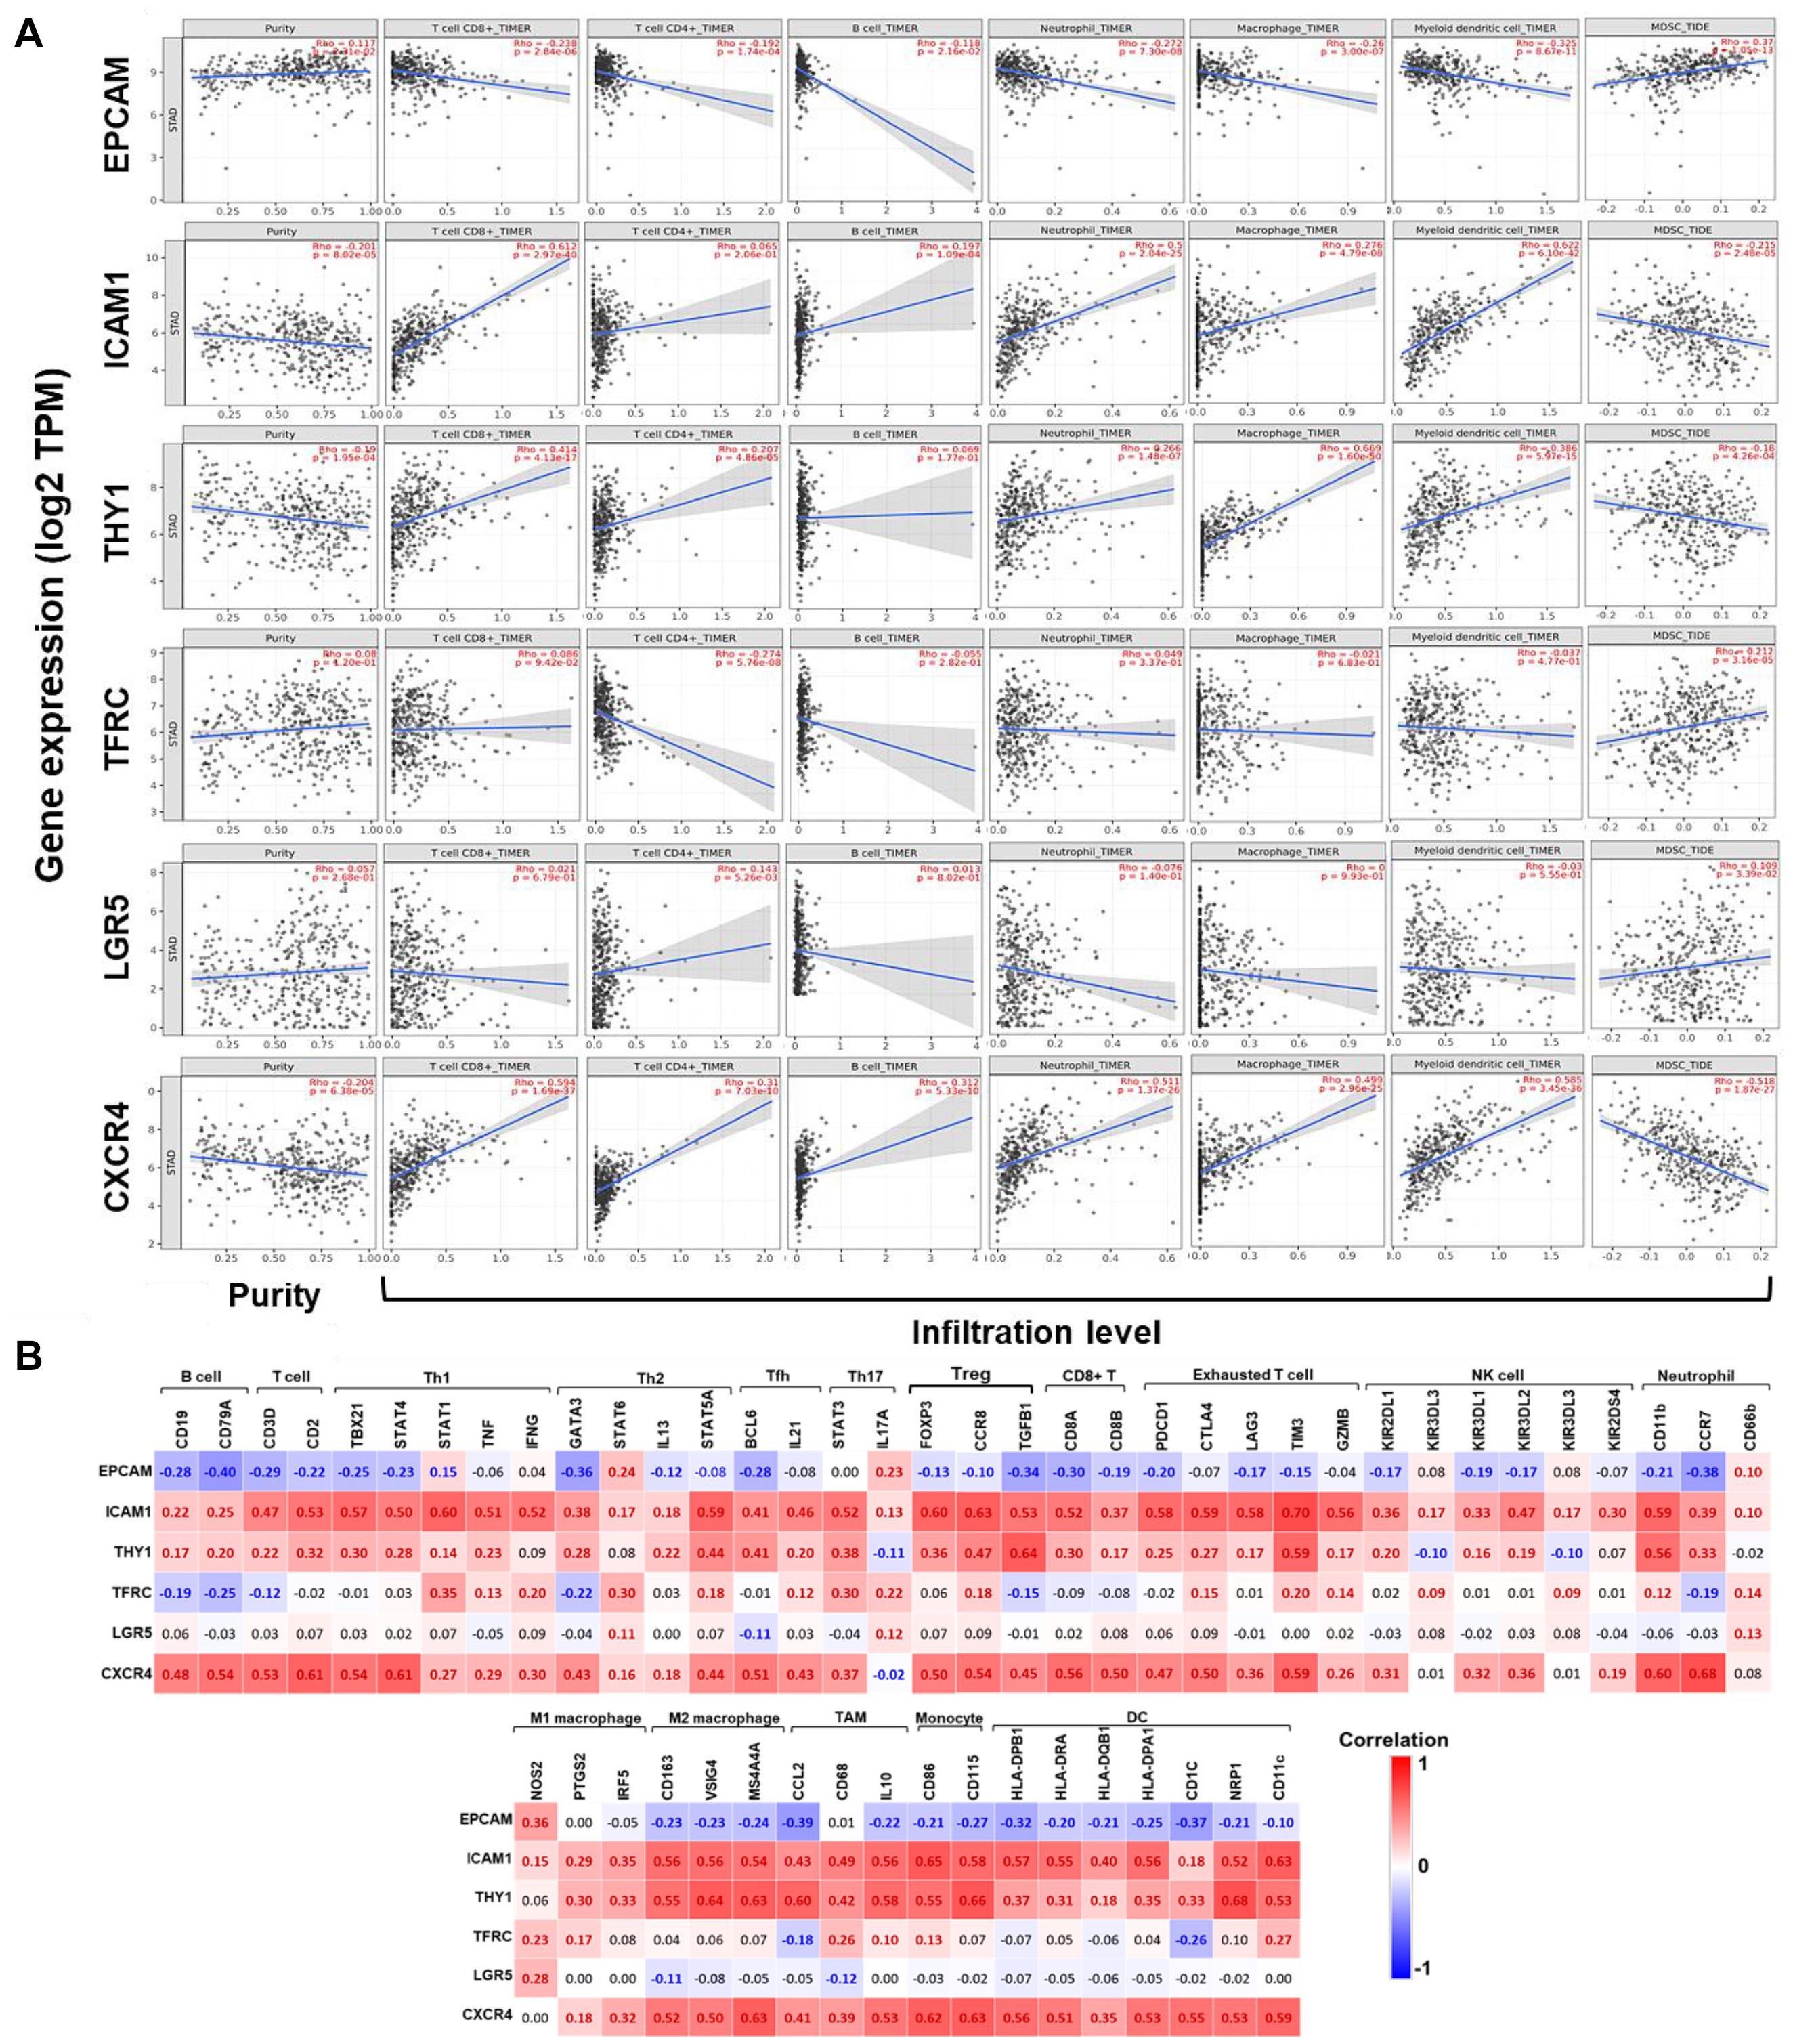
Figure 5. Correlations between the expression of GCSC markers with immune infiltration in GC. (A) Correlations between expression of GCSC markers with tumor purity, and infiltration level of CD8+ T cells, CD4+ T cells, B cells, neutrophils, macrophages, DCs, and MDSCs in GC (TIMER). (B) Heatmaps show correlations between the expression of GCSC markers with biomarkers of TIICs in GC. Correlation coefficients with statistical significance are in bold, red or blue color represents positive or negative correlation, respectively. TAM, tumor-associated macrophage; Th, helper T cell; Tfh, follicular helper T cell; Treg, regulatory T cell; NK, natural killer cell; DC, dendritic cell; MDSC, myeloid-derived suppressor cell.
The expression of ICAM1, THY1, and CXCR4 were conformably positively correlated with the infiltration level of CD8+ T cells, CD4+ T cells, B cells, neutrophils, macrophages, and DCs (except for ICAM1 with CD4+ T cells and THY1 with B cells), but negatively correlated with that of MDSCs (P < 1.10E-04). Interestingly, the correlations between EPCAM expression and the infiltration of these TIICs was in an opposite way of ICAM1, THY1, and CXCR4 (P < 0.05). Furthermore, the expressions of TFRC (P = 3.16E-05) and LGR5 (P = 3.39E-02) were both positively correlated with the infiltration of MDSCs; but TFRC was negatively, while LGR5 was positively correlated with the infiltration of CD4+ T cells (P < 0.01). Notably, the correlation strength of ICAM1 expression with infiltration of DCs (r = 0.622, P = 6.10E-42) and CD8+ T cells (r = 0.612, P = 2.97E-40), THY1 with macrophages (r = 0.669, P = 1.60E-50), also CXCR4 with DCs (r = 0.585, P = 3.45E-36) were strong.
Correlations Between the Expression of GCSCs Markers and Biomarkers of TIICs in GC
To further confirm the participation of TIICs, the correlations between the expression of GCSCs markers and biomarkers of TIICs in GC were analyzed using GEPIA. The biomarkers of all TIICs covered in the last step were investigated, along with monocytes, M1/M2 macrophages, subsets of T cells, including helper T cell (Th) 1, Th2, Th17, follicular helper T cell (Tfh), regulatory T cell (Tregs), and exhausted T cells. Consistent with the results from TIMER, the expression of ICAM1, THY1, and CXCR4 was positively, while EPCAM was negatively correlated with the expression of almost all biomarkers of B cells, T cells, neutrophils, macrophages, monocytes, and DCs (P < 0.05) (Figure 5B and Supplementary Table 3). Notably, the expression of ICAM1, THY1, and CXCR4 consistently displayed strongly positive correlations with the expression of signatures of M2 macrophages (CD163, VSIG4, and MS4A4A), monocytes (CD86 and CD115), Tregs (CCR8 and TGFB1), exhausted T cells (TIM3), neutrophils (CD11b), TAM (IL10), and DCs (NRP1 and CD11c) (P < 9.0E-30). Until now, we could summarize GCSC markers that might modulate immunity through extensive modulation of immune infiltrates in the TME of GC.
Functions of the Gene Interaction Networks of GCSC Markers
To understand the biological functions of these GCSC markers, a gene interaction network was constructed for each gene using GeneMANIA. Twenty interactive genes were identified for each GCSC marker gene; thus, a gene interaction network was composed of a total of 21 genes (Figures 6A–F). Subsequently, functional enrichment analysis was performed for all constituent genes in each network using DAVID platform. The five most significantly enriched or all GO-CC, GO-BP, and GO-MF terms were shown as bar plots. It was uncovered that the interactive genes of EPCAM, ICAM1, THY1, LGR5, and CXCR4 were all components of the external cell membrane. Beyond that, EPCAM’s interactive genes participated in the maintenance of cell polarity, negative regulation of DNA damage response, protein transport, and positive regulation of apoptosis (Figure 6A). ICAM1’s and THY1’s interactive genes were both responsible for cell adhesion, and ICAM1’s interactive genes also partook in the cellular response to interleukin-1 (IL-1) and binding of RNA polymerase II and integrin (Figures 6B,C). TFRC’s interactive genes were components of transferrin receptor complex and majored in iron ion homeostasis (Figure 6D). LGR5’s interactive genes were involved with cellular ions homeostasis (Figure 6E), while CXCR4’s interactive genes regulated chemokine-mediated inflammatory response and G-protein coupled receptor kinase activity (Figure 6F).
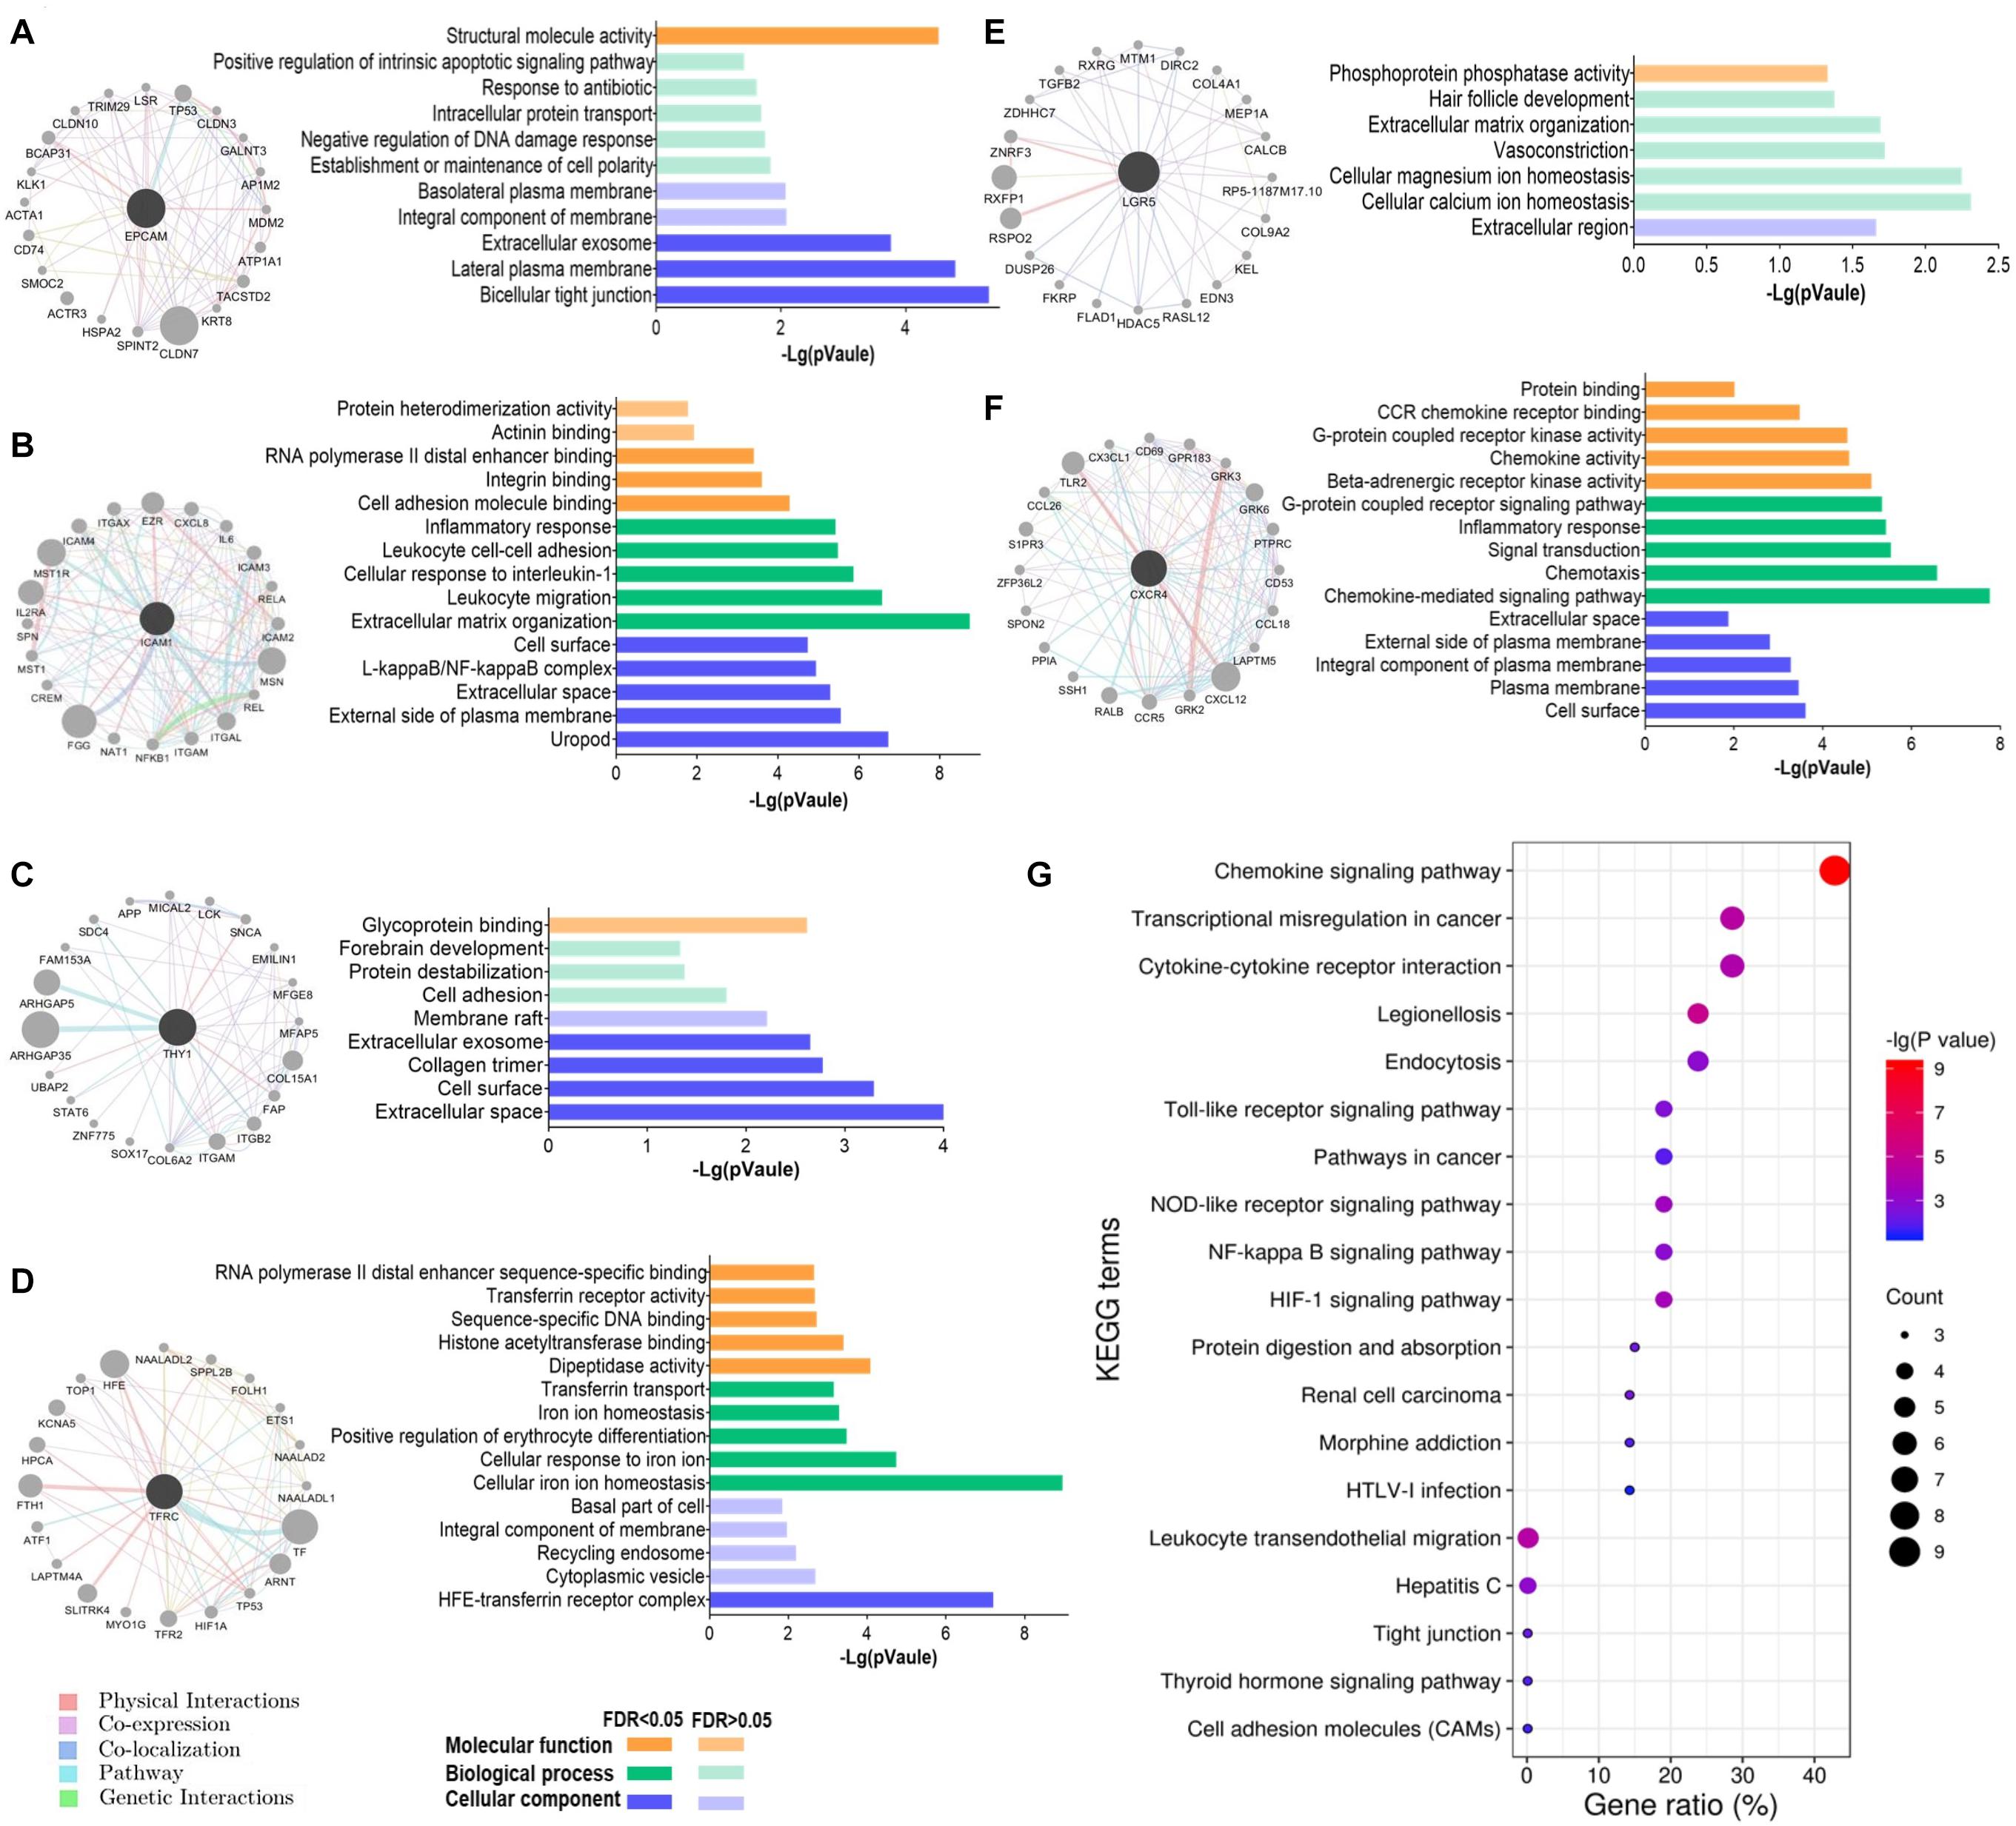
Figure 6. Functions of the interactive genes of GCSC markers. The gene interaction network and its GO functional annotation of (A) EPCAM, (B) ICAM1, (C) THY1, (D) TFRC, (E) LGR5, and (F) CXCR4. Distinct colors of the edges in gene interaction networks represent distinct interactions, including physical interactions, co-expression, co-localization, pathway, and genetic interactions (GeneMANIA). (G) All the significantly enriched KEGG pathway terms of the six gene interaction networks are shown. The size of a bubble indicates the number of genes enriched for a pathway term; a redder color of a bubble represents a greater significance of the corresponding term.
Furthermore, all the significantly enriched KEGG pathway terms of the total six gene interaction networks were presented in Figure 6G, which expounded that they were related to the processes of transcriptional disorder in cancer, cytokine-cytokine receptor interaction, cell adhesion, etc. Specifically, signaling pathways of chemokine, Toll-like receptor, cancer, nucleotide-binding oligomerization domain (NOD)-like receptor, nuclear factor (NF)-kappa B, and hypoxia inducible factor-1 (HIF-1) were involved.
Discussion
Despite dramatic progress in diagnosis and treatment, the prognosis of GC patients remains poor, primarily blamed on the frequent treatment resistance, following relapse and metastasis. The CSCs are believed to contribute to the inefficacy of conventional therapies, for their quiescent nature, capabilities of anti-apoptosis, DNA damage repair, and diminished uptake and/or enhanced efflux of drugs (Zhao, 2015). In this scenario, eliminating CSCs should be an effective strategy to eradicate cancer, otherwise, recurrence might be unavoidable (Sainz et al., 2016). Up to date, most studies were conducted in cell lines or mice, reports describing roles of GCSC markers in GC patients were limited (Fu et al., 2018). In this study, the ever-reported GCSC markers were comprehensively analyzed in aspects of expression, alternations, prognostic significance, as well as their interactions with immune infiltration in GC patients.
From the start, six GCSC markers, EPCAM, ICAM1, THY1, TFRC, LGR5, and CXCR4 were identified significantly high-expressed and frequently altered in GC, compared with normal stomach samples. Among them, we that found upregulation of ICAM1, THY1, and CXCR4 was associated with pathological and histological advancement of GC patients, but only CXCR4 showed unfavorable prognostic significance. Consistent with the previous studies, CXCR4 had been widely reported as an unfavorable prognostic indicator of various cancers, including GC. CXCR4 was elevated in GC and was closely associated with cancer progression and metastasis (Xiang et al., 2017; Jiang et al., 2019). Surprisingly, we found that CXCR4 over-expression indicated better RFS of female GC patients, which needs further explorations with larger sample sizes. ICAM1 was ever identified as an unfavorable prognostic biomarker in earlier studies (Jung et al., 2012; Chen et al., 2020). High THY1 expression was reported to relate with aggressive clinicopathological features of GC cases (Numakura et al., 2019), and the silencing of which would inhibit the malignant traits and enhance apoptosis of GC cells (Wu et al., 2019). However, we found that ICAM1 and THY1 had no prognostic significance.
The previous studies demonstrated that EPCAM overexpression was an independent unfavorable prognostic factor and was linked with larger tumor size and lymph node metastasis in GC patients (Chen et al., 2016; Dai et al., 2017). Unexpectedly, we found that EPCAM upregulation suggested more optimistic clinicopathological characteristics and outcomes of GC patients, even for the advanced-stage patients. In fact, the beneficial role of EPCAM in prognosis had been observed in ovarian cancer (Woopen et al., 2014) and pancreatic cancer (Meng et al., 2015) before. Besides, TFRC high-expression implied better histological differentiation status and favorable prognosis of GC patients. Our findings could be supported by an earlier study that TFRC—cells represented high tumorigenicity, multipotency, invasiveness, and treatment resistance (Ohkuma et al., 2012). Even though it was demonstrated that LGR5 overexpression might contribute to the progressive clinical features and poor OS of GC patients (Zheng et al., 2013; Chen et al., 2016; Huang et al., 2016), we had no similar findings in this study. To summarize, our findings highlighted that the up-expression of CXCR4 as unfavorable, whereas EPCAM and TFRC as favorable prognostic biomarkers of GC patients. Some findings inconsistent with the previous studies might lie in the intrinsic heterogeneity of cancer and different quantification methods. Therefore, more investigations with larger sample sizes are still required.
After that, we observed that the expression of GCSC markers was correlated with the infiltration and biomarkers expression of TIICs in the TME of GC. High expression of ICAM1, THY1, and CXCR4 was positively, while EPCAM was negatively correlated with the infiltration level and biomarkers expression of T cells, B cells, neutrophils, macrophages, and DCs. In particular, the expression of ICAM1, THY1, and CXCR4 exhibited strongly positive correlations with the biomarkers of M2 TAMs, TAM, monocytes, Tregs, and DCs. Furthermore, the expression of TFRC and LGR5 was positively, whereas ICAM1, THY1, and CXCR4 were negatively correlated with the infiltration of MDSCs.
It is acknowledged that CD8+ T cells are the main undertakers of anticancer immunity, a high infiltration level of which indicates better treatment response and prognosis (Liu et al., 2015; Solinas et al., 2017). On the contrary, TAMs, Tregs, and MDSCs are the major immunosuppressive constituents in the TME. TAMs can be polarized into M1- and M2- types (Solinas et al., 2017); M1 TAMs enhance immunity surveillance by producing proinflammatory cytokines; while M2 TAMs operate oppositely by producing anti-inflammatory cytokines (Gambardella et al., 2020). A high abundance of M2 TAMs was usually associated with worse OS in various cancers, including GC (Yin et al., 2017), and the conversion of M2- to M1- type might induce tumor regression (Hagemann et al., 2008). Additionally, emerging evidence indicated M2 TAMs could foster cancer stemness in various cancers (Raggi et al., 2016; Zhang et al., 2017). The increased number of Tregs, especially the FOXP3+ ones, has been applied as an independent risk factor of cancer relapse for their roles in immunity tolerance (Rezalotfi et al., 2019). In a recent study, co-culture with Tregs might increase LGR5 expression in GC cells, which conferred poor prognosis (Liu X. S. et al., 2019). Evidence proved that GCSCs could affect the balance of Th17/Treg, which was considered a promising diagnostic indicator of CSCs’ activation (Rezalotfi et al., 2019). MDSCs can dampen the proliferation and function of T cells via secreting inhibitory molecules or depriving their essential nutrient substances (Kumar et al., 2016). Furthermore, MDSCs can induce the generation of Tregs and TAMs to promote CSC properties synergistically (Ugel et al., 2015; Peng et al., 2016; Ruiu et al., 2019). DCs are antigen-presenting cells specialized in T cells trigger, however, subpopulations of DCs can act both immune- stimulatory and suppressive in cancer, depending on the secretion of inflammatory cytokines (Volovitz et al., 2016). A study announced that plasmacytoid DCs in peripheral blood and tumor tissue forecasted poor outcomes of GC patients (Liu X. et al., 2019). Whereas, another study indicated DCs loaded with mRNA of CSC-like cells from GC patients might stimulate effective immune responses (Bagheri et al., 2019). Hereto, we could conclude that GCSC markers would affect the clinicopathological features and even prognosis of GC patients by directly affecting cancer cells and modulating the immune microenvironment. We speculated that high-expression of ICAM1, THY1, and CXCR4 might incline to promote immunosuppression, whereas EPCAM and TFRC tended to enhance immunity surveillance. The interplay between CSCs and the immune microenvironment is a promising breakthrough point for cancer therapy. Targeting CSCs can curtail cancer aggressiveness, and it is an attractive strategy to adjust anticancer immunity at the same time.
At last, the results of GO functional annotation revealed that EPCAM’s interactive genes were responsible for cell polarity and regulation of DNA damage response. The interactive genes of ICAM1 and THY1 were both involved in cell adhesion, and the former also regulated cellular response to cytokine and mRNA translation. TFRC’s and LGR5’s interaction networks consistently partook in cellular ions homeostasis. And CXCR4 mainly acted as a chemokine-mediated inflammatory regulator. The KEGG enrichment analyses elucidated that signal pathways of chemokine, Toll-like receptor, cancer, NOD-like receptor, NF-kappa B, and HIF-1 were involved. Toll-like receptor, NOD-like receptor, and NF-kappa B pathways all play vital roles in cancer-related inflammation, which process proinflammatory cytokines engaging in cancer progression (Hu et al., 2016; Cao and Xu, 2019). HIF-1 signaling affects cell proliferation, apoptosis, angiogenesis, epithelial-mesenchymal transition, and drug resistance of diverse cancer cells, including GC (Li et al., 2019), and it could also facilitate CSCs generation and cancer aggressive phenotype (Das et al., 2008).
In conclusion, we found that elevated CXCR4 might serve as an unfavorable, while EPCAM and TFRC might be favorable prognostic biomarkers of GC patients. The GCSC markers might affect the disease outcomes by maintaining the stem cell-like properties of cancer and remodeling distinct TIICs in the TME, especially TAMs, Tregs, and DCs. Specifically, the processes of cell adhesion, mRNA translation, and inflammation, and signaling pathways of chemokine, Toll-like receptor, NF-kappa B, and HIF-1 might be involved. Our study suggested that GCSC markers were promising therapeutic targets to diminish cancer aggressivity and modulate anticancer immunity in GC. Despite this, there is still a long way to go for experimental and clinical validations.
Data Availability Statement
All the data that support the findings of this study have been provided in the article/Supplementary Material, or are publicly available in the databases mentioned in the Materials and Methods section.
Author Contributions
TL designed the study, conducted bioinformatics analysis, and wrote the original manuscript. WP and PM studied the relevant literature. EZ refined the figures. LP provided comments and guidance of the manuscript. All authors have read, contributed to the revision of the manuscript, and approved the submitted version.
Conflict of Interest
The authors declare that the research was conducted in the absence of any commercial or financial relationships that could be construed as a potential conflict of interest.
Supplementary Material
The Supplementary Material for this article can be found online at: https://www.frontiersin.org/articles/10.3389/fmolb.2021.626966/full#supplementary-material
Footnotes
- ^ https://www.oncomine.org/resource/login.html
- ^ http://gepia.cancer-pku.cn
- ^ http://ualcan.path.uab.edu
- ^ http://www.linkedomics.org/
- ^ http://www.cbioportal.org/
- ^ http://www.kmplot.com/
- ^ http://timer.cistrome.org
- ^ http://genemania.org
- ^ https://david.ncifcrf.gov/home.jsp
References
Aran, D., Sirota, M., and Butte, A. J. (2015). Systematic pan-cancer analysis of tumour purity. Nat. Commun. 6:8971. doi: 10.1038/ncomms9971
Bagheri, V., Abbaszadegan, M. R., Memar, B., Motie, M. R., Asadi, M., Mahmoudian, R. A., et al. (2019). Induction of T cell-mediated immune response by dendritic cells pulsed with mRNA of sphere-forming cells isolated from patients with gastric cancer. Life Sci. 219, 136–143. doi: 10.1016/j.lfs.2019.01.016
Bekaii-Saab, T., and El-Rayes, B. (2017). Identifying and targeting cancer stem cells in the treatment of gastric cancer. Cancer 8, 1303–1312. doi: 10.1002/cncr.30538
Bray, F., Ferlay, J., Soerjomataram, I., Siegel, R. L., Torre, L. A., and Jemal, A. (2018). Global cancer statistics 2018: GLOBOCAN estimates of incidence and mortality worldwide for 36 cancers in 185 countries. CA Cancer J. Clin. 6, 394–424. doi: 10.3322/caac.21492
Brungs, D., Aghmesheh, M., Vine, K. L., Becker, T. M., Carolan, M. G., and Ranson, M. (2016). Gastric cancer stem cells: evidence, potential markers, and clinical implications. J. Gastroenterol. 4, 313–326. doi: 10.1007/s00535-015-1125-5
Cao, X., and Xu, J. (2019). Insights into inflammasome and its research advances in cancer. Tumori 6, 456–464. doi: 10.1177/0300891619868007
Cerami, E., Gao, J., Dogrusoz, U., Gross, B. E., Sumer, S. O., Aksoy, B. A., et al. (2012). The cBio cancer genomics portal: an open platform for exploring multidimensional cancer genomics data. Cancer Discov. 5, 401–404. doi: 10.1158/2159-8290.CD-12-0095
Chandrashekar, D. S., Bashel, B., Balasubramanya, S. A. H., Creighton, C. J., Ponce-Rodriguez, I., Chakravarthi, B. V. S. K., et al. (2017). UALCAN: a portal for facilitating tumor subgroup gene expression and survival analyses. Neoplasia 8, 649–658. doi: 10.1016/j.neo.2017.05.002
Chen, S., Pan, S., Wu, H., Zhou, J., Huang, Y., Wang, S., et al. (2020). ICAM1 regulates the development of gastric cancer and may be a potential biomarker for the early diagnosis and prognosis of gastric cancer. Cancer Manag. Res. 12, 1523–1534. doi: 10.2147/CMAR.S237443
Chen, X. L., Chen, X. Z., Wang, Y. G., He, D., Lu, Z. H., Liu, K., et al. (2016). Clinical significance of putative markers of cancer stem cells in gastric cancer: a retrospective cohort study. Oncotarget 38, 62049–62069. doi: 10.18632/oncotarget.11384
Dai, M., Yuan, F., Fu, C., Shen, G., Hu, S., and Shen, G. (2017). Relationship between epithelial cell adhesion molecule (EpCAM) overexpression and gastric cancer patients: a systematic review and meta-analysis. PLoS One 4:e0175357. doi: 10.1371/journal.pone.0175357
Das, B., Tsuchida, R., Malkin, D., Koren, G., Baruchel, S., and Yeger, H. (2008). Hypoxia enhances tumor stemness by increasing the invasive and tumorigenic side population fraction. Stem Cells 7, 1818–1830. doi: 10.1634/stemcells.2007-0724
Edfors, F., Sanli, K., von Feilitzen, K., Oksvold, P., Lundberg, E., Hober, S., et al. (2017). A pathology atlas of the human cancer transcriptome. Science 6352:eaan2507. doi: 10.1126/science.aan2507
Franz, M., Rodriguez, H., Lopes, C., Zuberi, K., Montojo, J., Baderet, G. D., et al. (2018). GeneMANIA: update 2018. Nucleic Acids Res. 46:W60–W64. doi: 10.1093/nar/gky311
Fu, L., Bu, L., Yasuda, T., Koiwa, M., Akiyama, T., Uchihara, T., et al. (2020). Gastric cancer stem cells: current insights into the immune microenvironment and therapeutic targets. Biomedicines 1:7. doi: 10.3390/biomedicines8010007
Fu, Y., Du, P., Zhao, J., Hu, C., Qin, Y., and Huang, G. (2018). Gastric cancer stem cells: mechanisms and therapeutic approaches. Yonsei Med. J. 10:1150. doi: 10.3349/ymj.2018.59.10.1150
Gambardella, V., Castillo, J., Tarazona, N., Gimeno-Valiente, F., Martínez-Ciarpaglini, C., Cabeza-Segura, M., et al. (2020). The role of tumor-associated macrophages in gastric cancer development and their potential as a therapeutic target. Cancer Treat. Rev. 86:102015. doi: 10.1016/j.ctrv.2020.102015
Gao, J., Aksoy, B. A., Dogrusoz, U., Dresdner, G., Gross, B., Sumer, S. O., et al. (2013). Integrative analysis of complex cancer genomics and clinical profiles using the cBioPortal. Sci. Signal. 269:l1. doi: 10.1126/scisignal.2004088
Györffy, B., Lanczky, A., Eklund, A. C., Denkert, C., Budczies, J., Liet, Q., et al. (2010). An online survival analysis tool to rapidly assess the effect of 22,277 genes on breast cancer prognosis using microarray data of 1,809 patients. Breast Cancer Res. Treat. 3, 725–731. doi: 10.1007/s10549-009-0674-9
Hagemann, T., Lawrence, T., McNeish, I., Charles, K. A., Kulbe, H., Thompson, R. G., et al. (2008). “Re-educating” tumor-associated macrophages by targeting NF-kappaB. J. Exp. Med. 6, 1261–1268. doi: 10.1084/jem.20080108
Hu, Y., Liu, J. P., Zhu, Y., and Lu, N. H. (2016). The importance of Toll-like receptors in NF-κB signaling pathway activation by Helicobacter pylori infection and the regulators of this response. Helicobacter 5, 428–440. doi: 10.1111/hel.12292
Huang, Da W, Sherman, B. T., and Lempicki, R. A. (2009). Systematic and integrative analysis of large gene lists using DAVID bioinformatics resources. Nat. Protoc. 4, 44–57. doi: 10.1038/nprot.2008.211
Huang, T., Qiu, X., Xiao, J., Wang, Q., Wang, Y., Zhang, Y., et al. (2016). The prognostic role of leucine-rich repeat-containing G-protein-coupled receptor 5 in gastric cancer: a systematic review with meta-analysis. Clin Res. Hepatol. Gastroenterol. 2, 246–253. doi: 10.1016/j.clinre.2015.07.009
Ishimoto, T., Sawayama, H., Sugihara, H., and Baba, H. (2014). Interaction between gastric cancer stem cells and the tumor microenvironment. J. Gastroenterol. 7, 1111–1120. doi: 10.1007/s00535-014-0952-0
Jiang, Q., Sun, Y., and Liu, X. (2019). CXCR 4 as a prognostic biomarker in gastrointestinal cancer: a meta-analysis. Biomarkers 6, 510–516. doi: 10.1080/1354750X.2019.1637941
Jones, J. O., and Smyth, E. C. (2020). Gastroesophageal cancer: navigating the immune and genetic terrain to improve clinical outcomes. Cancer Treat. Rev. 84:101950. doi: 10.1016/j.ctrv.2019.101950
Jung, W. C., Jang, Y. J., Kim, J. H., Park, S. S., Park, S. H., Kim, S. J., et al. (2012). Expression of intercellular adhesion molecule-1 and e-selectin in gastric cancer and their clinical significance. J. Gastric Cancer 3, 140–148. doi: 10.5230/jgc.2012.12.3.140
Kumar, V., Patel, S., Tcyganov, E., and Gabrilovich, D. I. (2016). The nature of myeloid-derived suppressor cells in the tumor microenvironment. Trends Immunol. 3, 208–220. doi: 10.1016/j.it.2016.01.004
Li, H., Jia, Y., and Wang, Y. (2019). Targeting HIF-1α signaling pathway for gastric cancer treatment. Pharmazie 1, 3–7. doi: 10.1691/ph.2019.8674
Li, T., Fan, J., Wang, B., Traugh, N., Chen, Q., Liu, J. S., et al. (2017). TIMER: a web server for comprehensive analysis of tumor-infiltrating immune cells. Cancer Res. 21, e108–e110. doi: 10.1158/0008-5472.CAN-17-0307
Liu, K., Yang, K., Wu, B., Chen, H., Chen, X., Chen, X., et al. (2015). Tumor-infiltrating immune cells are associated with prognosis of gastric cancer. Medicine 39:e1631. doi: 10.1097/MD.0000000000001631
Liu, X., Yu, H., Yan, C., Mei, Y., Lin, C., Hong, Y., et al. (2019). Plasmacytoid dendritic cells and ICOS (+) regulatory T cells predict poor prognosis in gastric cancer: a pilot study. J. Cancer 26, 6711–6715. doi: 10.7150/jca.34826
Liu, X. S., Lin, X. K., Mei, Y., Ahmad, S., Yan, C. X., Jin, H. L., et al. (2019). Regulatory t cells promote overexpression of lgr5 on gastric cancer cells via TGF-beta1 and confer poor prognosis in gastric cancer. Front. Immunol. 10:1741. doi: 10.3389/fimmu.2019.01741
Lizárraga-Verdugo, E., Avendaño-Félix, M., Bermúdez, M., Ramos-Payán, R., Pérez-Plasencia, C., and Aguilar-Medina, M. (2020). Cancer stem cells and its role in angiogenesis and vasculogenic mimicry in gastrointestinal cancers. Front. Oncol. 10:413. doi: 10.3389/fonc.2020.00413
Meng, Y., Xu, B. Q., Fu, Z. G., Wu, B., Xu, B., Chen, Z. N., et al. (2015). Cytoplasmic EPCAM over-expression is associated with favorable clinical outcomes in pancreatic cancer patients with hepatitis b virus negative infection. Int. J. Clin. Exp. Med. 8, 22204–22216.
Nguyen, P. H., Giraud, J., Chambonnier, L., Dubus, P., Wittkop, L., Belleannée, G., et al. (2017). Characterization of biomarkers of tumorigenic and chemoresistant cancer stem cells in human gastric carcinoma. Clin. Cancer Res. 6, 1586–1597. doi: 10.1158/1078-0432.CCR-15-2157
Numakura, S., Uozaki, H., Kikuchi, Y., Watabe, S., Togashi, A., and Watanabe, M. (2019). Mesenchymal stem cell marker expression in gastric cancer stroma. Anticancer Res. 1, 387–393. doi: 10.21873/anticanres.13124
O’Connor, M. L., Xiang, D., Shigdar, S., Macdonald, J., Li, Y., Wang, T., et al. (2014). Cancer stem cells: a contentious hypothesis now moving forward. Cancer Lett. 2, 180–187. doi: 10.1016/j.canlet.2013.11.012
Ohkuma, M., Haraguchi, N., Ishii, H., Mimori, K., Tanaka, F., Kim, H. M., et al. (2012). Absence of CD71 transferrin receptor characterizes human gastric adenosquamous carcinoma stem cells. Ann. Surg. Oncol. 4, 1357–1364. doi: 10.1245/s10434-011-1739-7
Pan, J., Zhou, H., Cooper, L., Huang, J., Zhu, S., Zhao, X., et al. (2019). LAYN Is a prognostic biomarker and correlated with immune infiltrates in gastric and colon cancers. Front. Immunol. 10:6. doi: 10.3389/fimmu.2019.00006
Peng, D., Tanikawa, T., Li, W., Zhao, L., Vatan, L., Szeliga, W., et al. (2016). Myeloid-derived suppressor cells endow stem-like qualities to breast cancer cells through IL6/STAT3 and NO/NOTCH cross-talk signaling. Cancer Res. 11, 3156–3165. doi: 10.1158/0008-5472.CAN-15-2528
Raggi, C., Mousa, H. S., Correnti, M., Sica, A., and Invernizzi, P. (2016). Cancer stem cells and tumor-associated macrophages: a roadmap for multitargeting strategies. Oncogene 6, 671–682. doi: 10.1038/onc.2015.132
Rezalotfi, A., Ahmadian, E., Aazami, H., Solgi, G., and Ebrahimi, M. (2019). Gastric cancer stem cells effect on Th17/Treg balance; a bench to beside perspective. Front. Oncol. 9:226. doi: 10.3389/fonc.2019.00226
Rhodes, D. R., Kalyana-Sundaram, S., Mahavisno, V., Varambally, R., Yu, J., Briggs, B. B., et al. (2007). Oncomine 3.0: genes, pathways, and networks in a collection of 18,000 cancer gene expression profiles. Neoplasia 2, 166–180. doi: 10.1593/neo.07112
Ruiu, R., Tarone, L., Rolih, V., Barutello, G., Bolli, E., Riccardo, F., et al. (2019). Cancer stem cell immunology and immunotherapy: harnessing the immune system against cancer’s source. Prog. Mol. Biol. Transl. 164, 119–188. doi: 10.1016/bs.pmbts.2019.03.008
Sainz, B., Carron, E., Vallespinós, M., and Machado, H. L. (2016). Cancer stem cells and macrophages: implications in tumor biology and therapeutic strategies. Mediators Inflamm. 2016:9012369. doi: 10.1155/2016/9012369
Smyth, E. C., Nilsson, M., Grabsch, H. I., van Grieken, N. C., and Lordick, F. (2020). Gastric cancer. Lancet 10251, 635–648. doi: 10.1016/S0140-6736(20)31288-5
Solinas, C., Pusole, G., Demurtas, L., Puzzoni, M., Mascia, R., Morgan, G., et al. (2017). Tumor infiltrating lymphocytes in gastrointestinal tumors: controversies and future clinical implications. Crit. Rev. Oncol. Hematol. 110, 106–116. doi: 10.1016/j.critrevonc.2016.11.016
Sultan, M., Coyle, K. M., Vidovic, D., Thomas, M. L., Gujar, S., and Marcato, P. (2017). Hide-and-seek: the interplay between cancer stem cells and the immune system. Carcinogenesis 2, 107–118. doi: 10.1093/carcin/bgw115
Tang, Z., Li, C., Kang, B., Gao, G., Li, C., and Zhang, Z. (2017). GEPIA: a web server for cancer and normal gene expression profiling and interactive analyses. Nucleic Acids Res. 45, W98–W102. doi: 10.1093/nar/gkx247
Thrift, A. P., and El-Serag, H. B. (2020). Burden of gastric cancer. Clin. Gastroenterol. Hepatol. 3, 534–542. doi: 10.1016/j.cgh.2019.07.045
Ugel, S., De Sanctis, F., Mandruzzato, S., and Bronte, V. (2015). Tumor-induced myeloid deviation: when myeloid-derived suppressor cells meet tumor-associated macrophages. J. Clin. Invest. 9, 3365–3376. doi: 10.1172/JCI80006
Vasaikar, S. V., Straub, P., Wang, J., and Zhang, B. (2018). LinkedOmics: analyzing multi-omics data within and across 32 cancer types. Nucleic Acids Res. 46, D956–D963. doi: 10.1093/nar/gkx1090
Volovitz, I., Melzer, S., Amar, S., Bocsi, J., Bloch, M., Efroni, S., et al. (2016). Dendritic cells in the context of human tumors: biology and experimental tools. Int. Rev. Immunol. 2, 116–135. doi: 10.3109/08830185.2015.1096935
Wei, L., Sun, J., Zhang, N., Zheng, Y., Wang, X., Lv, L., et al. (2020). Noncoding RNAs in gastric cancer: implications for drug resistance. Mol. Cancer 1:62. doi: 10.1186/s12943-020-01185-7
Woopen, H., Pietzner, K., Richter, R., Fotopoulou, C., Joens, T., Braicu, E. I., et al. (2014). Overexpression of the epithelial cell adhesion molecule is associated with a more favorable prognosis and response to platinum-based chemotherapy in ovarian cancer. J. Gynecol. Oncol. 3, 221–228. doi: 10.3802/jgo.2014.25.3.221
Wu, K., Zou, J., Lin, C., and Jie, Z. G. (2019). MicroRNA-140-5p inhibits cell proliferation, migration and promotes cell apoptosis in gastric cancer through the negative regulation of thy1-mediated notch signaling. Biosci. Rep. 39:BSR20181434. doi: 10.1042/BSR20181434
Xiang, Z., Zhou, Z. J., Xia, G. K., Zhang, X. H., Wei, Z. W., Zhu, J. T., et al. (2017). A positive crosstalk between CXCR4 and CXCR2 promotes gastric cancer metastasis. Oncogene 36, 5122–5133. doi: 10.1038/onc.2017.108
Xiao, Z., Hu, L., Yang, L., Wang, S., Gao, Y., Zhu, Q., et al. (2020). TGFβ2 is a prognostic−related biomarker and correlated with immune infiltrates in gastric cancer. J. Cell Mol. Med. 24, 7151–7162. doi: 10.1111/jcmm.15164
Yin, S., Huang, J., Li, Z., Zhang, J., Luo, J., Lu, C., et al. (2017). The prognostic and clinicopathological significance of tumor-associated macrophages in patients with gastric cancer: a meta-analysis. PLoS One 1:e0170042. doi: 10.1371/journal.pone.0170042
Zhang, W. J., Zhou, Z. H., Guo, M., Yang, L. Q., Xu, Y. Y., Pang, T. H., et al. (2017). High infiltration of polarized CD163 tumor-associated macrophages correlates with aberrant expressions of CSCs markers, and predicts prognosis in patients with recurrent gastric cancer. J. Cancer 3, 363–370. doi: 10.7150/jca.16730
Zhao, Y. (2015). Stem cells in gastric cancer. World J. Gastroenterol. 1:112. doi: 10.3748/wjg.v21.i1.112
Keywords: gastric cancer, cancer stem cell, marker, prognostic, immune infiltration
Citation: Lin T, Peng W, Mai P, Zhang E and Peng L (2021) Human Gastric Cancer Stem Cell (GCSC) Markers Are Prognostic Factors Correlated With Immune Infiltration of Gastric Cancer. Front. Mol. Biosci. 8:626966. doi: 10.3389/fmolb.2021.626966
Received: 13 November 2020; Accepted: 08 April 2021;
Published: 25 May 2021.
Edited by:
Megha Agrawal, University of Illinois at Chicago, United StatesReviewed by:
Surendra Kumar Shukla, University of Nebraska Medical Center, United StatesNimi Marcel, University of California, San Diego, United States
Copyright © 2021 Lin, Peng, Mai, Zhang and Peng. This is an open-access article distributed under the terms of the Creative Commons Attribution License (CC BY). The use, distribution or reproduction in other forums is permitted, provided the original author(s) and the copyright owner(s) are credited and that the original publication in this journal is cited, in accordance with accepted academic practice. No use, distribution or reproduction is permitted which does not comply with these terms.
*Correspondence: Lisheng Peng, TGlTaGVuZ19QZW5nQG91dGxvb2suY29t