 Wenhao Xu1,2†
 Xiaoxin Hu3†
 Aihetaimujiang Anwaier1,2†
 Jun Wang4,5†
 Wangrui Liu6
 Xi Tian1,2Wenkai Zhu1,2Chunguang Ma1,2Fangning Wan1,2Guohai Shi1,2
 Yuan-Yuan Qu1,2*Hailiang Zhang1,2*
 Dingwei Ye1,2*
- 1Department of Urology, Fudan University Shanghai Cancer Center, Shanghai, China
- 2Department of Oncology, Fudan University Shanghai Medical College, Shanghai, China
- 3Department of Radiology, Fudan University Shanghai Cancer Center, Shanghai, China
- 4Department of Urology, Sun Yat-sen University Cancer Center, Guangzhou, China
- 5State Key Laboratory of Oncology in Southern China, Guangzhou, China
- 6Department of Neurosurgery, Shanghai East Hospital, Tongji University School of Medicine, Shanghai, China
Purpose: Lipid metabolism reprogramming is a major pathway in tumor evolution. This study investigated fatty acid synthase (FASN) mRNA expression in anthropometric adipose tissue and elucidated the prognostic value and potential mechanism of clear cell renal cell carcinoma (ccRCC).
Materials and Methods: Transcription profiles were obtained from 533 ccRCC samples in The Cancer Genome Atlas (TCGA) cohorts. Real-time quantitative PCR (RT-qPCR) and immunohistochemistry were performed to detect FASN expression in 380 paired ccRCC and normal tissues from the Fudan University Shanghai Cancer Center (FUSCC). Visceral adipose tissue (VAT) and subcutaneous adipose tissue were at the level of the umbilicus as measured by magnetic resonance imaging (MRI). Non-targeted metabolomics and in vitro experiments were used to reveal the biological functions of FASN.
Results: Increased FASN expression was significantly relevant to advanced T, N, and American Joint Committee on Cancer (AJCC) stages (p < 0.01) and significantly correlated to poor progression-free survival (PFS) and overall survival (OS) of 913 ccRCC patients in FUSCC and TCGA cohorts. Pearson's correlation coefficient indicated that FASN amplification was positively correlated to VAT% (r = 0.772, p < 0.001), which significantly correlated to poor PFS (HR = 2.066, p = 0.028) and OS (HR = 2.773, p = 0.023) in the FUSCC cohort. Transient inhibition or overexpression of FASN significantly regulated A498 and 786O cell proliferation and migration by regulating epithelial–mesenchymal transition. Inhibition of FASN led to a higher apoptotic rate and decreased lipid droplet formation compared with normal control in ccRCC cells. Non-targeted metabolomics showed that decreased de novo lipogenesis might be required to sustain an elevation of glycolytic activity in 786O cells by regulating galactinol, DL-lactate, N-acetylaspartylglutamate, and sucrose, thereby participating in carcinogenesis and progression of ccRCC.
Conclusion: This study demonstrated that FASN expression is positively related to aggressive cell proliferation, migration, apoptosis, and lipid droplet formation and regulates metabolic disorders of the ccRCC microenvironment. Additionally, elevated FASN mRNA expression is significantly correlated to the abdominal obesity distribution, especially VAT%, which is a significant predictor of a poor prognosis for ccRCC patients.
Introduction
Renal cell carcinoma (RCC) is a highly malignant tumor that originates from the urinary tubular epithelial system of the renal parenchyma. The incidence of RCC is increasing at a rate of 2% per year, especially in developed countries (Siegel et al., 2019). Pathologically, clear cell renal cell carcinoma (ccRCC) accounts for ~70% of all cases (Srigley et al., 2013). ccRCC is highly aggressive and has a poor prognosis, even in patients diagnosed at an early stage and treated by nephrectomy. Thus, there is an urgent need for accurate biomarkers for clinical guidance and prognosis prediction as well as new drug development for treatment.
Accumulating studies have shown that changes in the lipid profile and abnormal lipid metabolism play a major role in the development of cancers, which may provide a new approach for cancer detection and treatment (Xu et al., 2020). Fatty acid synthase (FASN), one of the important enzymes involved in lipid metabolism, synthesizes long-chain fatty acids and largely controls deposition of animal liposomes. Compared with normal cells, all esterified fatty acids in most tumor cells are synthesized de novo, and expression of FASN in tumor cells is significantly increased, which leads to aggressiveness and a poor prognosis (Menendez and Lupu, 2007; Horiguchi et al., 2008; Ogino et al., 2008). Therefore, it is worth exploring the relationship between FASN and the occurrence and development of ccRCC.
Previous studies have indicated that obesity, which is defined as a body mass index (BMI) greater than 30 kg/m2, is a risk factor for ccRCC (Motamedinia et al., 2008; Renehan et al., 2008; Choi et al., 2013). Although BMI is an internationally recognized convenient and effective weight indicator, many studies have recently disputed the accuracy of BMI to indicate body fat distribution and metabolic risk (Thomas et al., 2012; Peterson et al., 2014; Tomiyama et al., 2016). Therefore, it is essential to determine a new measurement to indicate the distribution of adipose tissue and its prognostic value for ccRCC and other cancers (Ludescher et al., 2009; Britton et al., 2013).
In 2010, Ibrahim indicated that anatomy and biological functions were greatly distinguished between subcutaneous adipose tissue (SAT) and visceral adipose tissue (VAT) in the heterogeneous nature of obesity (Ibrahim, 2010). A recent study showed that a high Fuhrman grade significantly correlates to increased VAT in ccRCC patients (Zhu et al., 2013). The visceral obesity percentage (VAT%) is calculated using the formula VAT% = [(AP – SAT) / AP] × 100% and particularly associated with the progression and prognosis of ccRCC patients (Xu et al., 2019a). The increasing number of studies on obesity distribution has provided novel insights into signaling pathways involved in the occurrence of ccRCC to prevent its progression.
To define the prognostic implications of FASN mRNA expression in ccRCC patients and the correlation between FASN expression and adipose tissue distribution, we used 533 ccRCC samples from The Cancer Genome Atlas (TCGA) cohort and 380 patients who had received radical nephrectomy. Functional analyses of FASN in human ccRCC cells were performed in vitro. Additionally, functional annotations of hub genes with FASN and non-targeted metabolomics were used to reveal significant pathways involved in ccRCC carcinogenesis. We hypothesized that elevated FASN mRNA expression correlates with VAT%, a poor prognosis, and malignant biological behaviors of ccRCC.
Materials and Methods
Clinical Sample Collection and Variables Baseline
This study screened 523 consecutive patients who underwent radical or partial nephrectomy at the Department of Urology, Fudan University Shanghai Cancer Center (FUSCC, Shanghai, China) with available pathology reports and electronic medical records. Among the 143 excluded patients, 27 patients were diagnosed with benign renal tumor, 38 with urinary tract carcinoma, 49 with non-clear RCC, and 29 failed to pass pathological quality check. A total of 380 ccRCC patients were eventually and consecutively enrolled in analyses from August 2009 to November 2018.
This study also consecutively included 533 ccRCC patients with available RNA sequence data from TCGA database. Tissue samples, including ccRCC and adjacent normal tissue, were collected during surgery and fixed in 4% paraformaldehyde, available from FUSCC tissue bank. Clinicopathological parameters of all patients, including age at surgery, gender, BMI, tumor laterality, TNM stage, American Joint Committee on Cancer (AJCC) stage, and International Society of Urological Pathology (ISUP) grade, were collected. Anthropometric measurements of obesity on magnetic resonance imaging (MRI), including anterior abdominal adipose thickness (A in blue line), posterior abdominal adipose thickness (P in pink line), SAT, and VAT, were also collected and analyzed in this study.
Total mRNA Extraction and Real-Time Quantitative PCR
Total RNA sequence was isolated using TRIzol reagent (Invitrogen, Carlsbad, CA, USA) from 380 paired ccRCC and adjacent normal samples or cells. SYBR® Premix Ex TaqTM (TaKaRa) was implemented to perform RT-qPCR reactions in triplicate according to attached protocols, as previously described (Xu et al., 2019b). The primers of FASN were forward: 5′-CGA CAG CAC CAG CTT CGC CA-3′ and reverse: 5′-CAC GCT GGC CTG CAG CTT CT-3′. The relative FASN expression quantity was measured after the 2−ΔΔCt calculation using beta-Actin as the internal standard. Relative expression in this study was represented using the ratio of FASN expression in Tumor/Normal tissues (T/N).
Anthropometric Measurements of Obesity
The quantity of anterior abdominal adipose thickness (A in blue line), posterior abdominal adipose thickness (P in yellow line), and anteroposterior diameter (AP in pink line) was measured by MRI at the umbilical level (~L4–L5 level marked in green dotted line) with T2-weighted sagittal localization images for 380 patients. The visceral obesity percentage was defined as VAT%. The value of SAT and VAT% was calculated using the formula SAT = A + P and VAT% = [(AP – SAT) / AP], respectively.
Human ccRCC Cell Culture
Two normal types of human ccRCC cell lines (A498 and 786O) were obtained from American Type Culture Collection (ATCC). The A498 and 786O cells were cultured in culture medium RPMI-1640 (GIBCO, USA) and supplemented with 10% fetal bovine serum (Hyclone, Life Sciences, Shanghai, China) and 100 U/ml penicillin (Beyotime, China). The A498 and 786O cells were incubated in a humidified atmosphere incubator of 5% CO2 at 37°C temperature.
Cell Transfection
Both A498 and 786O cells have been transfected with double stranded siRNA according to the manufacturer's protocol using plasmid using Lipofectamine 2000 reagent (RiboBio) in a six-well plate. The transfection dose for each well was 15 μl of siRNA-1 (assay ID: 107315; Invitrogen, Carlsbad, CA, USA), siRNA-2 (assay ID: 107316; Invitrogen, Carlsbad, CA, USA), or negative control RNAi (12935-400; Invitrogen, Carlsbad, CA, USA) at a concentration of 150 nM in 250 μl RPMI-1640 incubated for 20 min. The A498 and 786O cells were harvested for at least 24 h after transfection for further experimental analysis.
Protein Isolation and Western Blot Analysis
Proteins were extracted from A498 and 786O cells using RIPA lysis buffer (Beyotime Biotechnology Shanghai, China) and concentrated by the bicinchoninic acid protein assay kit (Beyotime Biotechnology, Shanghai, China). Samples were separated by electrophoresis on 6 or 10% SDS gel and then transferred to a methanol activated polyvinylidene fluoride (PVDF) membrane. Membranes were blocked with 5% bovine serum albumin (BSA) for 1 h at room temperature and then incubated with primary antibodies, anti-FASN (1:1,000, ab128870, Abcam), and anti-beta-Actin primary antibody (1:3,000, ab179467, Abcam) at 4°C overnight. After washed with TBST for three times, membranes were incubated with secondary antibody goat anti-rabbit IgG conjugated with HRP (1:3,000, ab205718, Abcam) at room temperature for 60 min. After three washes with TBST for 10 min each, the bands were visualized using ECL-plus™ western blotting chemiluminescence kits (BD Biosciences, NJ, USA).
Cell Viability Analysis
For viability assays, cells treated with shRNA or inhibitors were seeded onto 96-well plates (2,000 cells/well). Next, 10 μl CCK8 solution (KeyGEN BioTECH, Nanjing, China) was added to each well, and cells were incubated at 37°C for 2 h. The absorbance of each well at 450 nm was measured at 1, 2, 3, 4, and 5 days after seeding using an automatic microplate reader (TEAN, Swiss). Three replicate analyses were performed for each sample.
Cell Apoptosis Assays
Apoptosis detection assay was performed using Annexin V-FITC Apoptosis Detection Kits (BD, USA) in accordance with the manufacturer's procedures. Briefly, the A498 and 786O cells were obtained, triple washed with PBS, and then added 500 μl in 1 × binding buffer. Then, 500 μl cell suspension, 5 μl Annexin V-FITC, and 5 μl propidium iodide (PI) solution were resuspended in each collection tube. After incubation for 15 min, cell apoptosis was analyzed using a FACS analyzer (BD, USA).
Transwell Migration Assay
After trypsinized and suspended in the medium, 1 × 10⁵ A498 and 786O cells were seeded in medium with 10% FBS and placed in each transwell chamber. The medium containing 20% fetal bovine serum was added in the lower 24-well plate chamber. After 24 h, the bottom A498 and 786O cells were treated with 4% polyoxymethylene for 15 min, deionized water, and 0.1% crystal violet for 30 min. Finally, the A498 and 786O cells migrating to the lower surface of transwell chamber were counted using a microscope in six random fields.
Oil Red O Staining of Lipid Droplets
Cells were seeded in 12-well plates and cultured in RPMI-1640 10% FCS for 48 h before discarded and replaced by basal media, ACM40. Next, cells were washed twice with DPBS and fixed with 4% paraformaldehyde. Oil Red O staining was performed using 0.3% Oil Red O staining solution dissolved in isopropanol. Lipid droplets were visualized using bright field microscopy with 20 × magnification (Zeiss Primovert, Shanghai, China).
Survival Analysis
The primary endpoint was overall survival (OS), which was assessed from the date of receiving radical nephrectomy to the date of death or the last follow-up. Progression-free survival (PFS) was the secondary endpoint and was defined as the length of time from the date of surgery to the date of progression, second-line treatment, or death, whichever occurred first. Survival curves were established using the Kaplan–Meier method and analyzed by log-rank test with 95% confidence intervals (CIs). To find independent predictors, the hazard ratio (HR) estimates and 95% CIs were performed using univariate and multivariate Cox logistic regression models. As a supplement to survival, Cox logistic regression analysis was performed on 117 patients with available MRI scan to assess confounding covariates including A, P, SAT, VAT%, TNM stage, ISUP grade, and FASN expression.
Protein–Protein Interaction Network Construction
Search Tool for the Retrieval of Interacting Genes (STRING; http://string-db.org) (version 10.0) online database was utilized to detect protein–protein interaction (PPI) network of co-regulated hub genes and analyze the functional interactions between relative proteins. An interaction with specificity scores higher than 0.4 was regarded as statistically significant.
Functional Annotations Analysis
Database for Annotation, Visualization and Integrated Discovery (DAVID; http://david.ncifcrf.gov; version 6.8) online database was utilized to investigate the Gene Ontology (GO): biological process (BP), GO: molecular function (MF), and Kyoto Encyclopedia of Genes and Genomes (KEGG) pathways analyses and then visualized in a bubble chart. To predict potential hallmarks, gene set enrichment analysis (GSEA) was utilized to test significant genes using transcriptional sequences in TCGA database. A permutation test with 1,000 times was used to identify the significantly changed pathways. The adjusted p (adj. p) values less than 0.01 and false discovery rate (FDR) less than 0.25 were confirmed as significant related genes.
Analysis of Non-targeted Metabolomics Analysis Process
This experiment uses UHPLC-Q-TOF MS technology combined with data-dependent acquisition methods to perform full-spectrum analysis of samples. AB Triple TOF 5600/6600 mass spectrometer (AB SCIEX) and Agilent 1290 Infinity LC Ultra High-Pressure Liquid Chromatograph (Agilent) were used to obtain primary and secondary mass spectrometry data at the same time and then used XCMS to perform peak extraction and metabolite identification on the data. Waters, ACQUITY UPLC BEH Amide 1.7 μm, 2.1 mm × 100 mm column and HSS T3 1.8 μm, 2.1 mm × 100 mm column were used as the columns.
Statistical Analysis
All statistical analyses and graphical plotting were performed with SPSS (version 23.0), GraphPad Prism 8 software, or R software (version 3.3.2). Chi-squared test was utilized to find out the association between different FASN mRNA expression sets and categorical clinicopathological data distributions. Pearson's correlation coefficient was utilized to determine the association between VAT% and levels of FASN mRNA expression. All hypothetical tests were two-sided, and p-values < 0.05 were considered significant in all tests.
Results
This study was conducted in three phases. First, we assessed significant differential FASN mRNA expression and its novel prognostic implications in 913 ccRCC patients of TCGA and FUSCC cohorts. Second, we estimated relationships among the VAT percentage, FASN expression, and prognosis of ccRCC patients in the FUSCC cohort. Functional experiments of FASN in human ccRCC cells were also performed in vitro. Third, functional annotations of hub genes with FASN and non-targeted metabolomics were used to reveal significant pathways involved in ccRCC carcinogenesis.
Differential FASN mRNA Expression and Its Correlation With Advanced Clinicopathological Parameters of ccRCC Patients in TCGA Cohort
To explore potential relationships between FASN expression and clinicopathological features of ccRCC patients, we used 533 ccRCC samples and 72 adjacent normal samples from TCGA cohort and found significantly increased FASN mRNA expression in ccRCC samples compared with normal samples (*p < 0.05; Figure 1A). Additionally, FASN mRNA expression was markedly related to an advanced clinical AJCC stage (p < 0.05) and reached its highest in advanced stage 4 (Figure 1B). Kaplan–Meier analysis showed that elevated FASN expression was significantly associated with shorter PFS (p = 0.011) and OS (p < 0.001) in TCGA cohort (Figures 1C,D). Overall, elevated FASN mRNA expression was significantly correlated to advanced clinicopathological features and a poor prognosis of 533 ccRCC patients in TCGA cohort.
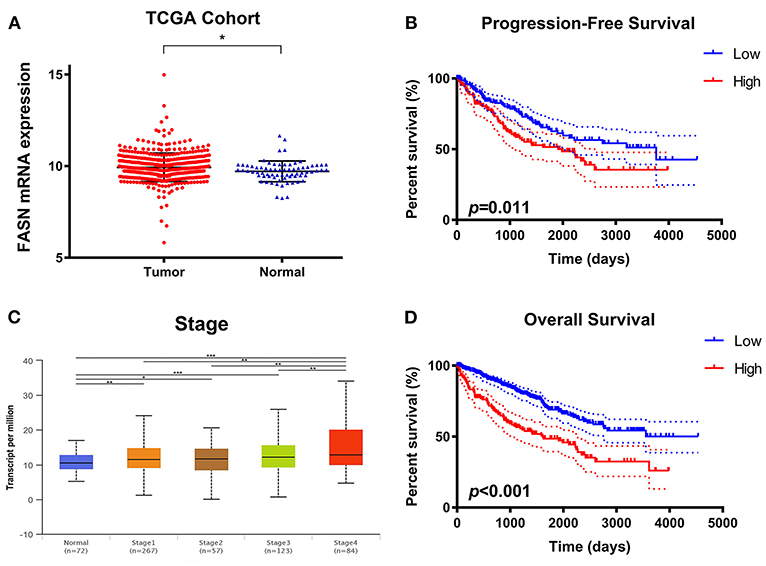
Figure 1. Differential FASN mRNA expression and its correlation with advanced clinicopathological parameters in ccRCC patients from TCGA cohort. (A) To explore the potential relationship between FASN expression and clinicopathological features of ccRCC patients, we enrolled 533 ccRCC samples and 72 adjacent normal samples from TCGA cohort and found significantly increased FASN mRNA expression in ccRCC compared with normal samples (p < 0.05). (B) The FASN mRNA expression was found to be markedly related with advanced clinical AJCC stage (p < 0.05) and reached the highest in advanced stage 4 (C,D) Survival analysis in the Kaplan–Meier method indicated that elevated FASN expression was significantly associated with shorter PFS (p = 0.011) and OS (p < 0.001) in TCGA cohort.
Clinicopathological Characteristics of 380 ccRCC Patients in the FUSCC Cohort
We also examined 380 ccRCC patients with paired tumor and normal samples in the FUSCC cohort. Clinicopathological characteristic baselines of 380 patients in relation to the FASN expression status are shown in Table 1. Chi-squared tests showed that the characteristic information was balanced in terms of the distribution of categorical data. Increased FASN mRNA expression in ccRCC patients was significantly correlated to an advanced T stage (p < 0.001), N stage (p = 0.019), and AJCC stage (p = 0.002) in ccRCC patients of the FUSCC cohort.
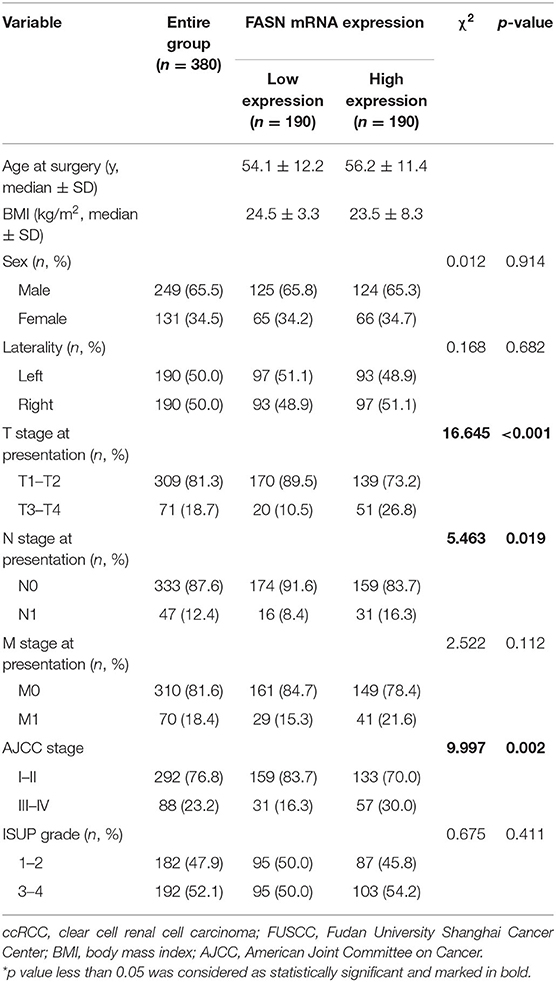
Table 1. Clinicopathological characteristics in relation to FASN expression status in 380 ccRCC patients from FUSCC cohort.
Validation of Differential FASN Expression and Its Prognostic Implication in ccRCC Tissues From the FUSCC Cohort
To validate FASN expression in ccRCC tissues in vitro, we performed real-time quantitative PCR (RT-qPCR) analysis of 380 pairs of ccRCC and normal samples from the FUSCC cohort. The results showed that the ratio of T/N was dramatically different among the distinct FASN mRNA expression groups (5.6% in T/N ≤ 1, 48.3% in 1 < T/N ≤ 2, 29% in 2 < T/N ≤ 4, 13% in 4 < T/N ≤ 8, and 2.6% in 8 < T/N; Figure 2A). Survival analysis demonstrated that patients with high FASN mRNA expression exhibited significantly poor PFS (p < 0.001; Figure 2B) and OS (p < 0.001; Figure 2C). For relatively low FASN expression, the median PFS was 65 months, and the median OS was 71.5 months. For relatively high FASN expression, the median PFS was 41 months, and the median OS was 65 months.
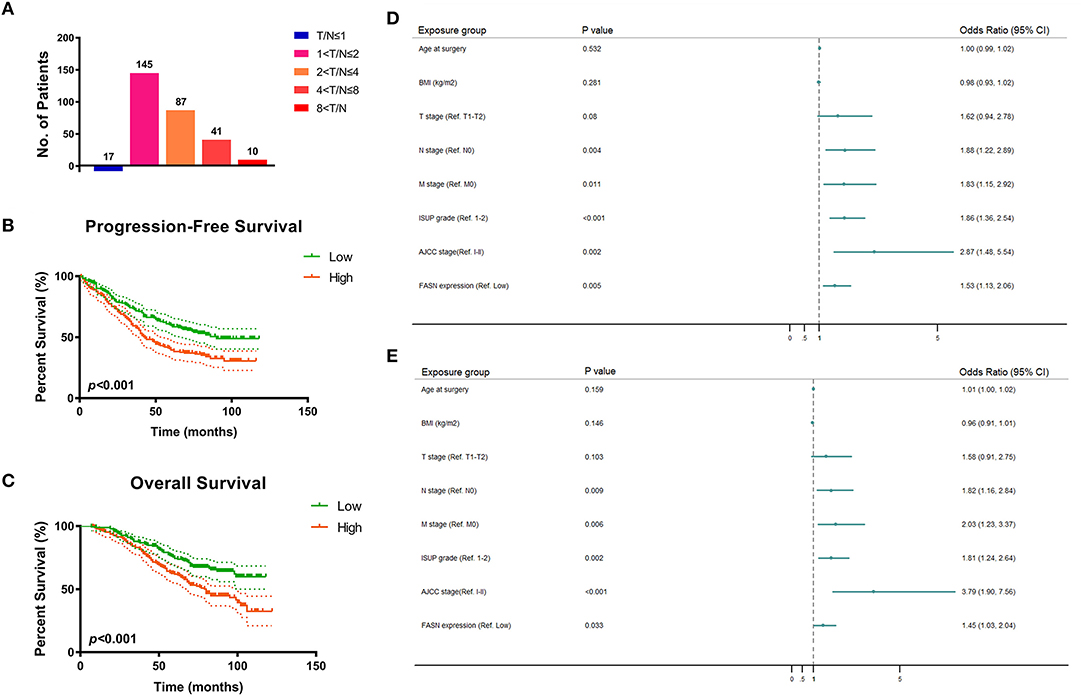
Figure 2. FASN mRNA expression and prognostic implication for 380 ccRCC patients from FUSCC cohort. (A) In order to validate FASN mRNA expression levels in ccRCC tissues in vitro, we performed real-time qPCR on 380 pairs of ccRCC and normal samples from FUSCC cohort. The result showed that the ratio of T/N was dramatically different among the distinct FASN mRNA expression group (5.6% in T/N ≤ 1, 48.3% in 1 < T/N ≤ 2, 29% in 2 < T/N ≤ 4, 13% in 4 < T/N ≤ 8, 2.6% in 8 < T/N). (B,C) Survival analysis demonstrated that patients with higher FASN mRNA expression exhibited significantly poor PFS (p < 0.001) and OS (p < 0.001). For relative low FASN expression patients, the median PFS was 65 months, and the median OS was 71.5 months, respectively. For relative high FASN expression patients, the median PFS was 41 months, and the median OS was 65 months. (D,E) Forest plot showed multivariate Cox regression analyses that pN stage, pM stage, ISUP grade, and AJCC stage were still relevant to both PFS (pN stage: p = 0.004, pM stage: p = 0.011, ISUP grade: p < 0.001, AJCC stage: p = 0.002) and OS (pN stage: p = 0.009, pM stage: p = 0.006, ISUP grade: p = 0.002, AJCC stage: p < 0.001). Importantly, elevated FASN expression was significantly correlated with poor PFS (HR = 1.529, p = 0.005) and OS (HR = 1.450, p = 0.033) in 380 ccRCC patients from FUSCC cohort.
Univariate and Multivariate Cox Regression Analyses of the FUSCC Cohort
Univariate and multivariate Cox regression analyses were performed for 380 ccRCC patients in the FUSCC cohort. In univariate Cox regression analysis (Supplementary Table 1), traditional prognostic predictors, such as the TNM stage, ISUP grade, and AJCC stage, were markedly correlated to PFS (p < 0.001) and OS (p < 0.001) of ccRCC patients. Additionally, age at surgery and BMI were significantly related to PFS (p = 0.024, p = 0.017) and OS (p = 0.021, p = 0.012). Importantly, elevated FASN expression was significantly associated with poor PFS (HR = 1.854, p < 0.001) and OS (HR = 2.017, p < 0.001) of the 380 ccRCC patients in the FUSCC cohort.
In multivariate Cox regression analysis, pN stage, pM stage, ISUP grade, and AJCC stage were still relevant to both PFS (pN stage: p = 0.004; pM stage: p = 0.011; ISUP grade: p < 0.001; AJCC stage: p = 0.002) and OS (pN stage: p = 0.009; pM stage: p = 0.006; ISUP grade: p = 0.002; AJCC stage: p < 0.001). Importantly, elevated FASN expression was significantly correlated to poor PFS (HR = 1.529, p = 0.005) and OS (HR = 1.450, p = 0.033) of patients in the FUSCC cohort as displayed in forest plots (Figures 2D,E).
VAT% Is a More Accurate Obesity Indicator for ccRCC Patients in the FUSCC Cohort
To confirm that VAT% is a better prognostic predictor than BMI (Figure 3A) based on MRI scanning, we assessed correlations between VAT, BMI, and FASN mRNA expression. Pearson's correlation coefficient suggested that elevated FASN mRNA expression was positively correlated to VAT% (y = 1.18x + 71.36, r = 0.722, p < 0.0001; Figure 3B). Additionally, we assessed BMI in ccRCC patients of the FUSCC cohort. The results showed that the BMI of patients with low FASN expression was significantly higher than that of patients with high FASN expression (p = 0.0146; Figure 3C).
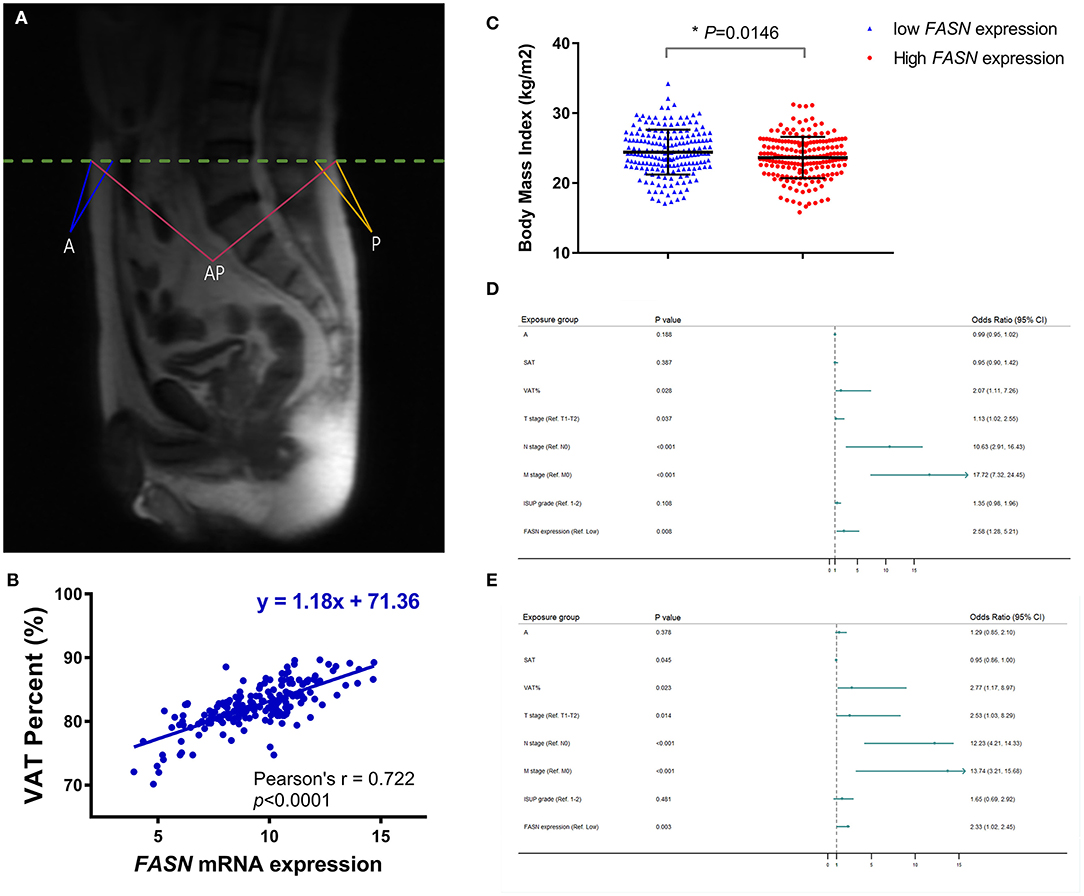
Figure 3. Anthropometric measurement of abdominal adipose and prognostic implication of VAT%. (A) The quantity of anthropometric measurements of SAT area was measured by MRI with T2-weighted sagittal localization images. (B) Pearson's correlation coefficient demonstrated that elevated FASN mRNA expression was positively correlated with the VAT% (r = 0.722, p < 0.0001). (C) BMI in ccRCC patients with low FASN expression is higher than that in patients with high expression of FASN (p = 0.0146). (D,E) In multivariate Cox regression analyses of PFS and OS in 117 ccRCC cases whose MRI scans were available from FUSCC cohort, high VAT% was significantly associated with poor PFS [HR = 2.066, p = 0.028; (D)] and OS [HR = 2.773, p = 0.023; (E)]. However, BMI was not an independent covariate affecting survival. In addition, advanced pT (HR = 1.132, p = 0.037), pN (HR = 10.63, p < 0.001), pM (HR = 17.72, p < 0.001), and FASN expression (HR = 2.578, p = 0.008) was significantly correlated with poorer PFS. SAT (HR = 0.955, p = 0.045), advanced pT (HR = 2.526, p = 0.014), pN (HR = 12.23, p < 0.001), pM (HR = 13.736, p < 0.001), and FASN expression (HR = 2.33, p = 0.003) was also markedly related with poor OS in 117 ccRCC cases.
Univariate Cox analysis indicated that SAT, VAT%, TNM stage, ISUP grade, and FASN expression were independent parameters for prognosis of 117 ccRCC patients (Supplementary Table 2). In multivariate Cox regression analyses of PFS and OS in 117 ccRCC cases whose MRI scans were available from the FUSCC cohort, a high VAT% was significantly associated with poor PFS (HR = 2.066, p = 0.028; Figure 3D) and OS (HR = 2.773, p = 0.023; Figure 3E). However, BMI was not an independent covariate that affected survival. Additionally, advanced pT (HR = 1.132, p = 0.037), pN (HR = 10.63, p < 0.001), pM (HR = 17.72, p < 0.001), and FASN expression (HR = 2.578, p = 0.008) were significantly correlated to poorer PFS (Figure 3D). SAT (HR = 0.955, p = 0.045), advanced pT (HR = 2.526, p = 0.014), pN (HR = 12.23, p < 0.001), pM (HR = 13.736, p < 0.001), and FASN expression (HR = 2.33, p = 0.003) were also significantly related to poor OS in 117 ccRCC cases (Figure 3E).
FASN Regulates Proliferation of ccRCC Cells
Metabolism reprogramming is a hallmark of cancer and crucial for the progression of ccRCC. We investigated FASN expression levels in A498 and 786O cells after transfection with normal control, FASN-RNAi1, FASN-RNAi2, and FASN overexpression (OE) plasmids in addition to cell viability and apoptosis. FASN mRNA and protein expression was significantly decreased in FASN-RNAi-transfected cells, but increased in the FASN OE-transfected groups of A498 and 786O cells (p < 0.05, Figures 4A,B, Supplementary Figure 1A). After the A498 and 786O cells were transfected for 5 days, CCK8 assays revealed that cell proliferation was significantly suppressed in the RNAi1- and RNAi2-transfected groups and significantly promoted in the OE groups compared with normal controls (p < 0.05) (Figures 4C,D).
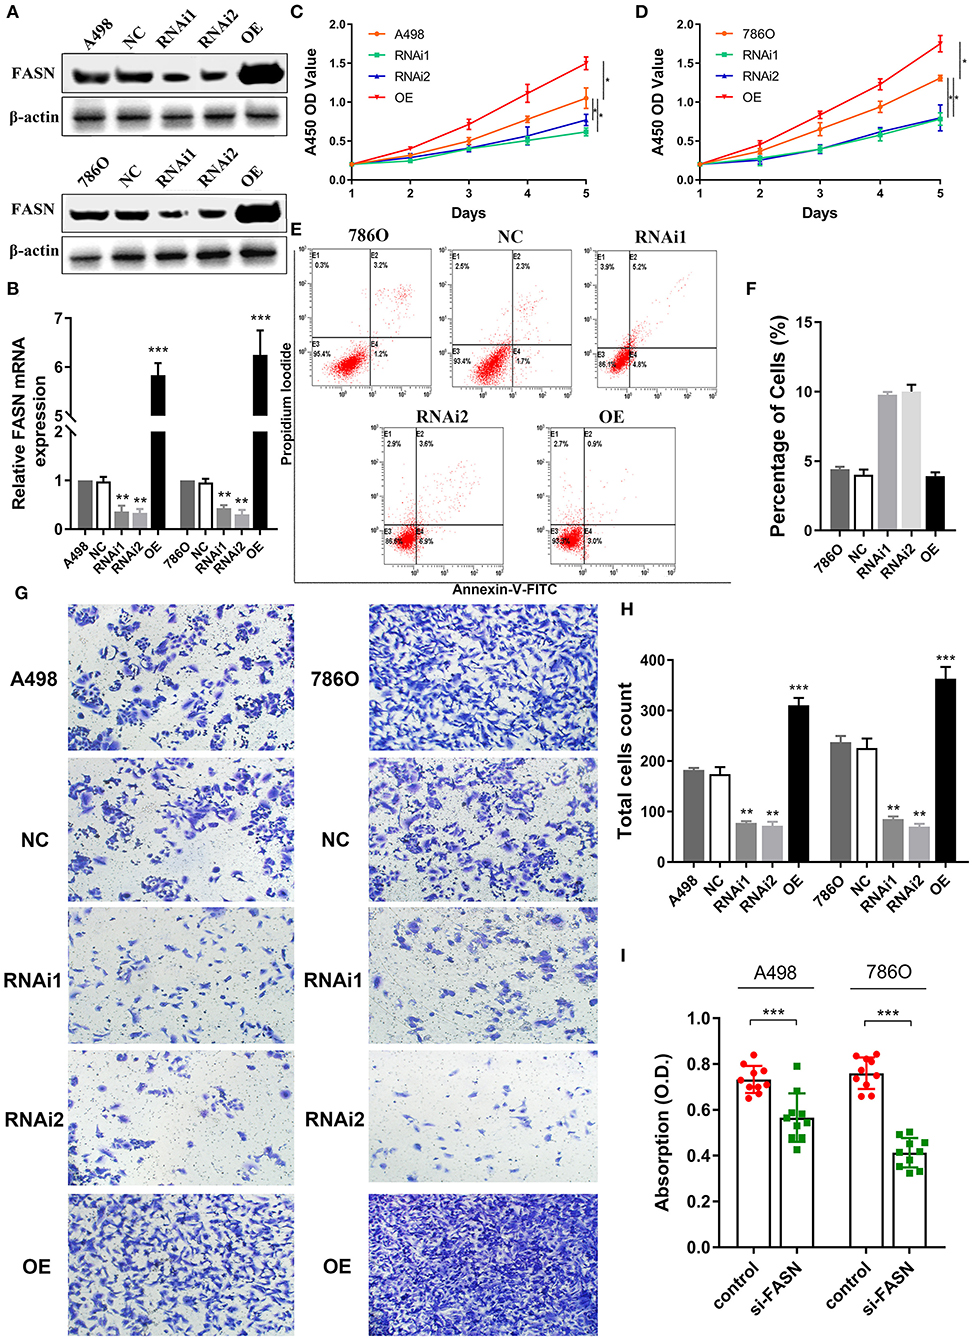
Figure 4. FASN regulates proliferation, migration, apoptosis, and lipid droplets formation of human ccRCC cells. (A,B) After transient transfected with FASN plasmid in normal control, FASN-RNAi1, FASN-RNAi2, and FASN overexpression (OE) groups, we investigated FASN mRNA and protein expression level in A498 and 786O cells and found significant differential expression levels in the RNAi1, RNAi2, and OE groups compared with A498 and 786O cells. (C,D) After the A498 and 786O cells were transfected for 5 days, the A450 OD values revealed that cells proliferation ability was significantly suppressed in the RNAi1 and RNAi2 groups and significantly promoted in the OE groups compared with normal control (p < 0.05). (E,F) The X and Y axes represent Annexin V-FITC and PI, respectively. Apoptotic cells number was increased in the RNAi1- and RNAi2-transfected groups compared with control in 786O cells, whereas the FASN OE groups showed similar apoptosis to normal control cells. (G,H) To explore the role of FASN-mediated migration ability of ccRCC cells, we performed transwell migration assay and found that the inhibition of FASN markedly restrained migrated cell numbers. Meanwhile, the OE of FASN significantly promotes migrated A498 and 786O cell counts. (I) To explore whether FASN regulates ccRCC cells lipid formations, we performed Oil Red O staining and found that inhibition of FASN significantly reduced absorption of lipid droplets in lipid-rich cells. *p < 0.05; **p < 0.01; ***p < 0.001; ****p < 0.0001.
Inhibition of FASN May Increase Apoptosis of 786O Cells
As shown in Figure 4E, we detected apoptosis in A498 and 786O cells of the NC, RNAi1, RNAi2, and OE groups. Annexin V-FITC (–) PI (–), E3, stands for normal cells; Annexin V-FITC (+) PI (–), E4, stands for early apoptotic cells; Annexin V-FITC (+) PI (+), E2, stands for late apoptotic cells; Annexin V-FITC (–) PI (+), E1, stands for mechanical necrotic cells. Apoptotic cells number was increased in the RNAi1- and RNAi2-transfected groups compared with control in 786O cells, whereas the FASN OE groups showed similar apoptosis to normal control cells (Figure 4F). Apoptotic cells number was increased in the RNAi1-transfected groups compared with control in A498 cells, whereas the FASN OE groups showed similar apoptosis to normal control (Supplementary Figures 1B,C).
FASN Regulates Cell Migration and Lipid Droplet Formation
To explore FASN-mediated migration of ccRCC cells, we performed transwell migration assays and found that inhibition of FASN markedly decreased migrated cell numbers (p < 0.05). Moreover, OE of FASN significantly increased migrated A498 and 786O cell numbers (Figures 4G,H). To explore whether FASN regulated lipid formation in ccRCC cells, we performed Oil Red O staining and found that inhibition of FASN significantly reduced absorption of lipid droplets in lipid-rich ccRCC cells (p < 0.001; Figure 4I).
Validation by IHC and Potential Signaling Pathways in vitro
Immunohistochemistry (IHC) staining was performed to validate differential expression levels between tumor and normal samples, which suggested a significantly elevated FASN staining density and intensity in ccRCC tissues compared with those in normal tissues (Figure 5A). Interestingly, GSEA also suggested that FASN, together with related hub genes, was significantly involved in epithelial–mesenchymal transition (EMT, NES = 2.073), which was consistent with FASN-mediated ccRCC cell migration (Figure 5B).
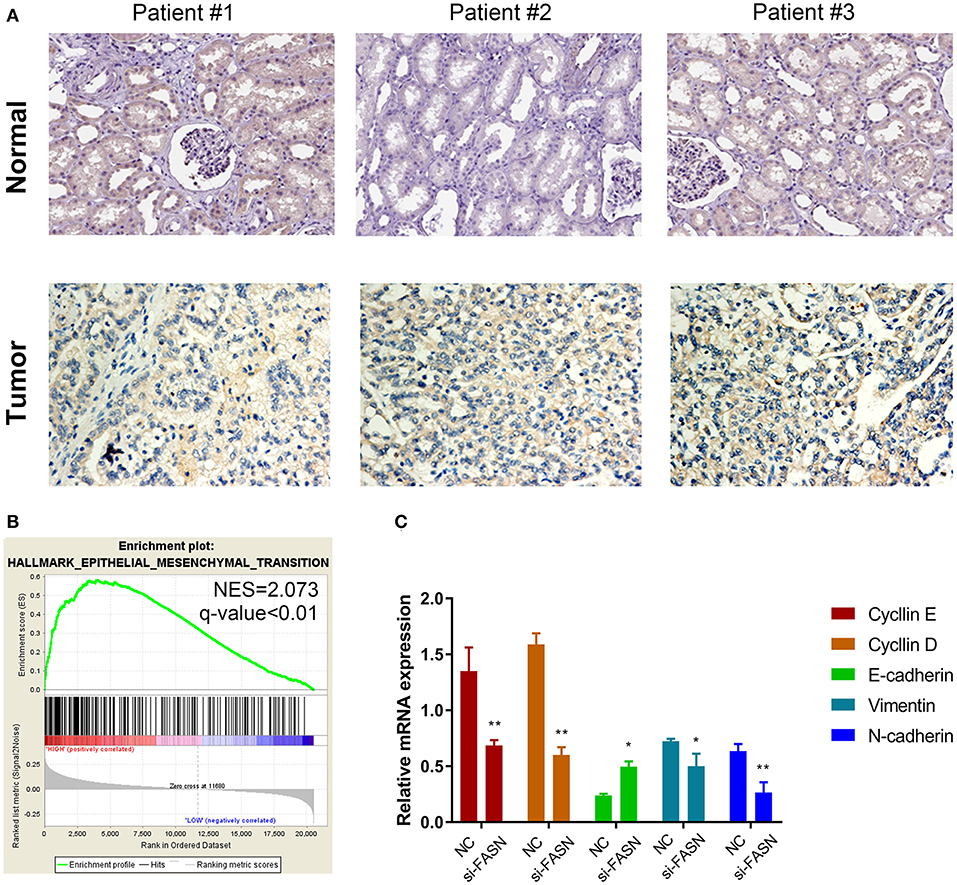
Figure 5. Proteomic validation of FASN and potential signal pathway (especially the EMT process) in vitro. (A) IHC staining was performed to validate differential expression levels between tumor and normal samples, suggesting a significantly elevated FASN staining density and intensity in ccRCC tissues compared with normal tissues. (B) GSEA also suggested that FASN, together with related hub genes, was significantly involved in epithelial–mesenchymal transition process (NES = 2.073), consistent with the role of FASN-mediated ccRCC cells migration ability. (C) RT-qPCR reveals differential mRNA expression of hub genes in epithelial–mesenchymal transformation process, including cyclin E, cyclin D, E-cadherin, vimentin, and N-cadherin. The finding indicated that inhibition of FASN significantly decreased cyclin E, cyclin D, vimentin, and N-cadherin expression (p < 0.05) and increased E-cadherin mRNA expression (p < 0.01). *p < 0.05; **p < 0.01; ***p < 0.001; ****p < 0.0001.
FASN Promotes Cell Migration by Regulating EMT
RT-qPCR revealed differential mRNA expression of hub genes in EMT, including cyclin E, cyclin D, E-cadherin, vimentin, and N-cadherin. The results indicated that inhibition of FASN significantly decreased cyclin E, cyclin D, vimentin, and N-cadherin expression (p < 0.05) and increased E-cadherin mRNA expression (p < 0.01; Figure 5C).
Functional Annotations and Predicted Signaling Pathways in silico
A PPI network of FASN and its coexpression genes was established, including ACACA, ACACB, ACLY, AASDHPPT, ACSL1, ACSL3, CDC5L, MCAT, OLAH, and SREBF1 (Figure 6A). As shown in Figure 6B, a bubble chart illustrated functional enrichment of 11 related genes. Significant genes involved in fatty acid biosynthetic process, fatty acid metabolic process, carboxylic acid, organic acid, and lipid biosynthetic process markedly participated in carboxylic acid binding and vitamin binding. After normalization of the 11-hub gene transcriptional data, clustering analysis was performed, and a heat map was constructed (Figure 6C). Functional annotations using ClueGO showed that changes in FASN biological processes were closely related to fatty acid biosynthesis, fatty acid biosynthetic process, and FASN activity (Figure 6D).
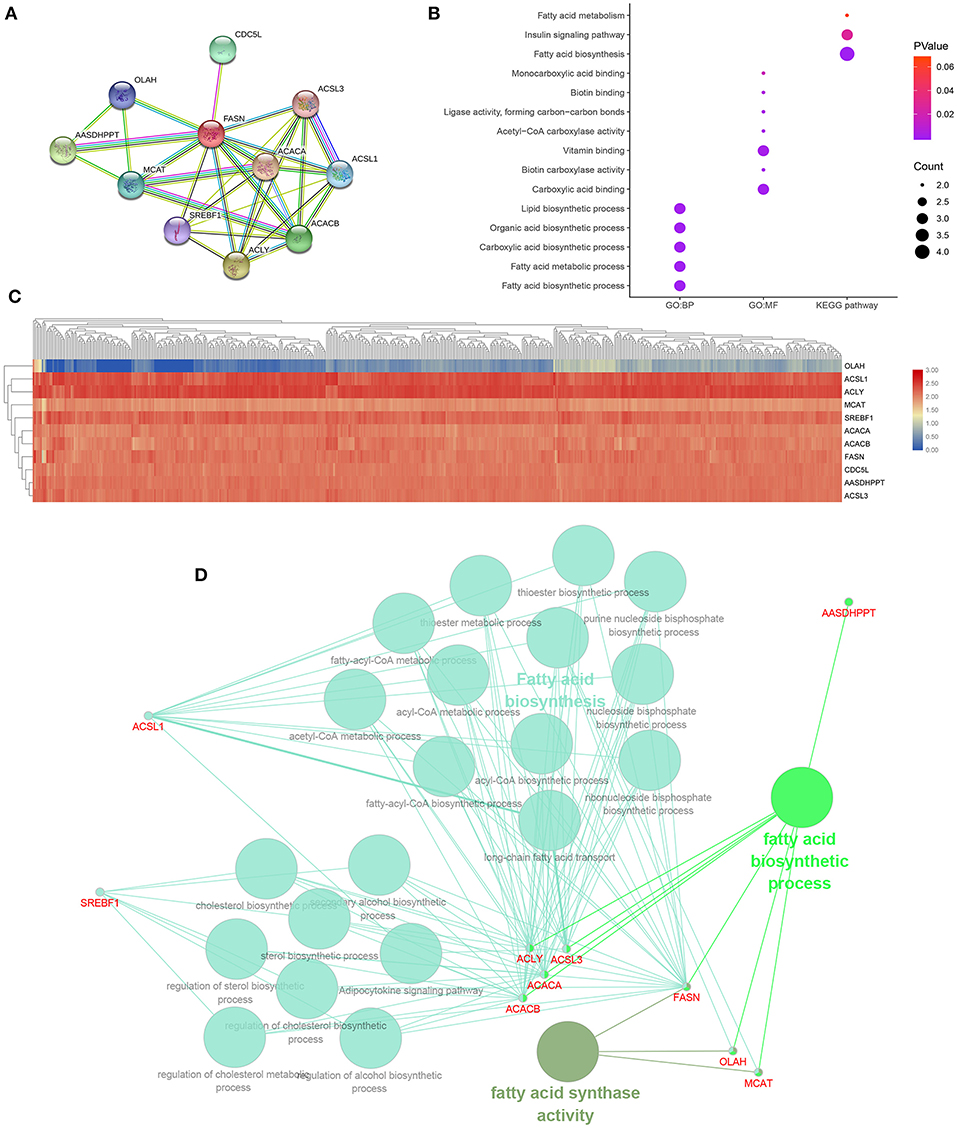
Figure 6. Functional annotations and predicted signaling pathways in silico. (A) A PPI network of FASN and its co-expression genes was established, including ACACA, ACACB, ACLY, AASDHPPT, ACSL1, ACSL3, CDC5L, MCAT, OLAH, and SREBF1. (B) Functional enrichment analyses of a total of 11 involved genes were performed and visualized in a bubble chart. Significant genes involved in fatty acid biosynthetic process, fatty acid metabolic process, carboxylic acid, organic acid, and lipid biosynthetic process markedly participated in carboxylic acid binding and vitamin binding. (C) Horizontal and vertical cluster analyses were performed in 533 ccRCC samples from TCGA database and 11 related genes, and the heat map was obtained after standardization. (D) Functional annotation using ClueGO indicated that changes in the biological processes of the FASN were significantly associated with fatty acid biosynthesis, fatty acid biosynthetic process, and fatty acid synthase activity.
Significant Genes and Pathways Predicted by GSEA
A total of 100 significant genes were obtained from GSEA, and genes with positive and negative correlations were plotted. The results illustrated that the most significant pathways included E2F targets, down-regulation of Kras signaling, the estrogen response, and G2M checkpoint (Figures 7A–F). Additionally, a heat map showed the transcriptional expression profiles of the 100 most significantly up- or down-regulated genes (Figure 7G).
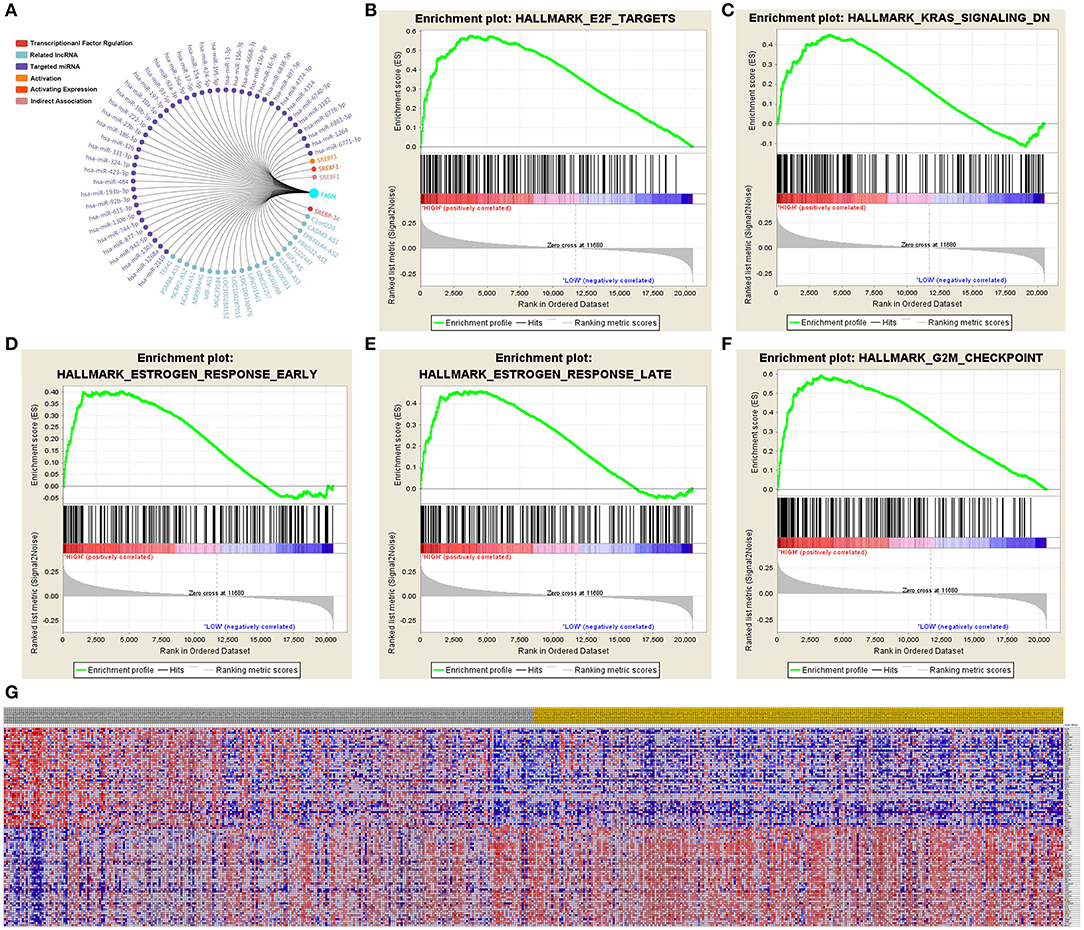
Figure 7. Significant related genes and hallmarks pathways in ccRCC predicted by GSEA. (A–F) The most significant pathways include E2F targets, down-regulation of Kras signaling, estrogen response, and G2M checkpoint. (G) Transcriptional expression profiles of a total of 100 significant genes with positive and negative correlation were performed in a heat map.
Non-targeted Metabolomics Reveals Significant Metabolites and Related Pathways of FASN in 786O Cells
PLS-DA-Permutation analysis suggested marked opposition of the two sets of samples after inhibition of FASN expression in 786O cells (Figure 8A). A volcano plot suggested significant metabolites with a p-value of less than 0.05 and log2|Fold Change| higher than 1 (Figure 8B). Non-targeted metabolomics found that decreased de novo lipogenesis might be required to sustain elevations in glycolytic activity in 786O cells via regulating galactinol, DL-lactate, N-acetylaspartylglutamate (NAAG), and sucrose or other significantly involved metabolic pathways, such as pantetheine and adrenic acid (Figure 8C). Correlation analysis between all significantly involved pathways is shown in Figure 8D.
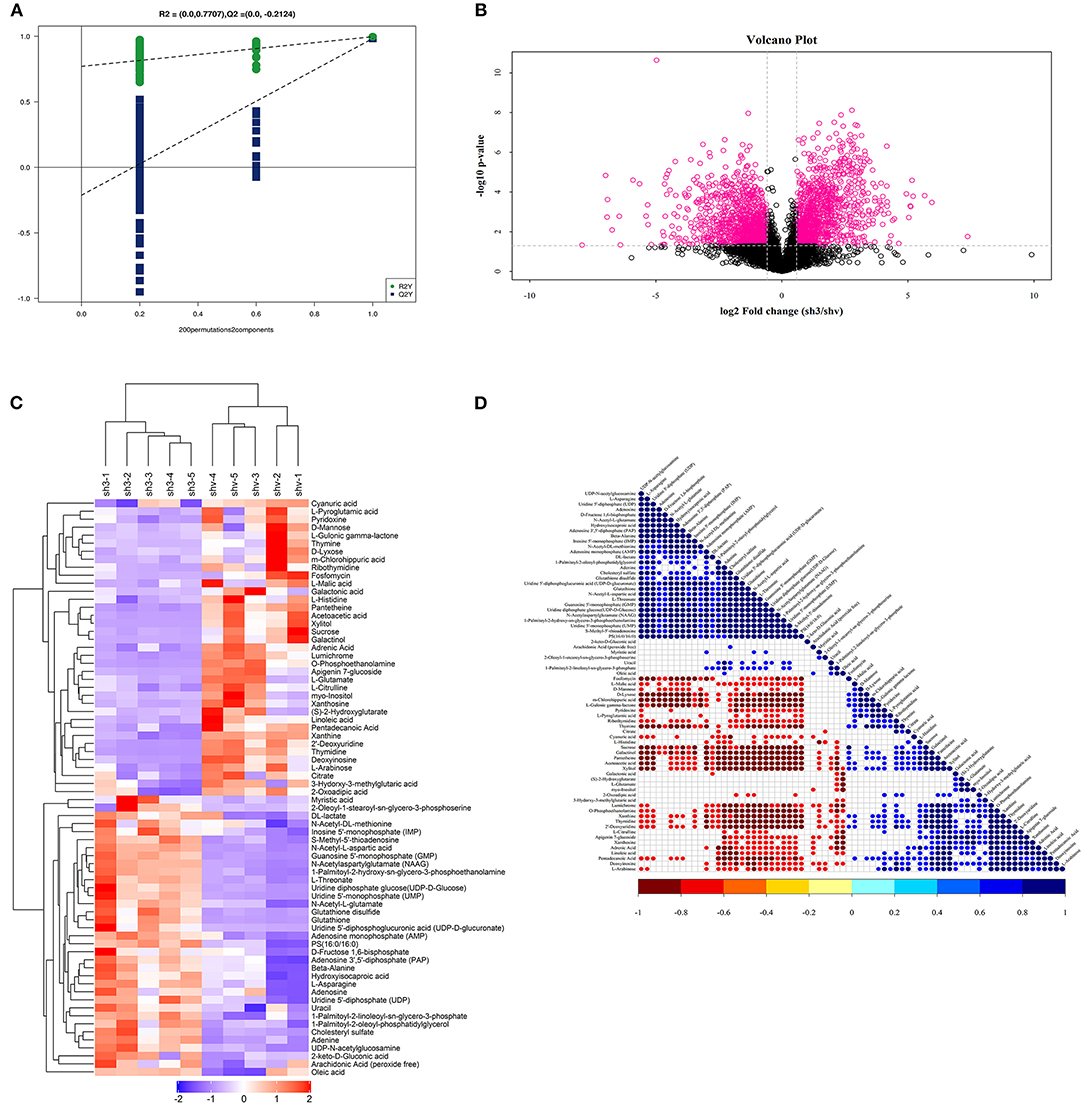
Figure 8. Non-targeted metabolomics reveals significant metabolites and related pathways FASN involved in 786O cells. (A) PLS-DA-Permutation analysis suggested marked opposition of the two sets of samples after inhibition of FASN expression in 786O cells. (B) Volcano plot suggested significant metabolites with p value < 0.05 and log2|Fold Change| higher than 1. (C) Non-targeted metabolomics found that decreased de novo lipogenesis might be required to sustain elevations in glycolytic activity in 786O cells via regulating galactinol, DL-lactate, N-acetylaspartylglutamate (NAAG), and sucrose or other significantly involved metabolic pathways, such as pantetheine and adrenic acid. (D) Correlation analysis between all significantly involved pathways.
Discussion
In this study, we investigated whether FASN mRNA expression has potential implications in ccRCC patients and its association with the abdominal adipose distribution. To clarify differential FASN mRNA expression in ccRCC, we examined differential FASN expression between tumor and normal paracancerous tissues and identified prognostic value in 913 ccRCC patients of TCGA and FUSCC cohorts. Next, we assessed anthropometric measurements of adipose distribution based on MRI, which suggested that FASN mRNA expression was significantly associated with an elevated VAT%. Importantly, ccRCC patients with up-regulated FASN mRNA expression had significantly poor PFS and OS. Additionally, after transfection efficiency was verified, we found that transient inhibition or OE of FASN significantly regulated A498 and 786O cell proliferation and migration by regulating EMT. Inhibition of FASN resulted in a high apoptotic rate and decreased lipid droplet formation in ccRCC cells.
The correlation between adipose-related genes and tumors has raised new concerns in terms of tumor microenvironment. Several previous studies have elaborated the role of lipid metabolism in tumorigenesis (Calle et al., 2003). Mechanically, obesity leads to overactivation of macrophages in adipose tissue and up-regulation of carcinogenic compounds by changing the signal transmission between adipocytes and other cells (Wright and Simone, 2016). More importantly, FASN is involved in the process of lipid metabolism and highly expressed in tumor cells. Several studies have suggested that FASN-mediated de novo synthesis of lipids may be a reasonable therapeutic target for the treatment of cancer and adiposity (Bouchi et al., 2015; Higuchi et al., 2017).
Compared with the traditional predictor BMI, this study demonstrated that VAT% is a more accurate risk indicator of obesity related to ccRCC. Although BMI has been accepted to be a risk factor of obesity, it has been challenged because of its rough estimation, including region, ethnic diversity, and failing to distinguish fat distribution (Wang et al., 2014; Xu et al., 2019a). MRI was used to measure SAT as a preoperative examination for RCC patients, and then VAT% was calculated. Although computed tomography is considered to be the standard imaging method to measure abdominal obesity, MRI has advantages of high accuracy and safety (Klopfenstein et al., 2012; Poonawalla et al., 2013; Schaudinn et al., 2015). The thickness of abdominal obesity varies at different levels and should be measured at the level of the umbilicus to reduce the deviation caused by the measurement method.
Non-targeted, high throughput metabolomic profiling deeply analyzes changes of metabolites in the tumor microenvironment, which guide the process of tumor progression and metabotypes (Dubuis et al., 2017). In this study, non-targeted metabolomics showed that decreased de novo lipogenesis might be required to sustain elevations in glycolytic activity of 786O cells by regulating galactinol, DL-lactate, NAAG, and sucrose, thereby participating in carcinogenesis and progression of ccRCC. Therefore, in-depth research on the pathological mechanism of FASN may facilitate the analysis of the temporal and spatial dynamics of metabolites and metabolic networks (Dumas et al., 2016; Vantaku et al., 2019).
The advantage of our study is that we first assessed the expression level of FASN mRNA in ccRCC tumor and para-cancerous tissues in two cohorts. Additionally, we found that ccRCC patients with elevated FASN mRNA expression had poor PFS and OS, which were consistent with a previous study (Horiguchi et al., 2008). Next, we investigated the correlation between FASN expression and the abdominal obesity distribution, especially VAT% that serves as a more representative indicator than BMI to investigate individual adipose distribution of ccRCC patients. Our results showed that expression of FASN mRNA was significantly associated with the abdominal adipose distribution and especially positively correlated to increased VAT%. Additionally, we performed functional annotations of FASN in ccRCC and its associated signal hallmarks in vitro and in silico.
However, this study had several limitations. First, our study did not clarify the underlying mechanism of FASN in cellular lipid metabolism of ccRCC. Second, the abdominal obesity distribution was measured by MRI, and VAT% was directly calculated in this study. This measurement method may cause some bias and incur additional costs for patients, whereas only 117 patients had undergone MRI scans. Another limitation in this study is that generalizability and population variety may not be conclusive enough to firmly support our results based on 913 ccRCC patients in FUSCC and TCGA cohorts.
Conclusion
This study demonstrated that FASN expression is positively related to aggressive cell proliferation, migration, apoptosis, and lipid droplet formation and regulates metabolic disorders of the ccRCC microenvironment. Additionally, we revealed that elevated FASN mRNA expression was significantly correlated to abdominal obesity distribution, especially VAT%, which is also a significant predictor of a poor prognosis for ccRCC patients.
Data Availability Statement
The raw data supporting the conclusions of this article will be made available by the authors, without undue reservation.
Ethics Statement
The studies involving human participants were reviewed and approved by Fudan University Shanghai Cancer Center. The patients/participants provided their written informed consent to participate in this study. Written informed consent was obtained from the individual(s) for the publication of any potentially identifiable images or data included in this article.
Author Contributions
WX, AA, WL, and XT: conceptualization and validation. WX, AA, XT, JW, and WZ: data curation. WX, AA, XH, WL, JW, and WZ: formal analysis and investigation. Y-YQ, HZ, and DY: funding acquisition and writing—review and editing. WX, AA, XH, JW, and WZ: methodology. FW, XH, and GS: project administration and resources. XT, FW, and GS: software. FW, XH, GS, Y-YQ, HZ, and DY: supervision. WX, AA, XH, WL, and XT: visualization. WX, AA, and XH: roles/writing—original draft. All authors contributed to the article and approved the submitted version.
Funding
This work was supported by grants from the National Key Research and Development Program of China (No. 2019YFC1316000), Natural Science Foundation of Shanghai (No. 20ZR1413100), National Natural Science Foundation of China (No. 81802525), and Shanghai Municipal Health Commission Project (2020CXJQ03).
Conflict of Interest
The authors declare that the research was conducted in the absence of any commercial or financial relationships that could be construed as a potential conflict of interest.
Acknowledgments
We are grateful to all patients for their dedicated participation in the current study. We thank Mitchell Arico from Liwen Bianji, Edanz Group China (www.liwenbianji.cn/ac) for editing the English text of a draft of this manuscript.
Supplementary Material
The Supplementary Material for this article can be found online at: https://www.frontiersin.org/articles/10.3389/fmolb.2020.610229/full#supplementary-material
Abbreviations
PFS, progression-free survival; OS, overall survival; FUSCC, Fudan University Shanghai Cancer Center; SAT, subcutaneous adipose tissue; VAT, visceral adipose tissue; HR, hazard ratio; CI, confidence interval; MRI, magnetic resonance imaging; BMI, body mass index; ISUP, International Society of Urological Pathology; AJCC, American Joint Committee on Cancer; PPI, protein–protein interaction; GSEA, gene set enrichment analysis; IHC, immunohistochemistry.
References
Bouchi, R., Takeuchi, T., Akihisa, M., Ohara, N., Nakano, Y., Nishitani, R., et al. (2015). High visceral fat with low subcutaneous fat accumulation as a determinant of atherosclerosis in patients with type 2 diabetes. Cardiovasc. Diabetol. 14:136. doi: 10.1186/s12933-015-0302-4
Britton, K. A., Massaro, J. M., Murabito, J. M., Kreger, B. E., Hoffmann, U., and Fox, C. S. (2013). Body fat distribution, incident cardiovascular disease, cancer, and all-cause mortality. J. Am. Coll. Cardiol. 62, 921–925. doi: 10.1016/j.jacc.2013.06.027
Calle, E. E., Rodriguez, C., Walker-Thurmond, K., and Thun, M. J. (2003). Overweight, obesity, and mortality from cancer in a prospectively studied cohort of U.S. adults. N. Engl. J. Med. 348, 1625–1638. doi: 10.1056/NEJMoa021423
Choi, Y., Park, B., Jeong, B. C., Seo, S. I., Jeon, S. S., Choi, H. Y., et al. (2013). Body mass index and survival in patients with renal cell carcinoma: a clinical-based cohort and meta-analysis. Int. J. Cancer 132, 625–634. doi: 10.1002/ijc.27639
Dubuis, S., Baenke, F., Scherbichler, N., Alexander, L. T., Schulze, A., and Zamboni, N. (2017). Metabotypes of breast cancer cell lines revealed by non-targeted metabolomics. Metab. Eng. 43(Pt B), 173–186. doi: 10.1016/j.ymben.2016.12.009
Dumas, M. E., Domange, C., Calderari, S., Martínez, A. R., Ayala, R., Wilder, S. P., et al. (2016). Topological analysis of metabolic networks integrating co-segregating transcriptomes and metabolomes in type 2 diabetic rat congenic series. Genome Med. 8:101. doi: 10.1186/s13073-016-0352-6
Higuchi, S., Kabeya, Y., and Kato, K. (2017). Visceral-to-subcutaneous fat ratio is independently related to small and large cerebrovascular lesions even in healthy subjects. Atherosclerosis 259, 41–45. doi: 10.1016/j.atherosclerosis.2017.03.001
Horiguchi, A., Asano, T., Asano, T., Ito, K., Sumitomo, M., and Hayakawa, M. (2008). Fatty acid synthase over expression is an indicator of tumor aggressiveness and poor prognosis in renal cell carcinoma. J. Urol. 180, 1137–1140. doi: 10.1016/j.juro.2008.04.135
Ibrahim, M. M. (2010). Subcutaneous and visceral adipose tissue: structural and functional differences. Obes. Rev. 11, 11–18. doi: 10.1111/j.1467-789X.2009.00623.x
Klopfenstein, B. J., Kim, M. S., Krisky, C. M., Szumowski, J., Rooney, W. D., and Purnell, J. Q. (2012). Comparison of 3 T MRI and CT for the measurement of visceral and subcutaneous adipose tissue in humans. Br. J. Radiol. 85, e826–e830. doi: 10.1259/bjr/57987644
Ludescher, B., Machann, J., Eschweiler, G. W., Vanhöfen, S., Maenz, C., and Thamer, C. (2009). Correlation of fat distribution in whole body MRI with generally used anthropometric data. Invest. Radiol. 44, 712–719. doi: 10.1097/RLI.0b013e3181afbb1e
Menendez, J. A., and Lupu, R. (2007). Fatty acid synthase and the lipogenic phenotype in cancer pathogenesis. Nat. Rev. Cancer 7, 763–777. doi: 10.1038/nrc2222
Motamedinia, P., Korets, R., Spencer, B. A., Benson, M. C., and McKiernan, J. M. (2008). Body mass index trends and role of obesity in predicting outcome after radical prostatectomy. Urology 72, 1106–1110. doi: 10.1016/j.urology.2008.04.021
Ogino, S., Nosho, K., Meyerhardt, J. A., Kirkner, G. J., Chan, A. T., Kawasaki, T., et al. (2008). Cohort study of fatty acid synthase expression and patient survival in colon cancer. J. Clin. Oncol. 26, 5713–5720. doi: 10.1200/JCO.2008.18.2675
Peterson, M. D., Al Snih, S., Stoddard, J., Shekar, A., and Hurvitz, E. A. (2014). Obesity misclassification and the metabolic syndrome in adults with functional mobility impairments: Nutrition Examination Survey 2003-2006. Prev. Med. 60, 71–76. doi: 10.1016/j.ypmed.2013.12.014
Poonawalla, A. H., Sjoberg, B. P., Rehm, J. L., Hernando, D., Hines, C. D., Irarrazaval, P., et al. (2013). Adipose tissue MRI for quantitative measurement of central obesity. J. Magn. Reson. Imaging 37, 707–716. doi: 10.1002/jmri.23846
Renehan, A. G., Tyson, M., Egger, M., Heller, R. F., and Zwahlen, M. (2008). Body-mass index and incidence of cancer: a systematic review and meta-analysis of prospective observational studies. Lancet 371, 569–578. doi: 10.1016/S0140-6736(08)60269-X
Schaudinn, A., Linder, N., Garnov, N., Kerlikowsky, F., Blüher, M., Dietrich, A., et al. (2015). Predictive accuracy of single- and multi-slice MRI for the estimation of total visceral adipose tissue in overweight to severely obese patients. NMR Biomed. 28, 583–590. doi: 10.1002/nbm.3286
Siegel, R. L., Miller, K. D., and Jemal, A. (2019). Cancer statistics, 2019. CA Cancer J. Clin. 69, 7–34. doi: 10.3322/caac.21551
Srigley, J. R., Delahunt, B., Eble, J. N., Egevad, L., Epstein, J. I., Grignon, D., et al. (2013). The International Society of Urological Pathology (ISUP) vancouver classification of renal neoplasia. Am. J. Surg. Pathol. 37, 1469–1489. doi: 10.1097/PAS.0b013e318299f2d1
Thomas, E. L., Frost, G., Taylor-Robinson, S. D., and Bell, J. D. (2012). Excess body fat in obese and normal-weight subjects. Nutr. Res. Rev. 25, 150–161. doi: 10.1017/S0954422412000054
Tomiyama, A. J., Hunger, J. M., Nguyen-Cuu, J., and Wells, C. (2016). Misclassification of cardiometabolic health when using body mass index categories in NHANES 2005-2012. Int. J. Obes. 40, 883–886. doi: 10.1038/ijo.2016.17
Vantaku, V., Donepudi, S. R., Piyarathna, D. W. B., Amara, C. S., Ambati, C. R., Tang, W., et al. (2019). Large-scale profiling of serum metabolites in African American and European American patients with bladder cancer reveals metabolic pathways associated with patient survival. Cancer 125, 921–932. doi: 10.1002/cncr.31890
Wang, H. K., Song, X. S., Cheng, Y., Qu, Y. Y., Zhang, S. L., Dai, B., et al. (2014). Visceral fat accumulation is associated with different pathological subtypes of renal cell carcinoma (RCC): a multicentre study in China. BJU Int. 114, 496–502. doi: 10.1111/bju.12592
Wright, C., and Simone, N. L. (2016). Obesity and tumor growth: inflammation, immunity, and the role of a ketogenic diet. Curr. Opin. Clin. Nutr. Metab. Care 19, 294–299. doi: 10.1097/MCO.0000000000000286
Xu, W. H., Qu, Y. Y., Wang, J., Wang, H. K., Wan, F. N., Zhao, J. Y., et al. (2019a). Elevated CD36 expression correlates with increased visceral adipose tissue and predicts poor prognosis in ccRCC patients. J. Cancer 10, 4522–4531. doi: 10.7150/jca.30989
Xu, W. H., Shi, S. N., Xu, Y., Wang, J., Wang, H. K., Cao, D. L., et al. (2019b). Prognostic implications of Aquaporin 9 expression in clear cell renal cell carcinoma. J. Transl. Med. 17, 363. doi: 10.1186/s12967-019-2113-y
Xu, W. H., Xu, Y., Tian, X., Anwaier, A., Liu, W. R., Wang, J., et al. (2020). Large-scale transcriptome profiles reveal robust 20-signatures metabolic prediction models and novel role of G6PC in clear cell renal cell carcinoma. J. Cell Mol. Med. 24, 9012–9027. doi: 10.1111/jcmm.15536
Keywords: FASN, visceral adipose tissue, clear cell renal cell carcinoma, prognosis, metabolism, obesity
Citation: Xu W, Hu X, Anwaier A, Wang J, Liu W, Tian X, Zhu W, Ma C, Wan F, Shi G, Qu Y-Y, Zhang H and Ye D (2021) Fatty Acid Synthase Correlates With Prognosis-Related Abdominal Adipose Distribution and Metabolic Disorders of Clear Cell Renal Cell Carcinoma. Front. Mol. Biosci. 7:610229. doi: 10.3389/fmolb.2020.610229
Received: 25 September 2020; Accepted: 04 December 2020;
Published: 25 January 2021.
Edited by:
Satyendra Chandra Tripathi, All India Institute of Medical Sciences, Nagpur, IndiaReviewed by:
Ninjit Dhanota, Weill Cornell Medicine, United StatesVinod Nadella, National Institutes of Health (NIH), United States
Copyright © 2021 Xu, Hu, Anwaier, Wang, Liu, Tian, Zhu, Ma, Wan, Shi, Qu, Zhang and Ye. This is an open-access article distributed under the terms of the Creative Commons Attribution License (CC BY). The use, distribution or reproduction in other forums is permitted, provided the original author(s) and the copyright owner(s) are credited and that the original publication in this journal is cited, in accordance with accepted academic practice. No use, distribution or reproduction is permitted which does not comply with these terms.
*Correspondence: Yuan-Yuan Qu, cXV5eTE5ODdAMTYzLmNvbQ==; Hailiang Zhang, emhhbmdobDkxOEAxNjMuY29t; Dingwei Ye, ZHd5ZWxpZUAxNjMuY29t
†These authors have contributed equally to this work