 Junyu Huo
 Liqun Wu*
- Liver Disease Center, The Affiliated Hospital of Qingdao University, Qingdao, China
Introduction: Tumor mutation burden (TMB) is an emerging biomarker for immunotherapy of hepatocellular carcinoma (HCC), but its value for clinical application has not been fully revealed.
Materials and Methods: We used the Wilcox test to identify the differentially expressed immune-related genes (DEIRGs) in groups with high and low TMB as well as screened the immune gene pairs related to prognosis using univariate Cox regression analysis. A LASSO Cox regression prognostic model was developed by combining The Cancer Genome Atlas Liver Hepatocellular Carcinoma (TCGA-LIHC) with the International Cancer Genome Consortium (ICGC) LIRI-JP cohort, and internal (TCGA, ICGC) and external (GSE14520) validation analyses were conducted on the predictive value of the model. We also explored the relationship between the prognostic model and tumor microenvironment via the ESTIMATE algorithm and performed clinical correlation analysis by the chi-square test, revealing its underlying molecular mechanism with the help of Gene Set Enrichment Analysis (GSEA).
Results: The prognostic model consisting of 15 immune gene pairs showed high predictive value for short- and long-term survival of HCC in three independent cohorts. Based on univariate multivariate Cox regression analysis, the prognostic model could be used to independently predict the prognosis in each independent cohort. The immune score, stromal score, and estimated score values were lower in the high-risk group than in the low-risk group. As shown by the chi-square test, the prognostic model exhibited an obvious correlation with the tumor stage [American Joint Committee on Cancer tumor–node–metastasis (AJCC-TNM) (p < 0.001), Barcelona Clinic Liver Cancer (BCLC) (p = 0.003)], histopathological grade (p = 0.033), vascular invasion (p = 0.009), maximum tumor diameter (p = 0.013), and background of liver cirrhosis (p < 0.001). GSEA revealed that the high-risk group had an enrichment of many oncology features, including the cell cycle, mismatch repair, DNA replication, RNA degradation, etc.
Conclusion: Our research developed and validated a reliable prognostic model associated with TMB for HCC, which may help to further enrich the therapeutic targets of HCC.
Introduction
Hepatocellular carcinoma (HCC) is the most frequent primary liver malignancy (more than 90%) and is often accompanied by chronic hepatitis or cirrhosis (Kanwal and Singal, 2019). Because of the hidden and rapid progress of HCC, most of the patients were diagnosed in the middle and advanced stages, and a considerable proportion of early HCC patients who received surgical treatment experienced relapse (Imamura et al., 2003), so the prognosis remains very poor.
Recently, as science and technology have developed continuously, the treatment of HCC is also constantly updated. In addition to traditional hepatectomy, chemotherapy, radiotherapy, liver transplantation, transcatheter arterial chemoembolization, ablation and other treatments, targeted therapies such as sorafenib, lenvatinib, and regorafenib are also gradually applied in clinical practice, but there is still a lack of effective methods for the treatment of advanced HCC (Couri and Pillai, 2019). Immunotherapy is a new way to treat HCC (Floudas et al., 2019), in which immunosuppressive checkpoint inhibitors have become a potential effective treatment for patients with advanced HCC (El Dika et al., 2019).
Tumor mutation burden (TMB) is defined as the total replacement and insertion/deletion mutation number for each megabase in the exon coding region regarding the evaluated gene of a tumor sample (Galuppini et al., 2019). It is a new biomarker for predicting the benefit of the treatment of tumor immune checkpoint inhibitors (ICIs) for various kinds of tumors (Goodman et al., 2017), such as lung cancer, colorectal cancer, prostate cancer, and breast cancer (Antonarakis, 2019; Schrock et al., 2019; Alborelli et al., 2020; Jang et al., 2020). Although increasing evidence has shown that the higher the TMB is, the more new antigens can be recognized by T cells and the better the effect of immunotherapy is (Kim et al., 2019), research on the interaction between TMB and HCC prognosis is still relatively insufficient.
This study focused on exploring the prognostic value of the TMB for HCC and identified immune-related genes correlated with TMB levels. A prognostic model of 15 immune-related gene pairs associated with tumor mutation burden for HCC was developed and validated in this research. In addition, we found that the prognosis model was related to the tumor microenvironment through the ESTIMATE algorithm, which is of great significance for precisely treating HCC.
Materials and Methods
Data Collection
A total of 801 HCC patients with complete prognostic information from three independent datasets were included in this study, and the number of cases in each independent dataset was more than 200. We obtained the RNA sequencing and gene mutation profile and clinical information from The Cancer Genome Atlas Liver Hepatocellular Carcinoma (TCGA-LIHC)1 and International Cancer Genome Consortium (ICGC), LIRI-JP)2, datasets, respectively. The gene expression files of the two datasets were all based on the Illumina HiSeq RNA Seq platform, and we merged them into one cohort for subsequent analyses. The gene expression files and corresponding clinical data were downloaded from the Gene Expression Omnibus (GEO-GSE14520) database3 for external validation. To exclude other factors influencing patient survival, our study did not include patients with a survival time of <1 month. The clinical information of HCC patients is shown in Supplementary Table S1. The acquisition of the above data fully complied with the access regulations and use principles of the above database. Figure 1 displays the workflow.
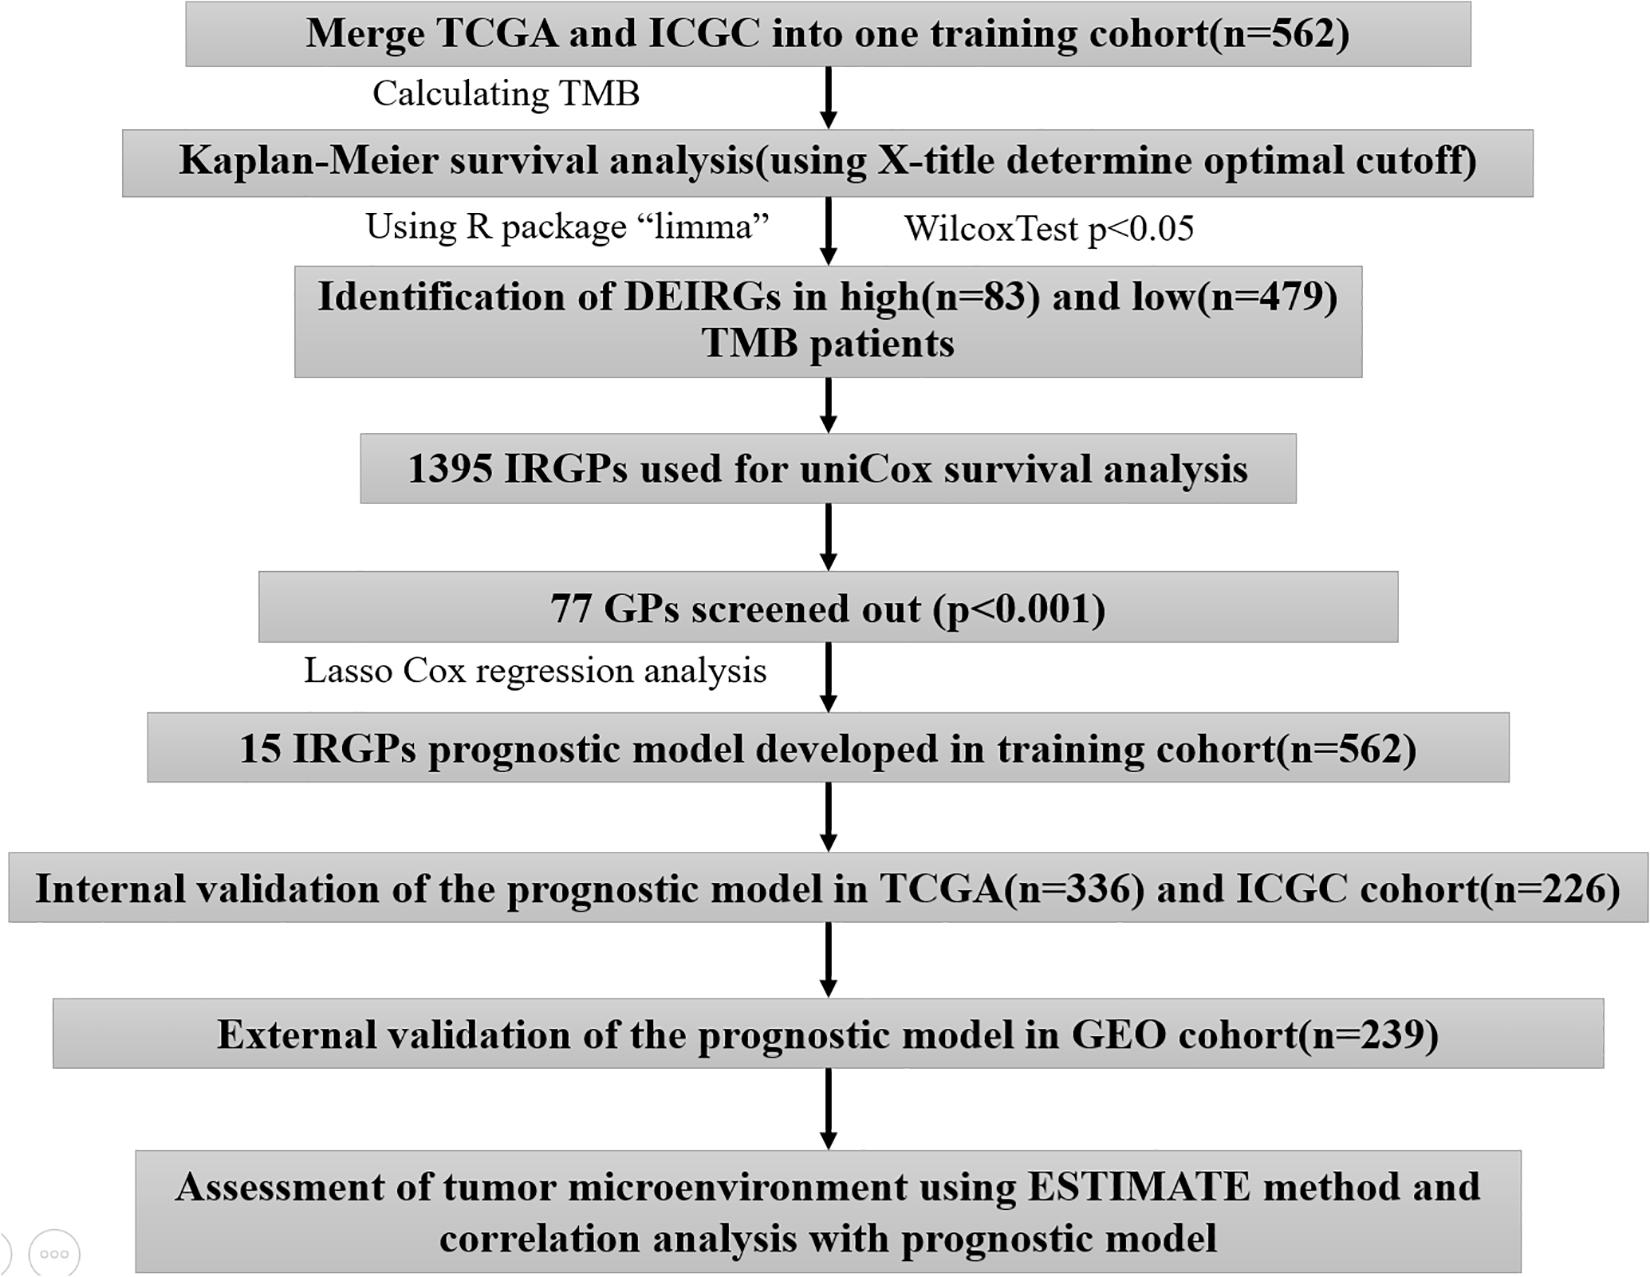
Figure 1. The workflow chart of this study.
Immune Gene Identification Related to TMB
We calculated the TMB with a Perl script based on the somatic mutation file of the TCGA-ICGC cohort (Zhang et al., 2019). The gene mutation waterfall map generated with the R package “GenVisR” and the optimal cutoff derived from X-title analysis were investigated to determine the association of the TMB with survival outcomes (Zhang et al., 2013; Ye et al., 2017). The cutoff value was taken into account to divide patients into high- and low-TMB groups. Then, we estimated the fraction of the 22 subtype immune cells in every sample through the CIBERSORT algorithm. The CIBERSORT algorithm has the function of estimating complicated tissue cell composition according to standardized gene expression data (Chen et al., 2018). The results of flow cytometry showed that CIBERSORT can accurately predict the composition of immune cells in HCC tissues (Newman et al., 2015). The Wilcoxon rank-sum test assisted in comparing the difference between the two groups with regard to the immune infiltrate abundance by virtue of the R package “vioplot.” A gene list related to immunity came from the Immunology Database and Analysis Portal (ImmPort)4, which provides essential immunology data for studying cancer (Dunn et al., 2015). We used the Wilcoxon test in the R package “limma” to screen the differentially expressed immune genes (DEIRGs) between the two groups with the criteria of FDR < 0.05. The R package “clusterProfiler” was used to annotate the biological process in which DEIRGs participate.
Construction and Validation of the LASSO Cox Regression Immune Gene Pair Prognostic Model
We paired the DEIRGs. In each immune gene pair (IGP), when the former gene exhibited a higher expression relative to the latter gene, the value was assigned to 1. In contrast, if the expression level of the former gene was lower than that of the latter gene, the value was assigned to 0, and immune gene pairs with a proportion of “0” or “1” <20% were excluded. This approach was a major advantage in our study because the IGPs were generated by a pairwise comparison and were entirely based on the gene expression in the same patient, which can overcome the batch effects of the different platforms and does not require the data to be scaled and normalized. A total of 1,395 IGPs were obtained after screening. Univariate Cox regression analysis was performed to identify the immune gene pairs associated with prognosis (p < 0.001). Prognostic-associated IGPs obtained from the univariate Cox regression analysis assisted in constructing the least absolute shrinkage and selection operator (LASSO) Cox regression model. The LASSO algorithm with penalty parameter tuning performed via a 10-fold cross-validation was applied to exclude IGPs that may be highly correlated with other IGPs. A subset of IGPs was determined by shrinking the regression coefficient using a penalty proportional to their size. The IGPs with non-zero regression coefficients were retained for subsequent multivariate Cox regression analyses. A risk score model was constructed using the value of these prognostic IGPs with the regression coefficient (β) from the multivariate Cox proportional hazards regression analysis. The “glmnet” R package was used for LASSO regression analysis of prognostic IGPs. The median risk score was used to classify patients into groups with high and low risks. The R package “survminer” and “survivalROC” helped to generate the Kaplan–Meier survival and ROC curves of the risk score for estimating the predictive power featured by the model. The log-rank test was conducted to compare the two groups in terms of the survival curve, and p < 0.05 was regarded as statistically significant. We divided the training cohort into TCGA and ICGC cohorts for the internal validation, and the external validation was conducted by using the GSE14520 cohort.
Independence Validation of the Prognostic Model
Univariate and multivariate Cox regression analysis was employed to examine if the risk score was an independent predictor of HCC prognosis in each independent cohort (TCGA, ICGC, and GSE14520).
Correlation Analysis Between the Prognostic Model and Clinical Features
We performed a chi-square test to analyze the clinical characteristics of the two groups to explore the reasons for the differences in prognosis. A p < 0.05 demonstrated statistical significance.
Correlation Analysis Between Prognostic Model and Tumor Microenvironment
The ESTIMATE algorithm, a tool to predict the purity of tumors, was employed for calculating the microenvironment scores of tumors (including stromal, immune, and estimate scores), and gene expression data were adopted for calculating infiltrating stromal cells or immune cells in the tumor tissues (Charoentong et al., 2017). We divided patients into high- and low-risk groups considering the median value possessed by three kinds of scores and conducted Kaplan–Meier survival analysis to explore their impact on the prognosis of HCC. We also used the Wilcoxon test to compare the differences between the three kinds of scores in the two groups, using the Pearson correlation test to analyze the association of risk score with the three scores (including the stromal, immune, and estimate scores).
Gene Set Enrichment Analysis
Gene set enrichment analysis was conducted in the two groups from three independent cohorts to explore potential molecular mechanisms (Shi and Walker, 2007), and cp.kegg.v7.1.symbols.gmt served as a reference gene set, with a nominal p < 0.05 as the threshold to screen the significant enrichment pathway in different risk groups.
Results
Prognostic Significance of Tumor Mutation Burden in HCC
According to the analysis results of X-title software, TMB = 4.2 was used to divide patients into high- and low-TMB groups and had the greatest impact on the overall survival (OS) of patients with HCC (Figures 2A,B). By observing the survival curve, we can observe that the high-TMB group exhibited an obviously lower OS than the low-TMB group (log-rank p < 0.001).
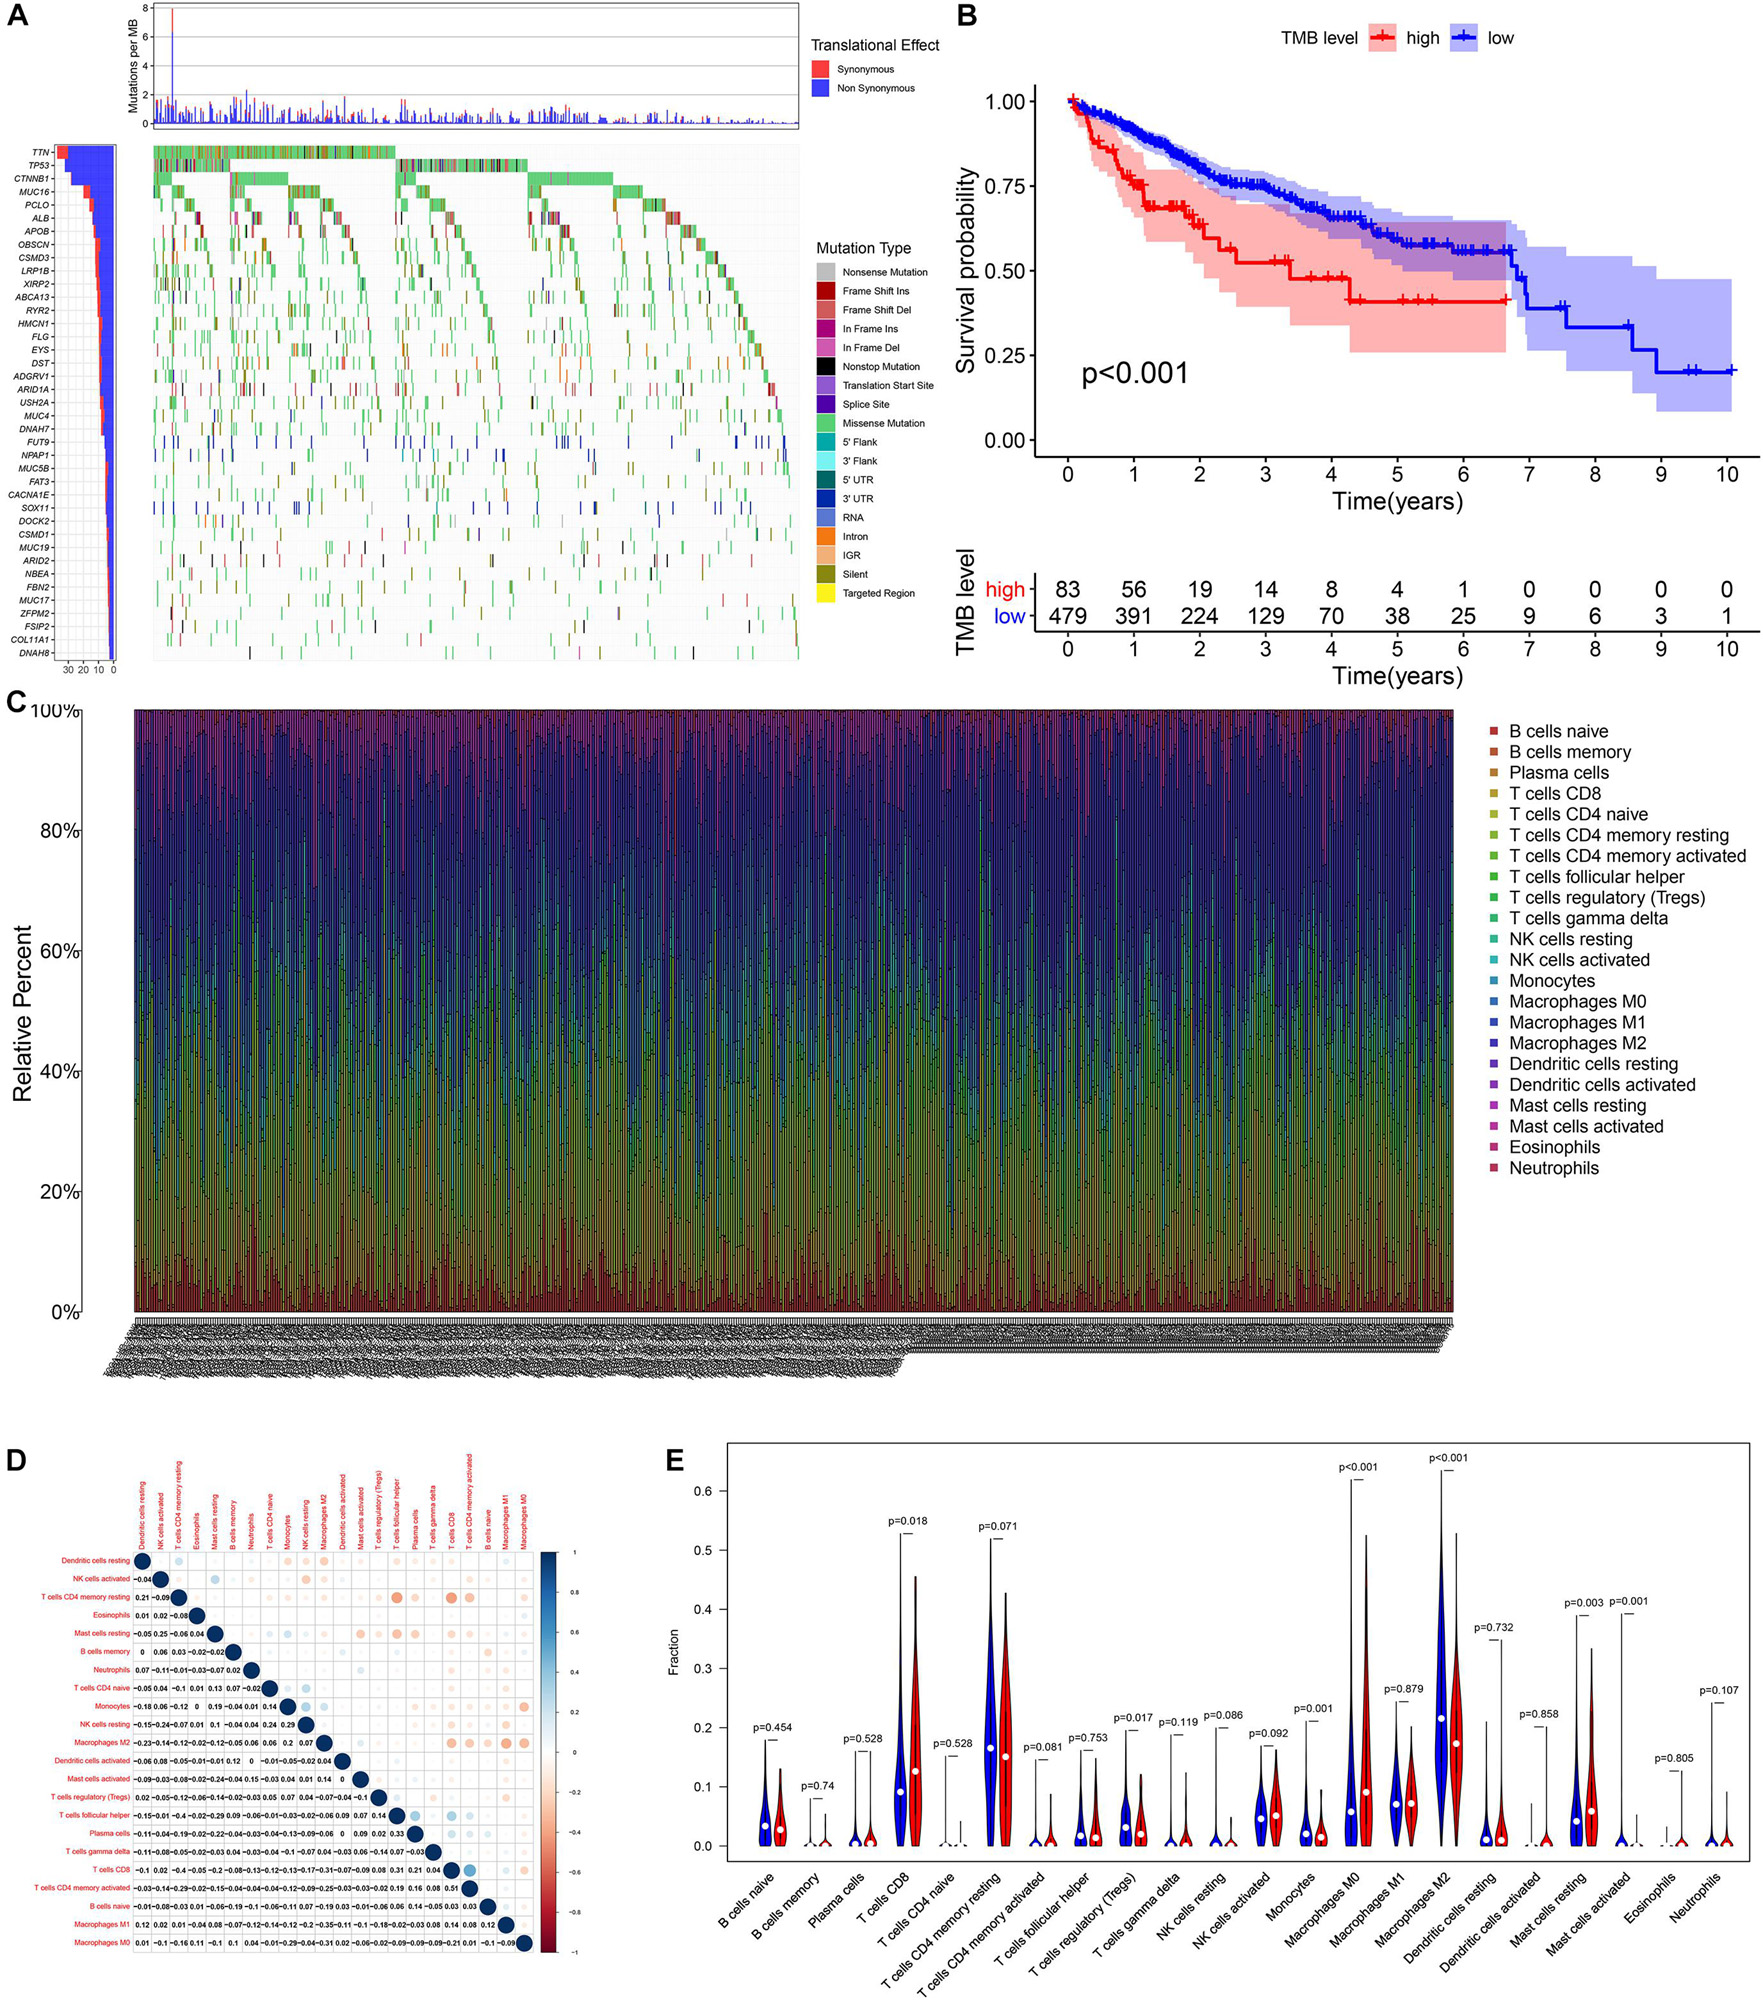
Figure 2. The relationship among tumor mutation burden, immune infiltration, and prognosis of HCC. (A) The waterfall plot mutation profiles in HCC samples from the combined TCGA and ICGC datasets. (B) The Kaplan–Meier survival curve regarding the TMB and overall survival. (C) The bar plot of 22 specific immune fractions represented by various colors in each sample are shown in the bar plot. (D) Correlation matrix of all 22 immune cell proportions. (E) The violin plot of different infiltration levels of immune cells between high- and low-TMB patients.
Relationship Between TMB and Immune Infiltration
We found that the infiltration levels of various immune cells were different between the high- and low-TMB groups. For example, high-TMB group had an obviously higher infiltration level of CD8 T cells, M0 macrophages, and mast cells than the low-TMB group, while the infiltration proportion of monocytes, regulatory T cells (Tregs), M2 macrophages, and mast cells activated in the low-TMB group was relatively high (Figures 2C–E). This indicates that the tumor immune microenvironment (TIME) is closely related to TMB. These results also provide insights for our subsequent research.
Identification of Differentially Expressed Immune-Related Genes
A total of 103 immune-related genes with significant differences in expression between the high- and low-TMB groups were screened; of these genes, 89 and 14 were upregulated in the low- and high-TMB groups, respectively (Figures 3A,B). The genes significantly enriched in the low-TMB group could positively regulate cytokine production, leukocyte cell–cell adhesion, leukocyte chemotaxis, etc. (Figures 3C,D). The genes significantly enriched in the high-TMB group could regulate signaling receptor activity, phosphorylation, pathway-restricted SMAD protein phosphorylation, etc. (Figures 3E,F).
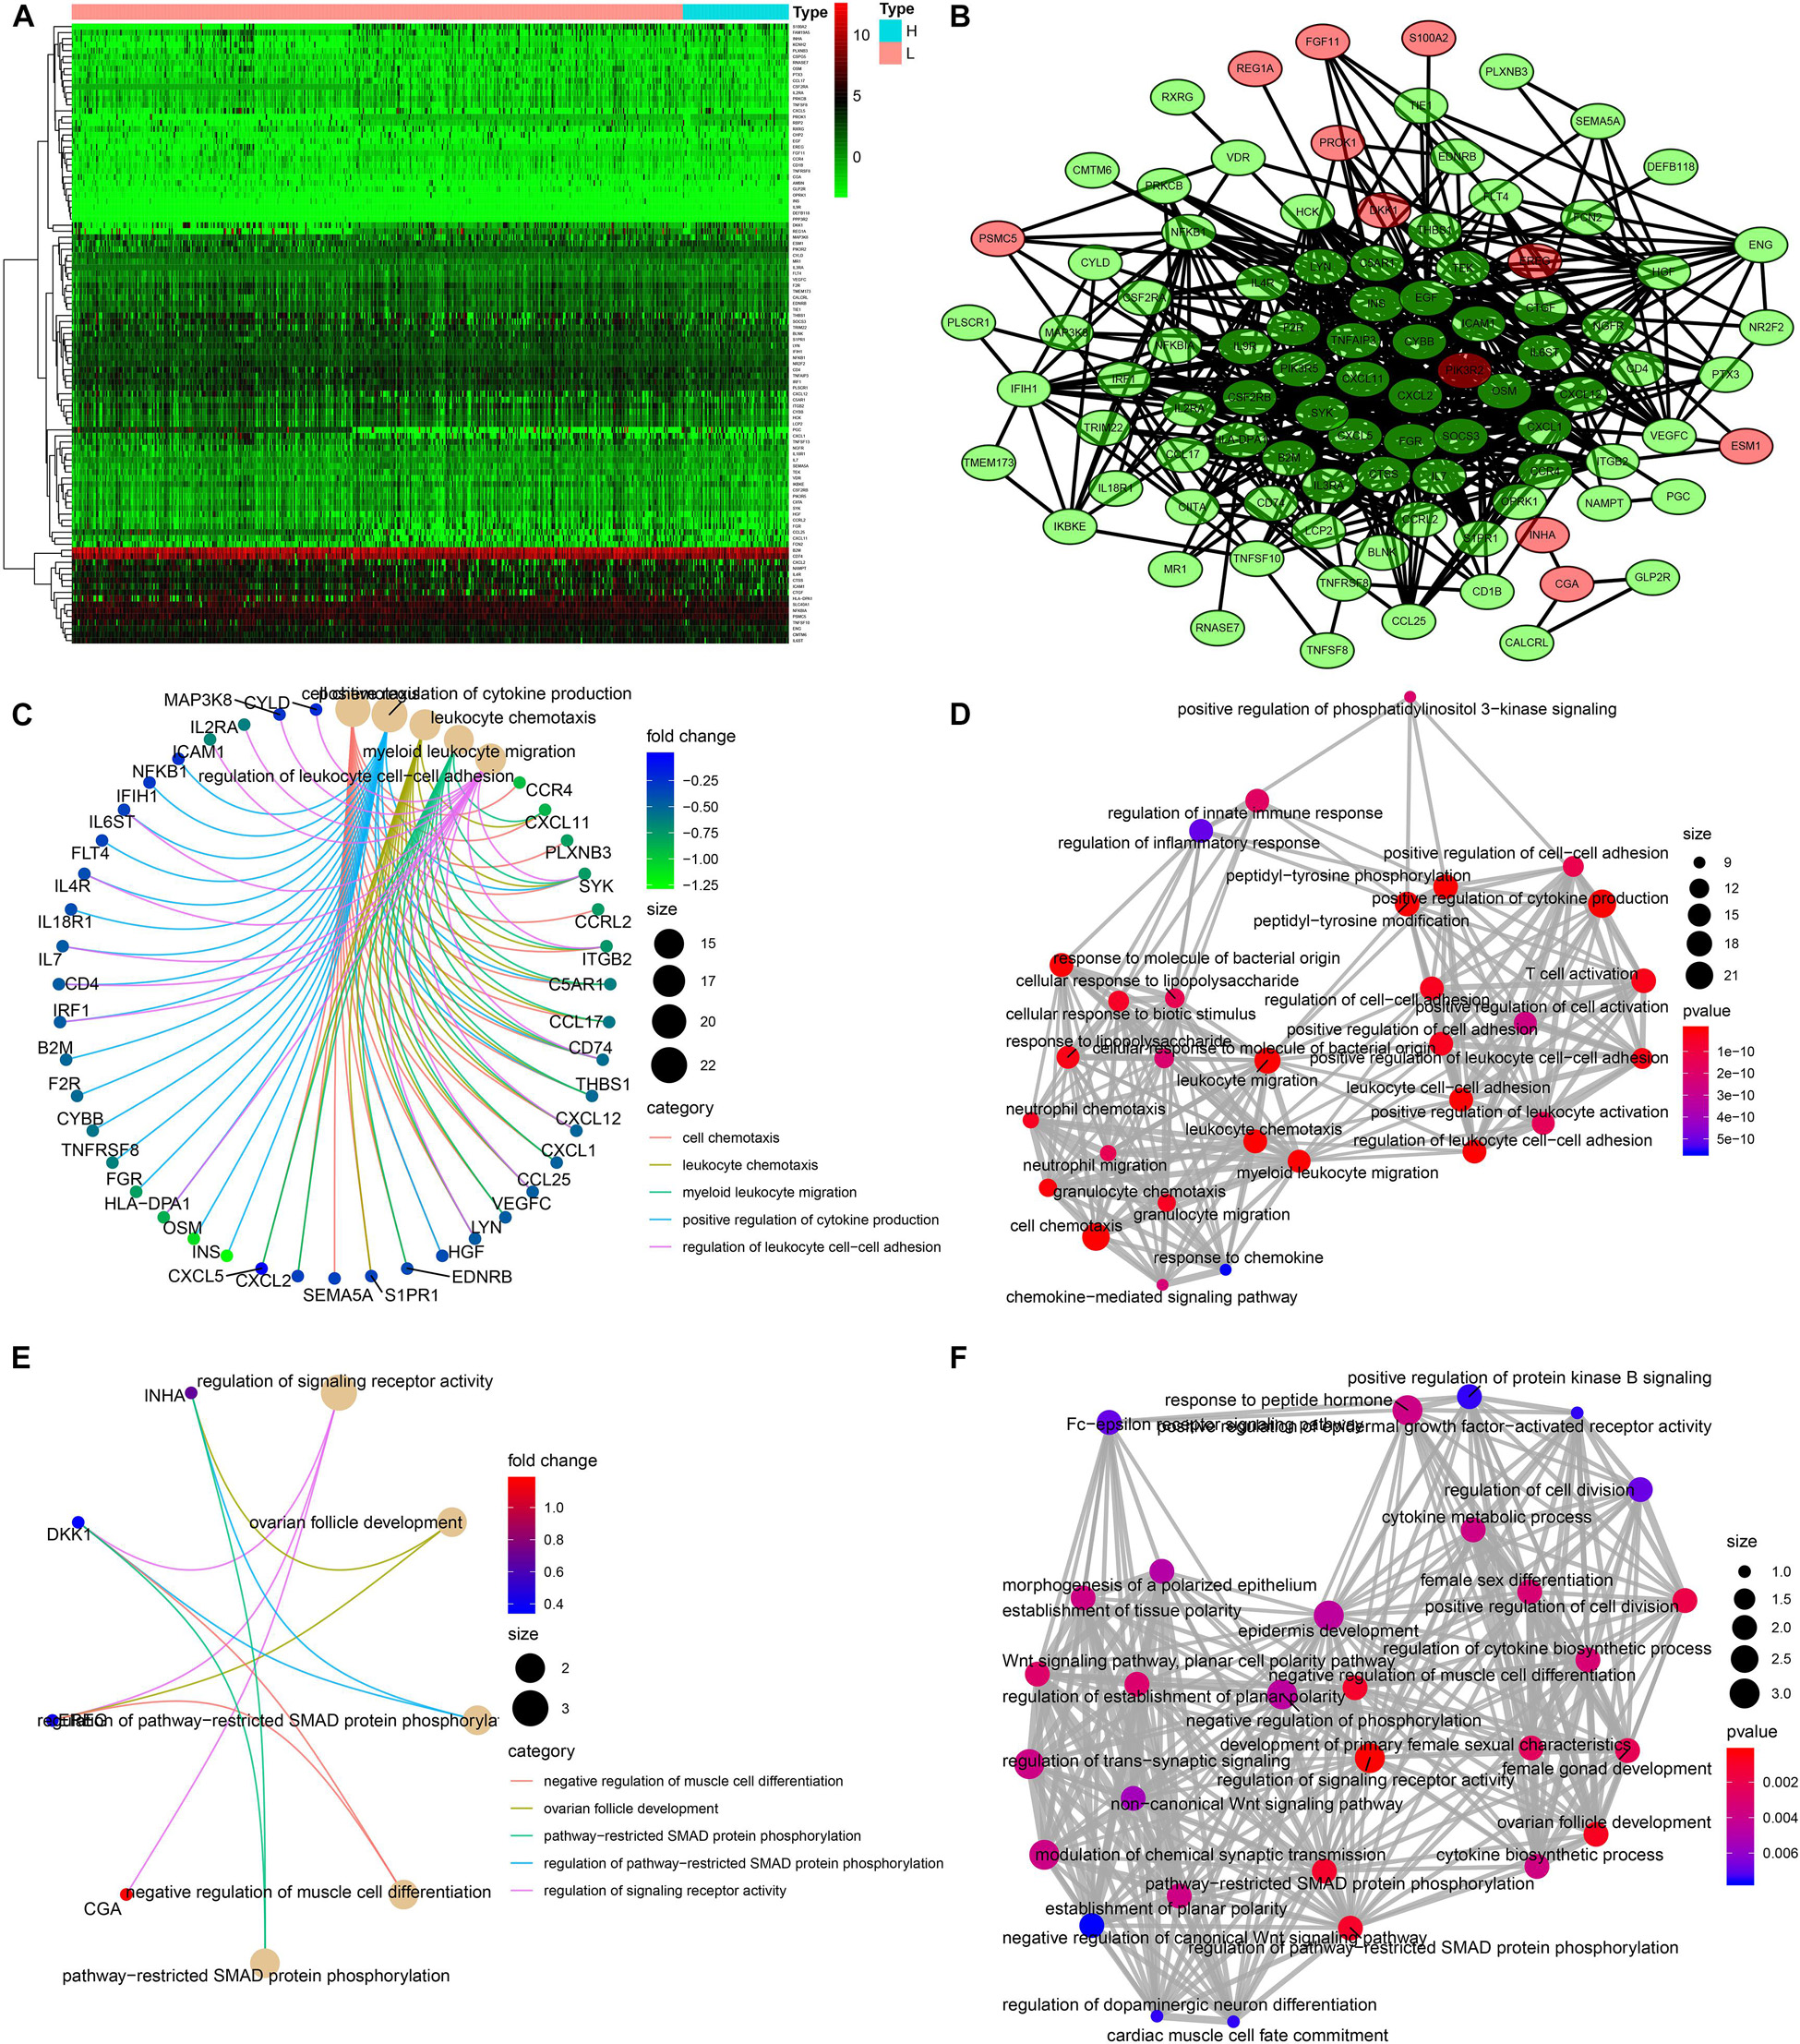
Figure 3. Identification of differentially expressed immune-related genes (DEIRGs) between high- and low-TMB patients. (A) Heatmap of DEIRGs between high- and low-TMB patients. (B) Protein–protein interaction plot of DEIRGs between high- and low-TMB patients (green represents upregulated genes in the low-TMB group, and red represents upregulated genes in the high-TMB group). (C,D) GO enrichment analysis of DEIRGs. (E,F) KEGG enrichment analysis of TRMGs.
LASSO Cox Regression IGP Prognostic Model Construction
We identified 77 gene pairs that exhibited an obvious relation to OS through univariate Cox regression analysis (Figure 4A), of which 29 were prognostic risk factors (HR > 1) and 48 were prognostic protective factors (HR < 1). After LASSO regression and multivariate Cox regression analyses, 15 immune gene pairs were included in our prognostic model (Figures 4B–D). We calculated each patient’s risk score following the formula (the list of gene pairs and calculation coefficients are shown in (Table 1) and divided 562 patients into high- and low-risk groups by considering the median value (0.9429) of the risk score. As shown by the survival curve, the OS of the high-risk group was obviously lower than that of the low-risk group (p < 0.001) (Figure 5A). The areas under curve (AUCs) for the risk score predicting overall survival at 0.5, 1, 3, and 5 years were 0.831, 0.830, 0.800, and 0.764, respectively (Figure 5B). The number of deaths increased with the increase of risk score (Figures 5C–E), and regardless of the status of tumor mutation burden, the high-risk group showed poor prognosis (Figures 5F,G). These results preliminarily indicated that it is effective to stratify the prognosis of patients according to the risk score.
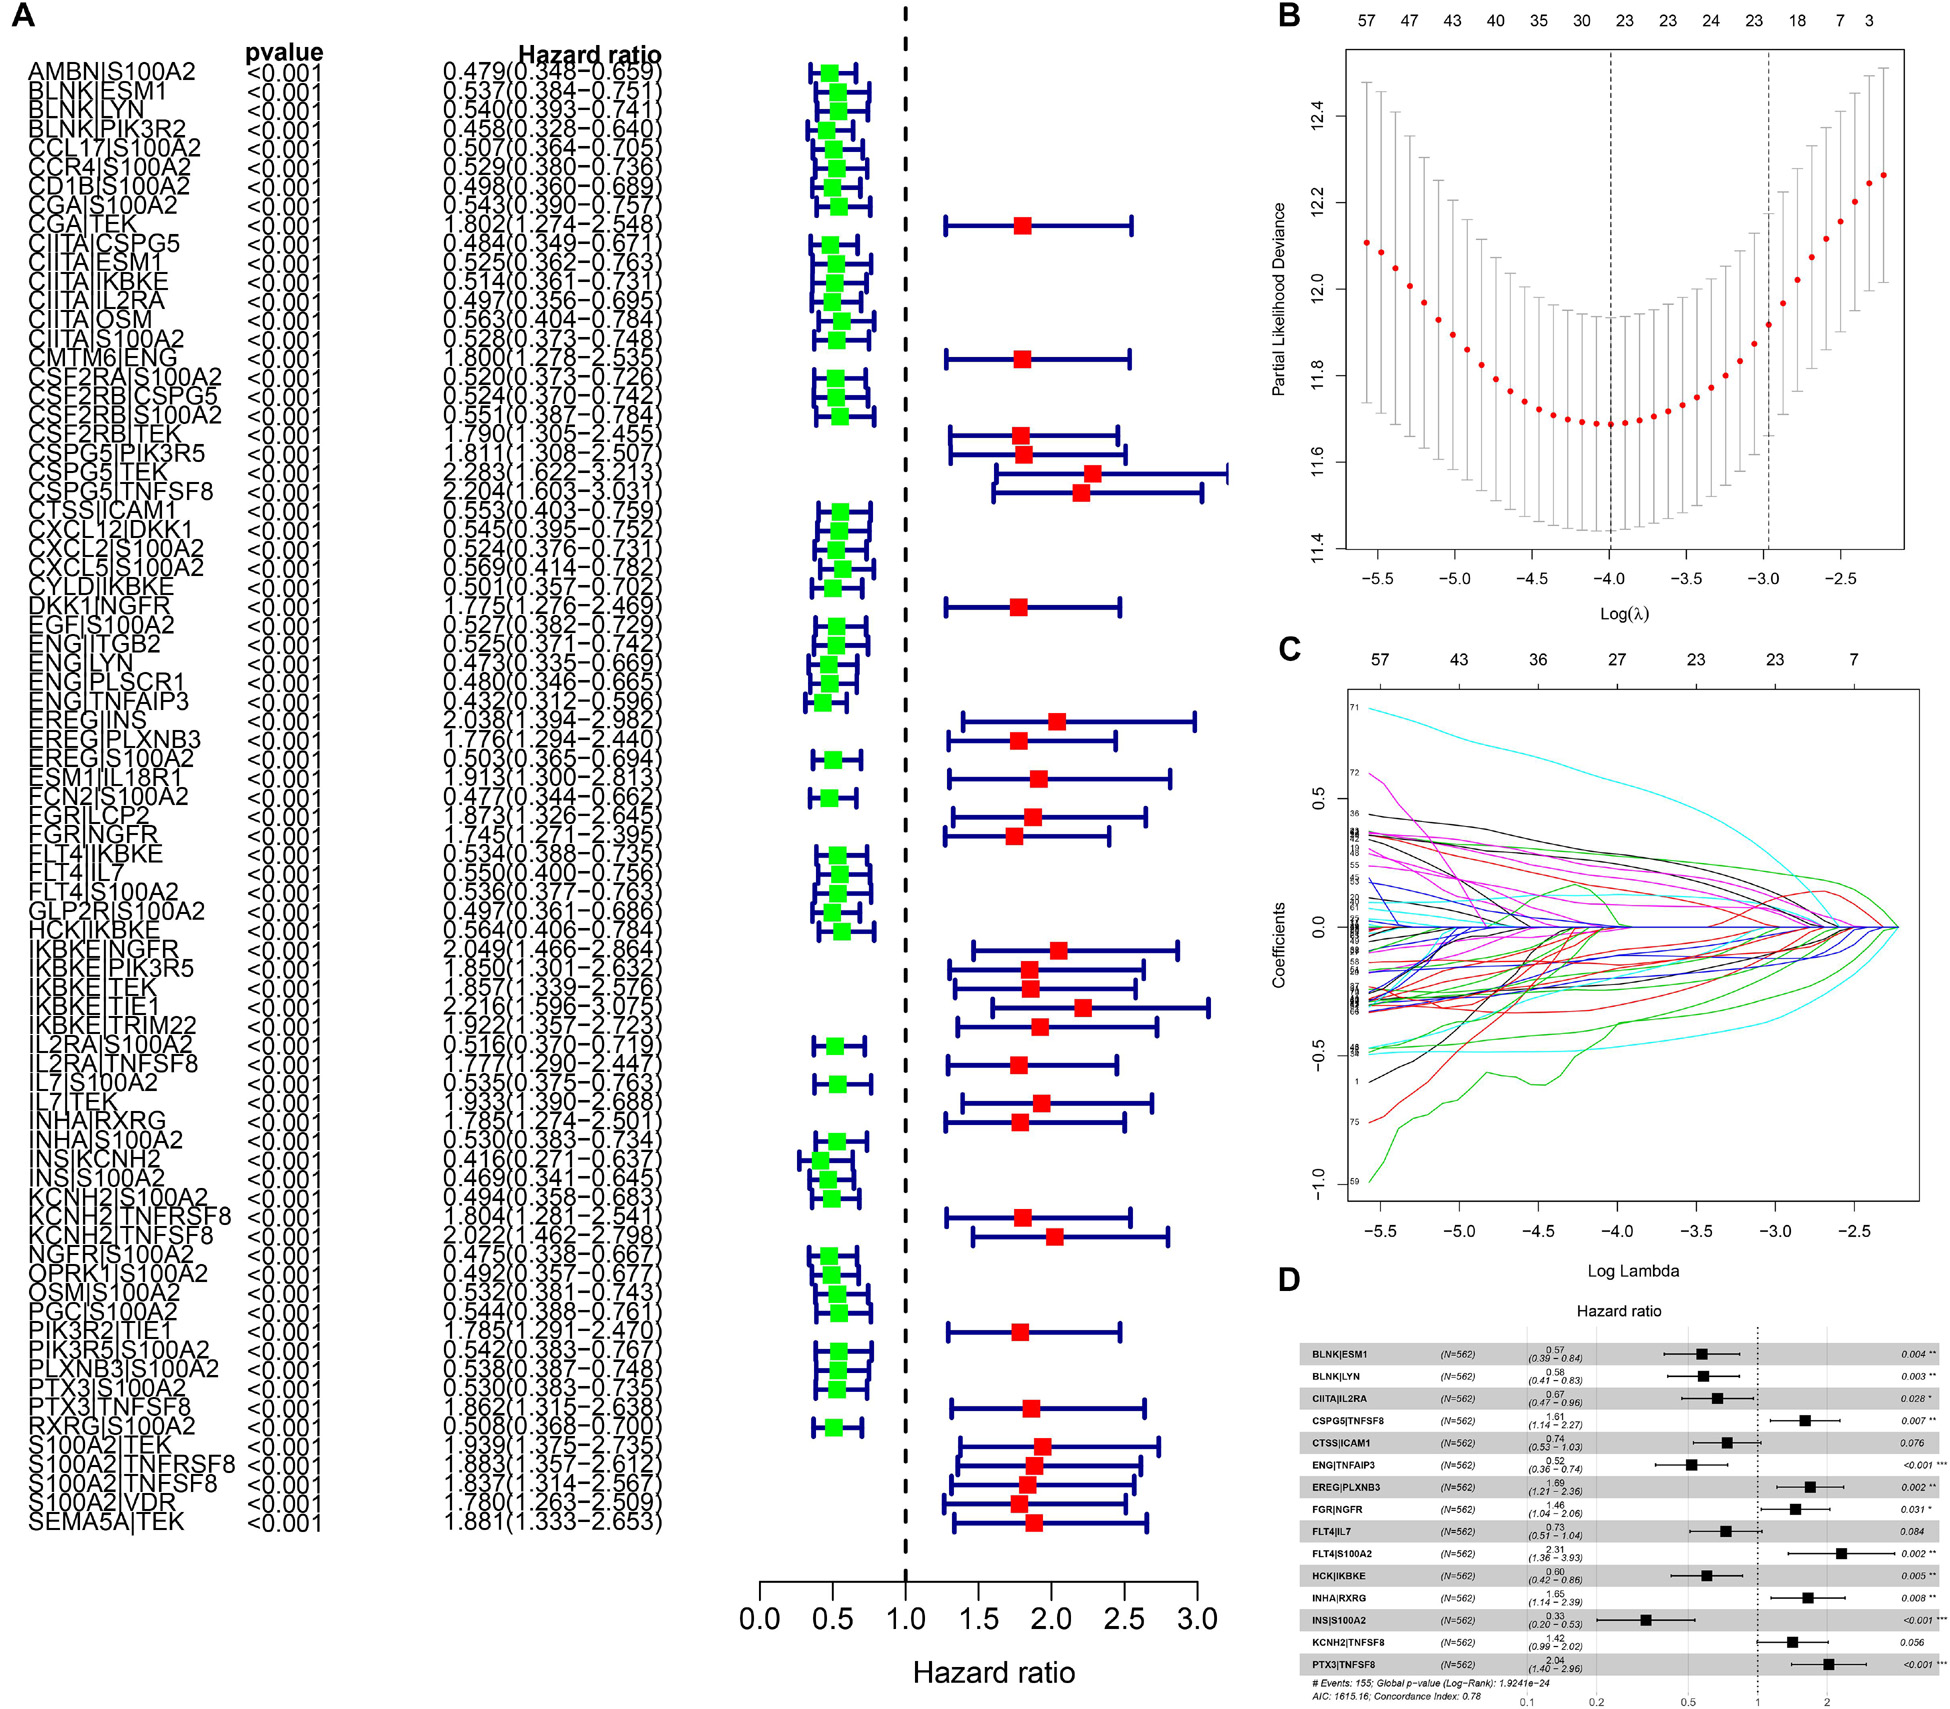
Figure 4. The building process of the prognostic signature. (A) Forrest plot of prognostic DEIRGs identified by univariate Cox and Kaplan–Meier survival analyses. (B–D) The establishment of the prognostic model based on LASSO penalized Cox analysis.
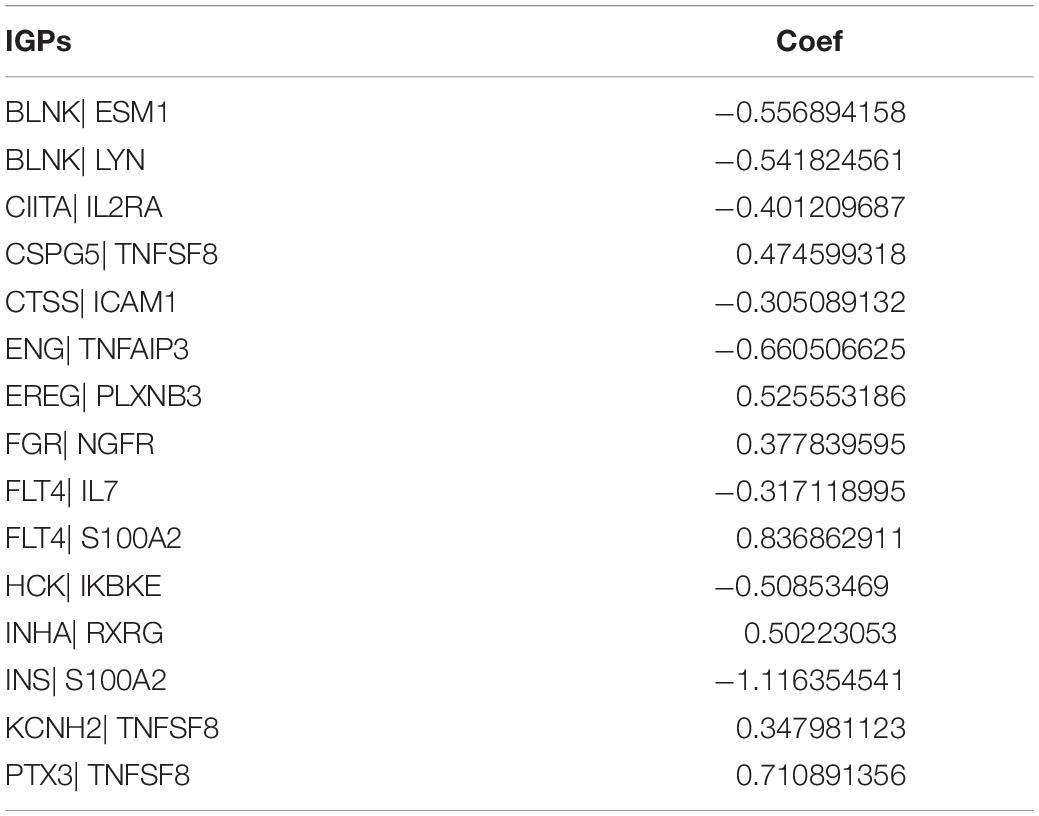
Table 1. The list and coef of IGPs.
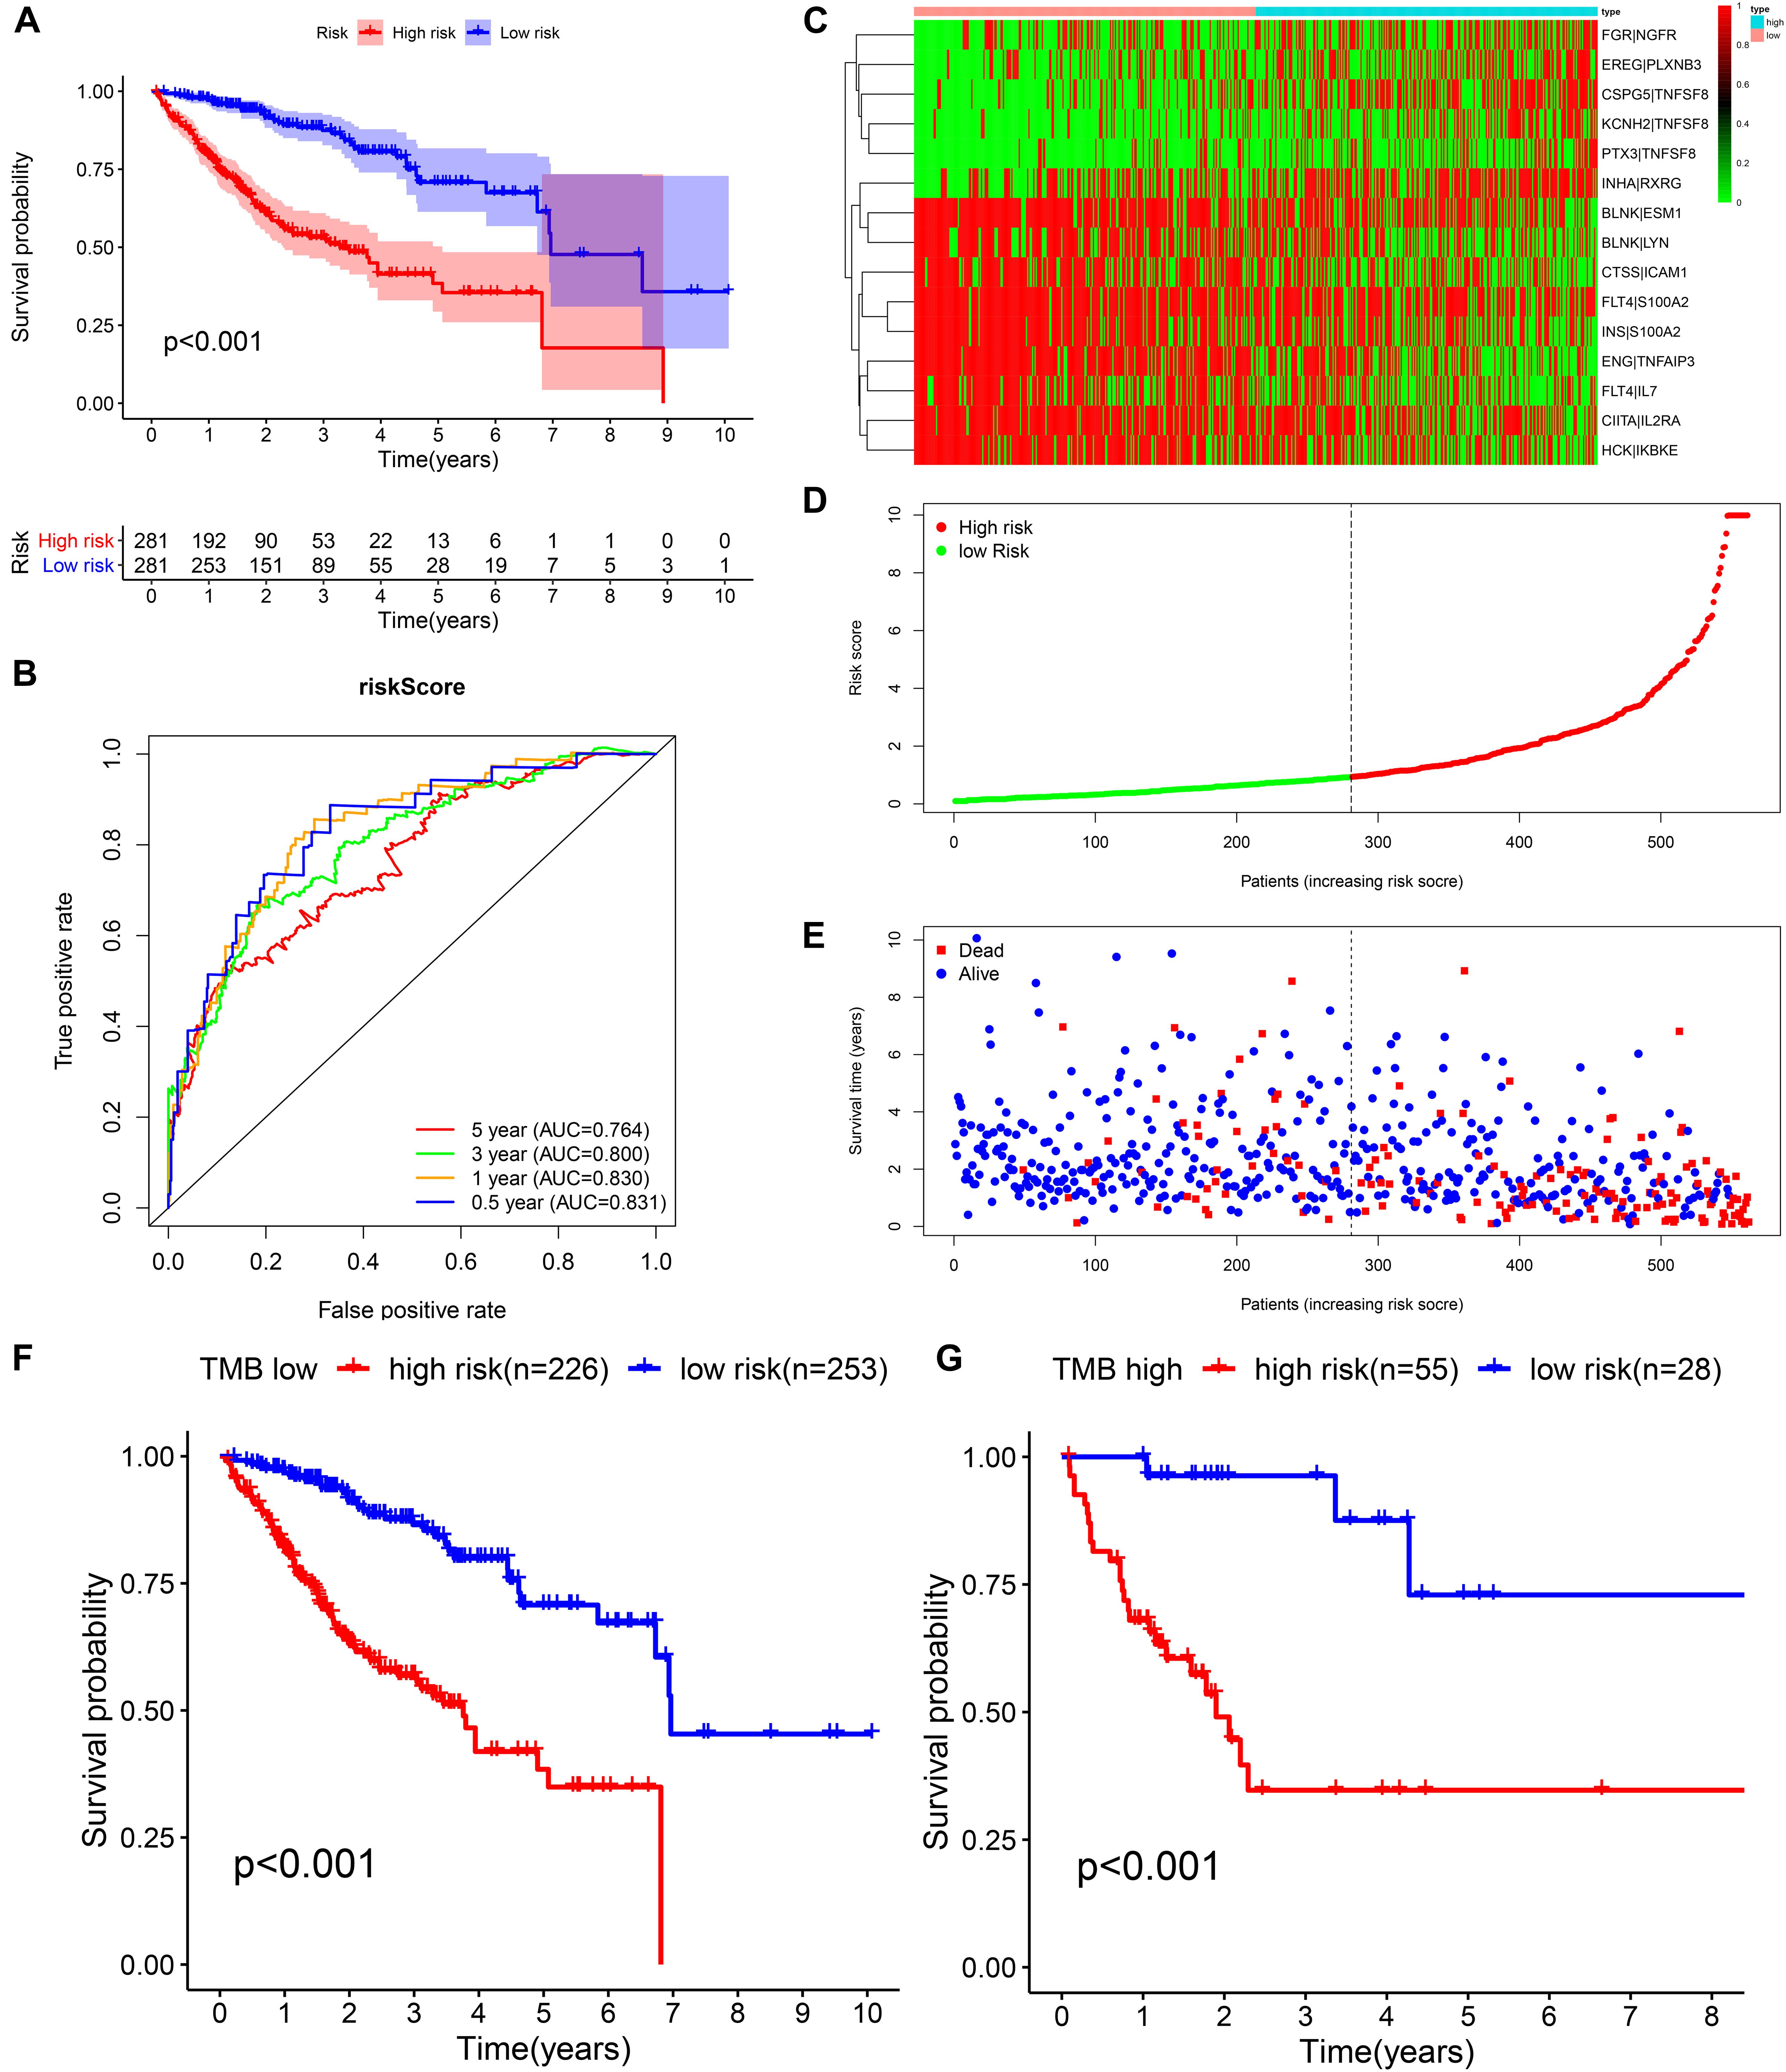
Figure 5. Construction of the prognostic model in the training cohort. (A,B) Kaplan–Meier survival analysis and time-dependent ROC analysis for predicting the overall survival of patients in the training cohort using the risk score. (C–E) Heatmap of the 15 gene pairs, the distribution of the risk score, and the survival status of patients. (F) Kaplan–Meier survival analysis for predicting the overall survival of patients in the low-TMB group using the risk score. (G) Kaplan–Meier survival analysis of predicting the overall survival of patients in the high-TMB group using the risk score.
Validation of the Prognostic Model in the TCGA and ICGC Cohorts
In the TCGA cohort, the prognosis of the high-risk group was significantly worse (Figure 6A). The AUCs for the risk score predicting overall survival at 0.5, 1, 3, and 5 years were 0.817, 0.779, 0.805, and 0.762, respectively (Figure 6B). As shown in the univariate multivariate Cox regression analysis, the risk score could serve to independently predict prognosis (Figures 6C,D). In accordance with the TCGA cohort results, the high-risk group also showed a lower overall survival rate in the ICGC cohort (Figure 6E). The AUCs for risk score predicting overall survival at 0.5, 1, 3, and 5 years were 0.854, 0.906, 0.761, and 0.816, respectively (Figure 6F). Similarly, the risk score was one of the prognostic indicators independent of other clinical factors in this cohort (Figures 6G,H). The results of internal validation demonstrated that the risk score has a high accuracy for predicting HCC prognosis.
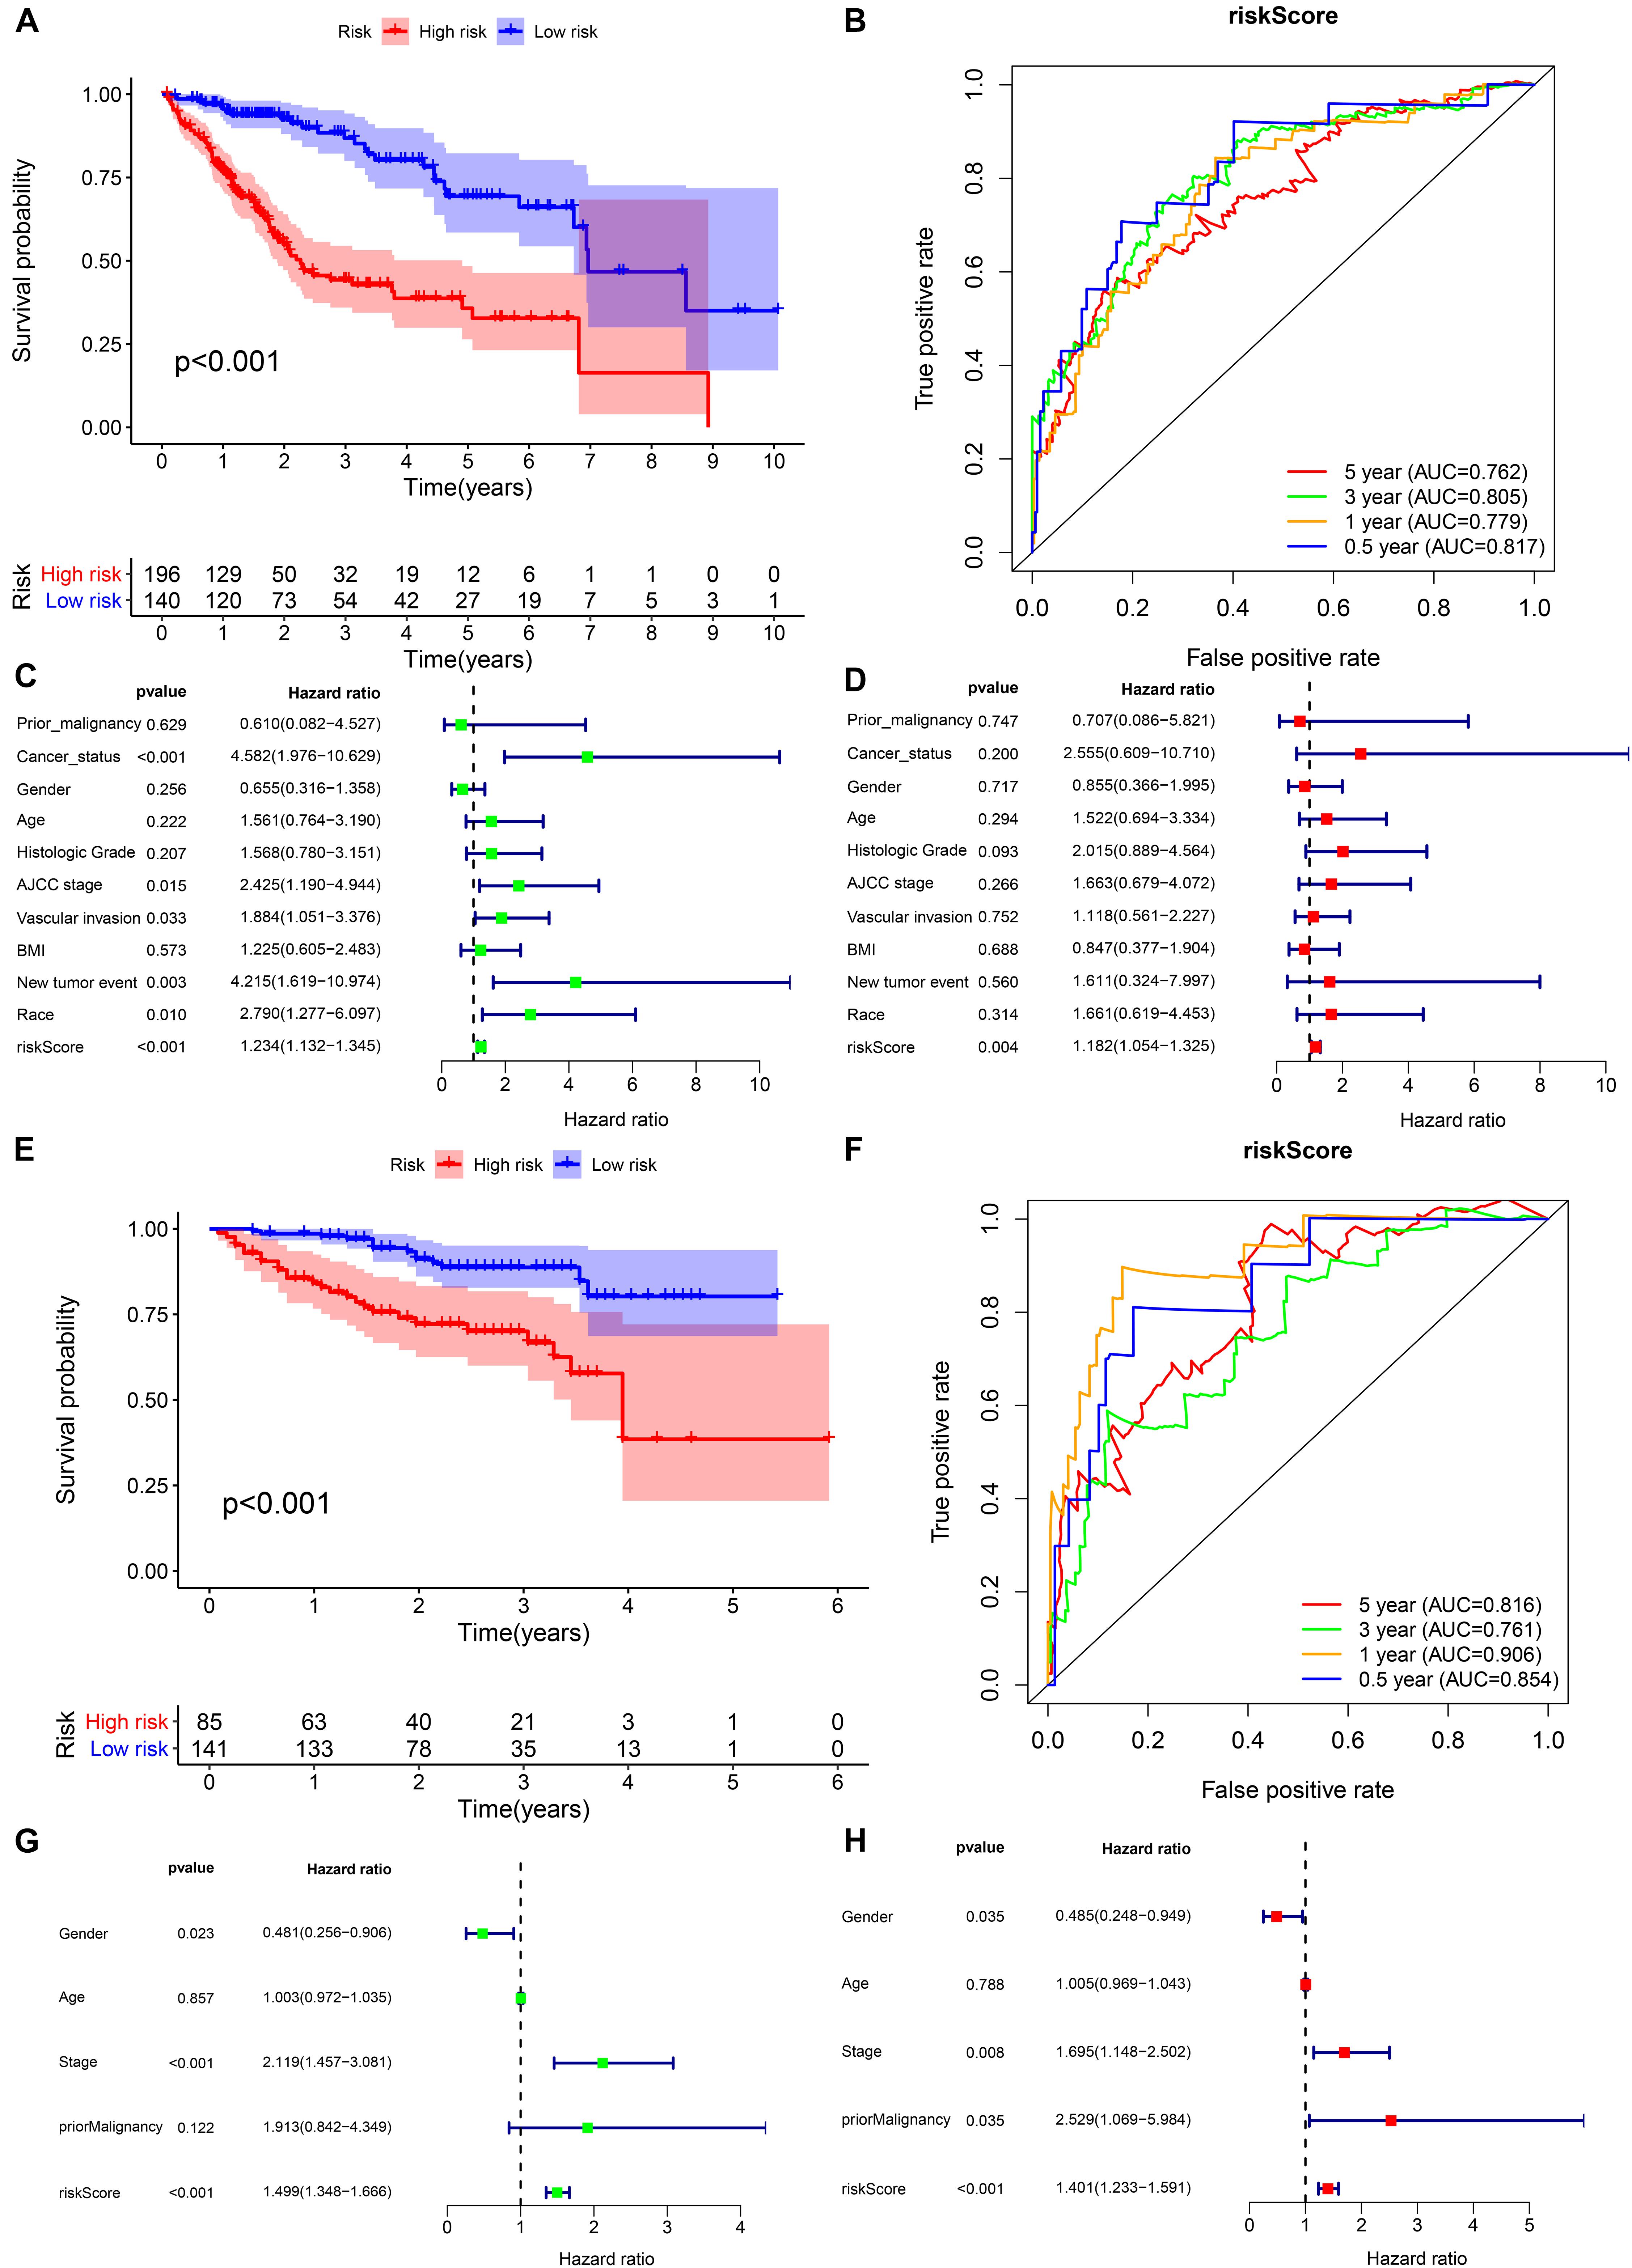
Figure 6. Internal validation of the prognostic model in the TCGA and ICGC cohorts. (A,B) Kaplan–Meier survival analysis and time-dependent ROC analysis of predicting the overall survival of patients in the TCGA cohort using the risk score. (C,D) Univariate and multivariate regression analyses of the relation between the risk score and clinicopathological characteristics regarding overall survival in the TCGA cohort (green represents univariate analysis, and red represents multivariate analysis). (E,F) Kaplan–Meier survival analysis and time-dependent ROC analysis for predicting the overall survival of patients in the ICGC cohort using the risk score. (G,H) Univariate and multivariate regression analyses of the relation between the risk score and clinicopathological characteristics regarding the overall survival in the ICGC cohort (green represents univariate analysis, and red represents multivariate analysis).
External Validation of the Prognostic Model in the GEO Cohort
We selected GSE14520 from the GEO database as an external dataset to validate the prognostic model because of its large sample size (n = 239) and complete clinical data. The risk score regarding each patient in the cohort was calculated based on the previous formula, and patients were assigned into either high- or low-risk group by taking into account the unified cutoff value (0.9429). Consistent with previous studies, the high-risk group had remarkably lower OS and recurrence-free survival rates than the low-risk group (Figures 7A,E). The AUCs for the risk score predicting overall survival at 0.5, 1, 3, and 5 years were 0.663, 0.677, 0.702, and 0.698, respectively (Figure 7B). The AUCs for the risk score predicting recurrence-free survival (RFS) at 0.5, 1, 3, and 5 years were 0.631, 0.625, 0.667, and 0.653, respectively (Figure 7F). As revealed by univariate multivariate Cox regression analysis, the risk score could be used to independently predict OS and RFS (Figures 7C,D,G,H). The results of the external validation proved that the prognostic model we constructed had general applicability and high stability in predicting the prognosis of HCC.
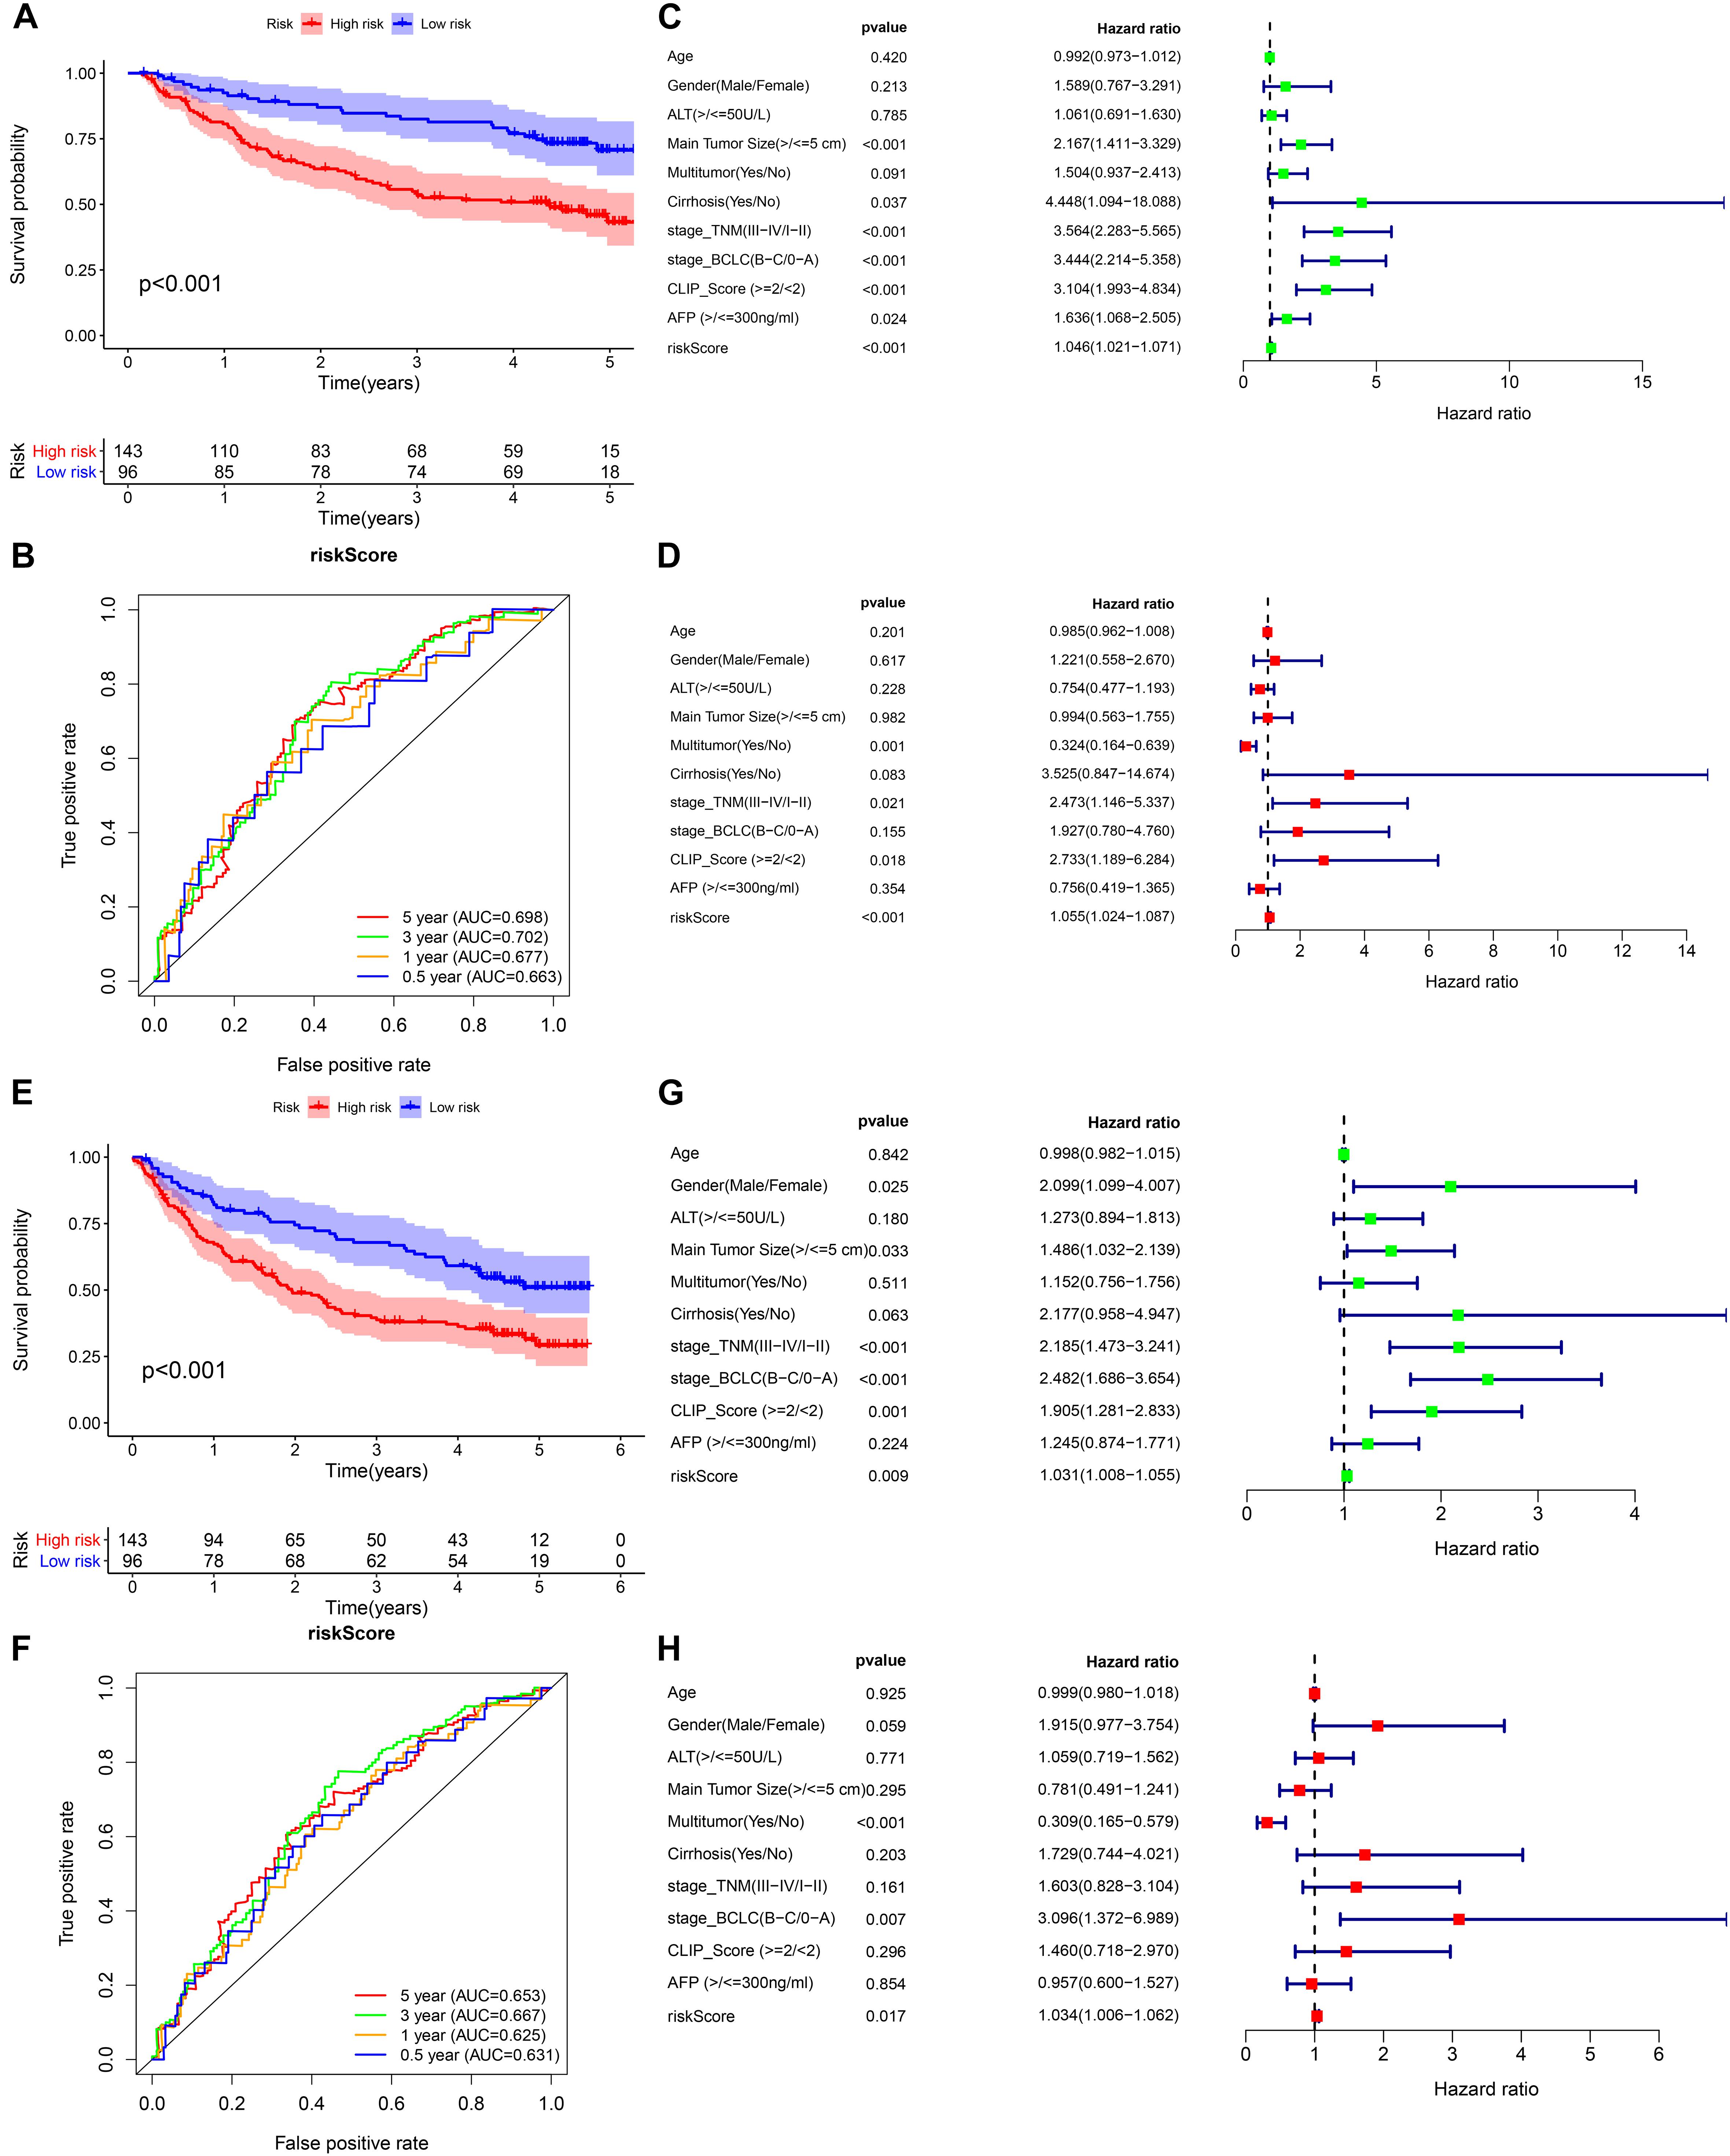
Figure 7. External validation of the prognostic model in the GSE14520 cohort. (A,B) Kaplan–Meier survival analysis and time-dependent ROC analysis for predicting the overall survival of patients in the GSE14520 cohort using the risk score. (C,D) Univariate and multivariate regression analyses of the relation between the risk score and clinicopathological characteristics regarding the overall survival in the GSE14520 cohort (green represents univariate analysis, and red represents multivariate analysis). (E,F) Kaplan–Meier survival analysis and time-dependent ROC analysis for predicting the recurrence-free survival of patients in the GSE14520 cohort using the risk score. (G,H) Univariate and multivariate regression analyses of the relation between the risk score and clinicopathological characteristics regarding the recurrence-free survival in the GSE14520 cohort (green represents univariate analysis, and red represents multivariate analysis).
Prognostic Assessment of the Prognostic Model in the Whole Cohort
We integrated all the research objects into one whole cohort (n = 801) for analysis, and as expected, the high-risk group presented a significantly poor prognosis (Figure 8A). The AUCs for risk score predicting overall survival at 0.5, 1, 3, and 5 years were 0.781, 0.782, 0.764, and 0.733, respectively, in whole cohort (Figure 8B). For survival analysis, we divided all subjects into six subgroups according to their common clinical characteristics (age, sex, and stage). In each subgroup, the high-risk group showed an obviously lower OS than the low-risk group (Figures 8C–E). These results further confirmed that the risk score is a reliable tool for the prognostic evaluation of HCC.
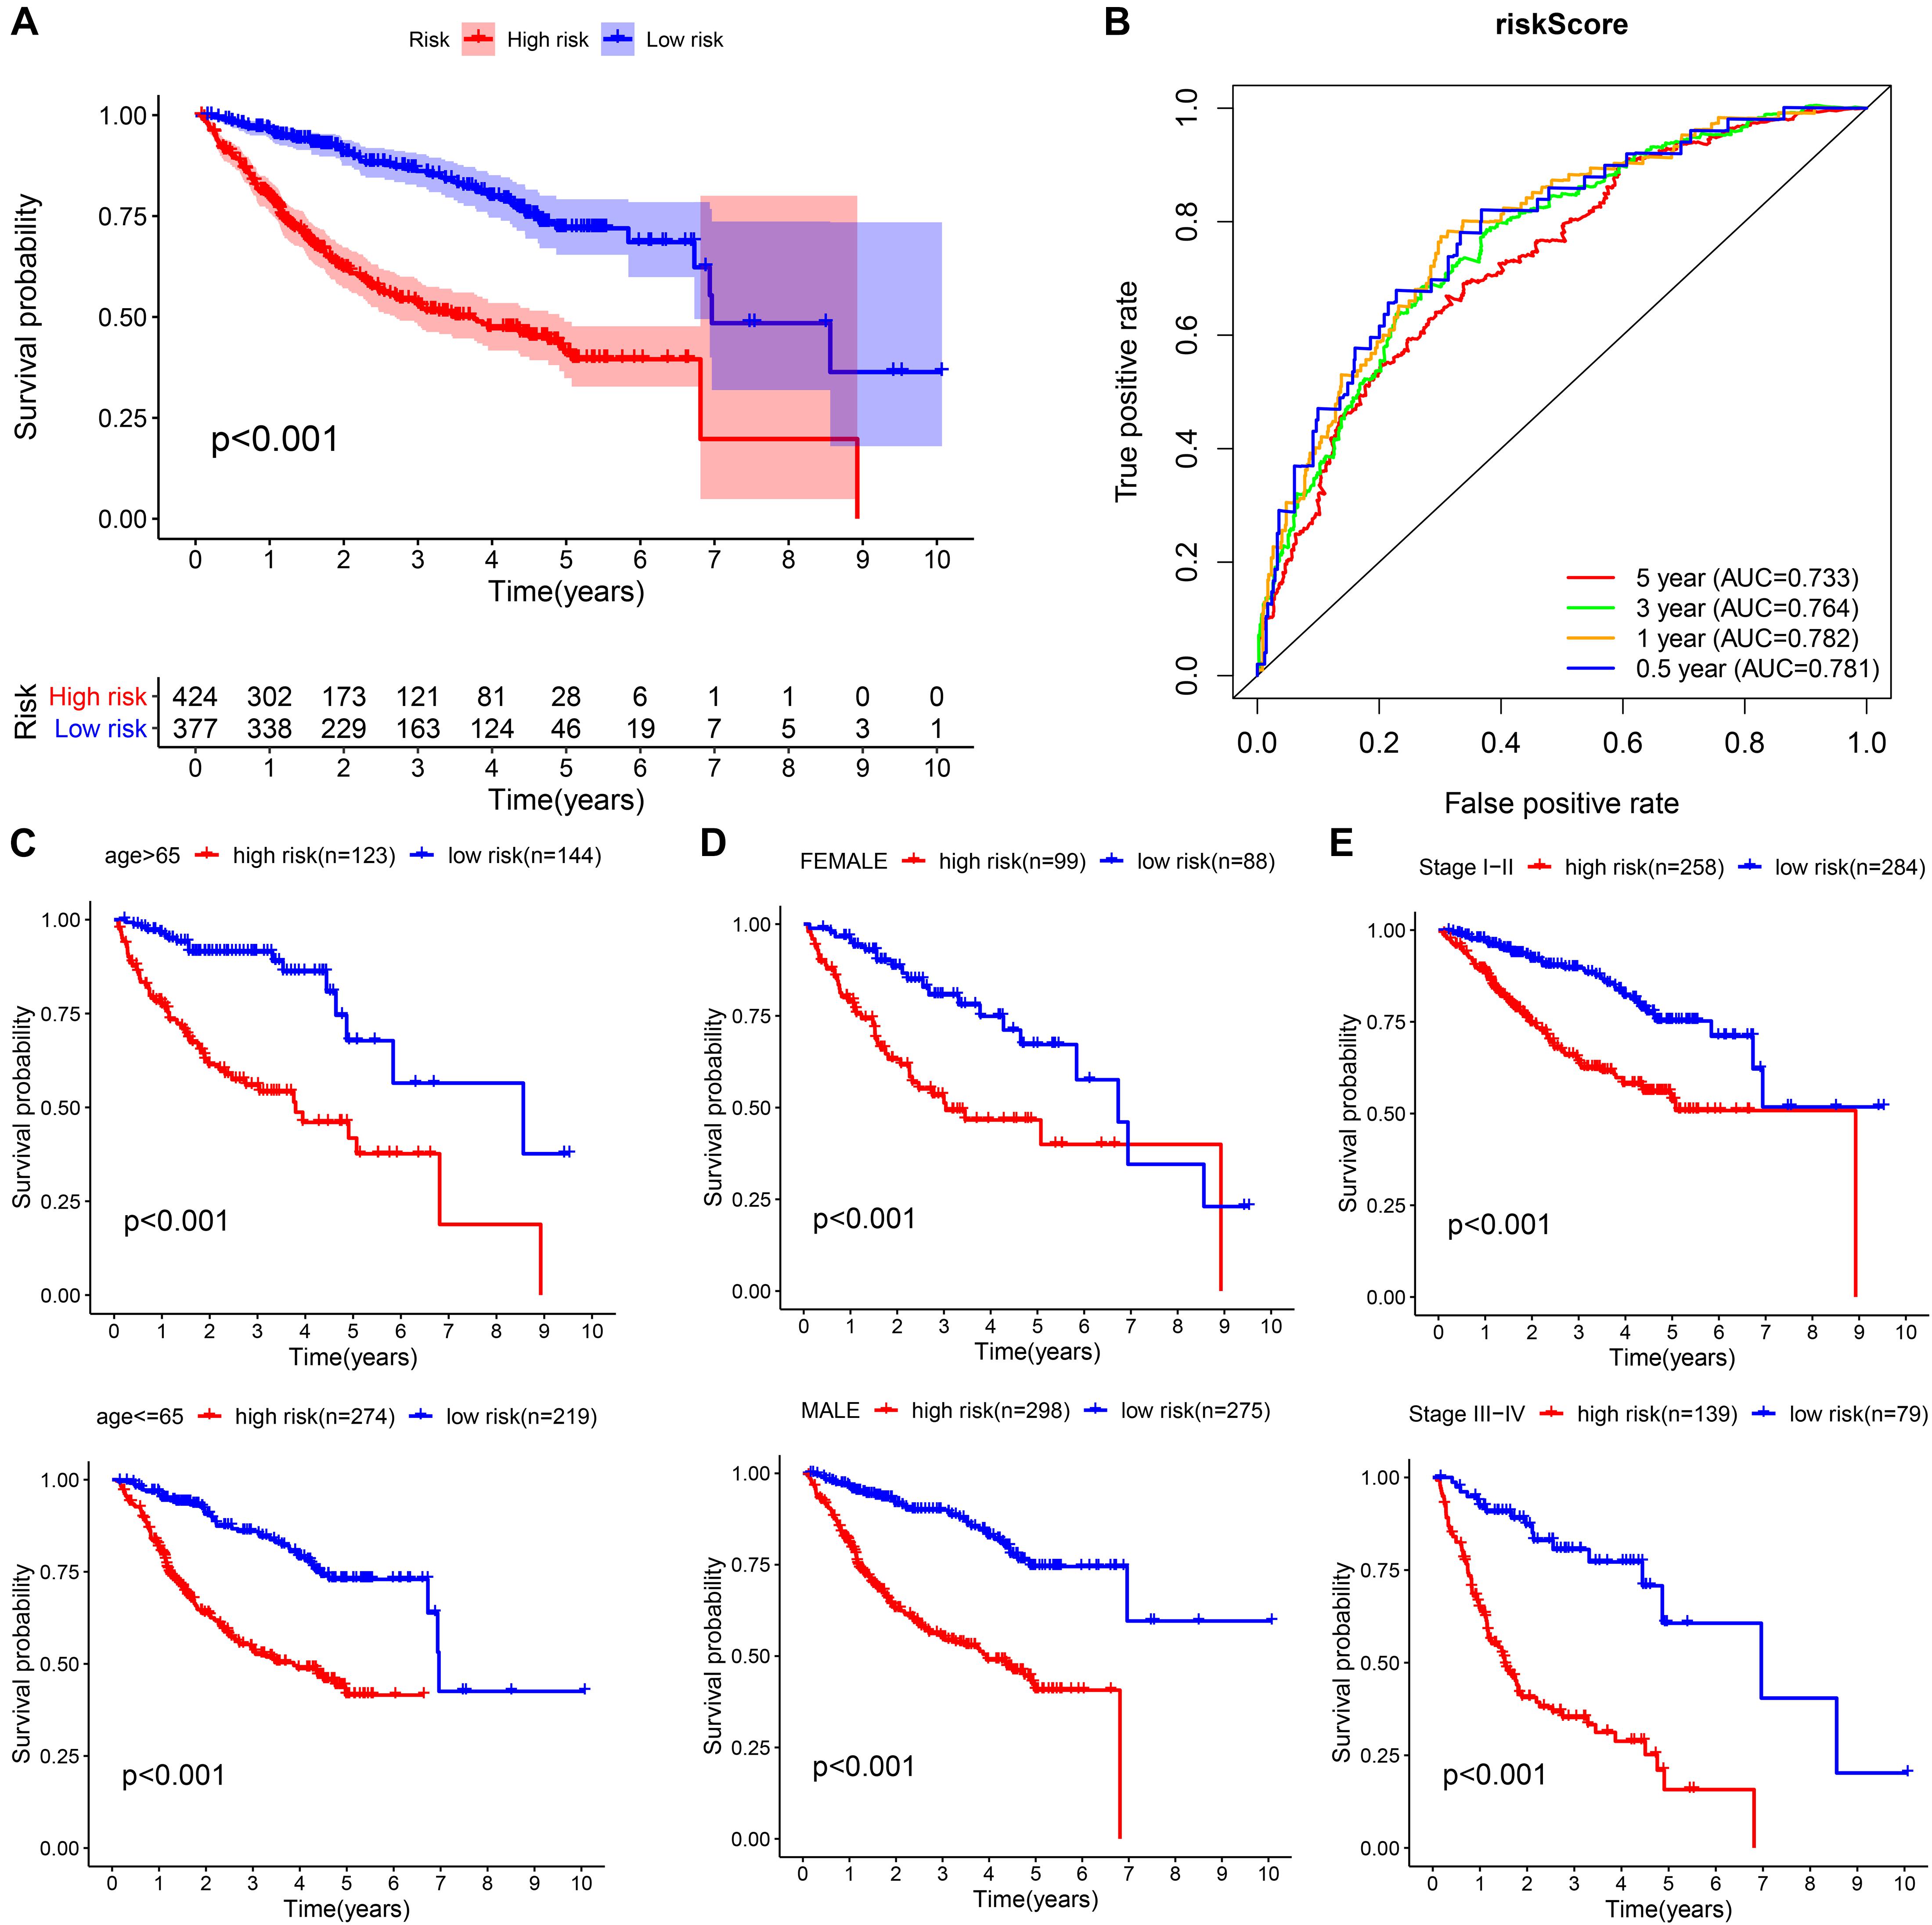
Figure 8. Validation of the universal applicability of the prognostic model in the whole cohort. (A,B) Kaplan–Meier survival analysis and time-dependent ROC analysis for predicting the overall survival of patients in the whole cohort using the risk score. (C–E) Subgroup Kaplan–Meier survival analysis according to different clinical features.
Clinical Correlation Analysis of the Prognostic Model
The chi-square test demonstrated that the prognosis model was significantly correlated with tumor stage [AJCC-TNM (p < 0.001), BCLC (p = 0.003)], histopathological grade (p = 0.033), vascular invasion (p = 0.009), maximum tumor diameter (p = 0.013), and background of liver cirrhosis (p < 0.001) (Tables 2–4).
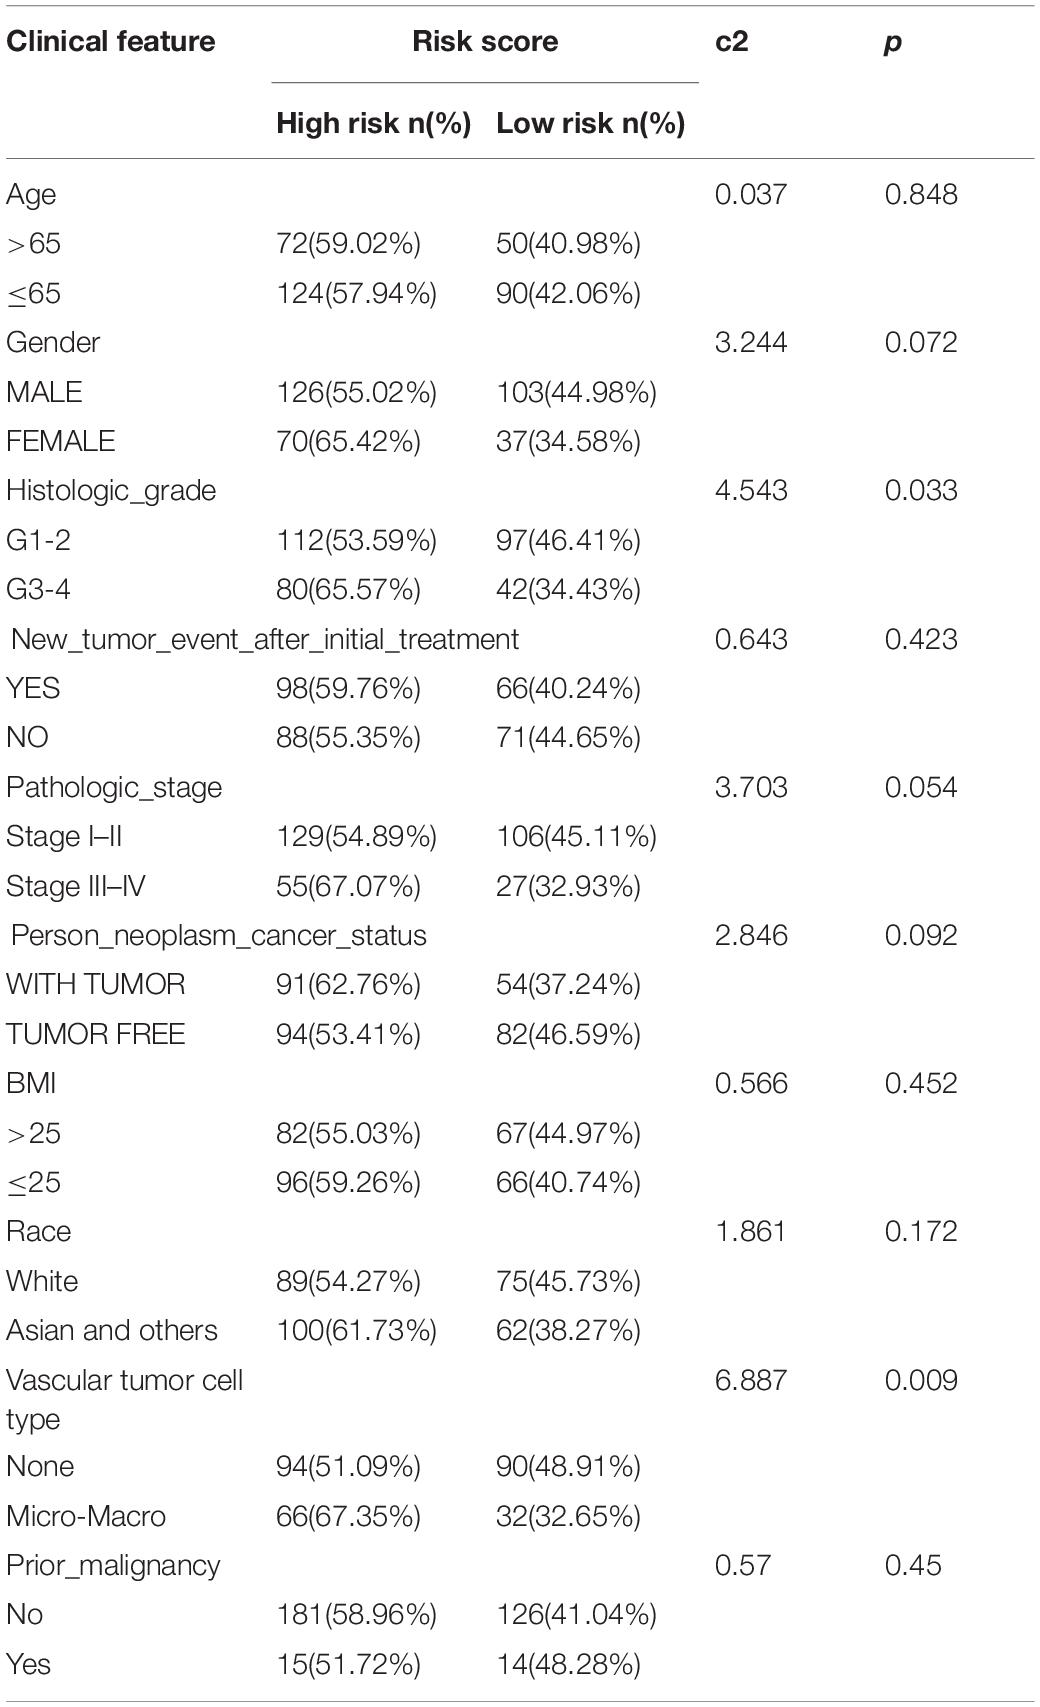
Table 2. The chi-square test of the relation between risk score and clinical features in TCGA cohort.
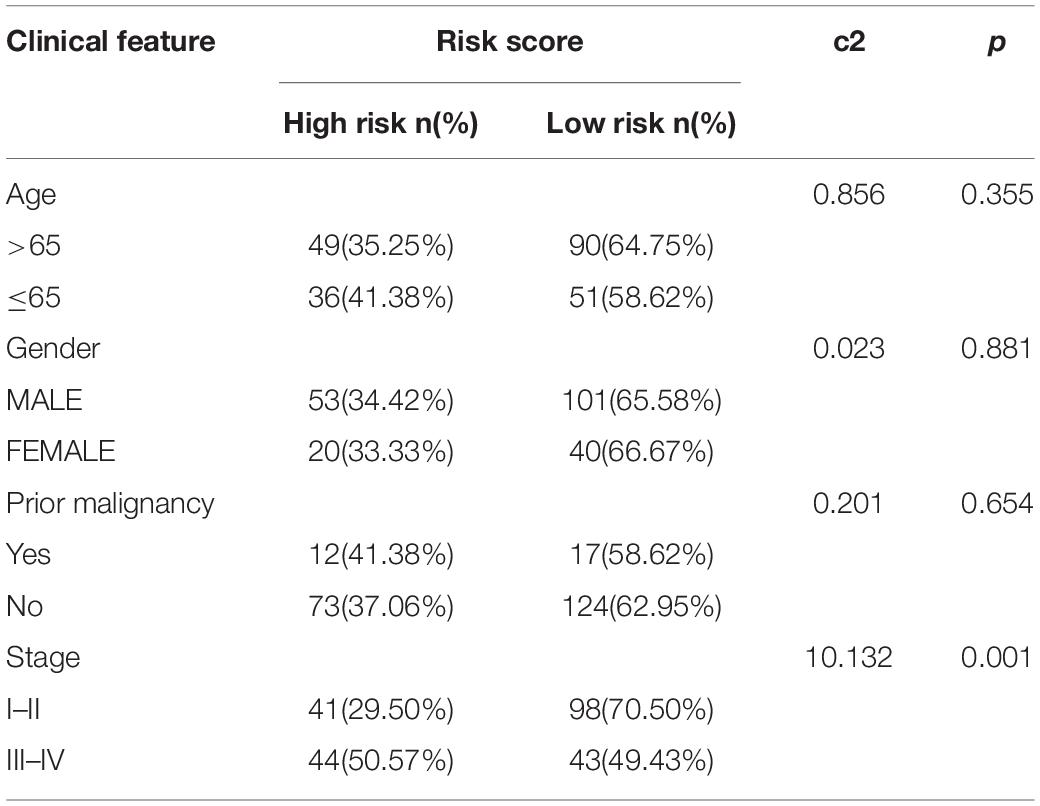
Table 3. The chi-square test of the relation between risk score and clinical features in ICGC cohort.
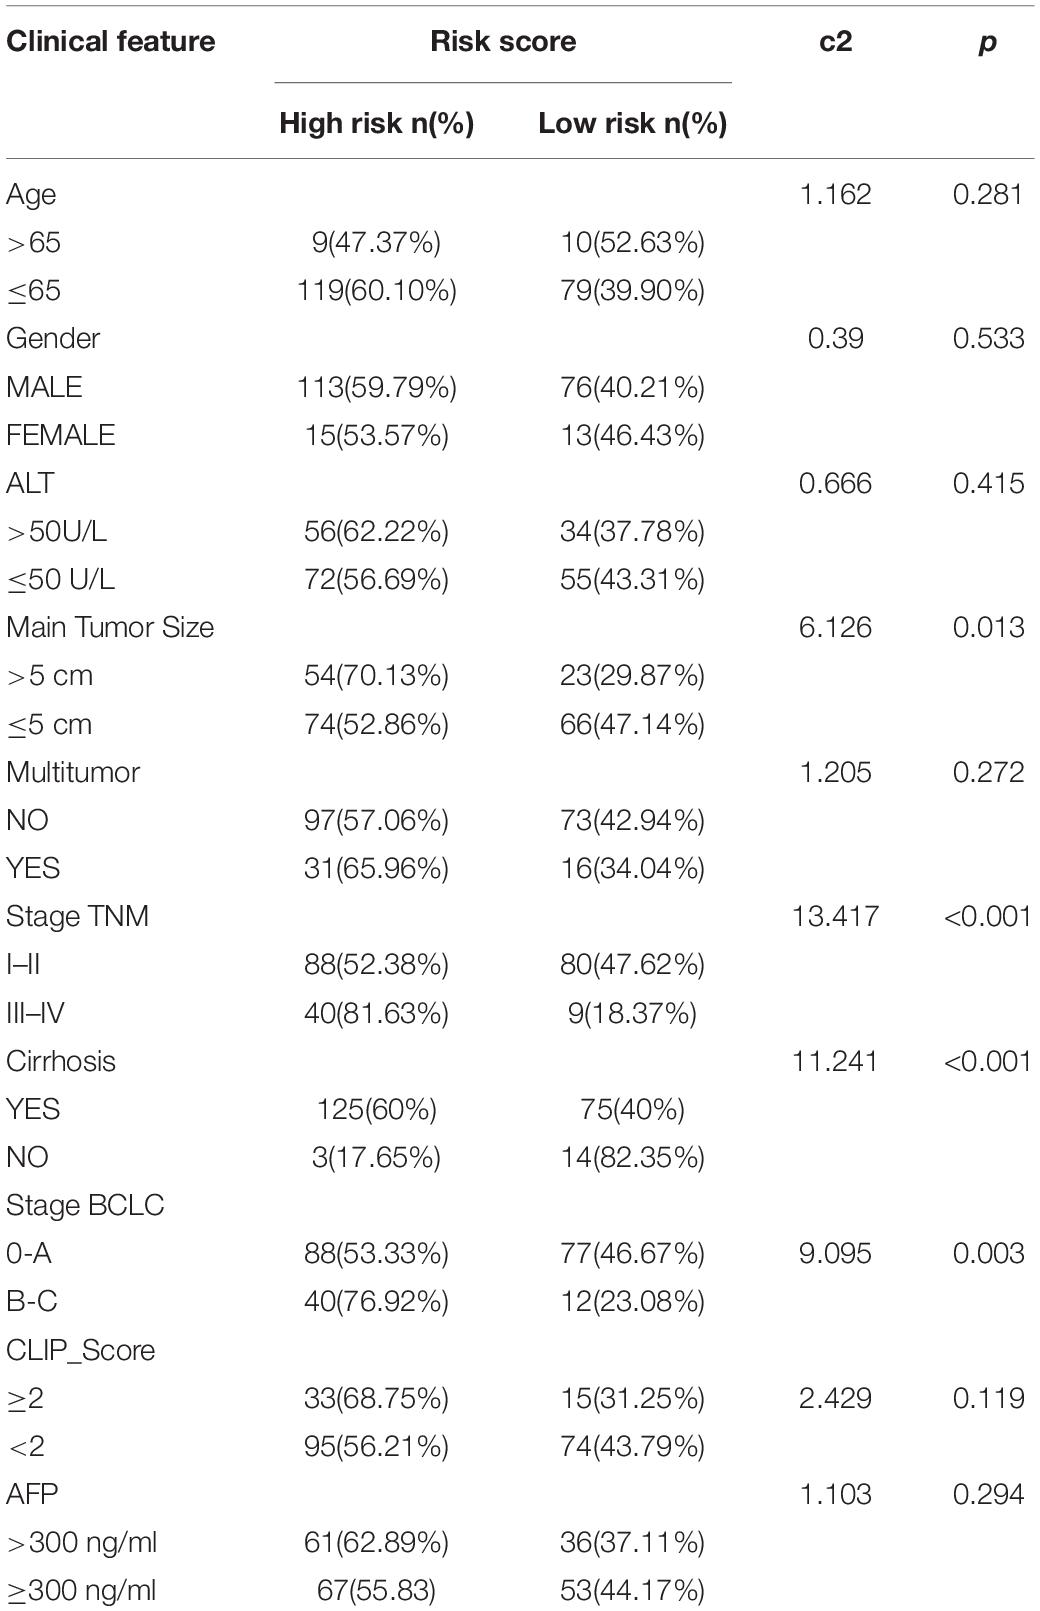
Table 4. The chi-square test of the relation between risk score and clinical features in GSE14520 cohort.
Relationship Between the Prognostic Model and the Tumor Microenvironment
Our study found that patients with higher tumor microenvironment scores (stromal score, immune score, and estimate score) had a better prognosis (Figures 9A–C), and the three kinds of tumor microenvironment scores were obviously higher in the low-risk group than in the high-risk group (p < 0.001) (Figures 9D–F), which further confirmed the obviously negative association of risk score with tumor microenvironment score by Pearson correlation analysis (Figures 9G–I). Therefore, we can assess the microenvironment of the tumor with the help of the risk score, which will provide a valid reference for the precise treatment of HCC.
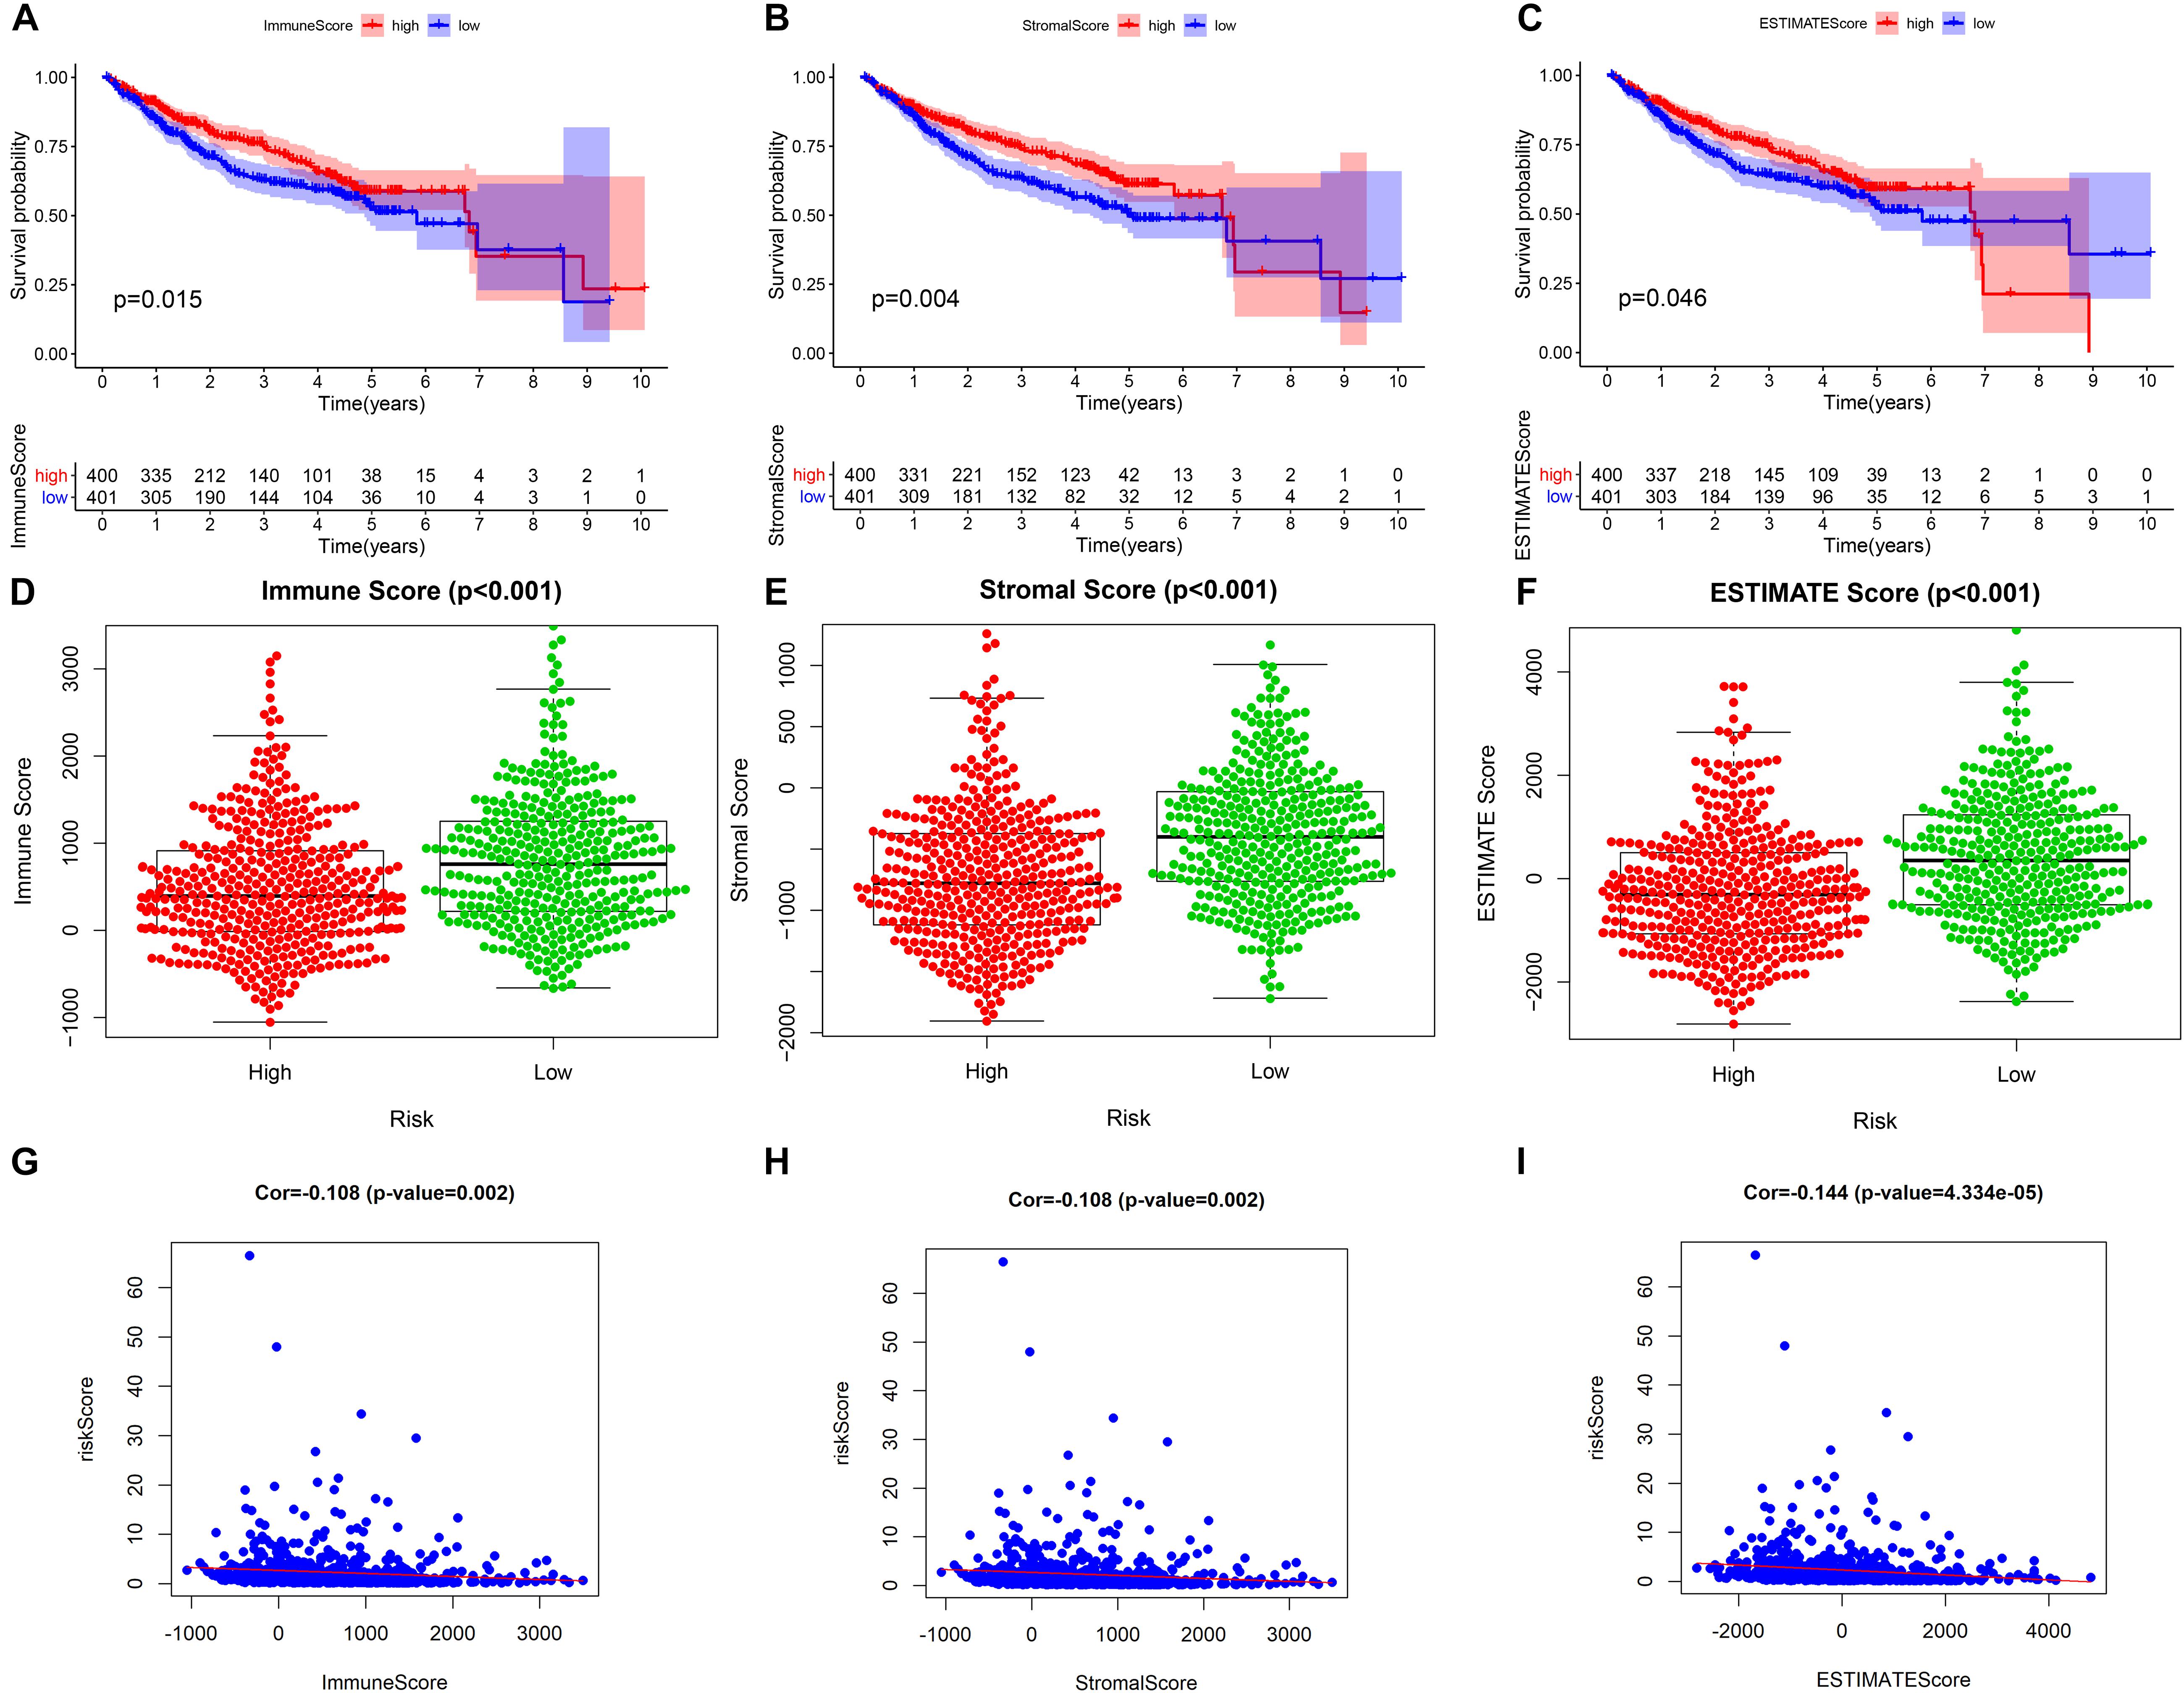
Figure 9. The relationship between the prognostic model and tumor microenvironment. (A–C) Kaplan–Meier survival analysis of patients in the whole cohort using the immune score, stromal score, and ESTIMATE score, respectively. (D–F) Comparison of the immune score, stromal score, and ESTIMATE score in the low- and high-risk groups, respectively. (G–I) Pearson correlation analysis between the risk score and immune score, stromal score, and ESTIMATE score, respectively.
Gene Set Enrichment Analysis Between Different Risk Groups in Three Independent Cohorts
To reveal potential molecular mechanism for the prognostic model, we performed Gene Set Enrichment Analysis (GSEA) between different risk groups in three independent cohorts (Figure 10). The results showed that the high-risk group saw the enrichment of various tumorigenesis-related characteristics, including cell cycle, mismatch repair, homologous recombination, DNA replication, RNA degradation, etc. Most of the pathways that presented a significant enrichment in the low-risk group were related to metabolism. These results provide new clues for exploring the molecular mechanism of HCC in the future.
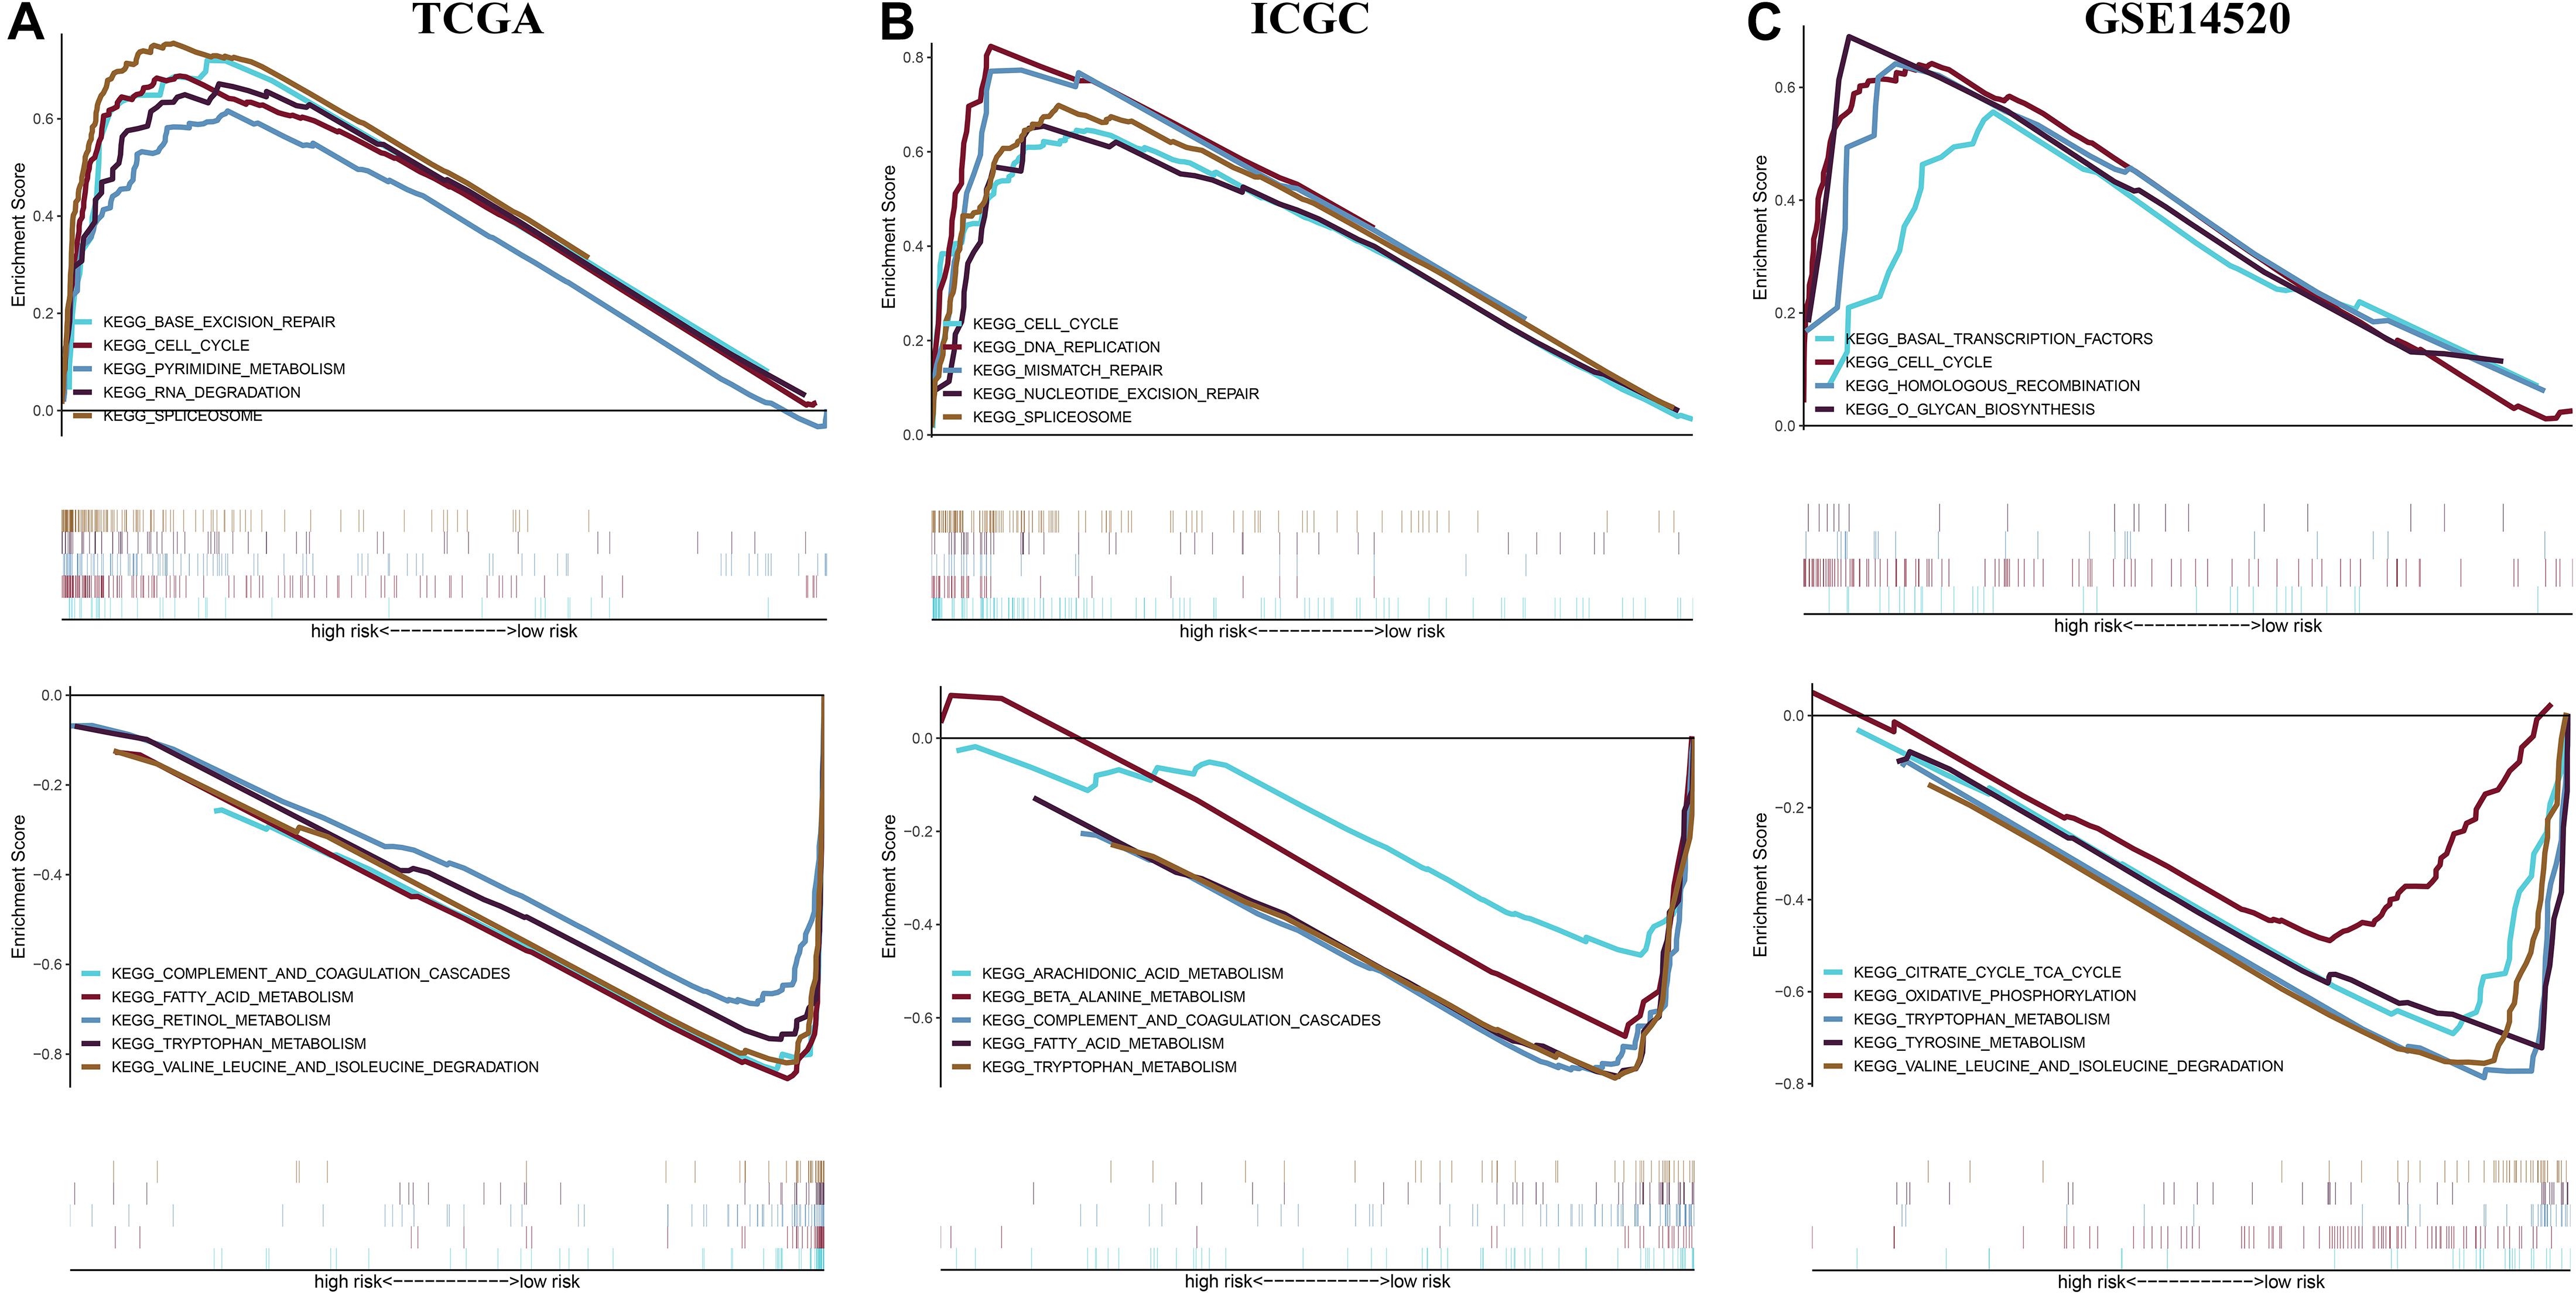
Figure 10. Gene set enrichment analysis between different risk groups in the (A) TCGA cohort, (B) ICGC cohort, and (C) GSE14520 cohort.
Discussion
Hepatocellular carcinoma is the second leading cause of cancer-related death worldwide. During the past 10 years, HCC incidence has increased significantly (Yang et al., 2019). Surgical resection, liver transplantation, or radiofrequency ablation are only suitable for <30% of cases (Park et al., 2015). Sorafenib is the preferred treatment for patients with advanced HCC, but with the occurrence of high-frequency adverse events, there are no obvious improvements in the OS (Llovet et al., 2008). Recently, with the development of the immune microenvironment of the liver tissue, immunotherapy has become a new standard for the treatment of advanced HCC (Llovet et al., 2008).
Immunotherapy, represented by immune-checkpoint inhibitors (ICIs), has made a breakthrough in the clinical treatment of HCC (Hato et al., 2014). With the clinical application of ICIs, the exploration of biomarkers for cancer diagnosis, efficacy, and prognosis has become a hot topic in oncology immunotherapy research. With the development of DNA sequencing technology, the detection of the tumor mutation burden (TMB) has become a common experiment. The role of the TMB as a biomarker in predicting the efficacy of ICIs has been confirmed in a number of clinical studies (Ramalingam et al., 2018; Szustakowski et al., 2018; Vareki, 2018). However, research on the TMB in the prognosis of HCC is still lacking.
At present, how to define high TMB is still controversial worldwide (Chalmers et al., 2017). In this study, with the help of X-title software analysis, we found that when the TMB = 4.2 was used as the boundary between a high and low TMB, the difference in prognosis between the two groups was the greatest. HCC patients with high TMB had a poor prognosis, and these results are consistent with the conclusion of Cai et al. (2020). More interestingly, TMB = 4.2 was used as a cutoff, and the high- and low-TMB groups exhibited an obvious difference regarding immune cell infiltration. In particular, there was an obviously higher proportion of CD8 T lymphocyte infiltration in the high-TMB group than in the low-TMB group. Previous studies have shown that the effect of immunotherapy is positively correlated with the degree of tumor infiltration of CD8 T cells (Durgeau et al., 2018). Therefore, the TMB may further affect the efficacy of immunotherapy by changing the immune microenvironment of tumors, and it is necessary to explore the relationship between the TMB and immune genes.
Our LASSO Cox regression prognostic model included a total of 15 immune gene pairs, and each gene pair was associated with prognosis. To test the effectiveness of the prognostic model, we conducted three levels of validation. First, we split the training dataset, namely, the TCGA-ICGC joint cohort, and returned the patients to their original cohort for internal validation. Second, we regarded the GEO dataset as an external independent cohort to further verify the prediction effect of the model. Finally, we integrated all the samples into a whole cohort to test the prediction ability of the model again. Regardless of the level of validation, the prognosis model could accurately evaluate the prognosis of HCC. The uniform cutoff value was taken into account to divide all subjects into either high- or low-risk group, with the former presenting a weaker prognosis than the latter in each independent cohort, and the prognostic model served as an independent predictor in each independent cohort. Next, we explored the potential mechanism of the model through the tumor microenvironment (TME) score and gene set enrichment analysis. The patients with higher stromal, immune, and estimate scores showed good clinical outcomes, which corresponded to the higher level of the three scores in the low-risk group than in the high-risk group. In addition, GSEA revealed representative oncology features in the high-risk group. These results further confirmed the complex relationship among the TMB, TME, and tumor pathogenesis. According to the above results, we speculated that the change in the TMB may cause a series of cascade reactions, including the change in the immune gene expression levels, and the relative expression level of immune genes may affect the occurrence and development of tumors by disrupting the tumor microenvironment.
It is worth mentioning that we also compared the performance of our model with other reported models. For example, the AUC values of Liu et al. (2019) six-gene signature in predicting the 1-, 3-, and 5-year OS were 0.678, 0.643, and 0.633, respectively, and used the GSE14520 dataset for external validation, while the AUCs for our model predicting the OS at 1, 3, and 5 years were 0.677, 0.702, and 0.698, respectively, and were validated using the GSE14520. The AUC values of the (Li et al., 2019) six-gene signature in predicting the 1-, 3-, and 5-year OS were 0.681, 0.700, and 0.684, respectively, and used the ICGC dataset for the external validation, while the AUCs for our model predicting the OS at 1, 3, and 5 years were 0.906, 0.761, and 0.816, respectively, and were validated using the ICGC dataset. The above results demonstrated the better predictive performance of our model than that of the previous model.
The prognostic model involved 25 genes related to immunity. Studies have confirmed that some genes can affect HCC due to their occurrence, development, and immune regulation abilities. For example, Elise (Ramia et al., 2019) found that, in HCC cell lines, human leukocyte antigen (HLA) class II expression shortage was caused by the lack of the HLA class II transactivator (i.e., CIITA), and interferon-gamma treatment could not improve the situation. Lee et al. (2014) found that CD47(+) HCC cells secreted cathepsin S (CTSS) preferentially using the CTSS/protease-activated receptor 2 (PAR2) loop to regulate liver TICs. Calderaro et al. (2019) identified ESM1 as a reliable microenvironment immunohistochemical marker of macrotrabecular-massive HCC. Cho et al. (2016) revealed that the overexpression of FGR was significantly associated with a shorter time to tumor recurrence in HCC by means of integrative analysis. Chen et al. (2020) found an association between fibroblast growth factor receptor 4 (FGFR4) and the invasion and metastasis of HCC. Guo et al. (2016) demonstrated that elevated intracellular adhesion molecule 1 (ICAM-1) expression in HCC tissues was correlated with portal vein tumor thrombus development and poor clinical outcomes. Tang et al. (2015) found that a higher level of IKBKE in HCC tissues led to poorer HCC prognosis. Ni et al. (2019) demonstrated that the INS could be used to independently predict weak HCC prognosis, particularly for patients in the early stage of HCC. Carmo et al. (2016) speculated that PTX3 could be a risk factor for predicting the occurrence of HCC in chronic hepatitis C. Pinna et al. (2017) revealed that, in the signal transduction induced by liver tumor necrosis factor (TNF), the overexpression of TNFAIP3 inhibited c-JUN N-terminal kinase (JNK) phosphorylation and regulated the immune response given by non-parenchymal cells as well as HCC proliferation and apoptosis.
Although we tested the predictive effect of the prognostic model and explored its mechanism, our study is still a retrospective study. Therefore, it is necessary to carry out a multicenter prospective study before extending it to clinical application. Based on the study results, the relative expression possessed by a pair of immune genes associated with the TMB can significantly affect the prognosis of HCC, especially after the optimal threshold of the TMB has been determined. To our knowledge, similar reports are rare; hence, our future research directions are to reveal the underlying mechanism of this phenomenon through experiments.
Conclusion
Our study explored the immune mechanism of HCC from the perspective of the TMB and established a reliable prognostic evaluation system, which may help to enrich the therapeutic targets of HCC.
Data Availability Statement
The original contributions presented in the study are included in the article/Supplementary Material, further inquiries can be directed to the corresponding author.
Author Contributions
JH designed the study, performed the data analyses and wrote the manuscript. LW and YZ contributed to the conception of the study. LW helped to perform the analysis with constructive discussions. All authors revised the manuscript and reviewed the final version of the manuscript.
Conflict of Interest
The authors declare that the research was conducted in the absence of any commercial or financial relationships that could be construed as a potential conflict of interest.
Supplementary Material
The Supplementary Material for this article can be found online at: https://www.frontiersin.org/articles/10.3389/fmolb.2020.581354/full#supplementary-material
Supplementary Table 1 | The clinical data of the three independent cohorts.
Abbreviations
AFP, α-fetoprotein; DEIRGs, differential expressed immune-related genes; FDR, false discovery rate; GEO, Gene Expression Omnibus; GO, Gene Ontology; HCC, hepatocellular carcinoma; ICGC, International Cancer Genome Consortium; ICIs, immune-checkpoint inhibitors. IGPs, immune gene pairs; KEGG, Kyoto Encyclopedia of Genes and Genomes; LASSO, least absolute shrinkage and selection operator; OS, overall survival; RFS, recurrence-free survival; ROC, receiver operating characteristic; TCGA, The Cancer Genome Atlas; TIME, tumor immune microenvironment; TMB, tumor mutation burden; TME, tumor microenvironment.
Footnotes
- ^ https://portal.gdc.cancer.gov/
- ^ https://icgc.org/
- ^ https://www.ncbi.nlm.nih.gov/geo/
- ^ https://www.immport.org/shared/genelists
References
Alborelli, I., Leonards, K., Rothschild, S. I., Leuenberger, L. P., Savic Prince, S., Mertz, K. D., et al. (2020). Tumor mutational burden assessed by targeted NGS predicts clinical benefit from immune checkpoint inhibitors in non-small cell lung cancer. J. Pathol. 250, 19–29. doi: 10.1002/path.5344
Antonarakis, E. S. (2019). A new molecular taxonomy to predict immune checkpoint inhibitor sensitivity in prostate cancer. Oncologist 24, 430–432. doi: 10.1634/theoncologist.2018-0819
Cai, H., Zhang, Y., Zhang, H., Cui, C., Li, C., and Lu, S. (2020). Prognostic role of tumor mutation burden in hepatocellular carcinoma after radical hepatectomy. J. Surg. Oncol. 121, 1007–1014. doi: 10.1002/jso.25859
Calderaro, J., Meunier, L., Nguyen, C. T., Boubaya, M., Caruso, S., Luciani, A., et al. (2019). ESM1 as a marker of macrotrabecular-massive hepatocellular carcinoma. Clin. Cancer Res. 25, 5859–5865. doi: 10.1158/1078-0432.ccr-19-0859
Carmo, R., Aroucha, D., Vasconcelos, L., Pereira, L., Moura, P., and Cavalcanti, M. (2016). Genetic variation in PTX 3 and plasma levels associated with hepatocellular carcinoma in patients with HCV. J. Viral Hepat. 23, 116–122. doi: 10.1111/jvh.12472
Chalmers, Z. R., Connelly, C. F., Fabrizio, D., Gay, L., Ali, S. M., Ennis, R., et al. (2017). Analysis of 100,000 human cancer genomes reveals the landscape of tumor mutational burden. Genome Med. 9:34.
Charoentong, P., Finotello, F., Angelova, M., Mayer, C., Efremova, M., Rieder, D., et al. (2017). Pan-cancer immunogenomic analyses reveal genotype-immunophenotype relationships and predictors of response to checkpoint blockade. Cell Rep. 18, 248–262. doi: 10.1016/j.celrep.2016.12.019
Chen, B., Khodadoust, M. S., Liu, C. L., Newman, A. M., and Alizadeh, A. A. (2018). Profiling tumor infiltrating immune cells with CIBERSORT. Methods Mol. Biol. 1171, 243–259.
Chen, J., Du, F., Dang, Y., Li, X., Qian, M., Feng, W., et al. (2020). Fibroblast growth factor 19–mediated up-regulation of SYR-related high-mobility group box 18 promotes hepatocellular carcinoma metastasis by transactivating fibroblast growth factor receptor 4 and Fms-related tyrosine kinase 4. Hepatology 71, 1712–1731. doi: 10.1002/hep.30951
Cho, H. J., Kim, S. S., Wang, H. J., Kim, B. W., Cho, H., Jung, J., et al. (2016). Detection of novel genomic markers for predicting prognosis in hepatocellular carcinoma patients by integrative analysis of copy number aberrations and gene expression profiles: Results from a long-term follow-up. DNA Cell Biol. 35, 71–80. doi: 10.1089/dna.2015.3026
Couri, T., and Pillai, A. (2019). Goals and targets for personalized therapy for HCC. Hepatol. Int. 13, 125–137. doi: 10.1007/s12072-018-9919-1
Dunn, P. J., Thomson, E., Campbell, J., Smith, T., Desborough, V., Wiser, J., et al. (2015). “ImmPort: Shared research data for bioinformatics and immunology,” in Proceedings of the 2015 IEEE International Conference on Bioinformatics and Biomedicine (BIBM), (Piscataway, NY: IEEE), 607–610.
Durgeau, A., Virk, Y., Corgnac, S., and Mami-Chouaib, F. (2018). Recent advances in targeting CD8 T-cell immunity for more effective cancer immunotherapy. Front. Immunol. 9:14. doi: 10.3389/fimmu.2018.00014
El Dika, I., Khalil, D. N., and Abou-Alfa, G. K. (2019). Immune checkpoint inhibitors for hepatocellular carcinoma. Cancer 125, 3312–3319. doi: 10.1002/cncr.32076
Floudas, C. S., Brar, G., and Greten, T. (2019). Immunotherapy: current status and future perspectives. Dig. Dis. Sci. 64, 1030–1040.
Galuppini, F., Dal Pozzo, C. A., Deckert, J., Loupakis, F., Fassan, M., and Baffa, R. (2019). Tumor mutation burden: from comprehensive mutational screening to the clinic. Cancer Cell Int. 19:209.
Goodman, A. M., Kato, S., Bazhenova, L., Patel, S. P., Frampton, G. M., Miller, V., et al. (2017). Tumor mutational burden as an independent predictor of response to immunotherapy in diverse cancers. Mol. Cancer Ther. 16, 2598–2608. doi: 10.1158/1535-7163.mct-17-0386
Guo, W., Liu, S., Cheng, Y., Lu, L., Shi, J., Xu, G., et al. (2016). ICAM-1–related noncoding RNA in Cancer stem cells maintains ICAM-1 expression in hepatocellular carcinoma. Clin. Cancer Res. 22, 2041–2050. doi: 10.1158/1078-0432.ccr-14-3106
Hato, T., Goyal, L., Greten, T. F., Duda, D. G., and Zhu, A. X. (2014). Immune checkpoint blockade in hepatocellular carcinoma: current progress and future directions. Hepatology 60, 1776–1782. doi: 10.1002/hep.27246
Imamura, H., Matsuyama, Y., Tanaka, E., Ohkubo, T., Hasegawa, K., Miyagawa, S., et al. (2003). Risk factors contributing to early and late phase intrahepatic recurrence of hepatocellular carcinoma after hepatectomy. J. Hepatol. 38, 200–207. doi: 10.1016/s0168-8278(02)00360-4
Jang, B.-S., Han, W., and Kim, I. A. J. R. (2020). Tumor mutation burden, immune checkpoint crosstalk and radiosensitivity in single-cell RNA sequencing data of breast cancer. Radiother. Oncol. 142, 202–209. doi: 10.1016/j.radonc.2019.11.003
Kanwal, F., and Singal, A. G. (2019). Surveillance for hepatocellular carcinoma: current best practice and future direction. Gastroenterology 157, 54–64. doi: 10.1053/j.gastro.2019.02.049
Kim, J. Y., Kronbichler, A., Eisenhut, M., Hong, S. H., van der Vliet, H. J., Kang, J., et al. (2019). Tumor mutational burden and efficacy of immune checkpoint inhibitors: A systematic review and meta-analysis. Cancers 11:1798. doi: 10.3390/cancers11111798
Lee, T. K. W., Cheung, V. C. H., Lu, P., Lau, E. Y. T., Ma, S., Tang, K. H., et al. (2014). Blockade of CD47-mediated cathepsin S/protease-activated receptor 2 signaling provides a therapeutic target for hepatocellular carcinoma. Hepatology 60, 179–191. doi: 10.1002/hep.27070
Li, W., Lu, J., Ma, Z., Zhao, J., and Liu, J. (2019). An integrated model based on a six-gene signature predicts overall survival in patients with hepatocellular carcinoma. Front. Genet. 10:1323. doi: 10.3389/fgene.2019.01323
Liu, G. M., Zeng, H. D., Zhang, C. Y., and Xu, J. W. (2019). Identification of a six-gene signature predicting overall survival for hepatocellular carcinoma. Cancer Cell Int. 19:138. doi: 10.1186/s12935-019-0858-2
Llovet, J. M., Ricci, S., Mazzaferro, V., Hilgard, P., Gane, E., Blanc, J.-F., et al. (2008). Sorafenib in advanced hepatocellular carcinoma. N. Engl. J. Med. 359, 378–390.
Newman, A. M., Liu, C. L., Green, M. R., Gentles, A. J., Feng, W., Xu, Y., et al. (2015). Robust enumeration of cell subsets from tissue expression profiles. Nat. Methods 12, 453–457. doi: 10.1038/nmeth.3337
Ni, X.-C., Xu, J., Yi, Y., Fu, Y.-P., Cai, X.-Y., Liu, G., et al. (2019). Inflammation–nutrition score predicts prognosis of patients with resectable hepatocellular carcinoma. Int. J. Clin. Oncol. 24, 825–835. doi: 10.1007/s10147-019-01402-4
Park, J. W., Chen, M., Colombo, M., Roberts, L. R., Schwartz, M., Chen, P. J., et al. (2015). Global patterns of hepatocellular carcinoma management from diagnosis to death: the BRIDGE Study. Liver Int. 35, 2155–2166. doi: 10.1111/liv.12818
Pinna, F., Bissinger, M., Beuke, K., Huber, N., Longerich, T., Kummer, U., et al. (2017). A20/TNFAIP3 discriminates tumor necrosis factor (TNF)-induced NF-κB from JNK pathway activation in hepatocytes. Front. Physiol. 8:610. doi: 10.3389/fphys.2017.00610
Ramalingam, S. S., Hellmann, M. D., Awad, M. M., Borghaei, H., Gainor, J., Brahmer, J., et al. (2018). Abstract ct078: Tumor mutational burden (tmb) as a biomarker for clinical benefit from dual immune checkpoint blockade with nivolumab (nivo)+ ipilimumab (ipi) in first-line (1l) non-small cell lung cancer (nsclc): Identification of tmb cutoff from checkmate 568. Cancer Res. 78:CT078.
Ramia, E., Chiaravalli, A. M., Bou Nasser Eddine, F., Tedeschi, A., Sessa, F., Accolla, R. S., et al. (2019). CIITA-related block of HLA class II expression, upregulation of HLA class I, and heterogeneous expression of immune checkpoints in hepatocarcinomas: implications for new therapeutic approaches. Oncoimmunology 8:1548243. doi: 10.1080/2162402x.2018.1548243
Schrock, A., Ouyang, C., Sandhu, J., Sokol, E., Jin, D., Ross, J., et al. (2019). Tumor mutational burden is predictive of response to immune checkpoint inhibitors in MSI-high metastatic colorectal cancer. Ann. Oncol. 30, 1096–1103. doi: 10.1093/annonc/mdz134
Shi, J., and Walker, M. G. (2007). Gene set enrichment analysis (GSEA) for interpreting gene expression profiles. Curr. Bioinform. 2, 133–137. doi: 10.2174/157489307780618231
Szustakowski, J. D., Green, G., Geese, W. J., Zerba, K., and Chang, H. (2018). Evaluation of tumor mutation burden as a biomarker for immune checkpoint inhibitor efficacy: a calibration study of whole exome sequencing with foundation one. Cancer Res. 78:5528.
Tang, D., Sun, B., Yu, H., Yang, Z., and Zhu, L. (2015). Tumor-suppressing effect of miR-4458 on human hepatocellular carcinoma. Cell Physiol. Biochem. 35, 1797–1807. doi: 10.1159/000373991
Vareki, S. M. (2018). High and low mutational burden tumors versus immunologically hot and cold tumors and response to immune checkpoint inhibitors. J. Immunother. Cancer 6:157.
Yang, J. D., Hainaut, P., Gores, G. J., Amadou, A., Plymoth, A., and Roberts, L. R. (2019). A global view of hepatocellular carcinoma: trends, risk, prevention and management. Nat. Rev. Gastroenterol. Hepatol. 16, 589–604. doi: 10.1038/s41575-019-0186-y
Ye, W., Chen, C., Gao, Y., Zheng, Z.-S., Xu, Y., Yun, M., et al. (2017). Overexpression of SLC34A2 is an independent prognostic indicator in bladder cancer and its depletion suppresses tumor growth via decreasing c-Myc expression and transcriptional activity. Cell Death Dis. 8, e2581. doi: 10.1038/cddis.2017.13
Zhang, C., Li, Z., Qi, F., Hu, X., and Luo, J. (2019). Exploration of the relationships between tumor mutation burden with immune infiltrates in clear cell renal cell carcinoma. Ann. Transl. Med. 7:648. doi: 10.21037/atm.2019.10.84
Keywords: hepatocellular carcinoma, tumor mutation burden, immune, prognostic, signature
Citation: Huo J, Wu L and Zang Y (2020) A Prognostic Model of 15 Immune-Related Gene Pairs Associated With Tumor Mutation Burden for Hepatocellular Carcinoma. Front. Mol. Biosci. 7:581354. doi: 10.3389/fmolb.2020.581354
Received: 28 July 2020; Accepted: 08 October 2020;
Published: 13 November 2020.
Edited by:
Anton A. Buzdin, I. M. Sechenov First Moscow State Medical University, RussiaReviewed by:
Jacopo Junio Valerio Branca, University of Florence, ItalyXingen Zhu, Second Affiliated Hospital of Nanchang University, China
Copyright © 2020 Huo, Wu and Zang. This is an open-access article distributed under the terms of the Creative Commons Attribution License (CC BY). The use, distribution or reproduction in other forums is permitted, provided the original author(s) and the copyright owner(s) are credited and that the original publication in this journal is cited, in accordance with accepted academic practice. No use, distribution or reproduction is permitted which does not comply with these terms.
*Correspondence: Liqun Wu, d3VscTU4MTBAMTI2LmNvbQ==