
94% of researchers rate our articles as excellent or good
Learn more about the work of our research integrity team to safeguard the quality of each article we publish.
Find out more
ORIGINAL RESEARCH article
Front. Microbiomes, 09 April 2025
Sec. Environmental Microbiomes
Volume 4 - 2025 | https://doi.org/10.3389/frmbi.2025.1395519
This article is part of the Research TopicInteractions Between Natural and Built Environment Microbiomes in a One Health ContextView all 6 articles
 Gwynne Á. Mhuireach1*
 Susan Collins1†
 Leslie Dietz1†‡
 Patrick Finn Horve2
 Aurélie Laguerre3Dale Northcutt1Jason Stenson1Kevin Van Den Wymelenberg1†Elliott Gall4
 Mark Fretz1
Introduction: Humans have used wood as a construction material throughout history. Currently, mass timber products, such as cross-laminated timber (CLT), are becoming more popular as a structural material, since they are renewable and have a lower carbon footprint than concrete or steel. Nonetheless, some building types, such as healthcare, veterinary, and food manufacturing, avoid using structural mass timber due to concerns about microbial growth in the event of wetting. One solution is to use protective coatings on mass timber products to increase moisture resistance, although the coatings themselves may generate concerns about volatile organic compound (VOC) emissions. Natural uncoated wood also produces VOCs, some of which may have intrinsic antimicrobial effects.
Methods: In this study, we inoculated coated and uncoated cross- laminated timber (CLT) blocks with a mock microbial community and isolated each block within individual sealed microcosms. We characterized VOCs and surface microbial communities from the CLT blocks before, during, and after wetting periods of varying durations. VOC concentration and emission rate were analyzed with chromatography-mass spectrometry (GC-MS), while microbial community abundance, diversity, and composition were analyzed through qPCR and shotgun metagenomics.
Results: VOC emissions were elevated immediately after inoculation, then decreased through the remainder of the experiment, except for a plateau during the wetting period. VOCs from uncoated CLT blocks were primarily terpenes, while coated blocks emitted VOCs associated with coatings, plastics, and industrial solvents, as well as terpenes. One VOC—acetoin (3-hydroxy, 2-butanone)—was present at high levels across all samples immediately after microbial inoculation. Bacteria comprised 99.54% of the identified microbial sequences. The plastic control microcosm (not containing a CLT block) had higher abundance of viable bacteria for the majority of the study, but there was no difference in abundance between coated and uncoated blocks. Prior to wetting periods, microbial composition was driven primarily by sampling day, whereas surface type played a larger role during and after wetting periods.
● VOC emissions decreased over time.
● Coated CLT generally emitted more VOCs than uncoated.
● More microbial biomass was recovered from the plastic control box than CLT blocks.
● Microbial composition responded differently to wetting, depending on whether blocks were coated or uncoated.
Structural mass timber products, such as cross-laminated timber (CLT), offer a sustainable alternative to conventional construction materials, like concrete and steel (Abed et al., 2022; Comnick et al., 2021; Duan et al., 2022; Puettmann et al., 2021; Skullestad et al., 2016; Tupenaite et al., 2023). In fact, substituting wood for more carbon-intensive materials in half of new urban construction globally could help meet 2030 emissions goals by contributing up to 9% of the needed emissions reduction (Himes and Busby, 2020).
In addition to its environmental benefits, mass timber construction may offer occupant health and comfort benefits (Augustin and Fell, 2015; Burnard and Kutnar, 2015; Fell, 2010; Kotradyova et al., 2019; Nyrud et al., 2010; Sakuragawa et al., 2005; Zhang et al., 2017). Exposed wood in buildings is visually appealing, buffers humidity, and provides a pleasant odor. Studies have shown that occupants experiencing wood environments had more positive emotions, less fatigue, and were more comfortable than those experiencing non-wood environments (Zhang et al., 2016).
Despite its recognized benefits, concern about exposed wood surfaces, including mass timber, persists due to its potential to harbor microorganisms and difficulty of sanitation. However, a large body of research indicates that wood surfaces are generally very low risk for transferring microorganisms compared with other common building and furnishing materials. For instance, Mhuireach et al. (2021) found that viable bacterial load on CLT was lower than concrete, earthen plaster, or painted gypsum board. Numerous other studies in healthcare, food manufacturing, and laboratory environments have concluded that, from a hygiene perspective, wood performs as well, or better, than plastic, vinyl, or steel surfaces (Aviat et al., 2016; Boersig and Cliver, 2010; Koch et al., 2002; Munir et al., 2019). Because wood is porous and microorganisms can enter the fabric of the wood, they become unrecoverable by surface contact after a short period of time (Abrishami et al., 1994; Ak et al., 1994). While surface porosity may partly explain these results, wood also emits a class of volatile organic compounds (VOCs) known as terpenes. These terpenes may contribute to the low survival rates of several pathogens, including methicillin-resistant Staphylococcus aureus (MRSA) and Escherichia coli (Coughenour, 2009; Da Costa et al., 2008; Greatorex et al., 2011; Pailhoriés et al., 2017; Vainio-Kaila et al., 2017). Although exposure to some VOCs, like benzene and toluene, causes detrimental health effects in humans, terpenes are associated with various health benefits, including reductions in stress, cortisol levels, and heart rate, increase in activity of natural killer cells (lymphocytes that play a key role in the innate immune system), and acting as a natural antimicrobial (Antonelli et al., 2019; Cho et al., 2017; Ikei et al., 2017; Matsubara and Kawai, 2014). Even very high levels of terpenes, such as α-pinene and δ3-carene, have been demonstrated not to have toxic effects (Gminski et al., 2010; Junge et al., 2021). For softwoods, including pine and fir, which are commonly used in the production of CLT, the majority (70–90%) of VOC emissions are terpenes (Pohleven et al., 2019). On the other hand, it is worth noting that terpenes can also contribute to generation of secondary products, which may be harmful, through interaction with indoor ozone (Weschler and Shields, 1999).
Although the existing literature supports the use of exposed wood surfaces in buildings under normal conditions, exposure to moisture may lead to microbial overgrowth and increased VOC emissions, which could have unintended negative health consequences. At moisture content (MC) levels above 30%, wood is more susceptible to fungal degradation (Cappellazzi et al., 2020), although mould growth can occur immediately at RH above 70–75% (Viitanen and Ojanen, 2007) or wood MC above 15% (Olsson, 2020). Despite the numerous positive characteristics of mass timber construction, architects and developers have encountered market barriers related to growth of mold and potential for biological deterioration in response to wetting (Mjörnell and Olsson, 2019). A number of studies have investigated the consequences of exposure to weather during construction of mass timber buildings (Kordziel et al., 2019, 2020; Kukk et al., 2022; Mjörnell and Olsson, 2019; Riggio et al., 2019; Schmidt et al., 2019), however, few studies have examined change in microbial communities on wetted mass timber under post-occupancy conditions, as might occur during unpredicted water intrusion (e.g., plumbing leak). Research to date has also focused primarily on fungal growth (Lepage et al., 2019; Pasanen et al., 2000; Wang et al., 2018), with less attention paid to bacterial taxa and little to no assessment of archaeal or viral taxa.
The goal of this research is to examine how physical and chemical qualities, including associated VOCs, of coated and uncoated CLT affect surface microbial communities under dry and several different wetting scenarios representing a range of duration and severity of moisture exposure that might be encountered in occupied buildings. We asked the following research questions:
1. Does wetting impact VOC emissions from coated or uncoated CLT blocks?
2. Does wetting impact microbial abundance, diversity, or composition?
3. Are VOC emissions from coated or uncoated CLT blocks associated with microbial abundance, diversity, or composition?
This experiment took place at the Institute for Health in the Built Environment at the University of Oregon (Eugene, Oregon, USA) between October 2020 and April 2021. We assessed hygienic and moisture performance of coated and uncoated CLT by examining VOCs and surface microbial communities before, during, and after wetting events of varying duration. Microbial and VOC samples from three replicates of coated and uncoated CLT blocks, nested within three series representing different wetting durations, were collected over the 4-month period (Figure 1).
● Series 1 short-duration wetting (20-minute spray of tap water on a single day).
● Series 2 medium-duration wetting (20-minute spray of tap water every day for 1 week) conducted immediately after Series 1 using the same microcosms but different CLT samples.
● Series 3 long-duration wetting (20-minute spray of tap water every day for 4 weeks) conducted in parallel with Series 1 and 2.
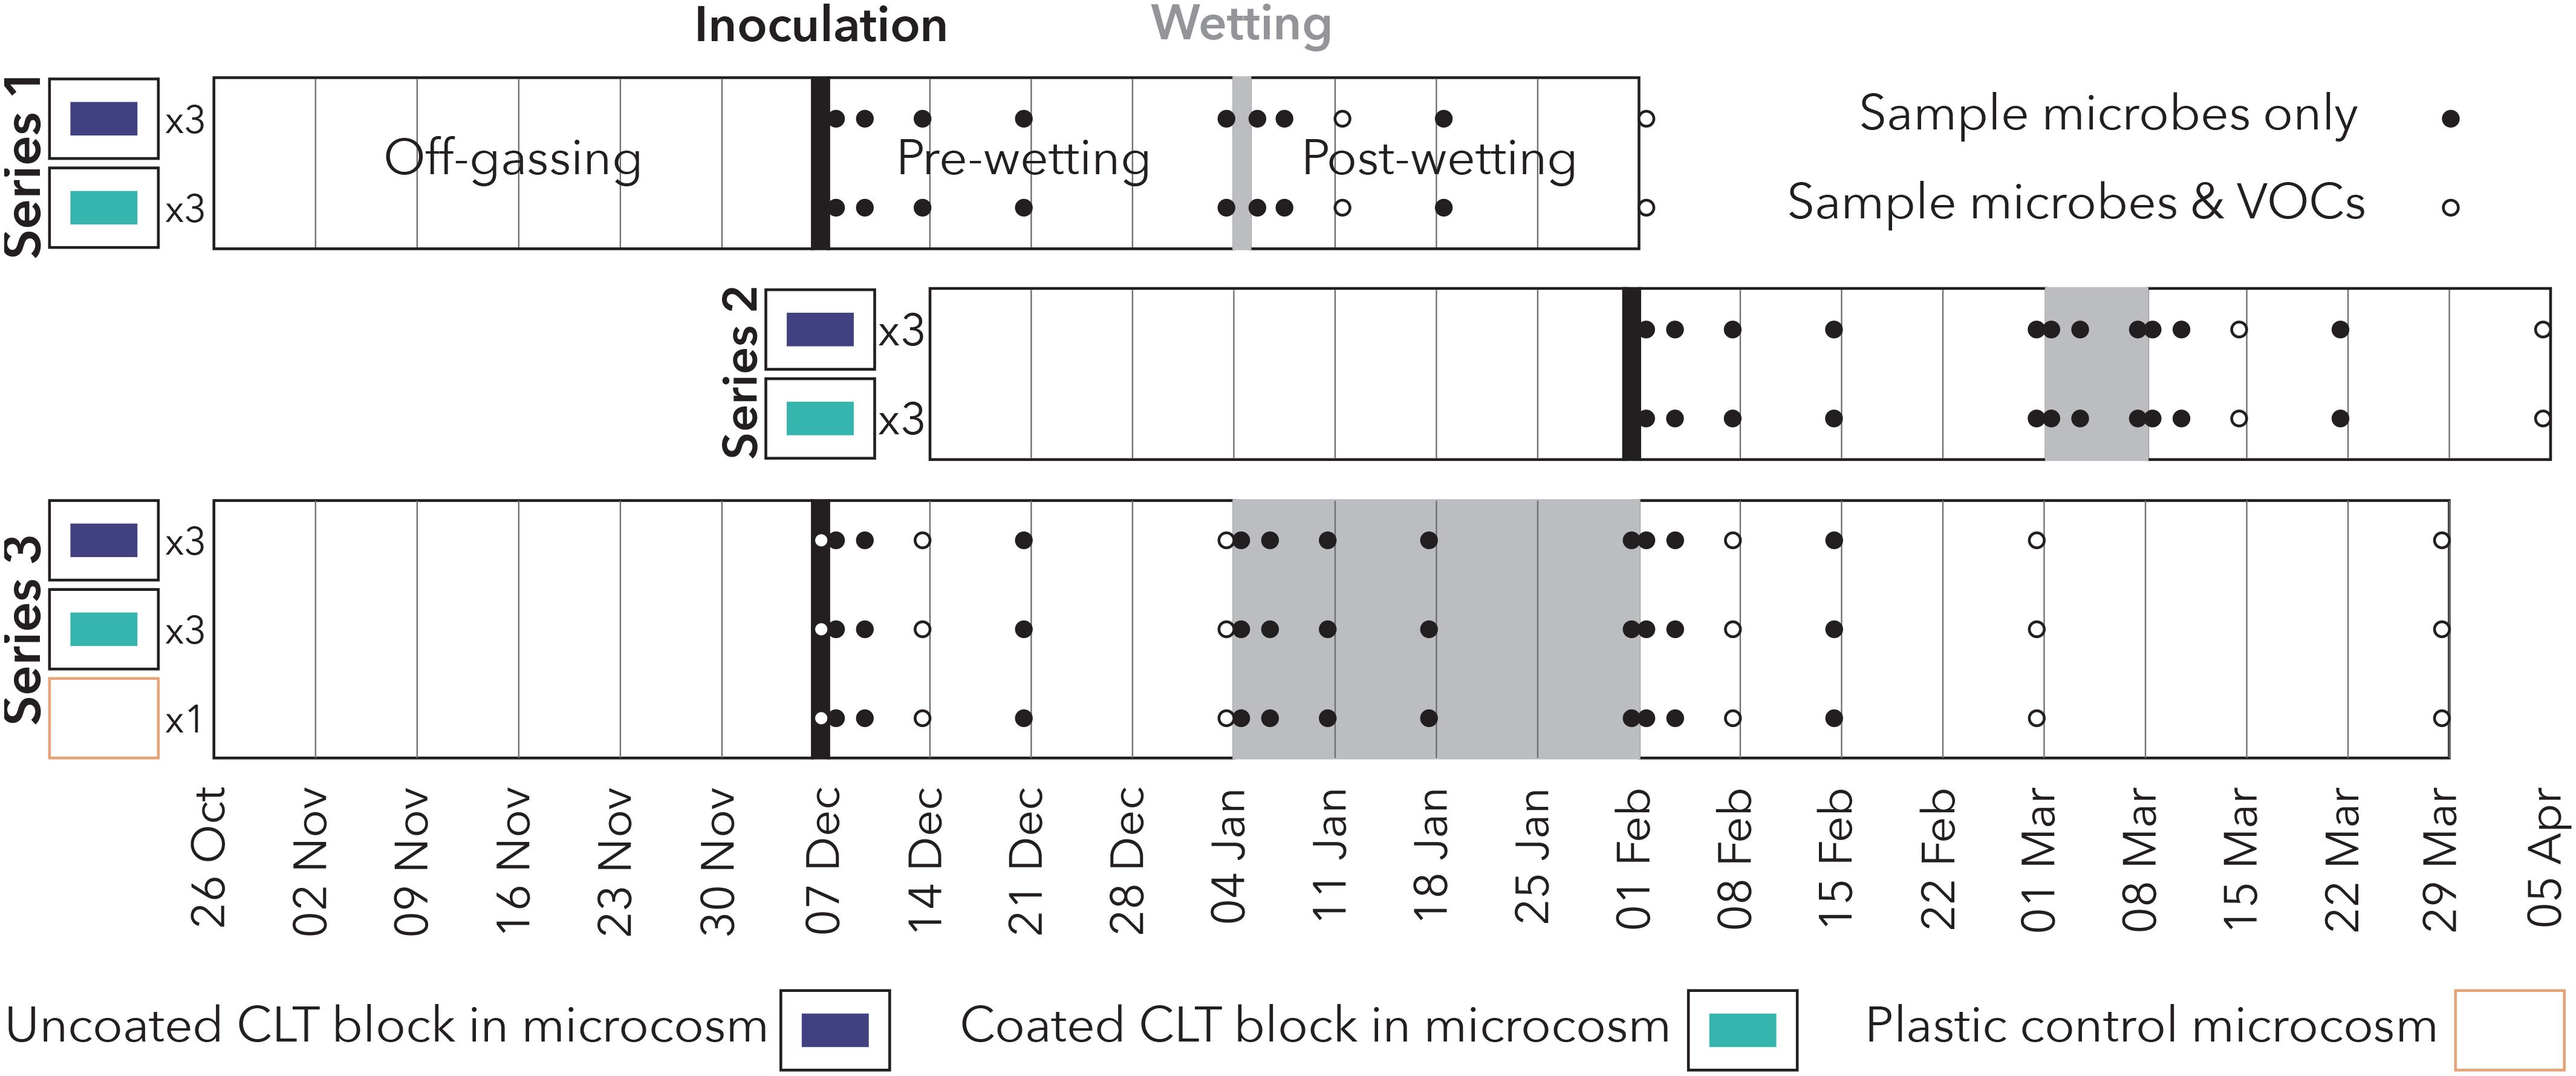
Figure 1. Experimental design of the study, comprising three series with varying wetting durations. Series 1 and 2 occurred sequentially using the same (disinfected) microcosms, while Series 3 occurred in parallel.
Each CLT block was placed in an ethanol-disinfected microcosm to eliminate contamination from other sources while controlling ventilation, temperature and humidity conditions. The experiment was broken into four phases: CLT coating and off-gassing, initial colonization under dry conditions, a wetting period of variable duration according to series, and a post-wetting period. The main objectives of this experimental design were to: 1) assess how wetting affects microbial abundance, diversity, and composition on coated and uncoated CLT surfaces over time; 2) assess how wetting affects VOC emissions from coated and uncoated CLT surfaces over time; and 3) assess how VOC emissions are related to microbial abundance, diversity, and composition.
A 122 × 244 × 10 cm (48 × 96 × 4 in) three-ply spruce pine fir (SPF) CLT panel was produced from sustainably forested wood sourced in the Pacific Northwest by Vaagen Timbers using melamine urea formaldehyde (MUF) adhesive. Eighteen identical 28 × 46 × 10 cm (12 × 1 8× 4 in) CLT blocks were cut with a five-axis CNC fabrication machine (Uniteam UT9) at the A.A. “Red” Emmerson Advanced Wood Products Lab at Oregon State University (OSU). Half of the blocks received two coats of Sansin KP-12W Protective Undercoat on all surfaces. This product is an aqueous, low-VOC wood undercoat formulated to repel moisture and reduce water absorption. According to the KP-12W Safety Data Sheet, the product contains 3-iodo-2-propynyl butylcarbamate (CAS#: 55406-53-6), 2-butoxyethanol (CAS#: 111-76-2), ammonium hydroxide (CAS#: 1336-21-6), and 2-amino-2-methyl-1-propanol (CAS#: 124-68-5). 3-Iodo-2-propynyl butylcarbamate is a widely-used fungicide. The first coat was applied to the unfinished top and sides of each block, allowed to dry for six hours, followed by the second coat, then the blocks were flipped and coatings similarly applied to the final surfaces. Blocks were disinfected with ethanol, placed in individual microcosms, and microcosm air flushed with a high air exchange rate of at least 140 air changes per hour (ACH) for six weeks during the off-gassing period. Pin-type moisture meters (Delmhorst Instrument Company BD-2100) were installed in the center of the upward-facing surface of each CLT block to measure wood moisture content (MC) at 6.35, 12.70, and 19.05 mm (0.25, 0.5 and 0.75 in) below the surface. Pins were coated on all exposed metal surfaces, except the tips, to ensure measurements accurately reflected the correct depth. They were hammered in through pre-drilled plastic blocks that allowed for constant depth and spacing without pre-drilling of wood, which could allow moisture to penetrate through the hole itself. Plastic blocks were removed prior to wiring the pins through junction blocks. Silicone was applied immediately around the pin to provide an additional barrier against moisture penetration through the hole.
Microcosms were designed to eliminate contamination from other sources while controlling ventilation, temperature, and humidity conditions (Figure 2), similar to our previous experiment (Mhuireach et al., 2021). CLT blocks were placed on ABS pipe couplings to raise the sample about 40 mm above the microcosm floor, which prevented them from sitting in pooled water during the wetting events. Large (approximately 137.6 L) plastic storage bins were modified to accept nitrile chemistry gloves (ULINE S-19714-L) on the outward-facing side for sample collection, an access port for sampling swabs, a VOC sampling port, a ventilation duct supplying charcoal-filtered (Air Box 4 2000 CFM, Stealth edition) air on the opposite side, an exhaust air port, tubing for the irrigation emitters (Raindrip 153000) used to simulate wetting events, a water drain, and moisture meter wires. Each microcosm was sealed airtight and balanced at 2 to 3 Pa of positive air pressure, equivalent to 4 to 5 ACH in the sealed microcosms, with exhaust air exiting through the designated port. We used this airflow rate because, according to ASHRAE Standard 1702021 (ASHRAE, 2021), typical outpatient spaces require 2–3 ACH, while inpatient spaces, such as exam, treatment, and general patient rooms, require 4–6 ACH. Environmental conditions inside each microcosm (temperature, relative humidity, differential pressure) were monitored at 5-minute intervals with a HOBO data logger (Onset UX100).
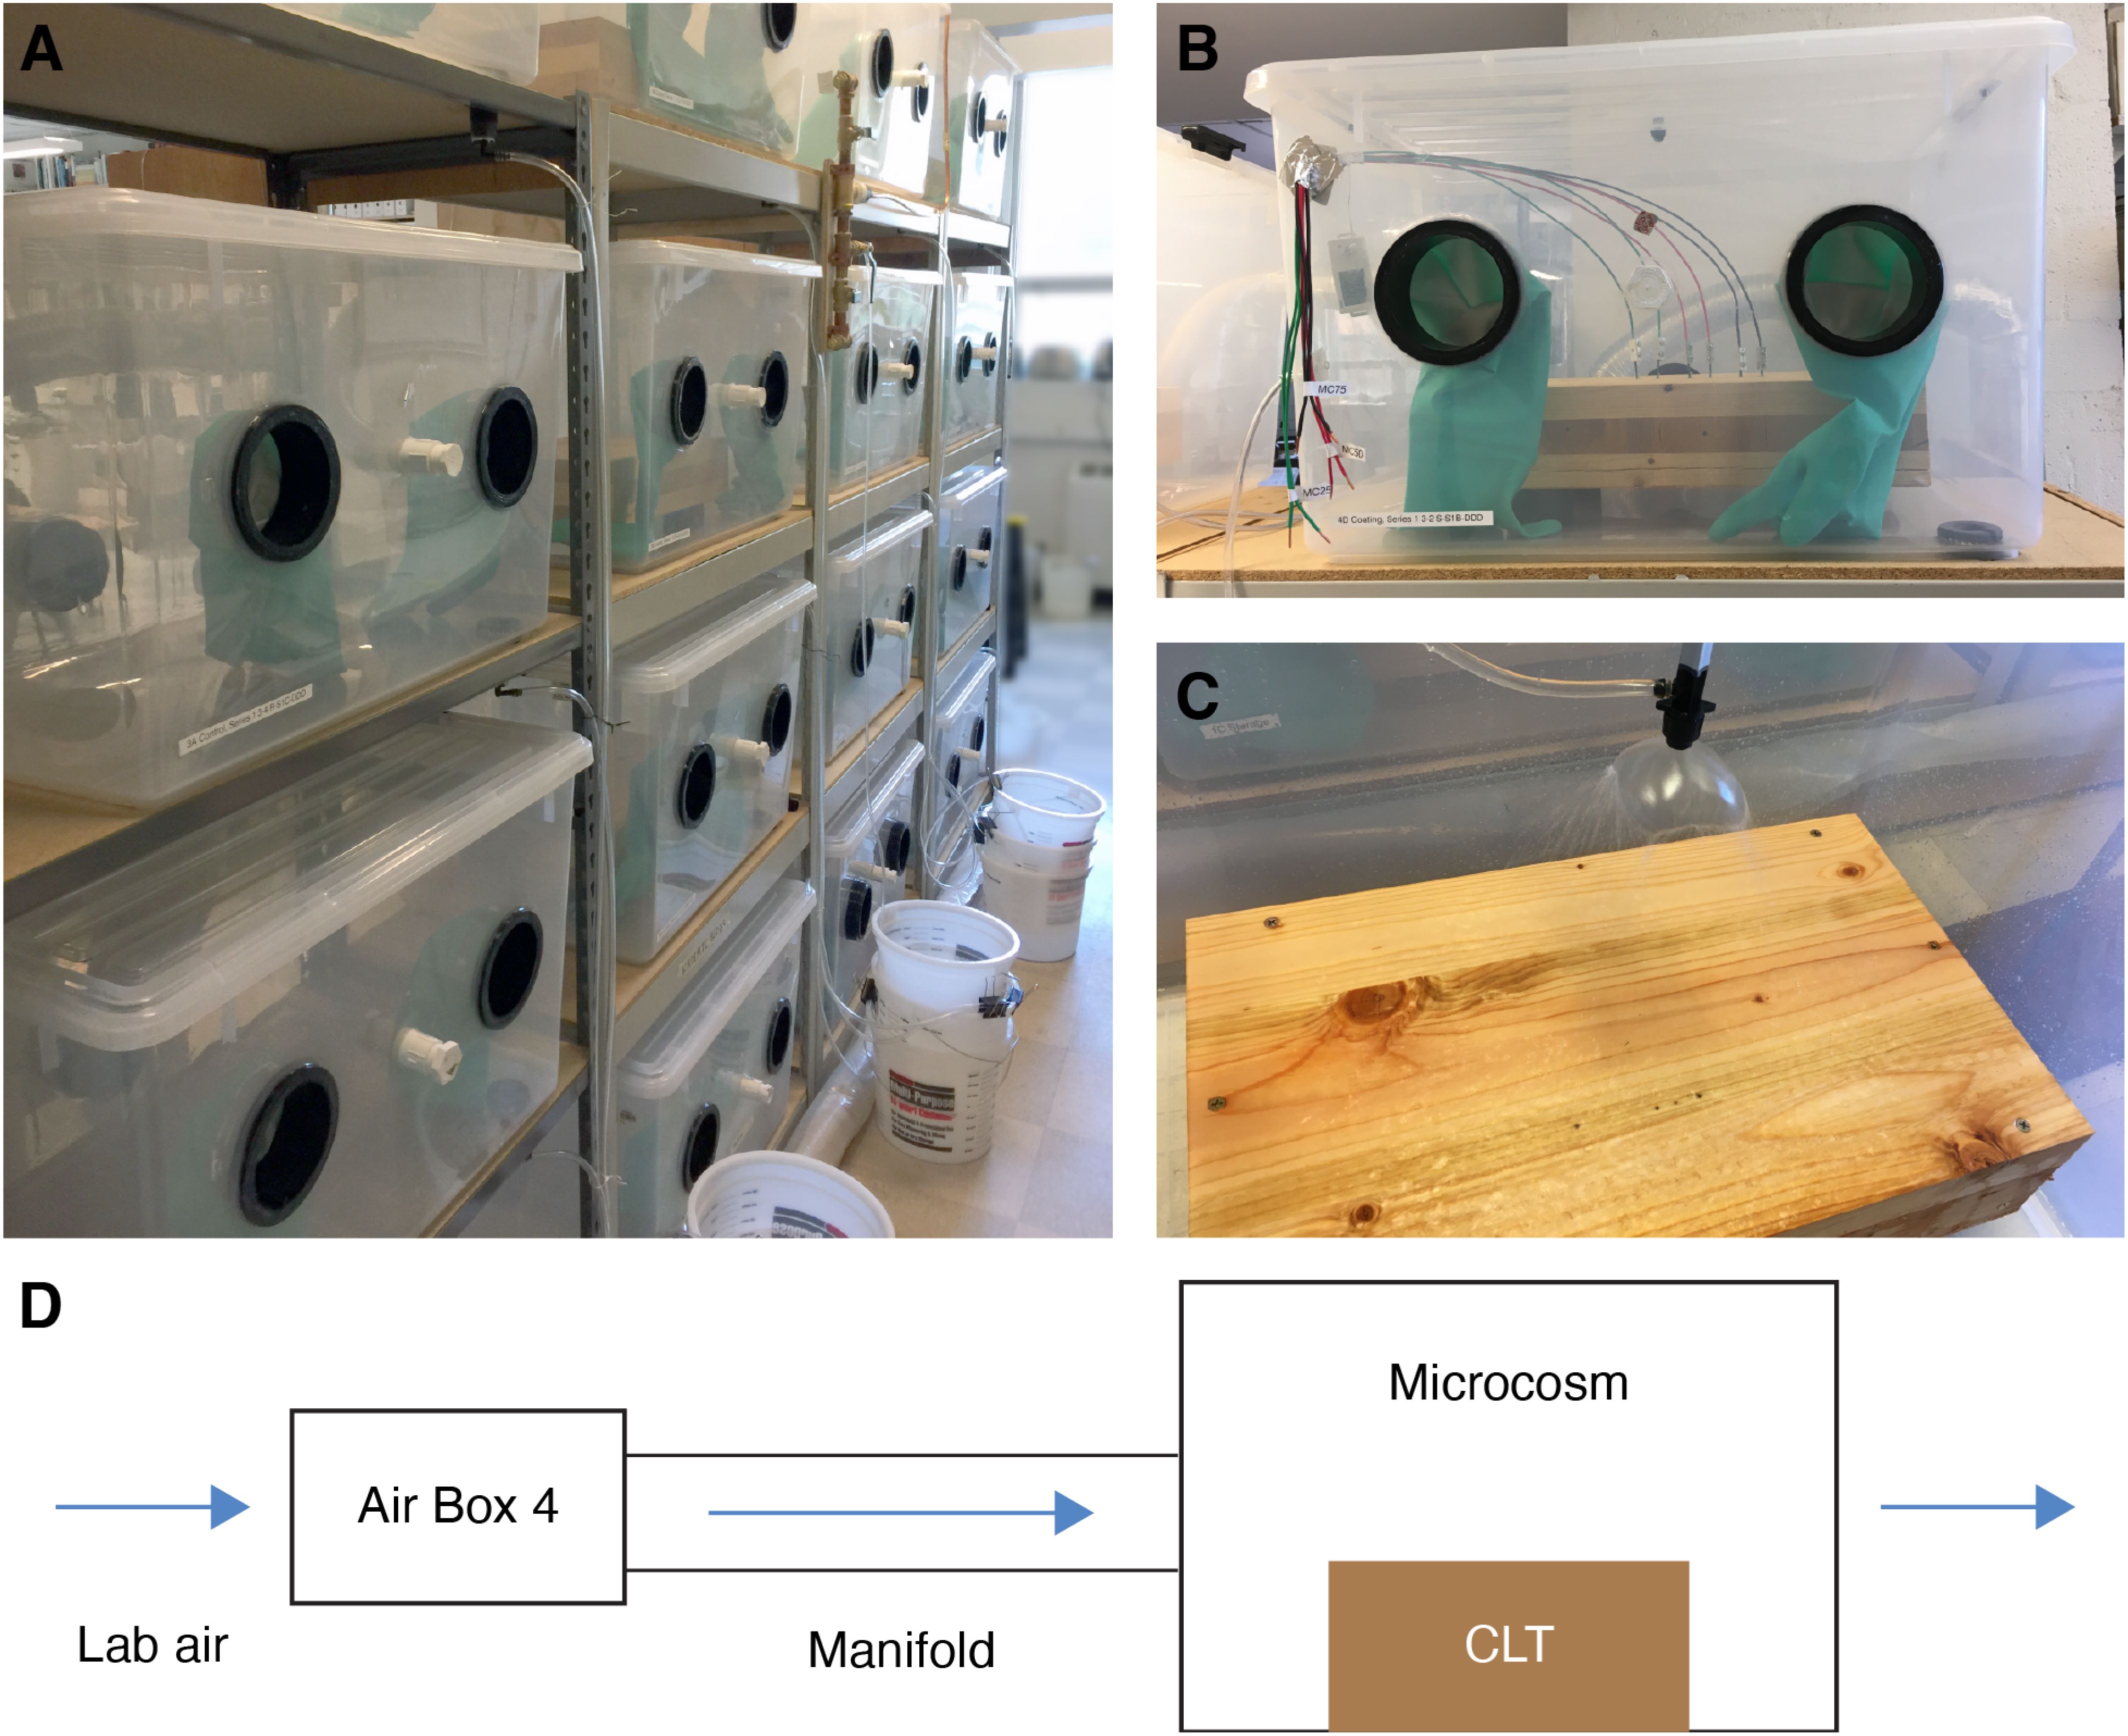
Figure 2. Photo of assembled microcosm array (A), individual microcosm containing CLT block with moisture sensors (B), wetting spray pattern (C), and schematic of air filtration and delivery system (D).
After the offgassing period, blocks were inoculated with a mock community containing Escherichia coli, Pseudomonas fluorescens, Staphylococcus aureus, Salmonella typhimirium, and Staphylococcus epidermidis, which are human-associated bacteria commonly encountered indoors. To create the mock community, each organism was incubated overnight on an LB agar plate. Following overnight incubation, one colony from each plate was transferred to a 15 mL conical tube containing LB broth and again incubated overnight. Successful cultures were centrifuged to pellet the cells, supernatant liquid was carefully removed, and 250 µL of sterile 1× PBS buffer solution was added. Cultures were then combined into a single tube and mixed thoroughly. Each block received 10 µL of this mock community suspension, which was applied across the entire wood surface with a sterilized spreader. The mock community was also applied to a control microcosm, which was identical to those used for the experiment, but did not contain a CLT block and was not subjected to the wetting event.
During the first phase of each series, blocks remained dry inside their respective microcosms to allow ecological succession of the mock community to stabilize. In this initial establishment period, microbial samples were collected immediately after inoculation and then 1, 3, 7, 14, and 28 days after being placed in the microcosms to characterize microbial survival, growth, and compositional change on dry wood and the plastic control microcosm. Nylon-flocked swabs (Copan Diagnostics) saturated with a 1× phosphate-buffered saline (PBS) solution were used to collect all microbial samples. Each block was sampled by moving the swab in multiple “S” patterns across the entire surface, while rotating the swab tip to ensure adequate biomass; a similar procedure was used to collect samples from the plastic bottom surface of the control microcosm.
For the wetting events, blocks were subjected to a continuous metered spray of untreated tap water for 20 min per day, a total average dose of 8.45 L (Supplementary Figure S1). A first flush of water was performed prior to each wetting event—water was purged for three minutes at the sink and for one minute from the sink to a 10 psi pressure regulator. Following the first flush protocol, water was passed through a manifold of needle valves to ensure equivalent flow rates to each irrigation emitter. After each wetting event, water was drained through the microcosm drain ports into containers for measurement. During Series 2, lab staff were unable to perform the wetting event for two days due to illness, thus this series was extended by one day. A single day of wetting was also missed during Series 3. The plastic control box did not undergo wetting. Tap water was expected to contain a variety of microorganisms, thus several samples were collected over the course of the experiment to identify which microbial taxa might be contributed to the surfaces of CLT blocks from the wetting event versus which taxa increased or decreased in relative abundance due to greater moisture availability after wetting.
Microbial samples were collected immediately after each wetting event and 1, 3, 7, 14, and 28 days later, following the same swabbing protocol as described above. An additional timepoint (post-wetting day 56) was sampled for Series 3 to assess whether the longer wetting duration impacted wood moisture content or microbial community composition over a longer time period. All microbial samples were immediately placed in a −20 °C freezer and stored until processing at the Biology and the Built Environment (BioBE) Center at the University of Oregon (UO) in Eugene, Oregon.
For VOC sampling, three technical replicates were collected from each microcosm and incoming laboratory air. Field blanks were also collected to assess potential VOC contamination from the researcher, transport, storage, or other experiment activities. Incoming laboratory air samples were used to determine initial concentration (C0) of identified VOCs directly after filtration and calculate emission rate from the materials. Samples were collected at two timepoints (Figure 1; 1 week and 4 weeks post-wetting) for Series 1 and Series 2, and six timepoints (Figure 1; immediately post-inoculation, 1 week and 4 weeks post-inoculation, and 1 week, 4 weeks, and 8 weeks post-wetting) for Series 3.
VOC collection protocols were identical to our prior experiment (Mhuireach et al., 2021). Briefly, samples were collected in glass sorbent tubes (PerkinElmer #N9307008) packed with 180 mg of Carbotrap B followed by 70 mg of Carboxen 1000 (Pankow et al., 1998) using a portable sampling pump (Universal PCXR8, SKC Inc., USA). Tubes were conditioned prior to each sampling timepoint, sealed with stainless steel Swagelok endcaps fitted with PTFE ferrules, and stored in plastic resealable bags at −6 °C prior to sample collection. All sampling and analysis of sorbent tubes occurred within a month after conditioning. The sampling was performed at a flow rate of 50 mL/min for 60 min with a total sample volume of 3 L for each sample. Two pumps were used for these experiments and the flow of each pump was measured each day (average of 15 measurements for each pump) using a primary flow calibrator (Gilian Gilibrator 2). After sampling, the sorbent tubes were capped and stored in two plastic resealable bags at −4 °C until analysis.
The samples were analyzed using an Absorption/Thermal Desorption (ATD) instrument (PerkinElmer TurboMatrix 650) connected to a gas chromatograph (model 7890 A, Agilent Technologies) with a DB-VRX column (60 m length × 0.25 mm i.d. × 1.4 µm film thickness, Agilent J&W) coupled to a mass selective detector (model 5975 C, Agilent Technologies). Each sample was desorbed at 300 °C for 10 minutes and all compounds were concentrated into a cold trap at −30 °C. Samples were then injected in a split/splitless injector maintained at 180°C. The injector was in split mode with a split flow of 2.76 mL/min. Helium was used as the carrier gas at a constant flow of 0.92 mL/min. The oven temperature started at 45 °C for 10 minutes, then increased by 12 °C/minute until reaching 190°C, after which it was maintained isothermal for 2 minutes. The temperature was raised again at 6 °C/min until reaching 240°C, kept isothermal for 5 minutes, and finally decreased at a rate of 10°C/min until reaching 210 °C. The mass spectrometry (MS) conditions were: transfer line at 230 °C, ion source at 250 °C and EI voltage at 70 eV. Data were recorded in full scan mode (m/z range: 34–400 amu).
Compounds were identified on the basis of their mass spectra and the injection of standards. The mass spectra were compared with those from two databases: National Institute of Standards and Technology (NIST) Mass Spectral Database 2008 (NIST08) and W8N08 library (John Wiley & Sons, Inc., USA). For visualization purposes, compounds were classified by putative sources (Supplementary Table S1), according to the National Center for Biotechnology Information (NCBI) PubChem database.
Quantification was achieved with five-point external calibration using a TO-15 gas mixture containing a representative mix of VOCs (65 component) from Linde (Alpha, NJ, USA) certified to ± 5% accuracy allowing for the identification and quantification of compounds. To verify thermodesorption and analysis efficiency and to obtain relative concentrations for those compounds lacking standards, four internal standards were also injected in each sample. Masses quantified on field blanks were removed from all the samples (coated and uncoated CLT blocks, plastic control microcosm, inlet air, and lab air). Emissions from the control microcosm were subtracted from calculated emission rates for microcosms containing CLT blocks; this allowed us to obtain VOCs emitted by the materials and the microorganisms inhabiting them. To calculate emission rates, we assumed steady state conditions in the microcosms, as they were in operation for approximately four months. A mass balance written on each chamber, assuming constant chamber volume, flow rate during a given sampling period, and emission rate is shown in Equation 1:
where:
V = Volume of the chamber minus volume of the material (m3)
C = Concentration of the compound in the chamber (µg/m3)
C0 = Concentration of the compound in inlet air (µg/m3)
Q = Flow rate (m3/h)
λ = Exchange rate (h-1) = Q/V
E = Emission rate (µg/h)
In the case of a steady state, dC/dt = 0 and Equation 1 becomes:
From Equation 2 we obtain the emission rate with Equation 3:
Tubes containing swab tips and PBS were vortexed briefly, then the swabs tips were removed, leaving the PBS containing genomic DNA. Samples were subdivided into two equal aliquots, one of which was treated with propidium monoazide (PMA) to discriminate between viable and nonviable DNA (Fittipaldi et al., 2012). After PMA treatment, genomic DNA was extracted from samples using MagMAX Microbiome Ultra Nucleic Acid Isolation Kit (ThermoFisher A42357) following manufacturer’s protocol.
Absolute bacterial abundance in both PMA-treated and untreated aliquots was quantified using real-time quantitative polymerase chain reaction (RT-qPCR). Primers used were ABS Total Bacteria F SYBR Primer 5`-GTGSTGCAYGGYTGTCGTCA-3` and ABS Total Bacteria R SYBR Primer 5`-ACGTCRTCCMCACCTTCCTC-3`, which target the E. coli 16S regions 1048–1067 and 1175–1194, respectively, for a broad-range “universal” assay of bacterial cell counts (Maeda et al., 2003). Assays were performed in triplicate using 10 µL reaction volumes for experimental samples, as well as positive, negative, and no-template controls, using the following reaction mixture: 5 µL Luna Universal qPCR Mastermix (New England Biolabs #M3003), 0.25 µL forward primer, 0.25 µL reverse primer, 3.5 µL PCR-grade water, and 1 µL DNA template. Thermocycling conditions were programmed as follows: initial denaturation for 2 min at 50 °C, 2 min at 95°C; 40 cycles of 15 s at 95°C, 15 s at 60°C, and 60 s at 72°C; followed by a melt curve in the range of 60°C to 95°C. Serial dilutions of 16S Artificial DNA Standard (1.77 × 10⁸ genome copies per microlitre) were used to generate standard curves. The resulting genome copy estimates were used as a proxy for absolute bacterial abundance.
Shallow shotgun metagenomics was utilized to generate taxonomic and functional data regarding the archaeal, bacterial, fungal, and viral communities. Genomic libraries were constructed from the PMA-treated samples using a LabCyte Echo Liquid Handler to perform miniaturized reactions with Nextera XT DNA Library Preparation Kit (Illumina, San Diego, CA, USA) at Genomics & Cell Characterization Core Facility (GC3F) at UO (Eugene, OR, USA). Samples had extremely low biomass, therefore, replicates of each material/timepoint were pooled together prior to library prep and sequencing. Qubit dsDNA high sensitivity quantitative assay was used to quantify DNA and libraries were pooled to 2 nm. Paired-end sequencing (2 × 150) was performed in a single Illumina NovaSeq (S4 300 Cycle) run on an at GC3F.
We used FastQC (Andrews, 2010) to examine read quality of raw sequences prior to trimming adapters and removing contaminants, including PhiX and human sequences, with BBDuk (Bushnell, 2021) using suggested parameters (ktrim=r k=23 mink=11 hdist=1 tpe tbo). Taxonomic classification of clean unassembled reads was performed with Kraken 2 (Wood et al., 2019), which uses exact kmer matching, against the standard database containing NCBI taxonomic information, as well as the complete bacterial, fungal, viral, and archaeal genomes in RefSeq (O’Leary et al., 2016). The resulting Kraken 2 report was converted into a BIOM table for later use in R using the kraken-biom tool (Dabdoub, 2021). We used the R package phyloseq to import the Kraken 2 BIOM table into R (McMurdie and Holmes, 2013). None of the negative control samples contained any reads, therefore we were unable to filter for potential laboratory contaminants. Control samples and experimental samples below our minimum threshold of 4,000,000 reads were removed prior to downstream analysis.
Clean reads were coassembled with MegaHIT (Li et al., 2015) using preset -metalarge, resulting in an average of 96,806 contigs. Open reading frames and total protein sequences were predicted from coassembled contigs using Prodigal (Hyatt et al., 2010). Antibiotic resistance features were annotated using hmmscan from HMMER3 (Eddy, 2011) against the full ResFams database, which provides a curated list of protein families associated with antibiotic resistance (Gibson et al., 2015).
We conducted all analyses and visualizations in the R statistical computing environment, relying especially on the ggplot2 and patchwork packages to construct plots and figures (Pedersen, 2022; Wickham, 2016).
Environmental conditions were summarized by microcosm and sampling day prior to analysis. We used generalized least squares (GLS) to model the association of surface coating with environmental conditions (temperature, RH) and wood MC. In general, we followed Pinheiro and Bates (2000) to conduct analysis of response profiles using function gls from the nlme package (Pinheiro et al., 2023), with covariance structure set to corAR1 to adjust for temporal autocorrelation between data points.
Antedependence (AD) models, also known as Markov models, were employed to analyze changes in VOC concentration and emission rate and bacterial absolute abundance, as AD models can parsimoniously accommodate nonstationary time-dependent data (Núñez-Antón and Zimmerman, 2000). We used package mmrm and described the covariance structure with ‘adh’—AD models with heterogenous covariance (different within-subject variances). Estimated marginal means were computed with emmeans using Satterthwaite adjusted degrees of freedom and restricted maximum likelihood (REML) estimation. VOC technical replicates were averaged prior to statistical analysis; one VOC sample from a coated CLT block on Day 112 was an outlier and was removed prior to averaging.
We performed variance-stabilizing transformation, as implemented in DESeq2 (Love et al., 2014), to address differences in sample library sizes prior to beta diversity and differential abundance analysis. Compositional dissimilarity between samples was computed using the Morisita-Horn distance; these values were then used in permutational multivariate analysis of variance (PERMANOVA), as implemented by the adonis2 function in vegan (Oksanen et al., 2018), to assess the importance of sampling period (before, during, or after wetting), series, and surface type in driving microbial community structure. We next split the data by sampling period and microbial group (archaea, bacteria, fungi, virus) and again performed PERMANOVA to examine whether series or surface type was more influential before, during, or after wetting and whether the response differed by microbial group. We tested for a relationship between microbial composition and VOC composition using Procrustes analysis (Lisboa et al., 2014).
To assess whether individual taxa were differentially abundant on coated or uncoated CLT blocks, we used generalized linear models (GLMs) based on the negative binomial distribution for the entire microbial community, as well as for archaea, bacteria, fungi, and virus separately. For this analysis, we used the deseq function in DESeq2 and report results from the default Wald hypothesis test.
Our a priori significance threshold was 0.05 and we adjusted for multiple testing using the Benjamini and Hochberg method (Benjamini and Hochberg, 1995).
Temperatures inside the microcosms ranged from 13.3 to 25.1 °C and generally tracked the temperature of the laboratory in which the microcosm array was housed (Supplementary Figure S2). The mean daily temperature was 21.5 °C and mean standard deviation was 0.2 °C. Microcosm temperature was not correlated with surface coating (GLS; t = -0.546, p = 0.585).
RH inside the microcosms also generally tracked that of the external laboratory, except during wetting periods (Supplementary Figure S3). Mean daily RH during pre- and post-wetting periods was 40.0%, with a standard deviation of 5.8%. During wetting periods, microcosm RH rose to a maximum of 98.6% while tap water was spraying; it dropped to a minimum of 29.9% during wetting periods while tap water was not spraying. The average standard deviation during wetting periods was 15.5%. RH inside microcosms was also not correlated with surface coating (GLS; t = -0.103, p = 0.918).
Prior to the wetting events, both uncoated and coated mass timber samples maintained relatively stable moisture content (MC) between 5 to 10%. The overall mean MC before wettng was 7.4%. Wood samples received an average of 8.5 L of water sprayed onto the top surface each day of their respective wetting events (Supplementary Figure S1).
For Series 1 (1-day wetting) samples, MC at all depths below the wood surface increased during and immediately after the wetting period before returning to baseline levels within 48 hours (Figure 3). Series 2 (7-day wetting) and Series 3 (28-day wetting) displayed similar patterns, but peaked at higher MC levels for all depths and took longer to return to baseline—about one week for Series 2 and about four weeks for Series 3. One caveat to the MC measurements is the potential for moisture to penetrate block surfaces through the pathway created by the pins themselves, thus these results are likely more pronounced than the actual MC would be in an unblemished CLT block. We found that MC25 (the shallowest pin) was correlated with coating only in the pre-wetting period (GLS; t = 2.8, p = 0.006), while MC50 was not correlated with coating in any periods, and MC75 was correlated with coating during all periods (GLS; pre-wetting: t = 2.45, p = 0.017; during wetting: t = 2.21, p = 0.031; post-wetting: t = 2.3, p = 0.022).
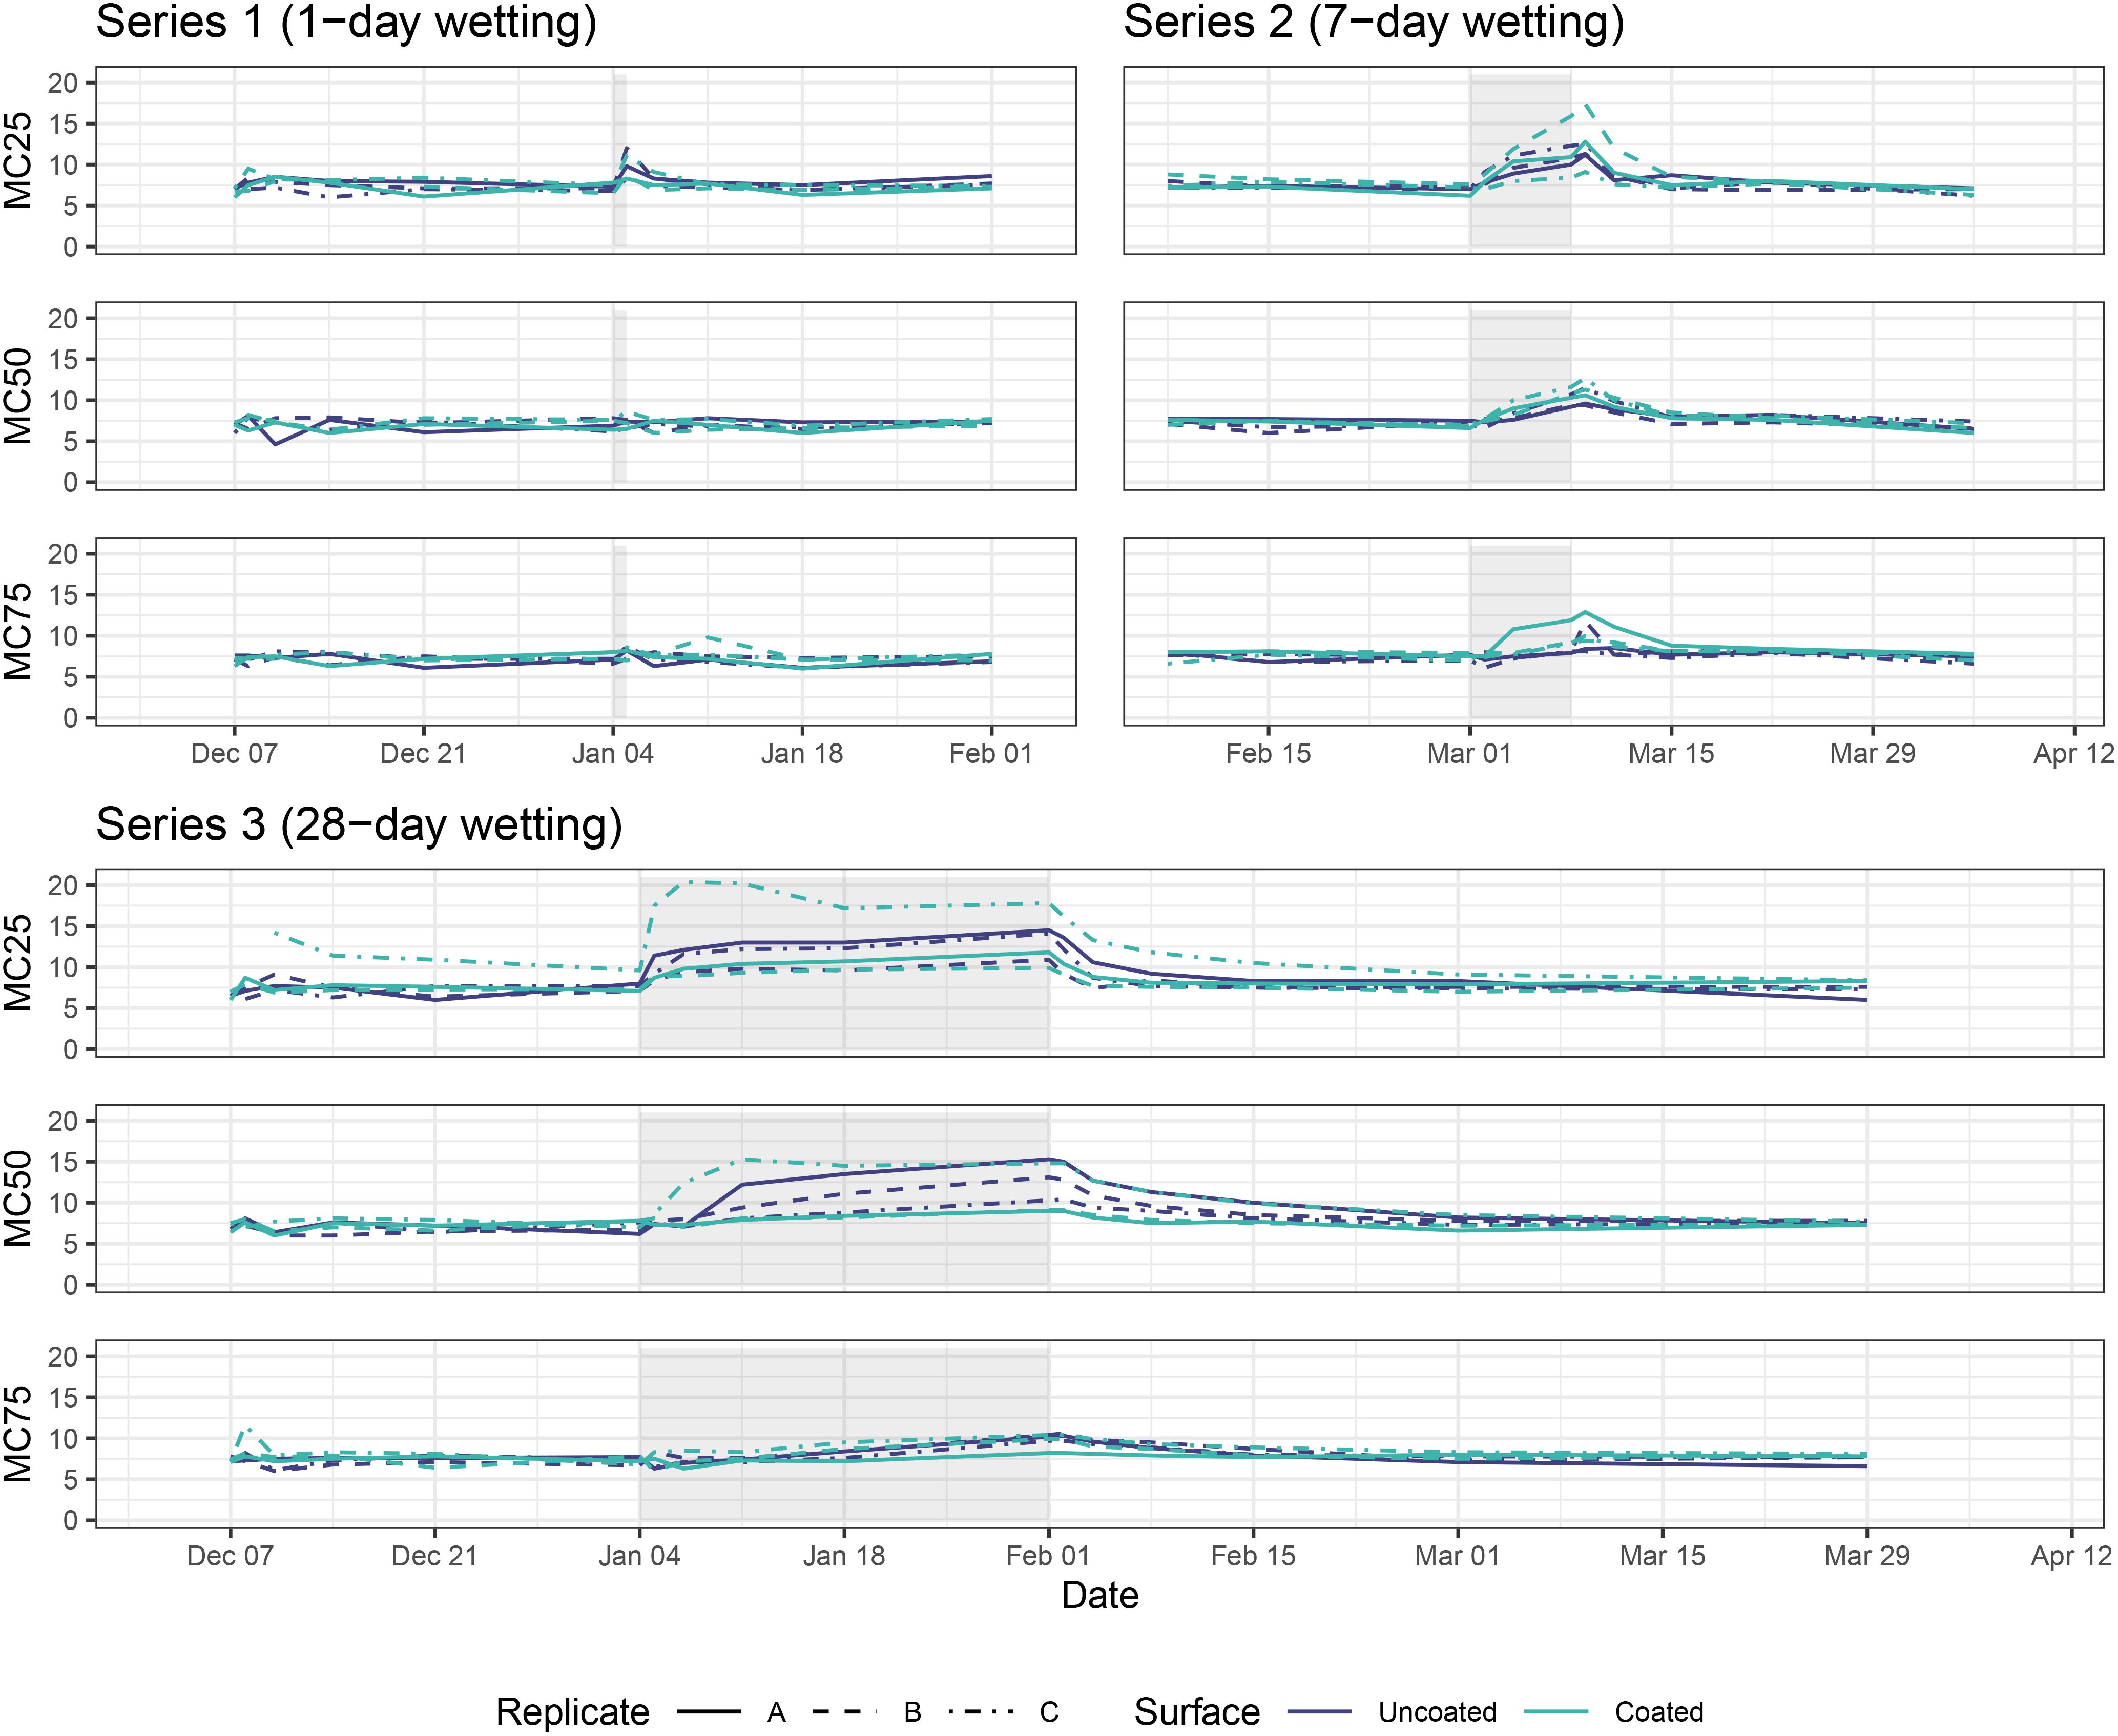
Figure 3. Moisture content of CLT blocks at 6.35 mm (0.25 in, top plot for each series), 12.70 mm (0.50 in, middle plot for each series), and 19.05 mm (0.75 in, bottom plot for each series) below top surface. Grey rectangles represent wetting periods.
VOC samples from Series 1 (1-day wetting) and Series 2 (7-day wetting) were collected 7 and 28 days post-wetting, while samples were collected from Series 3 during the prewetting period, 7, 14, and 28 days after inoculation, as well as 7, 28, and 56 days postwetting. The highest TVOC concentration occurred immediately after microbial inoculation and decreased substantially over the course of the experiment (Figure 4). The elevated TVOC concentration in the plastic control box on Day 0 (07 December), suggests the inoculation process itself (either the microbes or the reagents) as a substantial source of VOCs, as the incoming laboratory air had negligible TVOC levels throughout the study. Aside from Day 0, TVOC concentration in the plastic control box was similar to incoming laboratory air and much lower than microcosms containing CLT blocks throughout the study.
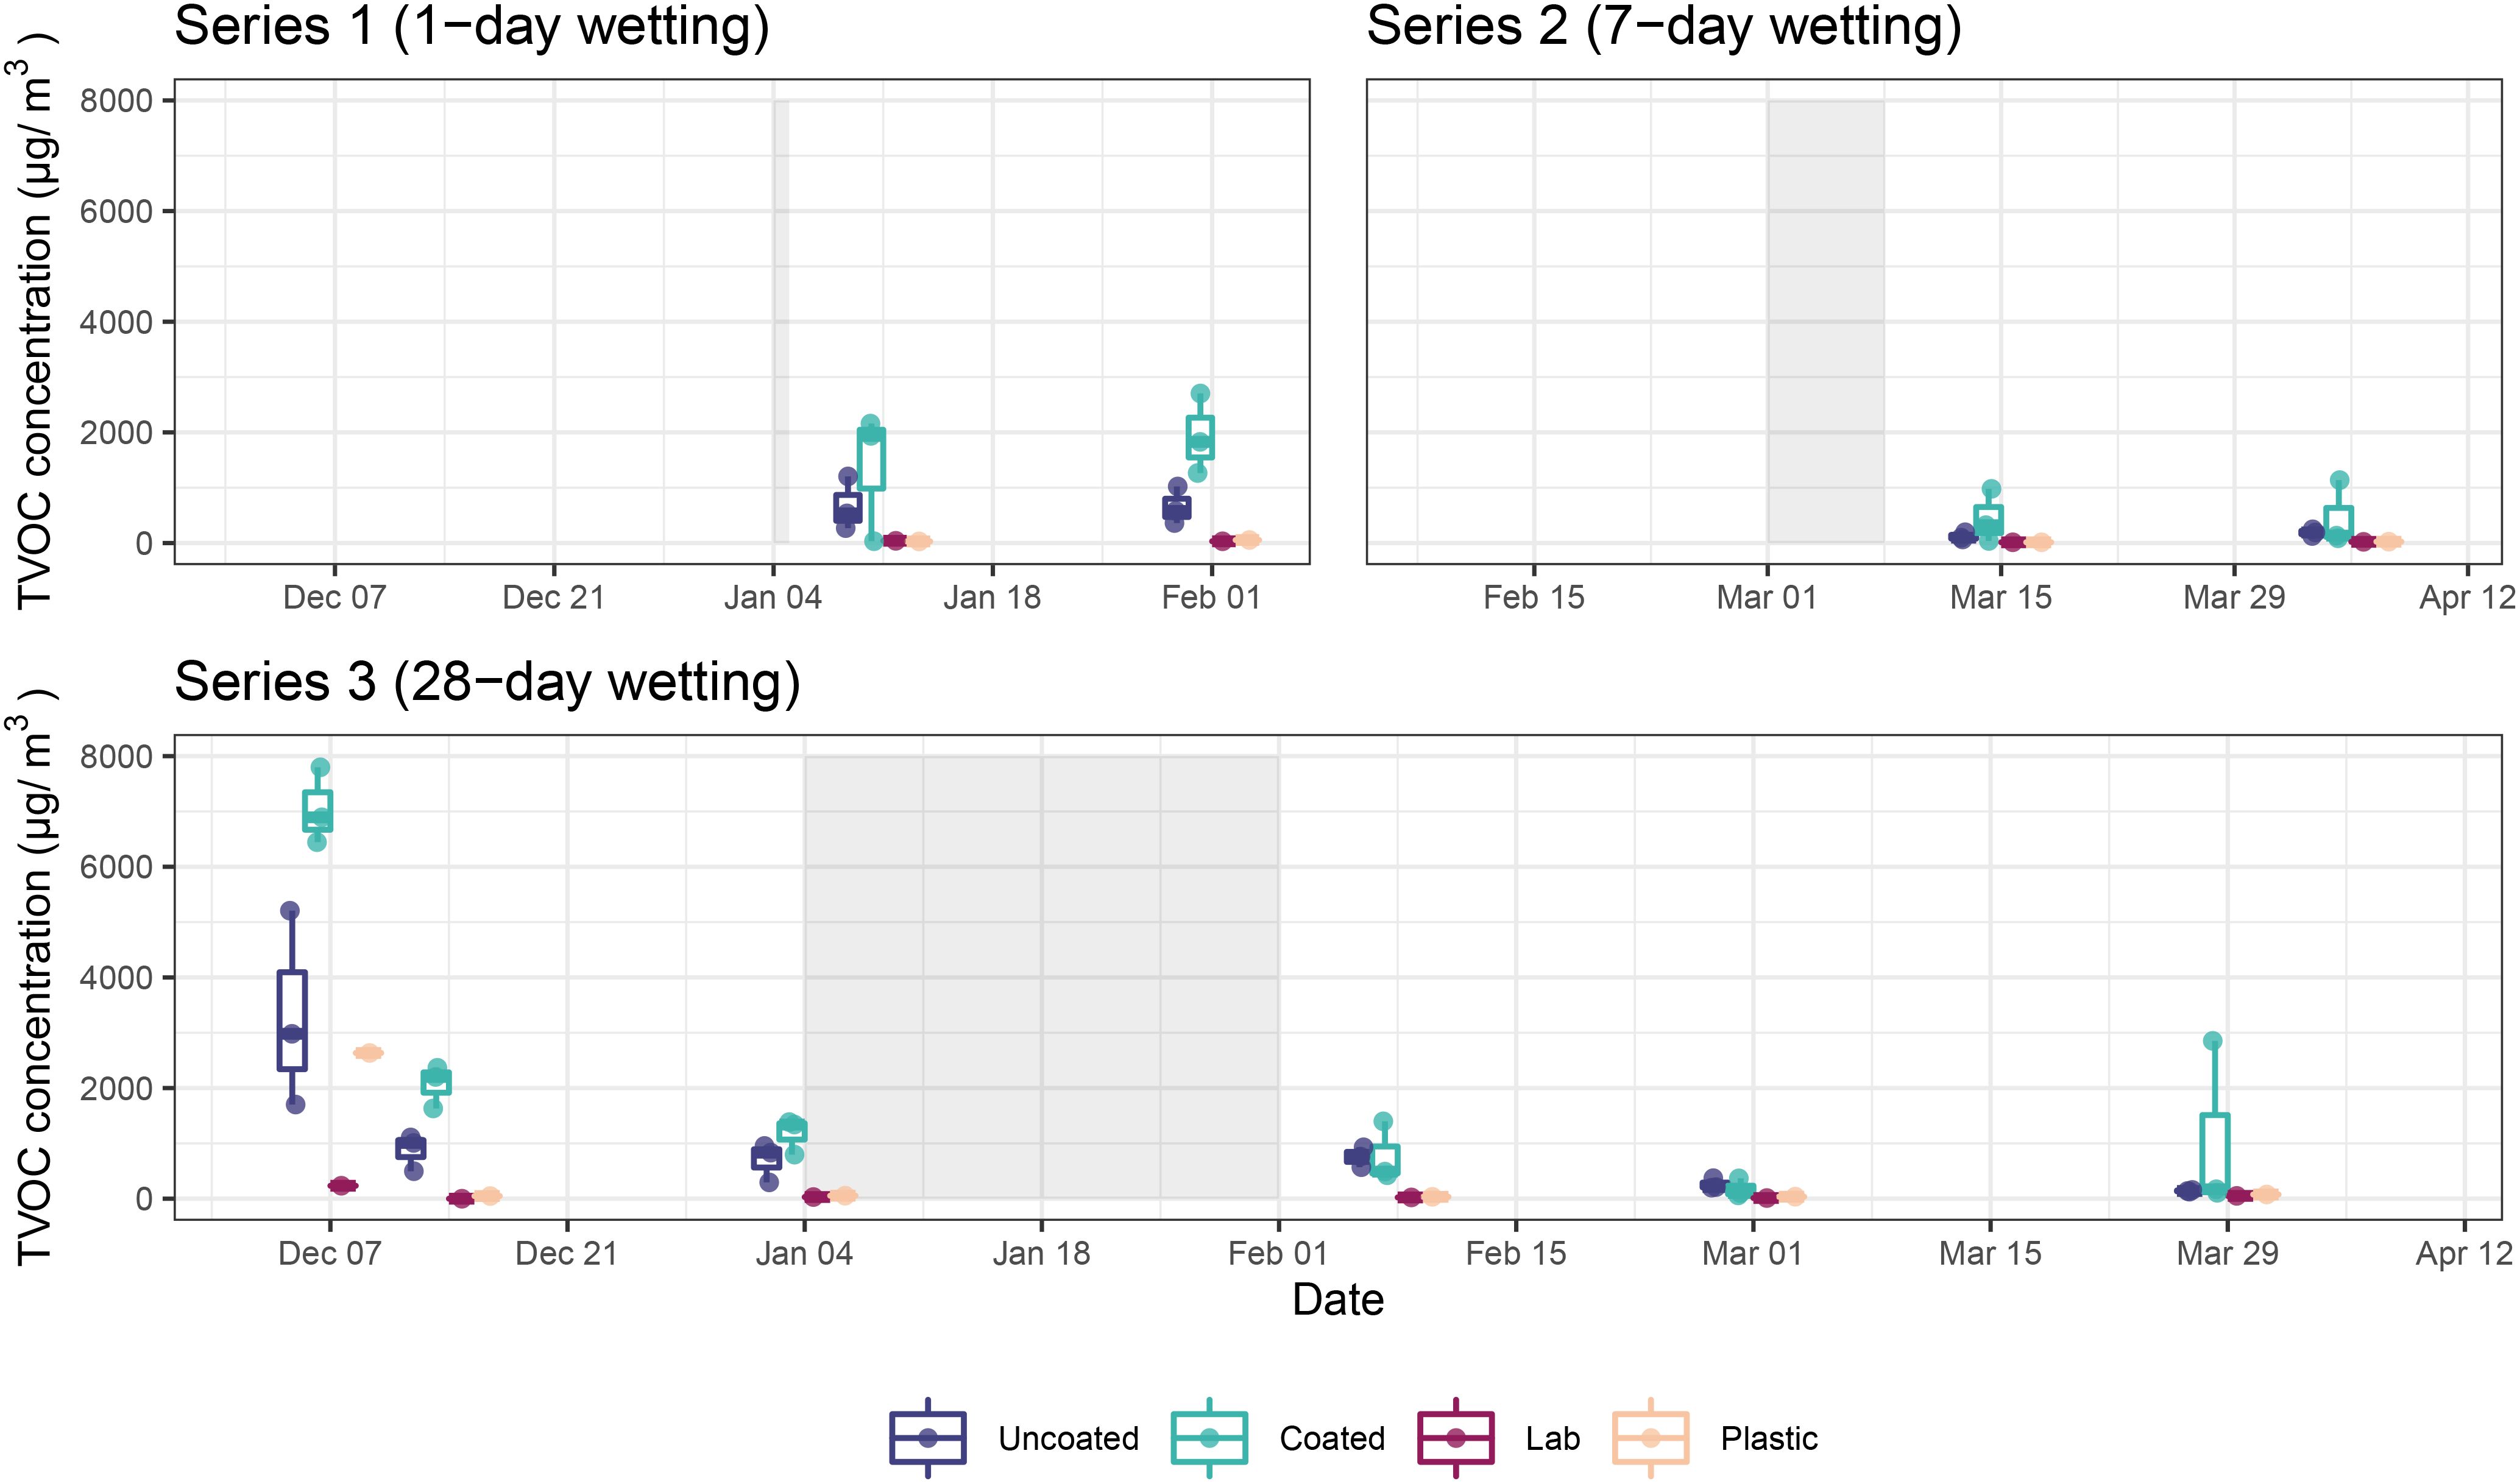
Figure 4. TVOC concentrations in microcosms containing coated and uncoated CLT blocks, as well as the plastic control microcosm and external laboratory for each series. Shaded areas represent wetting periods.
In general, microcosms containing uncoated CLT blocks had lower TVOC concentration than those containing coated blocks (AD; t = 3.76, p = 0.004). This effect was especially pronounced earlier in the experiment, possibly due to continued off-gassing of the coatings. By Day 84 (01 Mar), TVOC concentration in both uncoated and coated samples decreased to less than 500 µg/m3, and by Day 112 (29 Mar) microcosm concentrations were not substantially higher than the incoming laboratory air or the plastic control box. One exception to this result was sample S.S3A.112, an outlier (which was removed prior to analysis) characterized by high levels of ethanol, acetone, cyclopentane, and 2-methylbutane.
TVOC composition in microcosms containing coated CLT blocks was dominated by VOCs putatively representing manmade sources, such as coatings and plastics manufacture and industrial solvents, as well as plant metabolites (Figure 5; Supplementary Figure S4). Uncoated CLT blocks, on the other hand, were mainly associated with plant metabolites, such as terpenes. The dominant monoterpene found in microcosms containing uncoated samples was β-phellandrene.
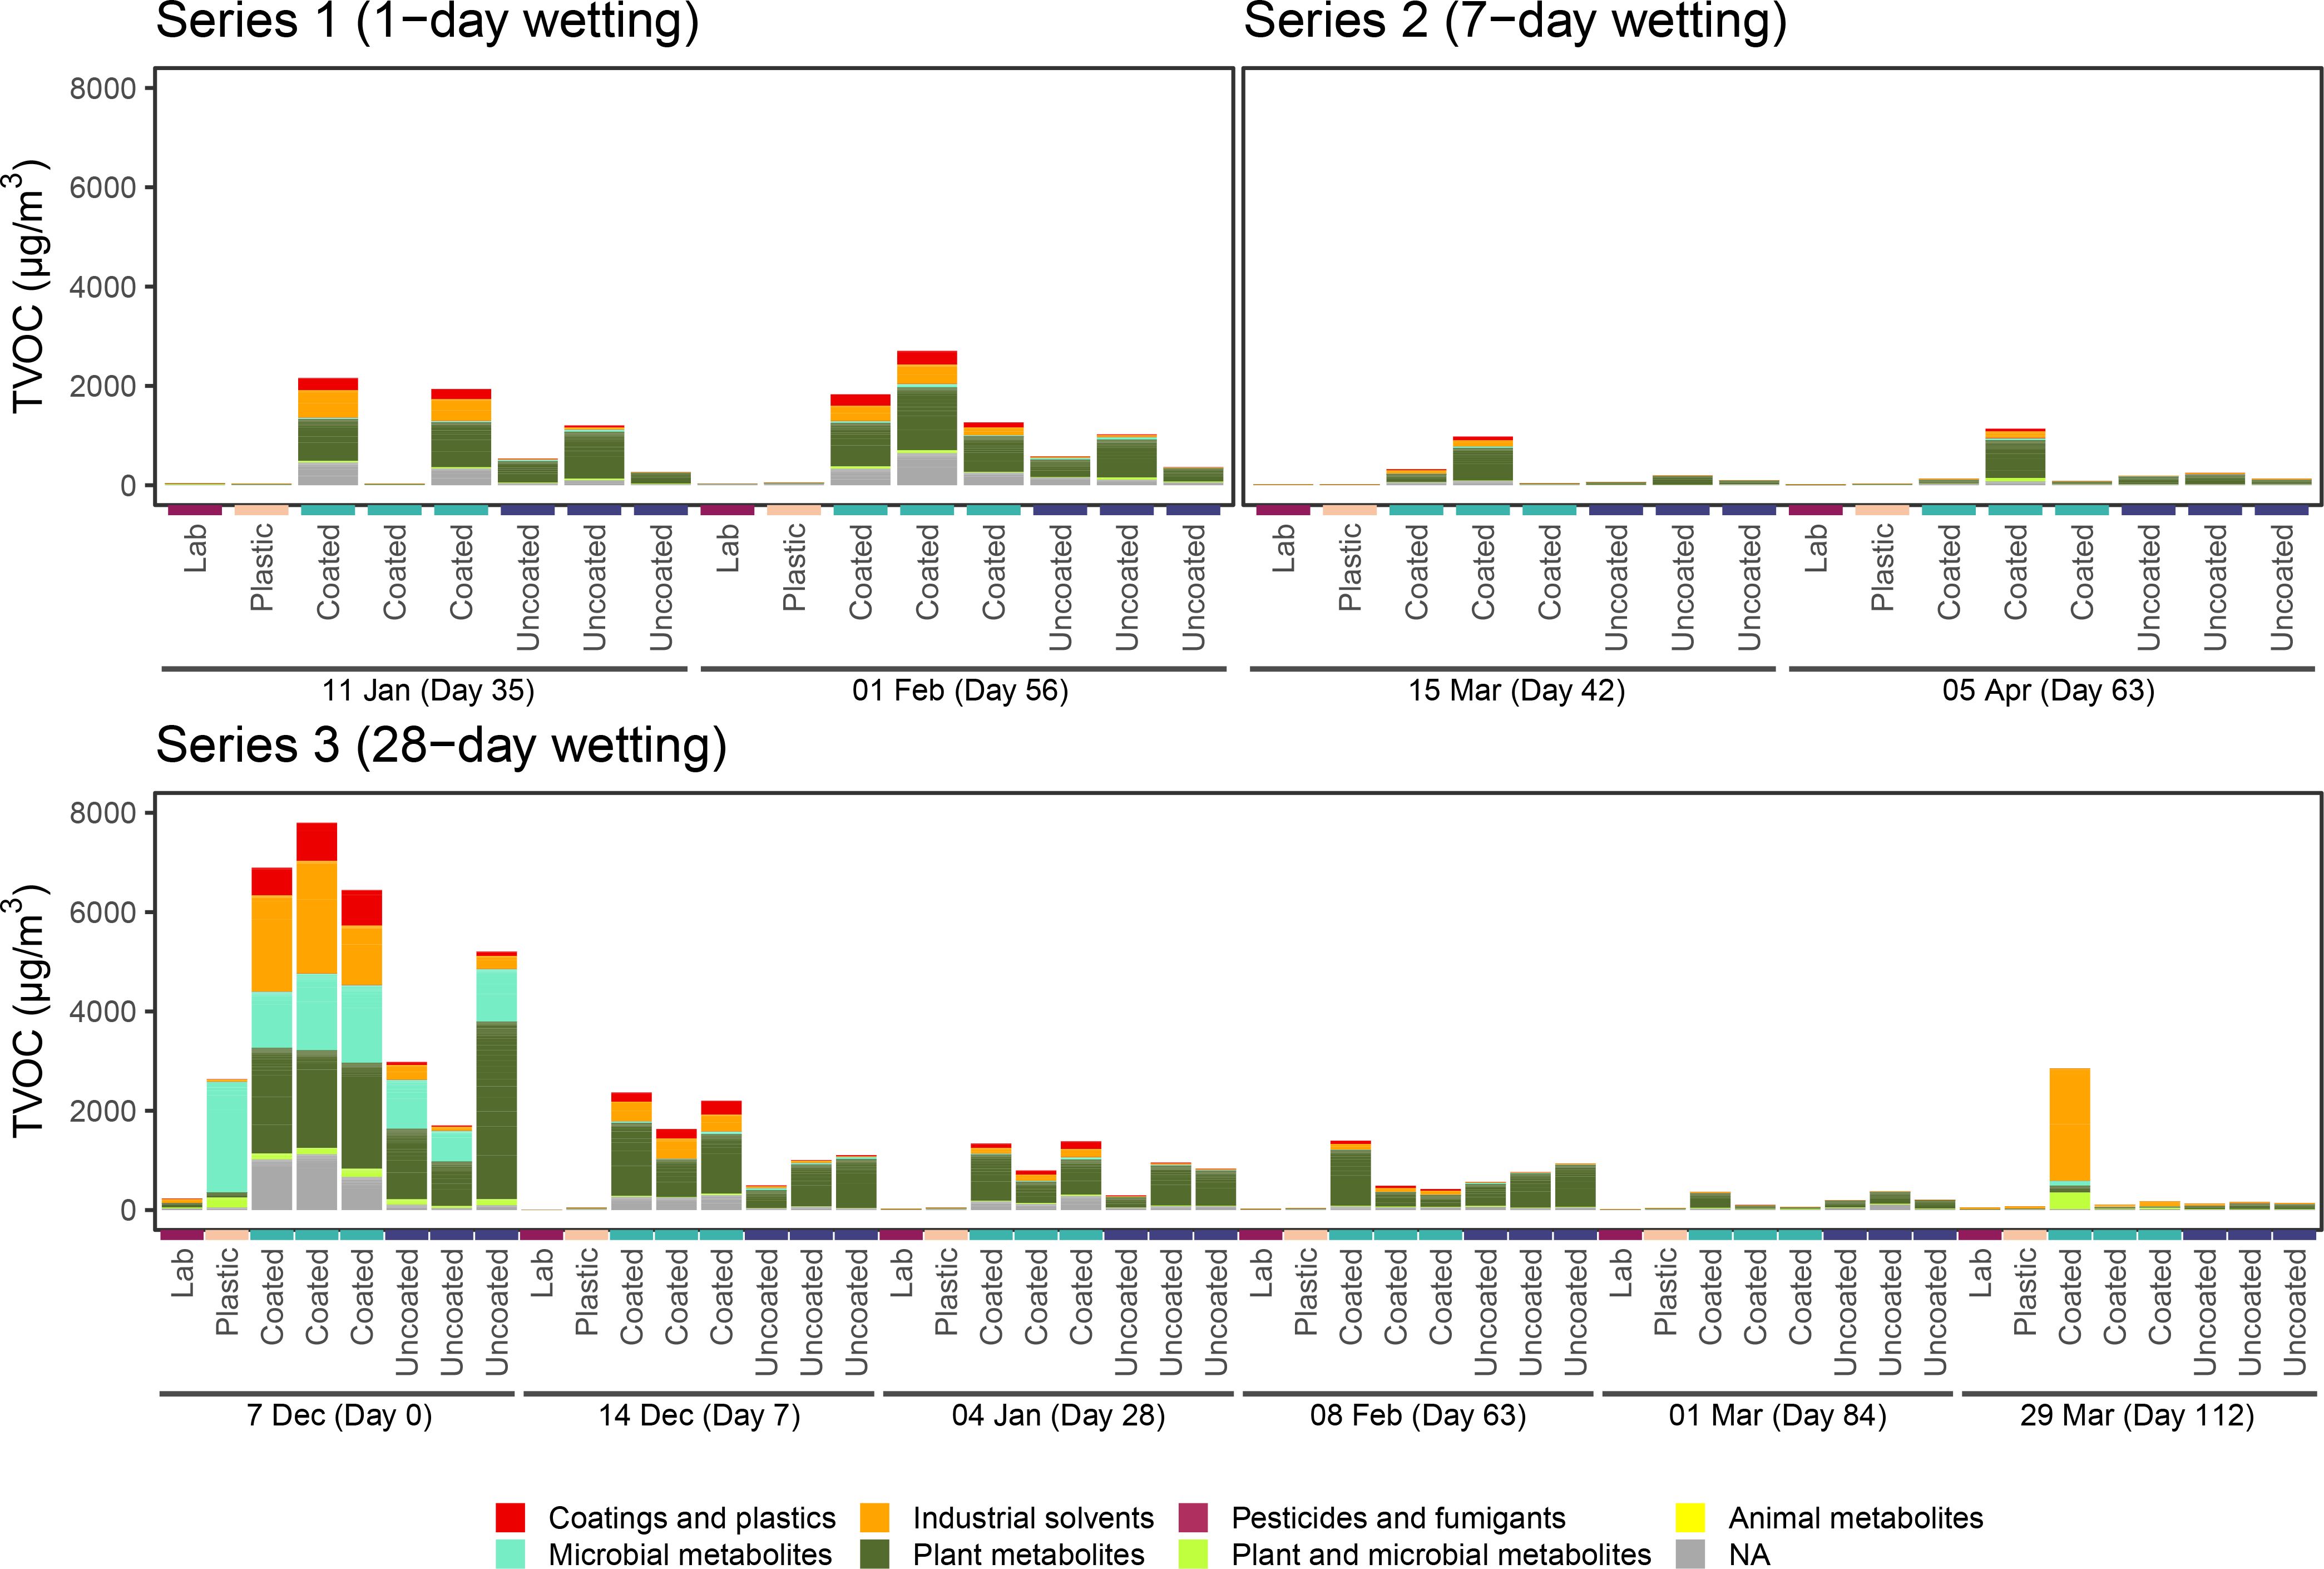
Figure 5. TVOC proposed sources for each wetting series. VOCs were classified using PubChem, as described in Supplementary Table S1. Bars represent individual samples. Within each series, bars are organized by sampling day, then by sample type. There are three replicates each day for coated and uncoated CLT blocks, and only a single sample each day for the plastic control microcosm and external laboratory.
Overall, VOC emission rate followed a similar pattern to concentration inside the microcosms, with the notable exception that acetoin (3-hydroxy, 2-butanone) had a negative emission rate for all CLT samples on Day 0 (07 Dec), immediately after microbial inoculation (Supplementary Figure S5). The negative emission rates were due to our procedure of subtracting VOC concentrations observed in the plastic control microcosm from those observed in experimental microcosms, to find which VOCs were emitted by the CLT blocks versus the microorganisms themselves.
Most CLT blocks had decreasing emissions over time (Figure 6). Interestingly, there was no statistically significant change in emissions before and after the wetting period (AD model; t = 0.92, p = 0.408), possibly indicating a slight increase in emissions that counteracted the overall decrease. This finding will be further interpreted in the Discussion.
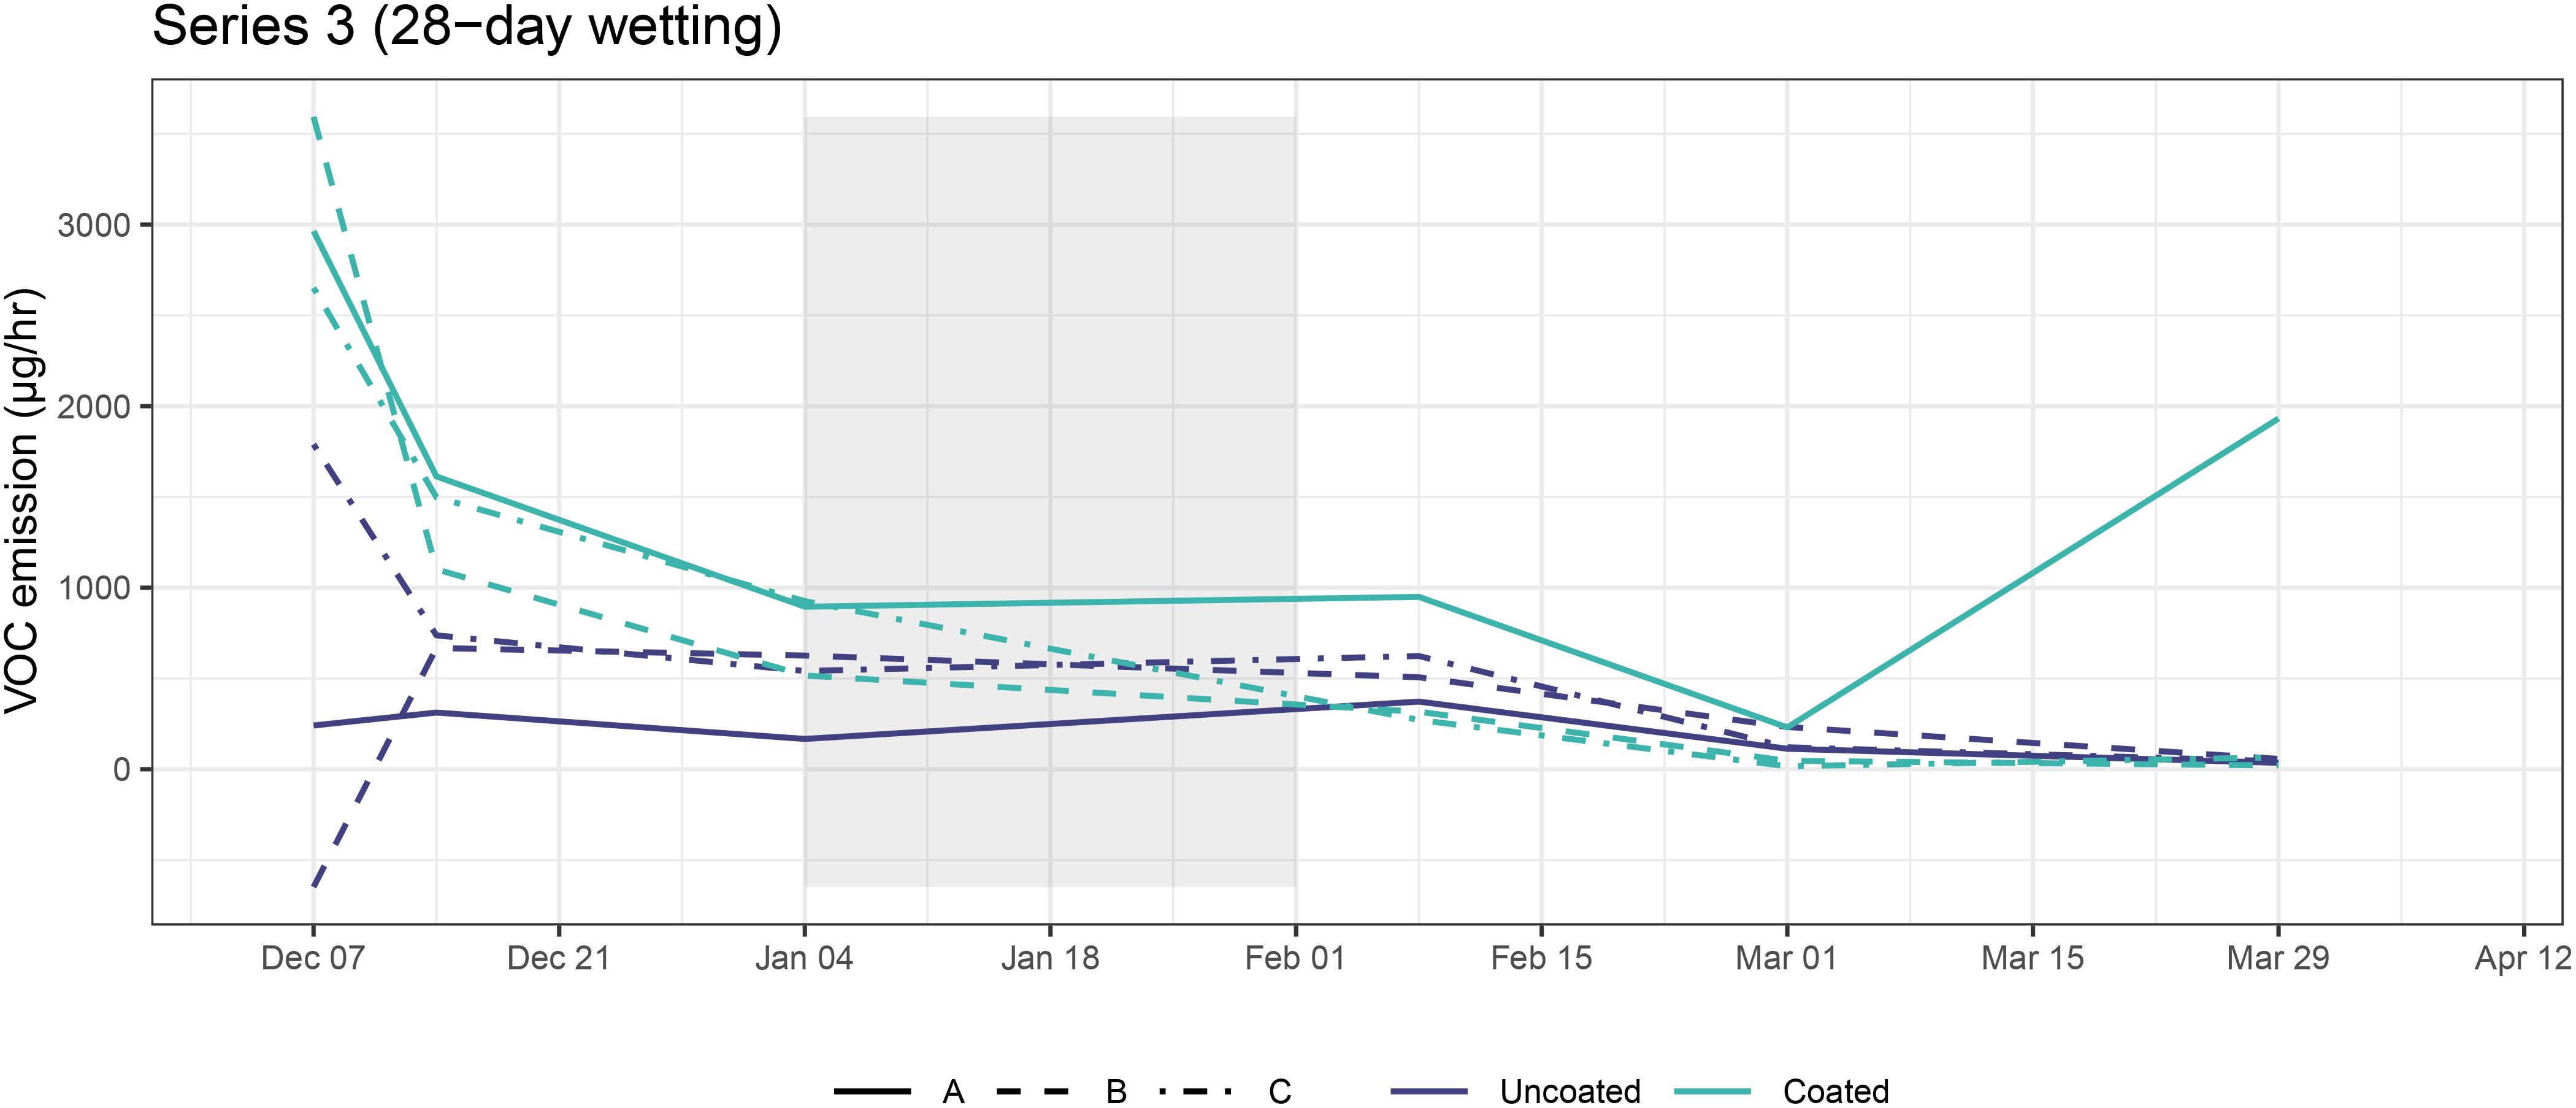
Figure 6. TVOC emission rates for coated and uncoated CLT blocks in Series 3. Shaded areas represent wetting periods.
We observed a sharp decline in viable bacterial abundance on the first day after inoculation for most samples, followed by a moderate to pronounced bounce-back during the first week after the initial decline (Figure 7; total bacterial abundance over time shown in Supplementary Figure S6 and viable:total ratios in Supplementary Table S2). Viable bacterial abundances appeared to be more or less stable for the remainder of the experiment, although individual microcosms experienced several dips and peaks, particularly related to the wetting periods. Viable bacterial abundance in Series 3, for which there were paired daily samples across the whole experiment, was negatively associated with RH (AD: t = -3.97, p = 0.004). Coating status also had a significant effect—uncoated CLT blocks generally had greater bacterial abundance than coated blocks (AD: t = 2.37, p = 0.036). Excluding the initial 14 days post-inoculation, samples from the plastic control box had an average of 21,118 more gene copies per µL than coated CLT blocks and 7,021 more gene copies per µL than uncoated CLT blocks.
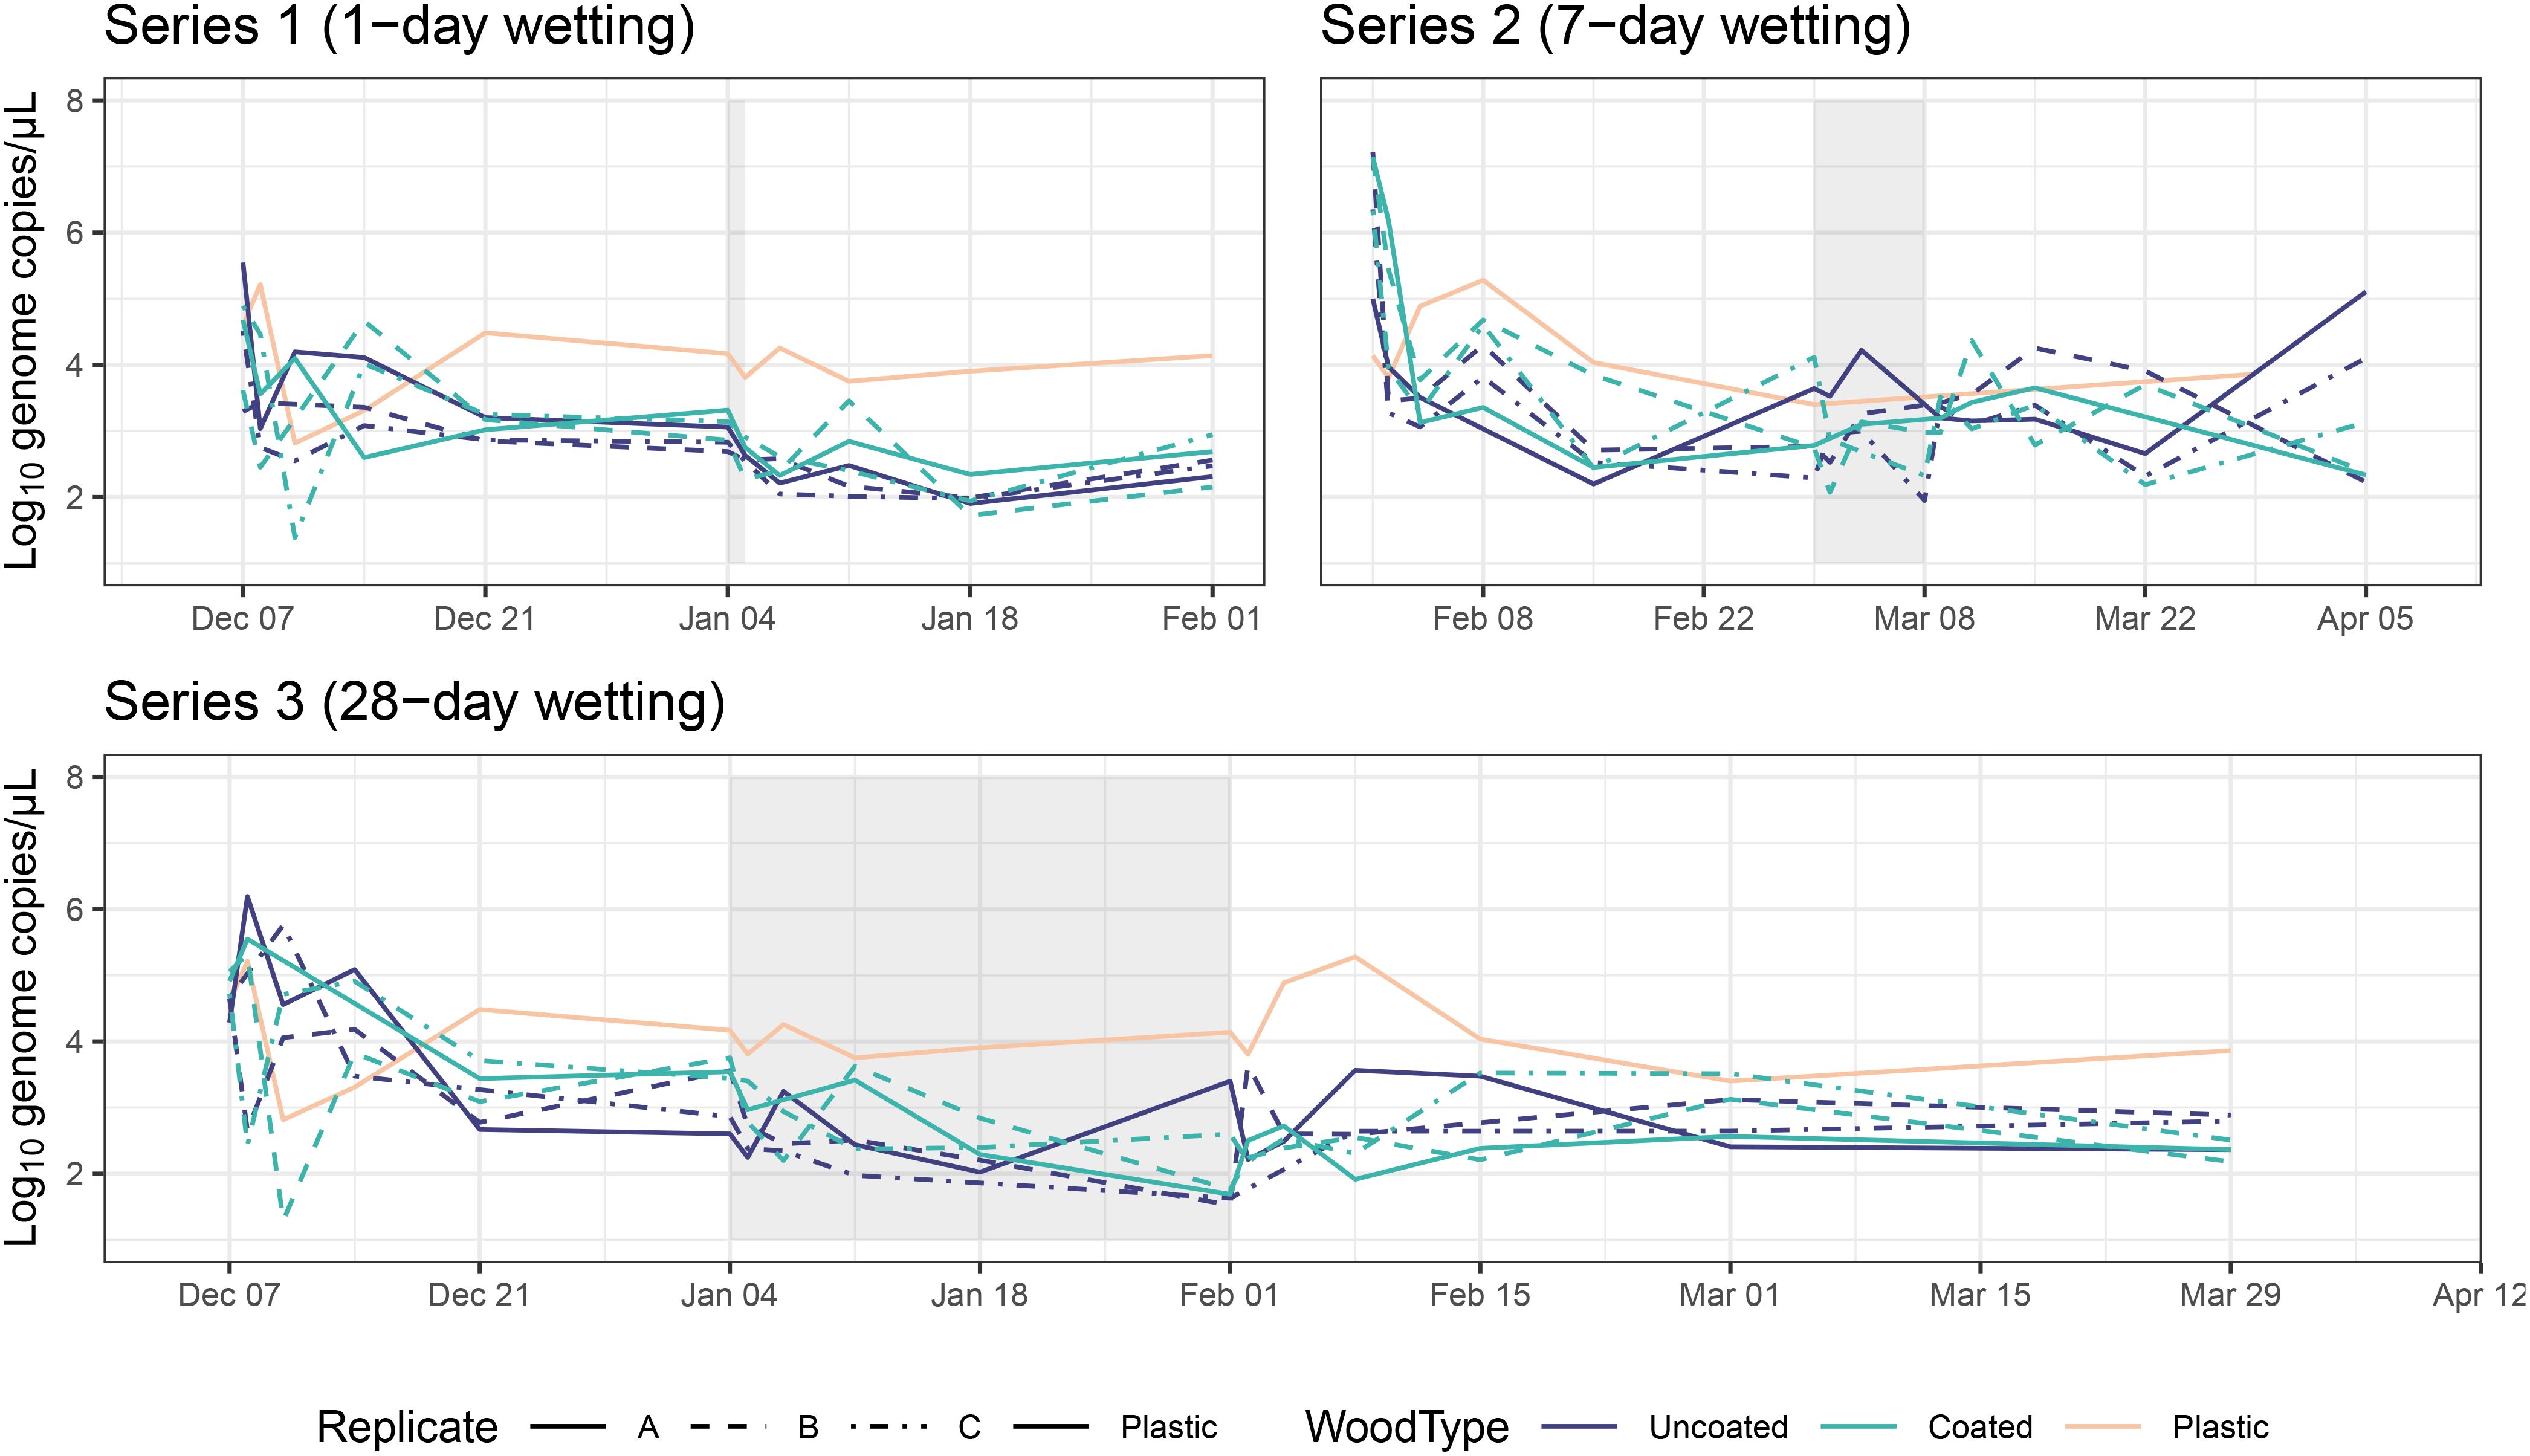
Figure 7. Viable bacterial abundance (estimated by gene copy numbers) over time for each series. Data for the plastic control box shown on all three series as a reference. Shaded areas represent wetting periods.
For microbial communities, a total of 2,770,870,677 raw paired-end reads were generated, averaging 25,420,832 reads per sample. After quality filtering, a total of 2,769,253,073 clean reads remained for use in downstream analyses (Table 1). Kraken 2 was able to classify 80% of the trimmed, quality filtered, unassembled reads.
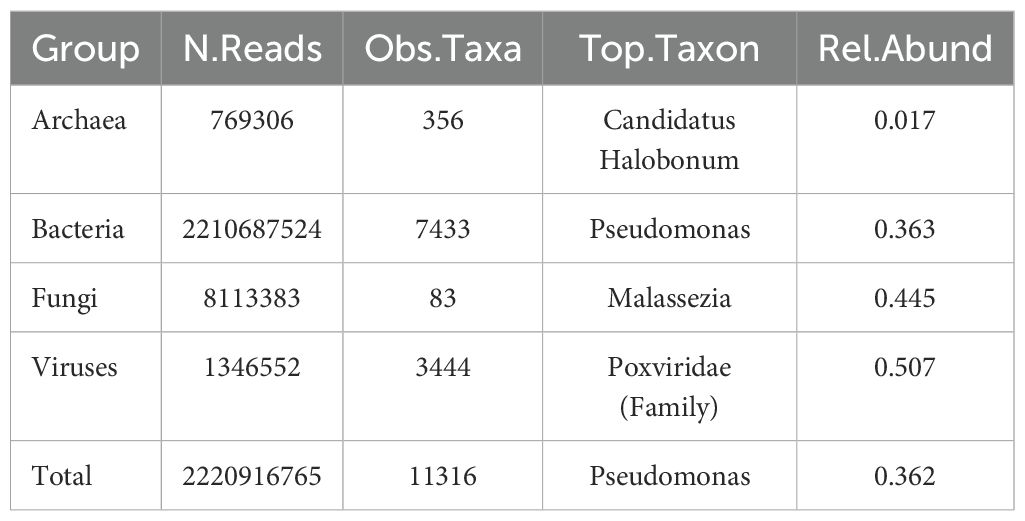
Table 1. Total read counts, number of identified taxa, top most abundant taxon, and relative abundance (within their own group) of the top taxon in each microbial group.
Euryarchaeota (90.9%) was by far the most abundant phyla in archaeal communities overall, followed distantly by Crenarchaeota (4.3%), and Thaumarchaeota (3.2%). Bacterial communities were dominated by Proteobacteria (86.0%); Actinobacteria (9.0%) and Firmicutes (4.5%) were also relatively abundant. Ascomycota (52.9%), Basidiomycota (47.1%) and Microsporidia (0.04%) were the only fungal phyla observed in this study. The most abundant viral phyla were Nucleocytoviricota (53.4%), Uroviricota (19.4%), and Artverviricota (9.9%).
Sampling depth was low across all microbial groups for most samples in this study (Figure 8), as was expected, given the extremely low biomass recovered from CLT surfaces. Thus, we share the data generated by this experiment, with the important caveat that much remains unknown about the structure of these microbial communities. We also did not perform statistical testing of the alpha diversity, because of this issue and general concerns about the validity of alpha diversity measures in microbiome studies (Willis, 2019).
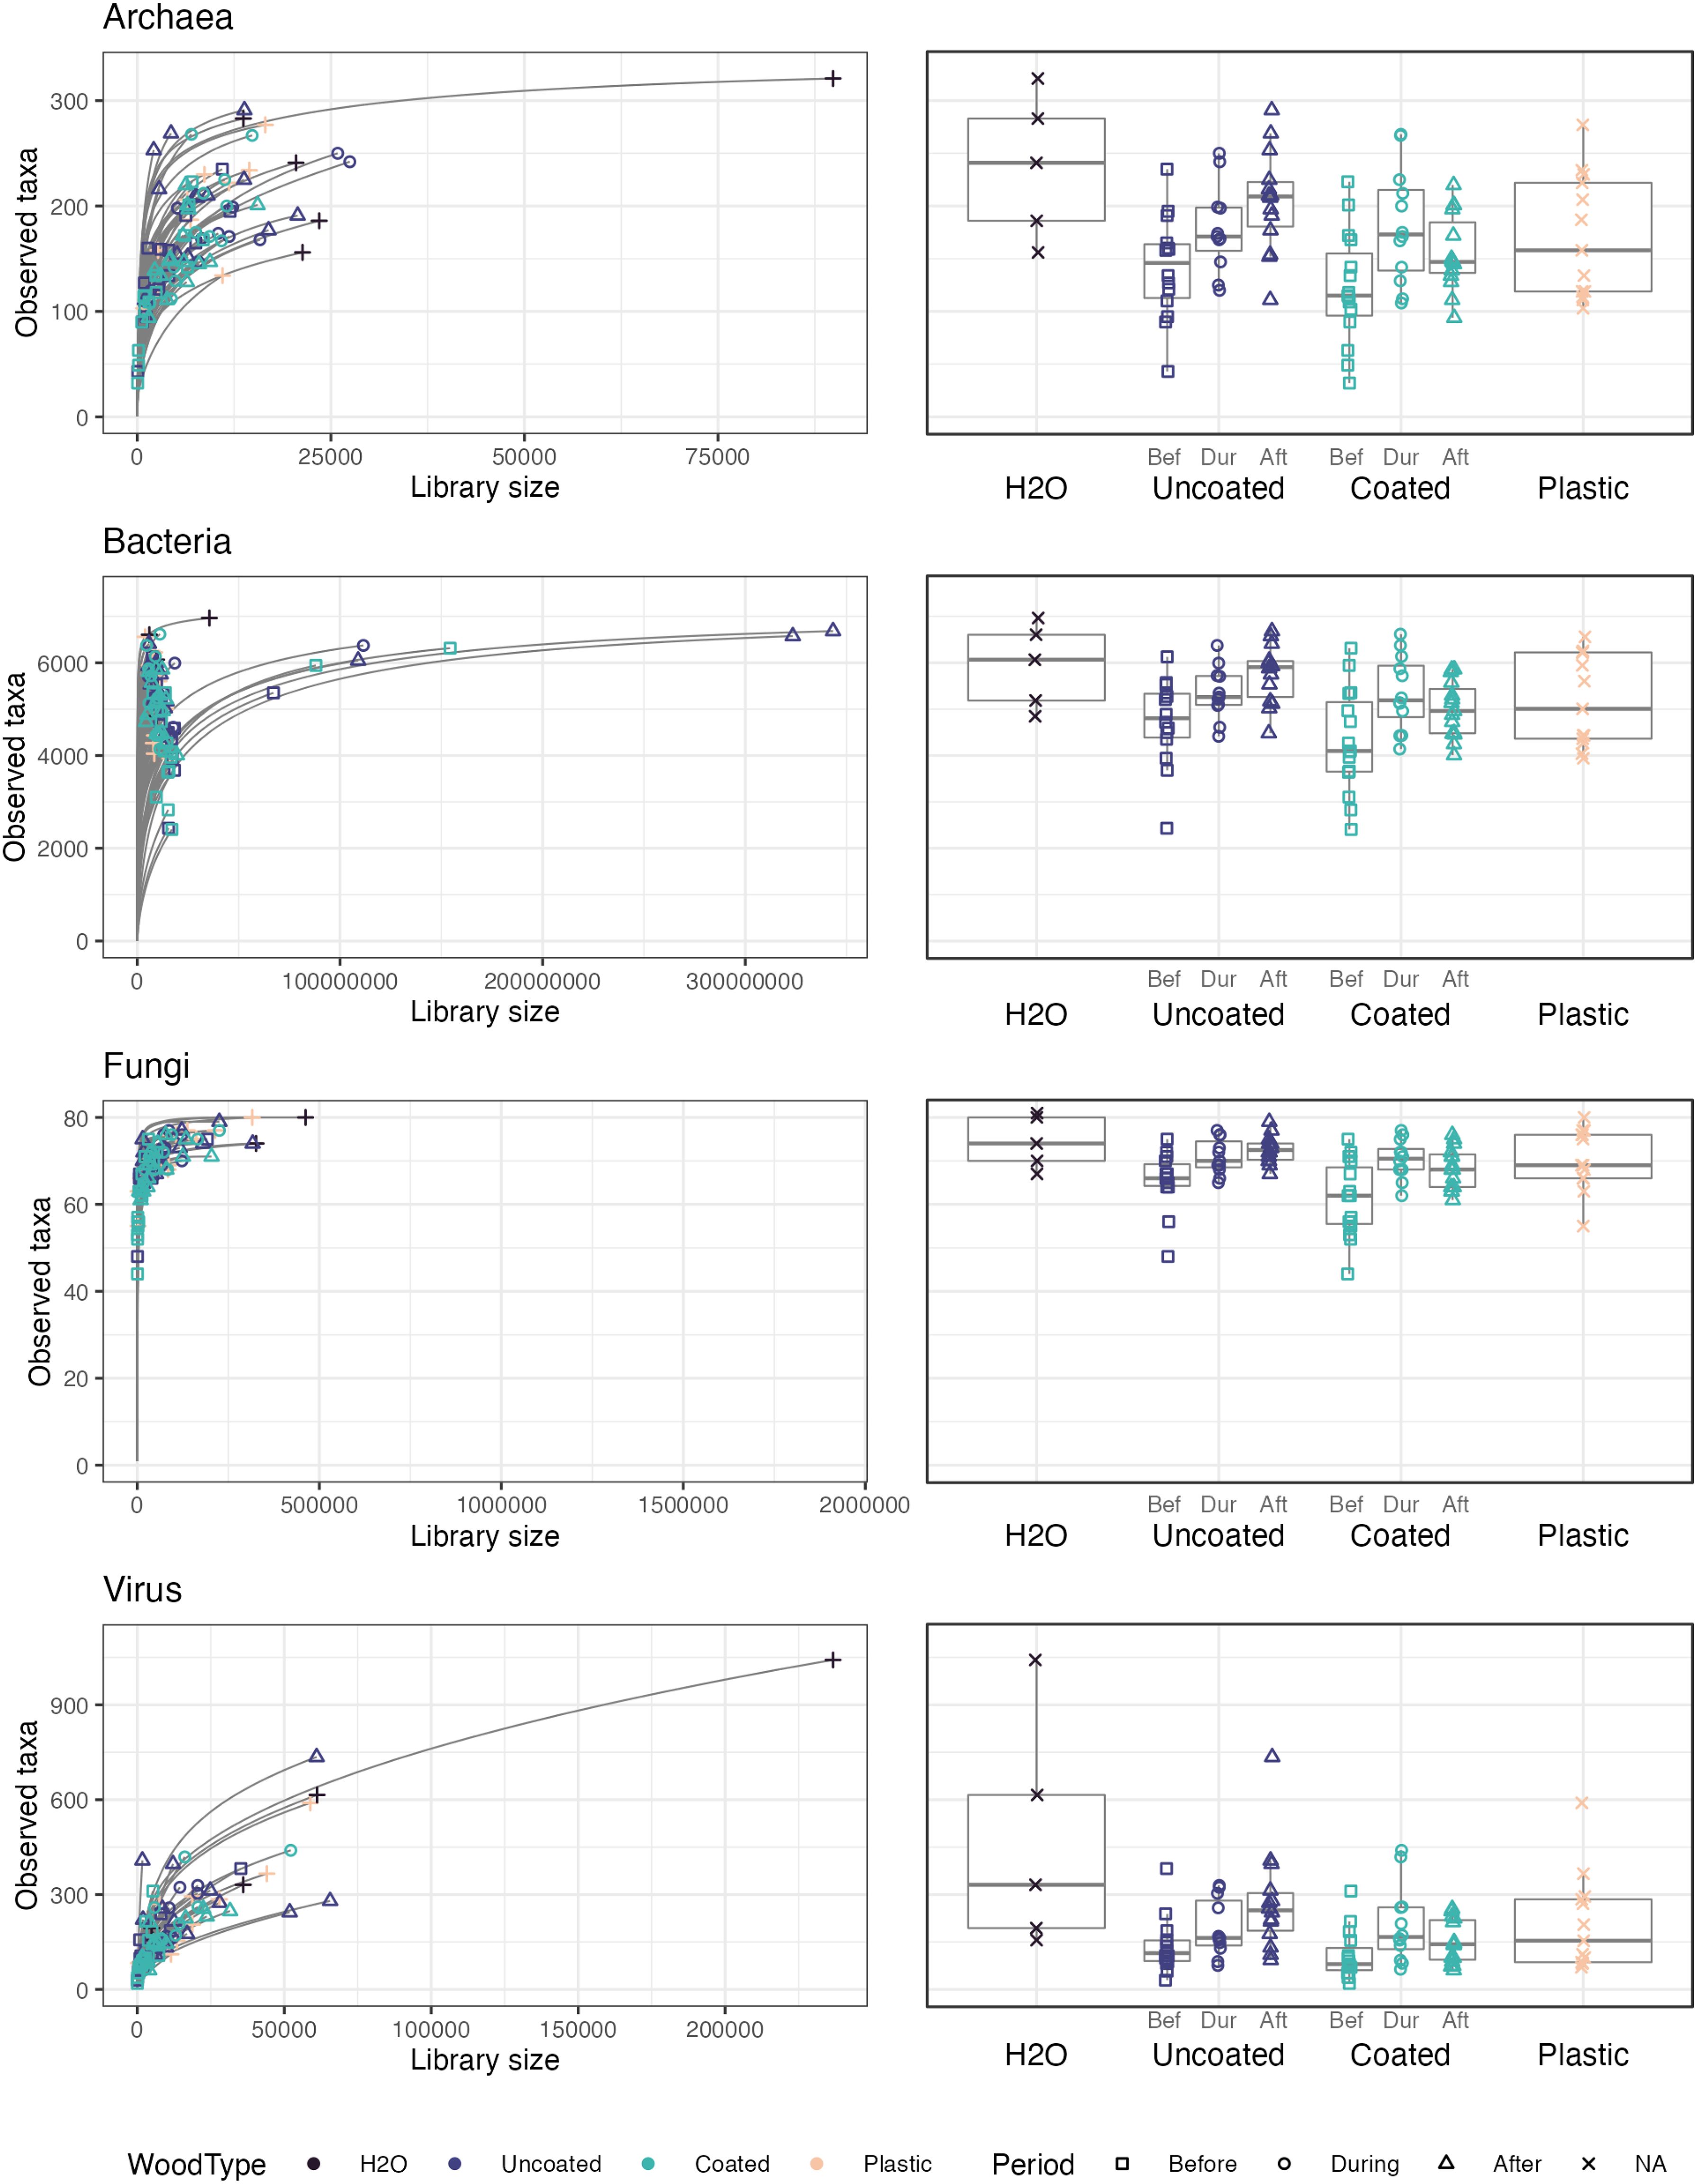
Figure 8. Rarefaction curves and numbers of observed taxa for each microbial domain.
A small handful of samples, including one tap water sample, had comparatively large library sizes, which tended to translate into greater numbers of observed taxa. Interestingly, for all microbial groups, uncoated CLT blocks showed a clear pattern of increasing richness by time period (before, during, after wetting), whereas coated CLT blocks had the greatest richness during wetting, followed by after wetting, then before wetting. Notably, coated blocks tended to have lower richness than uncoated blocks before and after wetting, although there appeared to be no difference in richness during the wetting period, likely due to the contribution of taxa from tap water. The plastic control box had an intermediate number of taxa, while tap water had higher richness than experimental samples, on average. These patterns were also reflected in estimated Shannon indices of alpha diversity, (Supplementary Tables S3–S6), which account for species evenness, as well as richness.
Composition of the top 10 most abundant bacterial genera for each series are shown in Figure 9. Pseudomonas, Staphylococcus, and Bacillus (members of the top 10 most abundant taxa) were all part of the mock community with which CLT blocks were inoculated. Among bacterial taxa, Pseudomonas was dominant across all samples except tap water. Bacterial composition of water samples was quite different than coated, uncoated, and control samples. Cutibacterium and Rhodopseudomonas had higher relative abundance in tap water. The wetting period appeared to affect the composition of samples in Series 1 and 3, but did not seem to have as much impact in Series 2.
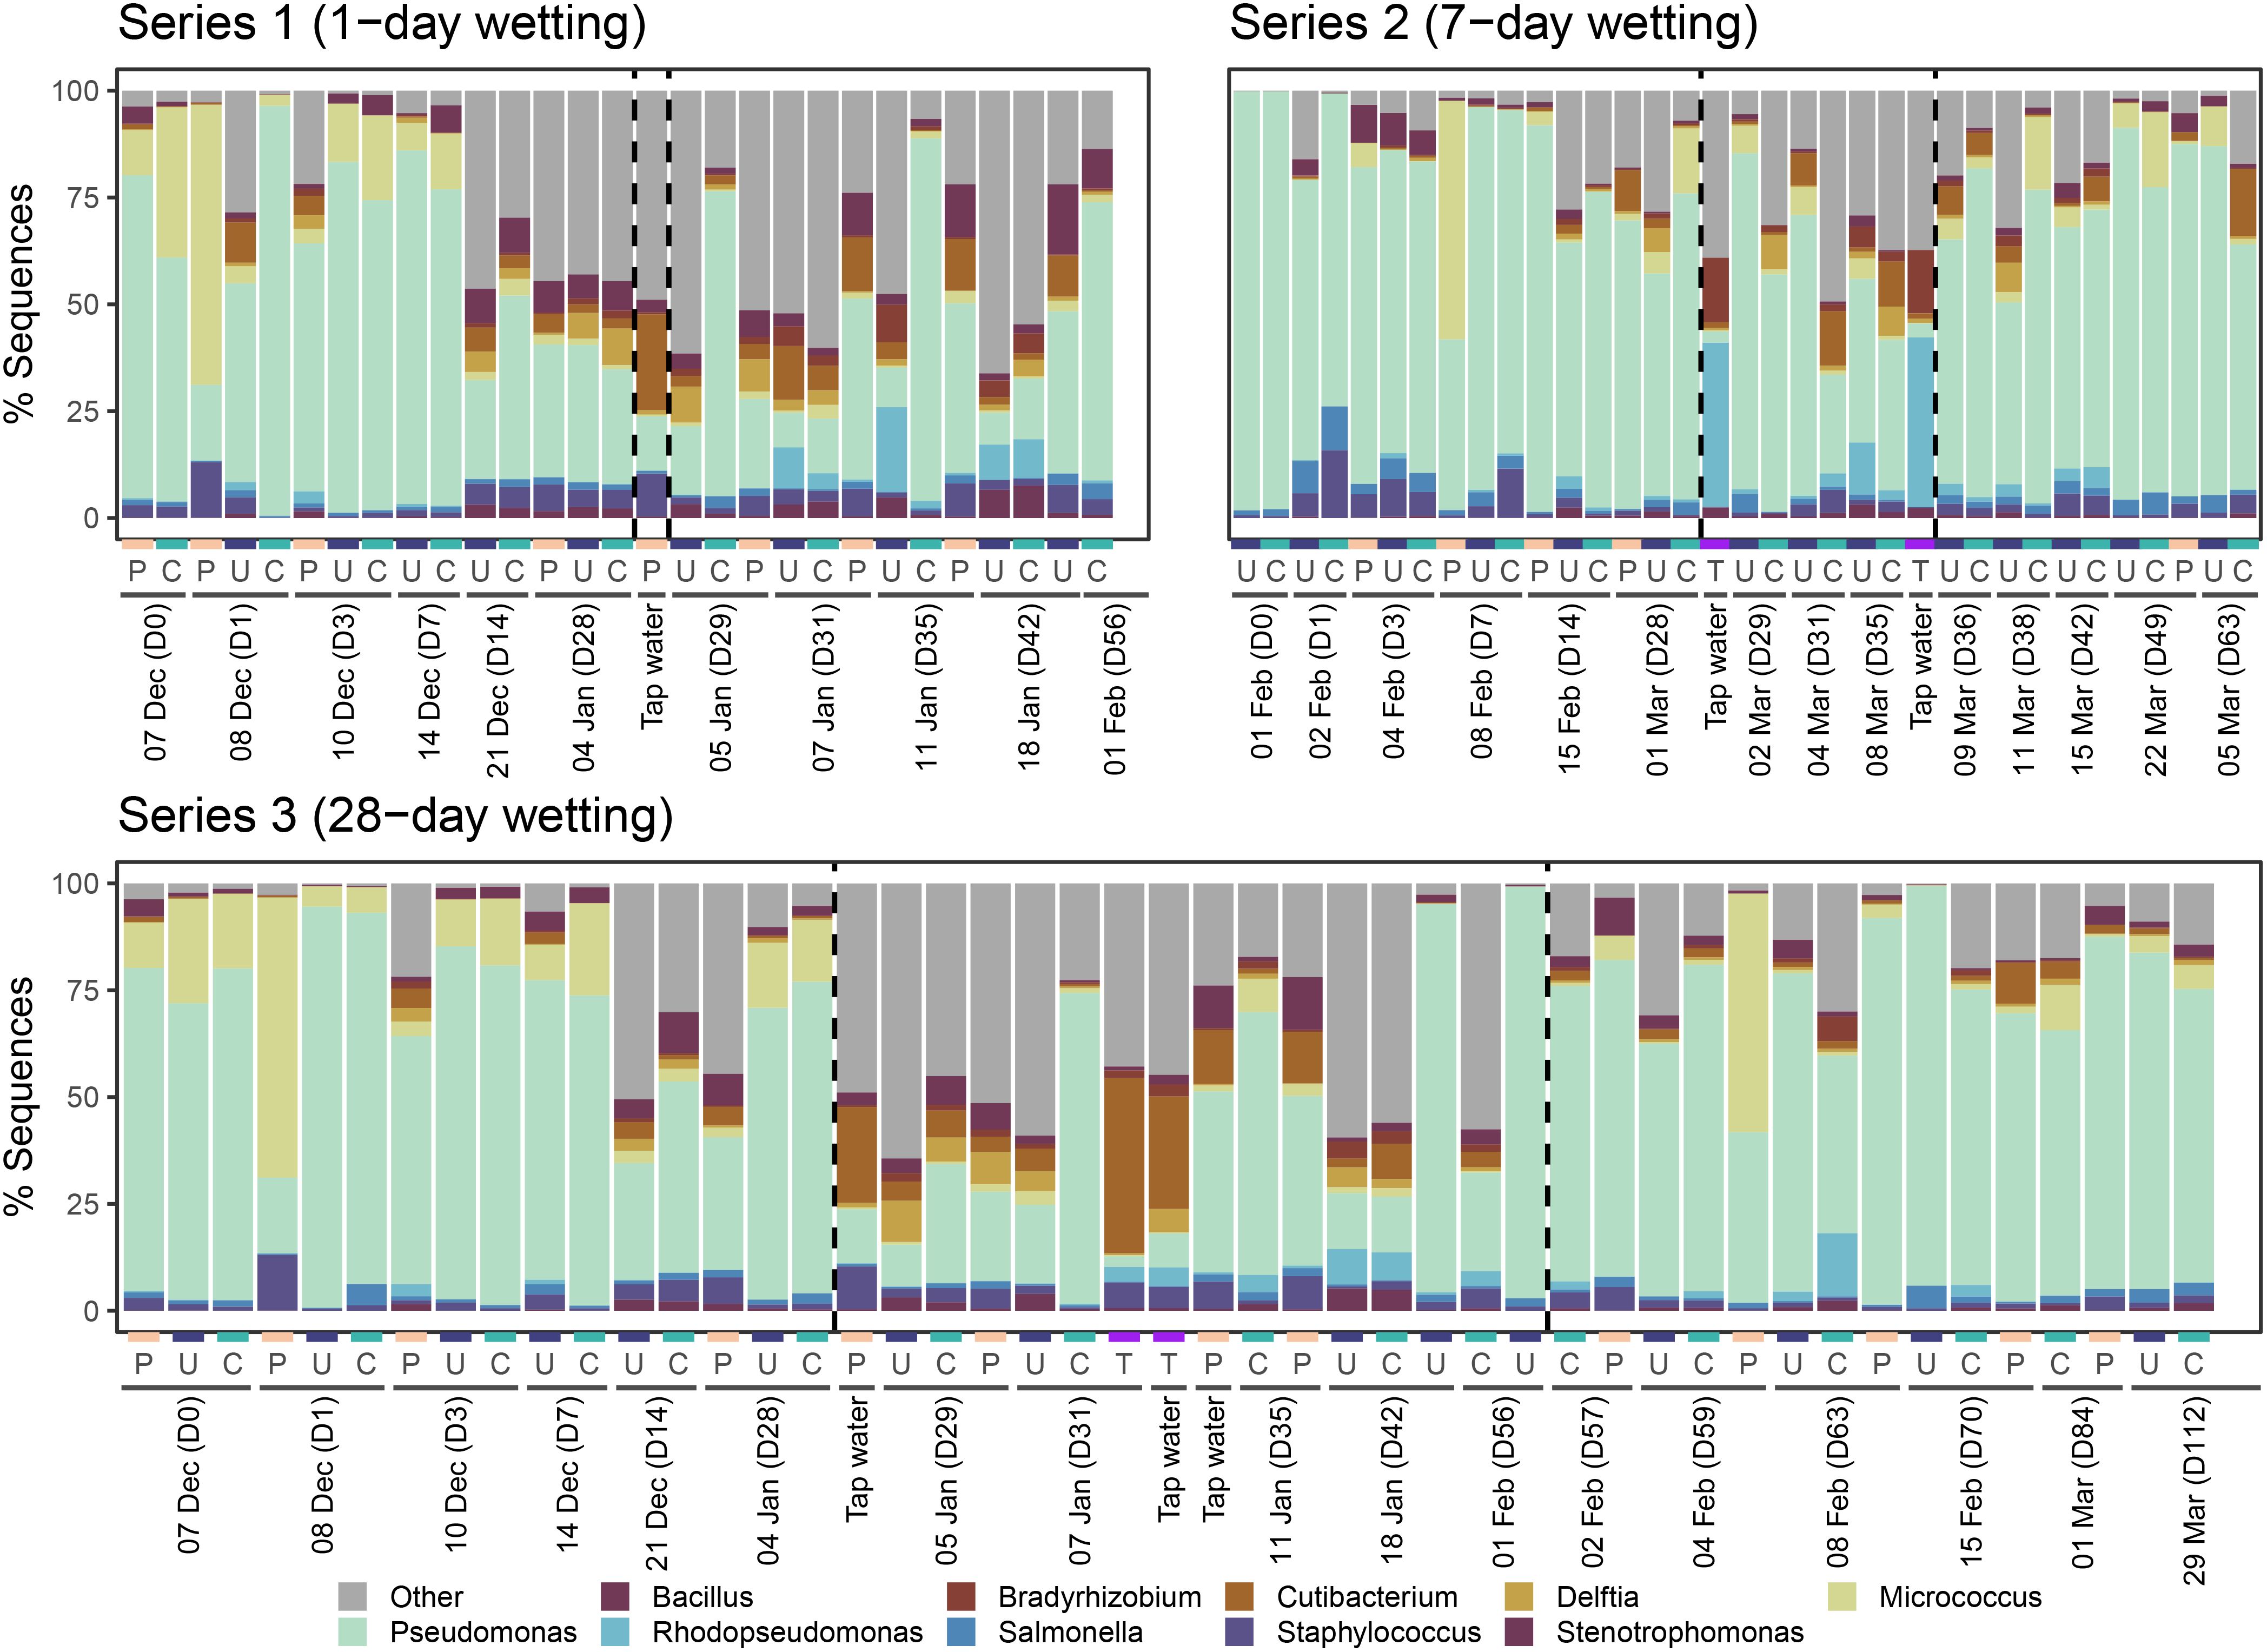
Figure 9. Relative abundance of the top 10 most abundant bacterial genera identified in each sample for each series. All other genera were aggregated into category “Other.” Samples are organized first by sampling day, then by sample type (P = Plastic, U = Uncoated, C = Coated, T = Tap water). Wetting period start and end days are indicated by dashed vertical lines. Tap water and control samples are shown in each series where relevant for reference.
Regarding other microbial groups, we did not observe any striking patterns in archaeal abundance, although halophilic and methanogenic taxa were common among the top ten (Supplementary Figure S7). Fungal communities had high relative abundance of Malassezia, Pyricularia, and Colletotrichum, but also did not display any obvious patterns (Supplementary Figure S8). Lessievirus was abundant in samples from Series 1 and 3 on days 0–7, which were immediately after inoculation, yet to our knowledge this taxon was not present in the mock community. Similarly, between days 29–42, a number of Series 1 and 3 samples across all groups (coated, uncoated, plastic control) had high relative abundance of Alphapapillomavirus (Supplementary Figure S9). Since those days followed onset of the wetting periods, it might be thought that this virus was in the tap water, yet the tap water sample collected on January 4 had only a very low relative abundance of this taxon. Although this experiment took place during the COVID19 pandemic, we recovered no sequences identified as SARS-Cov-2.
We examined relative abundance (with respect to only the bacterial component of each sample) patterns for specific taxa (E. coli, P. fluorescens, S. aureus, S. epidermis, S. typhimirium) that were in the original mock community. E. coli had a low relative abundance throughout the study (Supplementary Figure S10). It had higher relative abundance on the plastic control microcosm during the wetting periods in Series 3 when CLT blocks, but not the plastic control microcosm, were receiving tap water spray, possibly hinting that the water spray was washing bacterial cells off of the surfaces or making the surfaces otherwise inhospitable. This pattern was not seen in Series 2, however. P. fluorescens had very high relative abundance across all series and surface types during the majority of the study, but not in tap water samples (Supplementary Figure S11). Despite its high overall relative abundance, we were unable to discern any consistent pattern in the fluctuations from day to day. S. aureus had moderate relative abundance throughout most of the study (Supplementary Figure S12). There were several dramatic increases in its relative abundance on particular surface types and sampling days, notably on the plastic control microcosm on the day following inoculation and the day following onset of the wetting period for Series 1 and 3. S. epidermis also had a moderate relative abundance and its pattern over time was similar to that of S. aureus, but less pronounced (Supplementary Figure S13). S. typhimirium was not observed among the identified Salmonella taxa. One taxon could not be identified to the species level and had a relative abundance of 0.013, which may have been S. typhimirium.
Initial data exploration showed that sampling period (before, during, or after wetting) was the most influential factor driving compositional dissimilarity for the entire microbial community (ADONIS: R2 = 0.104, p < 0.001), followed by series (R2 = 0.052, p = 0.003). Surface type did not appear to play a role at this level of analysis (R2 = 0.008, p = 0.759). We next split the data by period and microbial group to examine whether series or surface type was more influential before, during, or after wetting and whether the response differed by high-level taxonomic group.
On dry wood surfaces, prior to wetting, sampling day was a significant factor driving compositional similarity for all microbial groups (Table 2). This suggests that the weeks after inoculation experience community successional changes as different species populations fluctuate according to their ability to persist and thrive on the CLT blocks. For archaea, bacteria, and viruses, series was also influential. During the wetting period for each series, sampling day was an important factor for bacteria, fungi, and viruses; surface type was also important for viruses only. None of the factors were significant drivers of archaeal communities during wetting. After wetting, surface type was influential for all microbial groups and series was influential for bacteria, fungi, and viruses. No relationship between microbial composition and VOC composition was found using Procrustean association matrix analysis (Correlation = 0.348, p = 0.096).
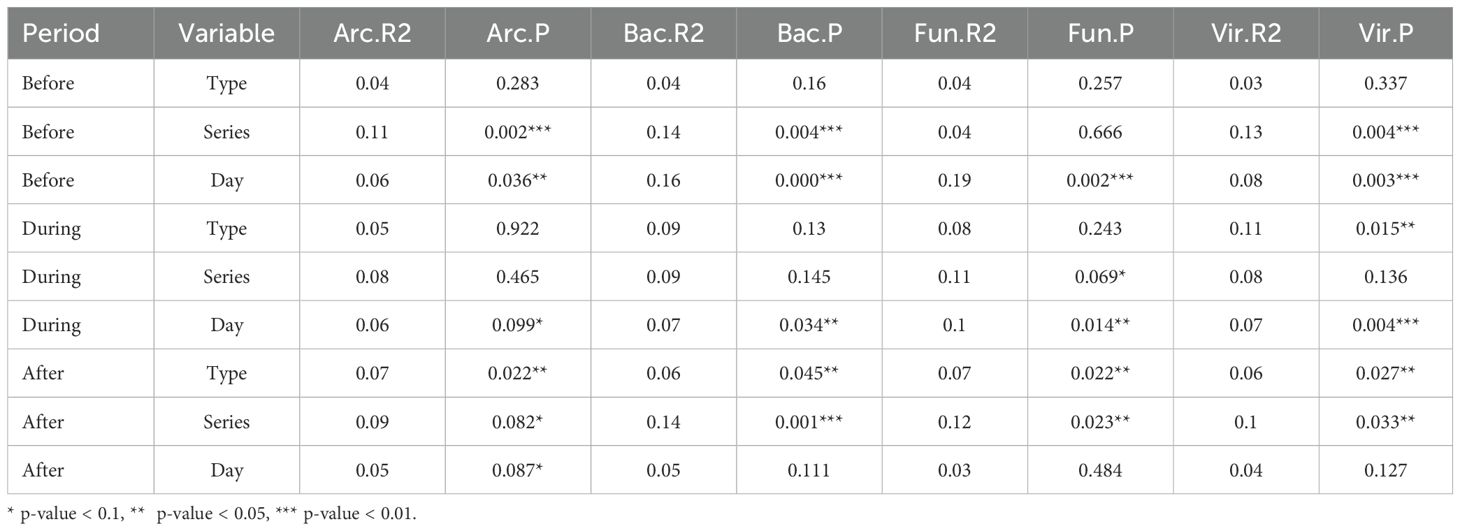
Table 2. Results of PERMANOVA testing for each microbial group, separated by sampling period (before, during, after wetting).
Bacteria comprised the majority of differentially abundant taxa when comparing coated and uncoated CLT blocks before, during, after wetting (Figure 10). This is unsurprising, given that identified bacterial taxa outnumbered any other microbial group by at least an order of magnitude.
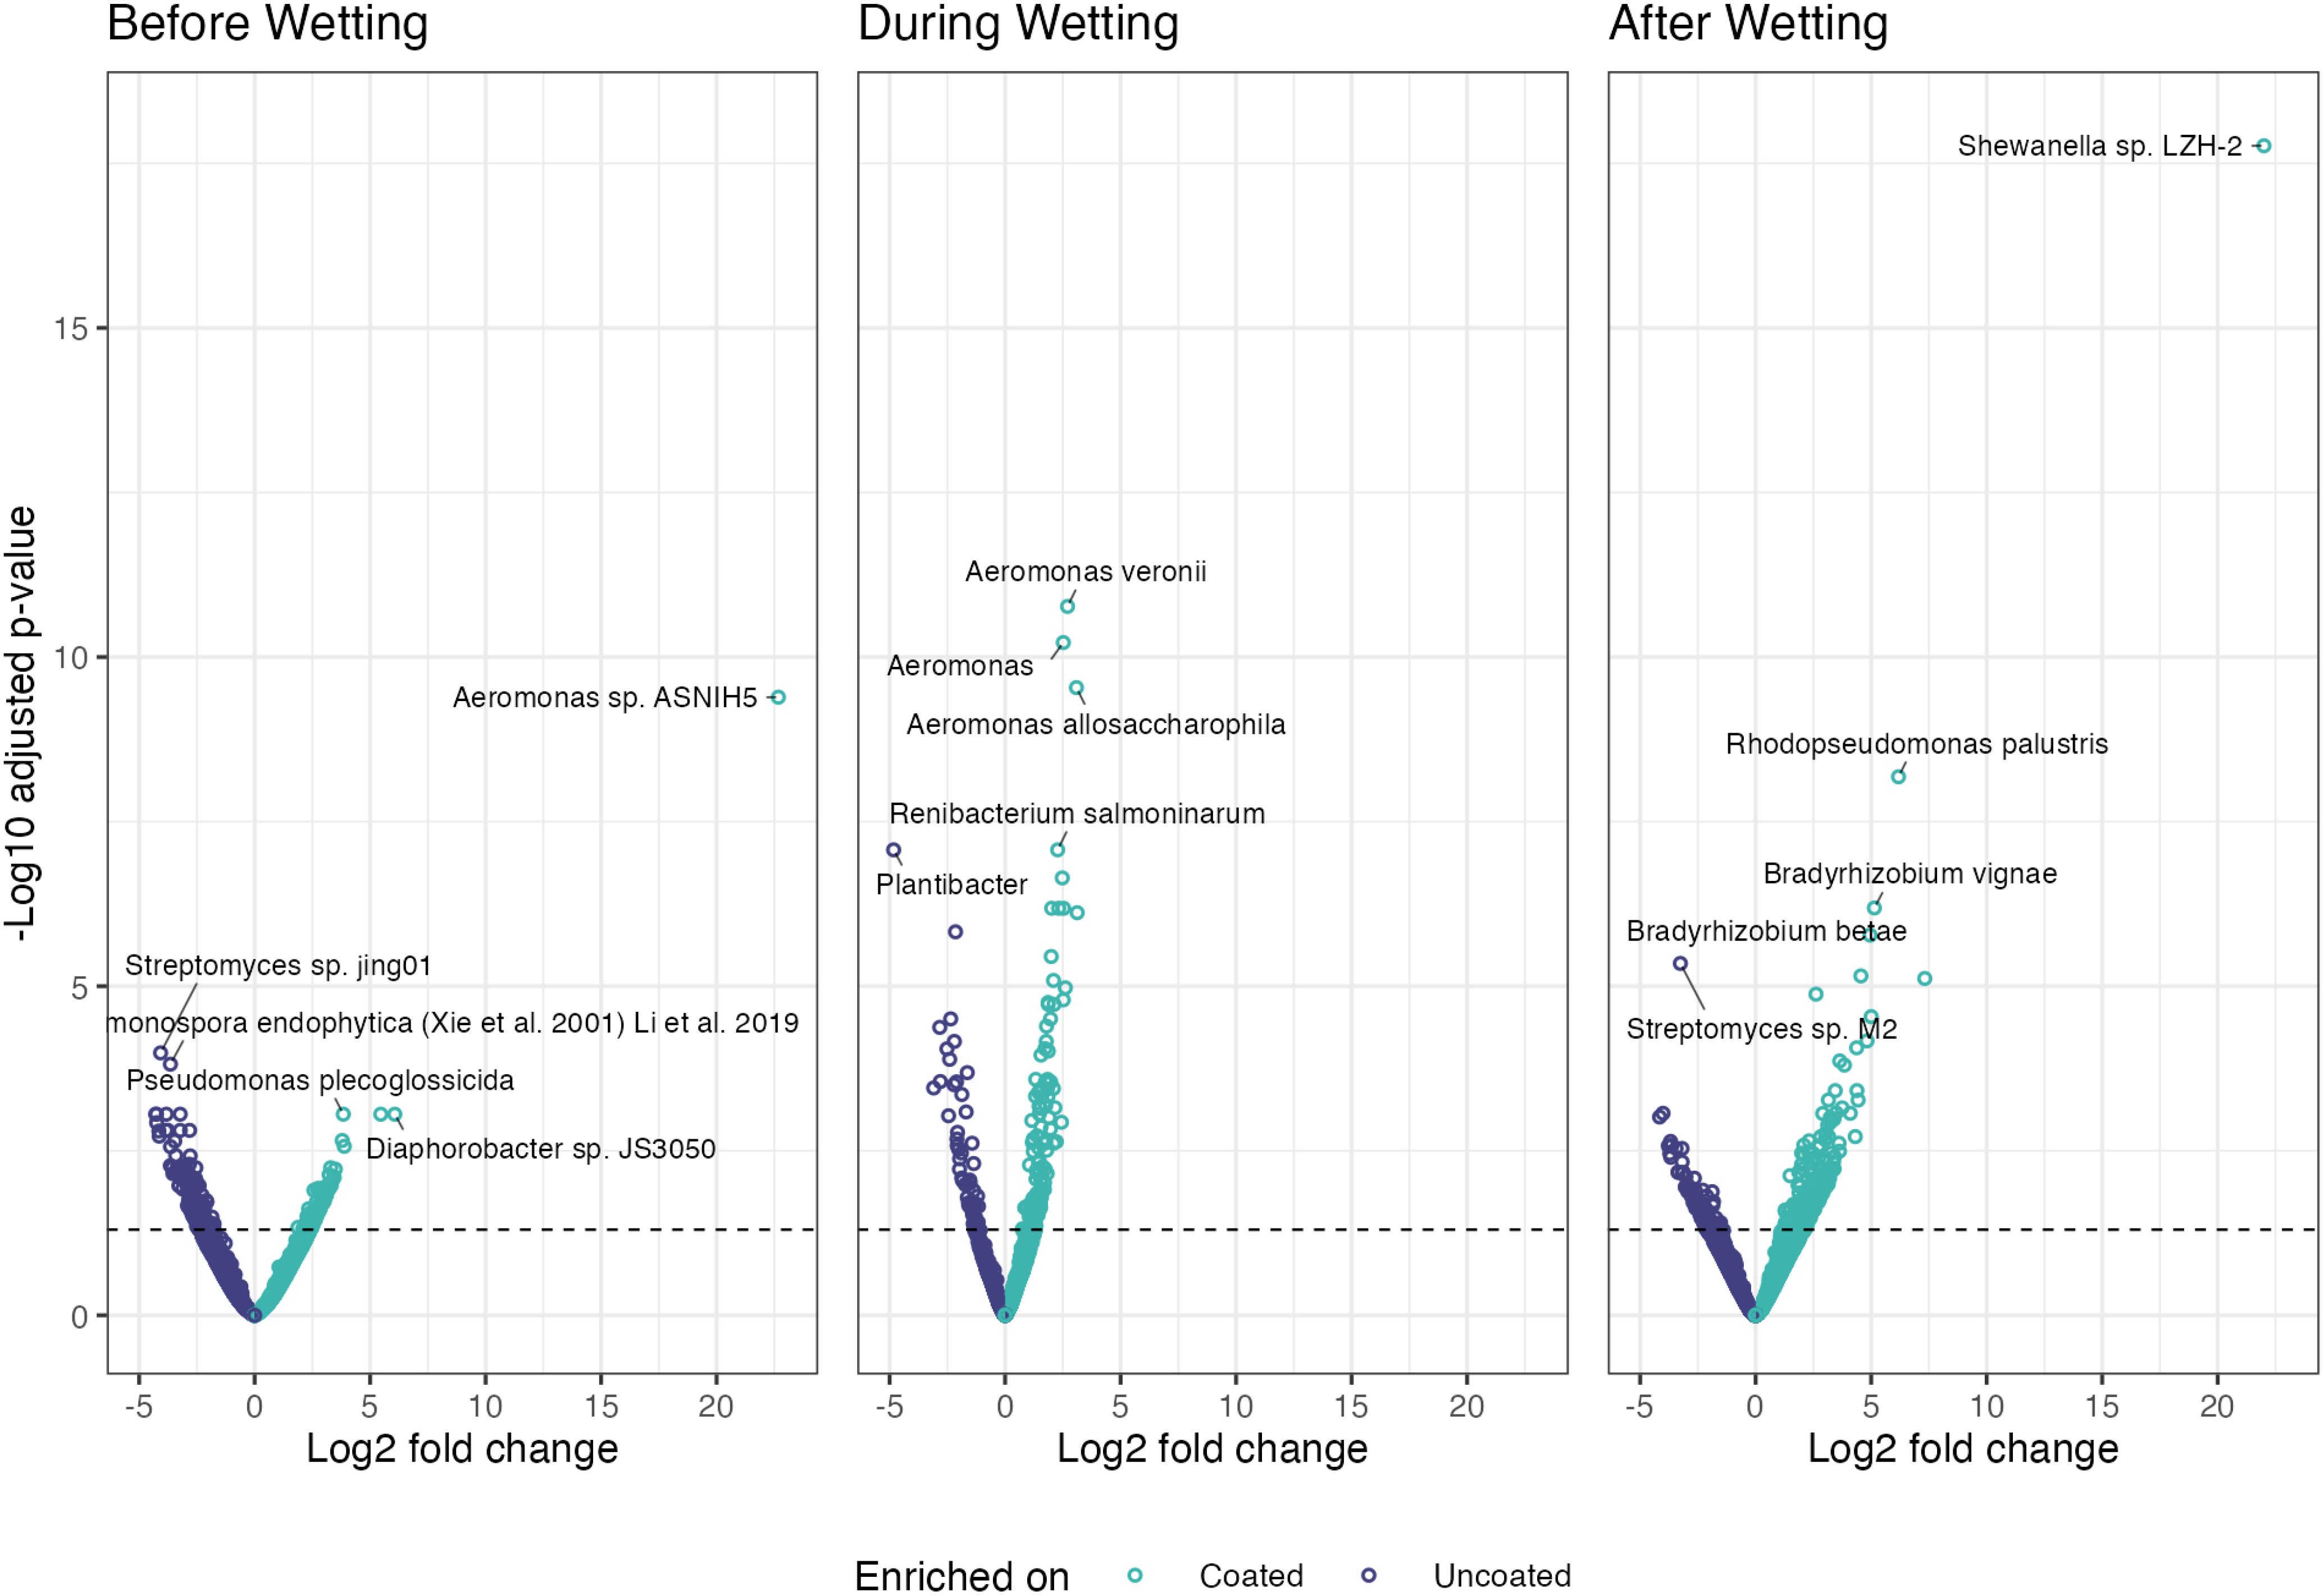
Figure 10. Enriched and depauperate taxa of all microbial groups across the three periods (before, during, after wetting).
On dry wood surfaces, before wetting, no archaea or viruses were differentially abundant, fungal taxon (Eremothecium gossypii) was enriched on coated blocks, and bacterial taxa were enriched on coated blocks and bacterial taxa were enriched on uncoated blocks. During the wetting event, (Halorussus sp. ZS-3) archaeal taxon was enriched on coated blocks, while (Halovivax ruber, Methanothermobacter sp. THM-1, and Geoglobus ahangari) were enriched on uncoated blocks. For fungi, taxon (Fusarium sp.) was enriched on coated blocks and (Sugiyamaella lignohabitans and Komagataella phaffii) were enriched on uncoated blocks. No viral taxa were enriched on coated blocks during the wetting periods and only (Fromanvirus Mycobacterium virus Switzer) was enriched on uncoated blocks. After wetting, archaeal taxa (Halorussus sp. ZS-3, Halosimplex pelagicum, and Thermofilum sp. 3507LT) were enriched on coated blocks and archaeal taxa were enriched on uncoated blocks; bacterial taxa were enriched on coated blocks and on uncoated blocks. No fungal or viral taxa were differentially abundant after wetting.
This study examined moisture content (MC), VOC emissions, and microbial communities on coated and uncoated CLT blocks before, during, and after wetting periods of varying duration. We found that average MC values during the pre-wetting period were similar to values reported by other studies for CLT panels during production and shipping (Kordziel et al., 2019), as well as to the equilibrium moisture content predicted by the 1999 Wood Handbook (Glass et al., 2014). However, MC in this study returned to baseline much more quickly than described in other work (Kordziel et al., 2019; Schmidt and Riggio, 2019; Schmidt et al., 2019; Wang et al., 2020), possibly due to the relatively high airflow of the microcosms, which were based off typical healthcare ventilation guidelines, or to the temperature and relative humidity of supply air coming from the external laboratory space. Mass timber in this study was exposed to airflow over its surface, allowing it to dry after wetting and return to baseline conditions. In the built environment, this may be similar to a floor/ceiling assembly in which the ceiling is mass timber exposed to the indoor environment. However, this study did not consider encapsulation of mass timber in an assembly, such as by gypsum board, insulation, acoustic or structural elements. In this scenario, drying would likely be prolonged. We also found that coating status was not correlated with MC during wetting, except for the deepest measuring pin (MC75). One explanation for this finding may be that moisture was able to penetrate into the wood via the hole drilled to insert the measuring pins. In particular, for Series 2 and Series 3, one of the coated CLT blocks tended to have higher MC than uncoated blocks. Although this observation did not agree with our a priori expectation that the coating would repel moisture, we did not exclude it as an outlier, since there were only three replicates.
Both uncoated and coated CLT blocks emitted more VOCs throughout this 119-day study than the plastic control box. As the coated blocks had higher VOC concentration during the first four weeks of the experiment, we suspect there was continued off-gassing from the coating application, which was completed six weeks prior to the experiment’s start. The age of the plastic control box was unknown, thus, it may have had a longer period since its manufacture to offgas, compared with the CLT blocks in this study. VOC emission rates from coated CLT blocks decreased by 99.1% and emission rates from uncoated CLT blocks decreased by 90.1% over the course of this 112-day study, following similar trends observed for other building materials (Huang and Haghighat, 2002). A study of Scots pine and Norway spruce blocks found that monoterpene emissions decreased 68–87% during one year of storage, and that rehydration of dry wood resulted in temporarily increased emissions (Muilu-Mäkelä et al., 2021). Similarly, in this experiment we noted a plateau of VOC emissions during the wetting period, which we interpreted as a slight increase in CLT emissions due to wetting.
Emission fluxes (the emission rates presented in Supplementary Figure S5, normalized by the projected area of test materials) are ~100 µg/(m2 h) for uncoated CLT and ~1000 µg/(m2 h) for coated CLT; these values are lower and similar to previosly presented emission fluxes for polymeric building materials (Yu and Crump, 1998). Since new construction typically takes many months, by the time the building is occupied, VOC emissions from structural materials are likely to be much lower than those coming from other sources, like equipment, furnishings, and the occupants themselves. One study estimated average human VOC emissions at 6.3 mg/hr/person (Tang et al., 2016). Formaldehyde was not included in our VOC analysis, due to our analysis methodology, which was aimed at exploring potential interactions between mass timber, microbial communities, and VOCs typically associated with natural wood, such as terpenes. In this experiment, terpenes comprised 62.2% of VOC emissions from uncoated CLT blocks and 18.8% from coated blocks, which were dominated by VOCs emitted by paints and solvents. Similarly, Alapieti et al. (2021) found that uncoated pinewood samples emitted large quantities of terpenes, while painted pinewood samples emitted primarily paint-associated compounds. Despite terpenes comprising a smaller proportion of the VOCs emitted by coated CLT blocks, the amount was numerically larger than the amount of terpenes emitted by uncoated blocks, which may be due to terpenes in the formulation of the coating.
We speculate that the high value of VOC emissions in the plastic control box immediately after inoculation (Supplementary Figure S4) may have come from the microorganisms in the mock community, since the most abundant VOC in that sample was 3-hydroxy-2-butanone (acetoin), with a concentration of 1663 µg/m3. There were also high levels of this compound in microcosms containing both coated and uncoated CLT blocks, but not in the incoming laboratory air, nor in noticeable quantities during the remainder of the experiment. Acetoin is produced by many bacteria, including B. subtilis, S. aureus, and E. coli (Camus et al., 2020; Petrov and Petrova, 2021; Xiao and Xu, 2007). A number of other compounds associated with the acetoin pathway, including 2,3-butanediol, 3-methylbutanoic acid, acetic acid, 2,3-butanedione, 2-butoxy-ethanol, and 2-methylbutanoic acid were also among the most abundant VOCs in this particular sample. 2,3-butanedione (diacetyl) and 2,3-butanediol (2,3-butylene glycol) are biological analogues of 3-hydroxy-2-butanone (acetoin), each of which represents a different oxidation level of the same “four-carbon skeleton” and may be alternatively produced during bacterial fermentation processes, depending on environmental conditions (Collins, 1972; Lu et al., 2016; Sharma and Noronha, 2014). It has been hypothesized that the relationship between acetoin production by some taxa (e.g., Staphylococcus) and acetoin consumption by other bacteria (e.g., Pseudomonas) may represent a form of trophic cooperation that benefits both taxa by providing an energy source for the non-producer and reducing toxic accumulation of acetoin for the producer (Camus et al., 2020). Acetoin can also act as a plant growth promoting compound, as demonstrated by studies of rhizobacteria, such as B. subtilis (Bennett et al., 2012).
All series exhibited instability in viable bacterial absolute abundance immediately after inoculation and during the wetting periods; abundance was more consistent during dry periods (with the exception of the post-wetting period in Series 2), possibly as a result of the hostility of the surface to alien microbes from a different source (e.g., inoculation broth, tapwater). Average daily RH (a proxy for wetting) was negatively associated with bacterial abundance in Series 3. During the dry periods before and after wetting, average daily RH in the microcosms was 36%, whereas during the wetting period the average daily RH rose to 62%. Previous studies have shown that bacteria living at surface-air interfaces tend to have lower survival rates at high RH (50–90%) compared with low RH (10–30%) (Stone et al., 2016; Turner and Salmonsen, 1973). Another possibility could be that increased VOC emissions from the CLT blocks could inhibit survival of bacteria. After accounting for the wetting period, uncoated CLT blocks generally had higher bacterial abundance than coated blocks. One ingredient in the coating (3-iodo-2-propynyl butylcarbamate) is known for its biocidal properties, which could explain this result. Wood blocks also had lower abundance than the single plastic control microcosm throughout the majority of the experiment, which could not be tested statistically due to lack of control replicates, but aligns with the preponderance of research showing that plastic surfaces typically allow greater recovery of microorganisms than wood surfaces (Koch et al., 2002; Milling et al., 2005).
The majority of samples submitted for shotgun metagenomics sequencing were characterized by very low biomass, possibly due to the difficulty of recovering microbial cells from wood surfaces, which has been observed in numerous other studies (e.g., Abrishami et al., 1994; Ak et al., 1994; Boursillon and Riethmüller, 2007; Coughenour, 2009; Da Costa et al., 2008; Greatorex et al., 2011; Hedge, 2015; Milling et al., 2005). With relatively simple original communities, until wetting periods, a high percentage (81%) of the trimmed, quality-filtered, unassembled reads were able to be classified. The bacterial mock community used for inoculation included taxa that are well-represented in NCBI RefSeq bacterial database, and bacteria comprised 99.5% of the identified community.
Uncoated CLT blocks displayed increasing richness by time period (before, during, after wetting), which may suggest that new microbial taxa were added to the surface community during wetting events and were able to persist. On the other hand, for coated CLT blocks, richness increased during wetting but then decreased again afterward, possibly indicating a more transient effect on diversity. Another possible explanation for increasing richness during wetting is that the tap water spray could wash off natural wood compounds that normally play a protective role against microbial degradation. Tap water had greater diversity than either coated or uncoated CLT, thus, the increase in diversity on CLT blocks during wetting periods was likely due to new microbial taxa being added to the surface community from tap water. Bacterial taxa observed in the tap water samples, particularly Rhodopseudomonas sp., were also observed in the CLT surface samples after wetting events, suggesting that these taxa were transferred to CLT from the tap water. Rhodopseudomonas is a member of the purple non-sulfur degrading group and is commonly found in anaerobic water, including wastewater, lakes, swamp, and marine bodies (Li et al., 2022). Influence of tap water application was not observed for archaea, fungi, or viruses, possibly due to the paucity of information about these groups of organisms in the NCBI RefSeq databases at the time of this analysis. We also found that the fungal taxon Sugiyamaella lignohabitans, which is commonly associated with decaying wood (Shi et al., 2021), was enriched on uncoated CLT blocks during the wetting periods.
A major limitation of this study was the very low biomass recovered from experimental samples, which led to pooling biological replicates and hampered our ability to draw conclusions supported by hypothesis testing. Prior to beginning the experiment we ran several brief pilot experiments to test our protocols and quantify the amount of recovered microbial DNA by qPCR. The pilot tests indicated that sufficient biomass could be recovered, given the amount of mock community stocks that the blocks were inoculated with. However, the pilot tests were very brief in comparison to the actual experiment, the quantity of bacterial cells contained in the mock community was not estimated, and the recovered DNA was not subjected to PMA treatment prior to qPCR. Thus, it is possible that much of the recovered DNA in the pilot may have been nonviable. We also note that the very low biomass recovery could be viewed as an interesting result of the study, rather than a limitation, since it demonstrates that the microbial inoculant is quickly drawn into the wood pores and cannot be recovered later. Another potential drawback of the study was the high microbial diversity of tap water, which resulted in some ambiguity regarding the fate of the original inoculant. Finally, due to the low biomass issue, we did not quantify the absolute abundance of fungi using qPCR, which would have allowed us to assess the degree to which fungicidal ingredients in the commercial coating mixture may have contributed to differences in fungal abundance.
Architectural usage of CLT and other types of mass timber have increased recently, due to the perceived sustainability and other benefits of wood. However, concerns about the hygienic and moisture performance of exposed wood limit its use in certain applications, like healthcare. Answering our initial research questions, the results of this study suggested that: 1) wetting may cause a slight increase in VOC emissions, which is more pronounced in uncoated than coated CLT, that temporarily counter-acts a general decrease over time; 2) wetting periods tended to reduce abundance of viable bacterial cells on both coated and uncoated CLT surfaces, while also affecting microbial composition; and 3) VOC and microbial composition were not correlated, but the slight increase in VOC emissions associated with the wetting period may be related to the reduced bacterial abundance during the same period.
This study is the first, to our knowledge, to explore relationships between microbial communities inhabiting CLT surfaces and VOC emissions under dry and wetted conditions. Future research priorities should include expanded testing of different coating types, quantification of functional pathways that might relate VOC generation or degradation with microbial communities, and improved methods of collecting microbial samples from porous wood surfaces to ensure adequate biomass for metagenomic analysis.
The original contributions presented in the study are publicly available. This data can be found here: NCBI Sequence Read Archive, accession PRJNA1242807.
GM: Conceptualization, Data curation, Formal analysis, Funding acquisition, Investigation, Methodology, Visualization, Writing – original draft, Writing – review & editing. SC: Investigation, Methodology, Writing – review & editing. LD: Conceptualization, Investigation, Methodology, Supervision, Writing – review & editing. PH: Conceptualization, Investigation, Methodology, Writing – review & editing. AL: Conceptualization, Data curation, Formal analysis, Investigation, Methodology, Visualization, Writing – review & editing. DN: Conceptualization, Data curation, Investigation, Methodology, Writing – review & editing. JS: Conceptualization, Methodology, Writing – review & editing. KW: Conceptualization, Funding acquisition, Methodology, Project administration, Resources, Supervision, Writing – review & editing. EG: Conceptualization, Funding acquisition, Investigation, Methodology, Project administration, Resources, Supervision, Writing – review & editing. MF: Conceptualization, Investigation, Methodology, Project administration, Supervision, Writing – review & editing.
The author(s) declare that financial support was received for the research and/or publication of this article. This project was supported, in part, by a 2020 Wood Innovations Program Grant (#20-11-062765-736) from the USDA U.S. Forest Service.
We extend a special thanks to members of the Biology and Built Environment Center who assisted with sample collection and preparation, especially Vincent Moore and Andreas Olsen Martinez.
Author SC is presently employed by the company Ginkgo Bioworks, Inc. She was not affiliated with Ginkgo Bioworks at the time the study was carried out.
The remaining authors declare that the research was conducted in the absence of any commercial or financial relationships that could be construed as a potential conflict of interest.
All claims expressed in this article are solely those of the authors and do not necessarily represent those of their affiliated organizations, or those of the publisher, the editors and the reviewers. Any product that may be evaluated in this article, or claim that may be made by its manufacturer, is not guaranteed or endorsed by the publisher.
The Supplementary Material for this article can be found online at: https://www.frontiersin.org/articles/10.3389/frmbi.2025.1395519/full#supplementary-material
Abed J., Rayburg S., Rodwell J., Neave M. (2022). A review of the performance and benefits of mass timber as an alternative to concrete and steel for improving the sustainability of structures. Sustainability 14, 5570. doi: 10.3390/su14095570
Abrishami S. H., Tall B. D., Bruursema T. J., Epstein P. S., Shah D. B. (1994). Bacterial adherence and viability on cutting board surfaces. J. Food Saf. 14, 153–172. doi: 10.1111/j.1745-4565.1994.tb00591.x
Ak N. O., Cliver D. O., Kaspar C. W. (1994). Decontamination of plastic and wooden cutting boards for kitchen use. J. Food Prot. 57, 23–30. doi: 10.4315/0362-028X-57.1.23
Alapieti T., Castagnoli E., Salo L., Mikkola R., Pasanen P., Salonen H. (2021). The effects of paints and moisture content on the indoor air emissions from pinewood (PinusSylvestris) boards. Indoor Air 31, 1563–1576. doi: 10.1111/ina.12829
Andrews S. (2010). FastQC: A Quality Control Tool for High Throughput Sequence Data. Available online at: http://www.bioinformatics.babraham.ac.uk/projects/fastqc/ (Accessed October 19, 2021).
Antonelli M., Barbieri G., Donelli D. (2019). Effects of forest bathing (Shinrin-Yoku) on levels of cortisol as a stress biomarker: A systematic review and meta-analysis. Int. J. Biometeorol. 63, 1117–1134. doi: 10.1007/s00484-01901717-x
ASHRAE (2021). ANSI/ASHRAE/ASHE Standard 170–2013, Ventilation of Health Care Facilities (Atlanta, GA, USA: American Society of Heating, Refrigerating and Air-Conditioning Engineers, Inc).
Augustin S., Fell D. (2015). Wood as a Restorative Material in Healthcare Environments (Vancouver, BC, Canada: FPInnovations).
Aviat F., Gerhards C., Rodriguez-Jerez J., Michel V., Bayon I.L., Ismail R., et al. (2016). Microbial safety of wood in contact with food: A review: food safety of wooden surfaces …. Compr. Rev. Food Sci. Food Saf. 15, 491–505. doi: 10.1111/1541-4337.12199
Benjamini Y., Hochberg Y. (1995). Controlling the false discovery rate: A practical and powerful approach to multiple testing. J. R. Stat. Society Ser. B (Methodological) 57, 289–300. Available at: http://www.jstor.org/stable/2346101 (Accessed May 9, 2016).
Bennett J. W., Hung R., Lee S., Padhi S. (2012). “18 fungal and bacterial volatile organic compounds: an overview and their role as ecological signaling agents,” in Fungal Associations. Ed. Hock B. (Springer Berlin Heidelberg, Berlin, Heidelberg), 373–393. doi: 10.1007/978-3-642-30826-0_18
Boersig M. R., Cliver D. O. (2010). The role of pallets in microbial food safety. Food Prot. Trends 30, 576–579.
Boursillon D., Riethmüller V. (2007). The safety of wooden cutting boards: remobilization of bacteria from pine, beech, and polyethylene. Br. Food J. 109, 315–322. doi: 10.1108/00070700710736561
Burnard M. D., Kutnar A. (2015). Wood and human stress in the built indoor environment: A review. Wood Sci. Technol. 49, 969–986. doi: 10.1007/s00226015-0747-3
Bushnell B. (2021). BBMap (Ernest Orlando Lawrence Berkeley National Laboratory, Berkeley, CA: Department of Energy Joint Genome Institute).
Camus L., Briaud P., Bastien S., Elsen S., Doléans-Jordheim A., Vandenesch F., et al. (2020). Trophic cooperation promotes bacterial survival of Staphylococcus aureus and Pseudomonas aeruginosa. ISME J. 14, 3093–3105. doi: 10.1038/s41396-020-00741-9
Cappellazzi J., Konkler M. J., Sinha A., Morrell J. J. (2020). Potential for decay in mass timber elements: A review of the risks and identifying possible solutions. Wood Mater. Sci. Eng. 15, 351–360. doi: 10.1080/17480272.2020.1720804
Cho K. S., Lim Y.-R., Lee K., Lee J., Lee J. H., Lee I.-S. (2017). Terpenes from forests and human health. Toxicol. Res. 33, 97–106. doi: 10.5487/TR.2017.33.2.097
Collins E. (1972). Biosynthesis of flavor compounds by microorganisms. J. Dairy Sci. 55, 1022–1028. doi: 10.3168/jds.S0022-0302(72)85615-7
Comnick J., Rogers L., Wheiler K. (2021). Increasing mass timber consumption in the U.S. and sustainable timber supply. Sustainability 14, 381. doi: 10.3390/su14010381
Coughenour C. A. (2009). “An Evaluation of Methicillin Resistant Staphylococcus Aureus Survival on Five Environmental Surfaces under Two Different Humidities, with and without the Addition of Bovine Serum Albumin”. MA thesis (Las Vegas, Nevada: University of Nevada, Las Vegas).
Dabdoub S. (2021). Kraken-Biom. Version 1.0.1. Available online at: https://github.com/smdabdoub/kraken-biom (Accessed October 17, 2021).
Da Costa A. R., Kothari A., Bannister G. C., Blom A. W. (2008). Investigating bacterial growth in surgical theatres: establishing the effect of laminar airflow on bacterial growth on plastic, metal and wood surfaces. Ann. R. Coll. Surgeons Engl. 90, 417–419. doi: 10.1308/003588408X300993
Duan Z., Huang Q., Zhang Q. (2022). Life cycle assessment of mass timber construction: A review. Building Environ. 221, 109320. doi: 10.1016/j.buildenv.2022.109320
Eddy S. R. (2011). Accelerated profile HMM searches. PloS Comput. Biol. 7, e1002195. doi: 10.1371/journal.pcbi.1002195
Fell D. R. (2010). “Wood in the Human Environment: Restorative Properties of Wood in the Built Indoor Environment”. PhD Forestry (Vancouver BC: University of British Columbia).
Fittipaldi M., Nocker A., Codony F. (2012). Progress in understanding preferential detection of live cells using viability dyes in combination with DNA amplification. J. Microbiol. Methods 91, 276–289. doi: 10.1016/j.mimet.2012.08.007
Gibson M. K., Forsberg K. J., Dantas G. (2015). Improved annotation of antibiotic resistance determinants reveals microbial resistomes cluster by ecology. ISME J. 9, 207–216. doi: 10.1038/ismej.2014.106
Glass S. V., Zelinka S. L., Johnson J. A. (2014). Investigation of Historic Equilibrium Moisture Content Data from the Forest Products Laboratory. FPL-GTR-229 (Madison, WI: U.S. Department of Agriculture, Forest Service, Forest Products Laboratory, FPLGTR–229). doi: 10.2737/FPL-GTR-229
Gminski R., Tang T., Mersch-Sundermann V. (2010). Cytotoxicity and genotoxicity in human lung epithelial A549 cells caused by airborne volatile organic compounds emitted from pine wood and oriented strand boards. Toxicol. Lett. 196, 33–41. doi: 10.1016/j.toxlet.2010.03.015
Greatorex J. S., Digard P., Curran M.D., Moynihan R., Wensley H., Wreghitt T., et al. (2011). Survival of influenza A (H1N1) on materials found in households: implications for infection control. PloS One 6, e27932. doi: 10.1371/journal.pone.0027932
Hedge A. (2015). Survival of Escherichia coli, Pseudomona aeruginosa, Staphylococcus aureus on wood and plastic surfaces. J. Microb. Biochem. Technol. 07, 210–212. doi: 10.4172/1948-5948.1000207
Himes A., Busby G. (2020). Wood buildings as a climate solution. Developments Built Environ. 4, 100030. doi: 10.1016/j.dibe.2020.100030
Huang H., Haghighat F. (2002). Modelling of volatile organic compounds emission from dry building materials. Building Environ. 37, 1127–1138. doi: 10.1016/S0360-1323(01)00089-0
Hyatt D., Chen G.-L., LoCascio P. F., Land M. L., Larimer F. W., Hauser L. J. (2010). Prodigal: prokaryotic gene recognition and translation initiation site identification. BMC Bioinf. 11.1, 119. doi: 10.1186/1471-2105-11-119
Ikei H., Song C., Miyazaki Y. (2017). Physiological effects of wood on humans: A review. J. Wood Sci. 63.1, 1–23. doi: 10.1007/s10086-016-1597-9
Junge K. M., Buchenauer L., Elter E., Butter K., Kohajda T., Herberth G., et al. (2021). Wood emissions and asthma development: results from an experimental mouse model and a prospective cohort study. Environ. Int. 151, 106449. doi: 10.1016/j.envint.2021.106449
Koch A. P., Kofod C., Konova D., Kvist K. E., Lindegaard B. (2002). Wood, Plastic and Steel - a Comparison of Hygienic Properties. 10 (Aarhus, Denmark: Danish Technological Institute).
Kordziel S., Glass S. V., Boardman C. R., Munson R. A., Zelinka S. L., Pei S., et al. (2020). Hygrothermal characterization and modeling of cross-laminated timber in the building envelope. Building Environ. 177, 106866. doi: 10.1016/j.buildenv.2020.106866
Kordziel S., Pei S., Glass S. V., Zelinka S., Tabares-Velasco P. C. (2019). Structure moisture monitoring of an 8-story mass timber building in the Pacific Northwest. J. Archit. Eng. 25, 04019019. doi: 10.1061/(ASCE)AE.1943-5568.0000367
Kotradyova V., Vavrinsky E., Kalinakova B., Petro D., Jansakova K., Boles M., et al. (2019). Wood and its impact on humans and environment quality in health care facilities. Int. J. Environ. Res. Public Health 16, 3496. doi: 10.3390/ijerph16183496
Kukk V., Kers J., Kalamees T., Wang L., Ge H. (2022). Impact of built-in moisture on the design of hygrothermally safe cross-laminated timber external walls: A stochastic approach. Building Environ. 226, 109736. doi: 10.1016/j.buildenv.2022.109736
Lepage R., Glass S. V., Knowles W., Mukhopadhyaya P. (2019). Biodeterioration models for building materials: critical review. J. Archit. Eng. 25, 04019021. doi: 10.1061/(ASCE)AE.1943-5568.0000366
Li D., Liu C.-M., Luo R., Sadakane K., Lam T.-W. (2015). MEGAHIT: An Ultra-Fast Single-Node Solution for Large and Complex Metagenomics Assembly via Succinct de Bruijn Graph. Bioinformatics 31, 1674–1676. doi: 10.1093/bioinformatics/btv033
Li M., Ning P., Sun Y., Luo J., Yang J. (2022). Characteristics and application of Rhodopseudomonas palustris as a microbial cell factory. Front. Bioeng. Biotechnol. 10. doi: 10.3389/fbioe.2022.897003
Lisboa F. J. G., Peres-Neto P. R., Chaer G. M., Jesus E. D.C., Mitchell R. J., Chapman S. J., et al. (2014). Much beyond mantel: bringing procrustes association metric to the plant and soil ecologist’s toolbox. PloS One 9, e101238. doi: 10.1371/journal.pone.0101238
Love M. I., Huber W., Anders S. (2014). Moderated estimation of fold change and dispersion for RNA-seq data with DESeq2. Genome Biol. 15, 1–21. doi: 10.1186/s13059-014-0550-8
Lu Z.-M., Liu N., Wang L.-J., Wu L.-H., Gong J.-S., Yu Y.-J., et al. (2016). Elucidating and regulating the acetoin production role of microbial functional groups in multispecies acetic acid fermentation. Appl. Environ. Microbiol. 82, 5860–5868. doi: 10.1128/AEM.01331-16
Maeda H., Fujimoto C., Haruki Y., Maeda T., Kokeguchi S., Petelin M., et al. (2003). Quantitative real-time PCR using taqMan and SYBR green for Actinobacillus actinomycetemcomitans, Porphyromonas gingivalis, Prevotella intermedia, tetQ gene and total bacteria. FEMS Immunol. Med. Microbiol. 39, 81–86. doi: 10.1016/S0928-8244(03)00224-4
Matsubara E., Kawai S. (2014). VOCs emitted from Japanese cedar (Cryptomeria japonica) interior walls induce physiological relaxation. Building Environ. 72, 125–130. doi: 10.1016/j.buildenv.2013.10.023
McMurdie P. J., Holmes S. (2013). Phyloseq: an R package for reproducible interactive analysis and graphics of microbiome census data. PloS One 8, e61217. doi: 10.1371/journal.pone.0061217
Mhuireach G. Á., Dietz L., Griffiths W., Horve P. F., Laguerre A., Northcutt D., et al. (2021). Differing effects of four building materials on viable bacterial communities and VOCs. Developments Built Environ. 7, 100055. doi: 10.1016/j.dibe.2021.100055
Milling A., Kehr R., Wulf A., Smalla K. (2005). Survival of bacteria on wood and plastic particles: dependence on wood species and environmental conditions. Holzforschung 59, 72–81. doi: 10.1515/HF.2005.012
Mjörnell K., Olsson L. (2019). Moisture safety of wooden buildings – design, construction and operation. sace 24, 29–35. doi: 10.5755/j01.sace.24.1.23230
Muilu-Mäkelä R., Kilpeläinen P., Kitunen V., Harju A., Venäläinen M., Sarjala T. (2021). Indoor storage time affects the quality and quantity of volatile monoterpenes emitted from softwood timber. Holzforschung 75, 945–956. doi: 10.1515/hf-20200262
Munir M. T., Aviat F., Pailhories H., Eveillard M., Irle M., Federighi M., et al. (2019). Antimicrobial characteristics of untreated wood: towards a hygienic environment. Health 11, 152–170. doi: 10.4236/health.2019.112014
Núñez-Antón V., Zimmerman D. L. (2000). Modeling nonstationary longitudinal data. Biometrics 56, 699–705. doi: 10.1111/j.0006-341x.2000.00699.x
Nyrud A. Q., Bysheim K., Bringslimark T. (2010). Health Benefits from Wood Interior in a Hospital Room. Proceedings of the International Convention of Society of Wood Science and Technology and United Nations Economic Commission for Europe – Timber Committee, 8. (Geneva, Switzerland).
O’Leary N. A., Wright M. W., Brister J. R., Ciufo S., Haddad D., McVeigh R., et al. (2016). Reference sequence (RefSeq) database at NCBI: current status, taxonomic expansion, and functional annotation. Nucleic Acids Res. 44, D733–D745. doi: 10.1093/nar/gkv1189
Oksanen J., Wright M. W., Brister J. R., Ciufo S., Haddad D., McVeigh R., et al. (2018). Vegan: Community Ecology Package. Version R package version 2.5-1. Available online at: https://CRAN.R-project.org/package=vegan (Accessed May 12, 2018).
Olsson L. (2020). “Moisture safety in CLT construction without weather protection – case studies, literature review and interviews,” in Kurnitski J., Kalamees T. (Eds.), E3S Web Conf. 172. doi: 10.1051/e3sconf/202017210001
Pailhoriés H., Munir M. T., Aviat F., Federighi M., Belloncle C., Eveillard M. (2017). Oak in hospitals, the worst enemy of. Infect. Control Hosp. Epidemiol. 38, 3. doi: 10.1017/ice.2016.304
Pankow J. F., Luo W., Isabelle L. M., Bender D. A., Baker R. J. (1998). Determination of a wide range of volatile organic compounds in ambient air using multisorbent adsorption/thermal desorption and gas chromatography/mass spectrometry. Anal. Chem. 70, 5213–5221. doi: 10.1021/ac980481t
Pasanen A.-L., Kasanen J.-P., Rautiala S., Ikaheimo M., Rantamaki J., Kaariainen H., et al. (2000). Fungal Growth and Survival in Building Materials under Fluctuating Moisture and Temperature Conditions. International Biodeterioration & Biodegradation 46 (2), 117–127. doi: 10.1016/S0964-8305(00)00093-7
Pedersen T. (2022). Patchwork: The Composer of Plots. Version 1.1.2. Available online at: https://CRAN.R-project.org (Accessed August 23, 2023).
Petrov K., Petrova P. (2021). Current advances in microbial production of acetoin and 2,3-butanediol by Bacillus spp. Fermentation 7, 307. doi: 10.3390/fermentation7040307
Pinheiro J. C., Bates D. M. (2000). Mixed-Effects Models in S and S-PLUS. Statistics and Computing (New York: Springer-Verlag). doi: 10.1007/b98882
Pinheiro J., Bates D., R Core Team (2023). nlme: Linear and Nonlinear Mixed Effects Models. Retrieved from https://CRAN.R-project.org/package=nlme.
Pohleven J., Burnard M., Kutnar A. (2019). Volatile organic compounds emitted from untreated aand thermally modified wood - a review. Wood Fiber Sci. 51, 231–254. doi: 10.22382/wfs-2019-023
Puettmann M., Pierobon F., Ganguly I., Gu H., Chen C., Liang S., et al. (2021). Comparative LCAs of conventional and mass timber buildings in regions with potential for mass timber penetration. Sustainability 13, 13987. doi: 10.3390/su132413987
Riggio M., Schmidt E., Mustapha G. (2019). Moisture monitoring data of mass timber elements during prolonged construction exposure: the case of the forest science complex (Peavy hall) at Oregon State University. Front. Built Environ. 5. doi: 10.3389/fbuil.2019.00098
Sakuragawa S., Miyazaki Y., Kaneko T., Makita T. (2005). Influence of wood wall panels on physiological and psychological responses. J. Wood Sci. 51, 136–140. doi: 10.1007/s10086-004-0643-1
Schmidt E., Riggio M. (2019). Monitoring moisture performance of cross-laminated timber building elements during construction. Buildings 9, 144. doi: 10.3390/buildings9060144
Schmidt E. L., Riggio M., Barbosa A. R., Mugabo I. (2019). Environmental response of a CLT floor panel: lessons for moisture management and monitoring of mass timber buildings. Building Environ. 148, 609–622. Available at: https://linkinghub.elsevier.com/retrieve/pii/S0360132318307339 (Accessed January 10, 2020).
Sharma P., Noronha S. (2014). Comparative assessment of factors involved in acetoin synthesis by Bacillus subtilis 168. ISRN Microbiol. 2014, 1–7. doi: 10.1155/2014/578682
Shi C.-F., Zhang K.-H., Chai C.-Y., Yan Z.-L., Hui F.-L. (2021). Diversity of the genus sugiyamaella and description of two new species from rotting wood in China. MycoKeys 77, 27–39. doi: 10.3897/mycokeys.77.60077
Skullestad J. L., Bohne R. A., Lohne J. (2016). High-rise timber buildings as a climate change mitigation measure – A comparative LCA of structural system alternatives. Energy Proc. 96, 112–123. doi: 10.1016/j.egypro.2016.09.112
Stone W., Kroukamp O., Korber D., McKelvie J., Wolfaardt G. (2016). Microbes at surface-air interfaces: the metabolic harnessing of relative humidity, surface hygroscopicity, and oligotrophy for resilience. Front. Microbiol. 7. doi: 10.3389/fmicb.2016.01563
Tang X., Misztal P. K., Nazaroff W. W., Goldstein A. H. (2016). Volatile organic compound emissions from humans indoors. Environ. Sci. Technol. 50, 12686–12694. doi: 10.1021/acs.est.6b04415
Tupenaite L., Kanapeckiene L., Naimaviciene J., Kaklauskas A., Gecys T. (2023). Timber construction as a solution to climate change: A systematic literature review. Buildings 13, 976. doi: 10.3390/buildings13040976
Turner A. G., Salmonsen P. A. (1973). The effect of relative humidity on the survival of three serotypes of klebsiella. J. Appl. Bacteriol. 36, 497–499. doi: 10.1111/j.1365-2672.1973.tb04132.x
Vainio-Kaila T., Zhang X., Hänninen T., Kyyhkynen A., Willför S., Österberg M., et al. (2017). Antibacterial effects of wood structural components and extractives from Pinus sylvestris and Picea abies on Methicillin-resistant Staphylococcus aureus and Escherichia coli O157:H7. BioResources 12, 14. doi: 10.15376/biores
Viitanen H., Ojanen T. (2007). “Improved model to predict mold growth in building materials,” in Proceedings of the 10th Thermal Performance of the Exterior Envelopes of Whole Buildings Conference. 10th Thermal Performance of the Exterior Envelopes of Whole Buildings Conference (ASHRAE, Atlanta, USA).
Wang J. Y., Stirling R., Morris P. I., Taylor A., Lloyd J., Kirker G., et al. (2018). Durability of mass timber structures: A review of the biological risks. Wood Fiber Sci. 50, 110–127. doi: 10.22382/wfs-2018-045
Wang L., Wang J., Ge H. (2020). “Wetting and drying performance of cross-laminated timber related to on-site moisture protections: field measurements and hygrothermal simulations,” in Kurnitski J., Kalamees T. Eds., E3S Web Conf, vol. 172. doi: 10.1051/e3sconf/202017210003
Weschler C. J., Shields H. C. (1999). Indoor ozone/terpene reactions as a source of indoor particles. Atmos. Environ. 33, 2301–2312. doi: 10.1016/S13522310(99)00083-7
Wickham H. (2016). Ggplot2: Elegant Graphics for Data Analysis (New York: SpringerVerlag). Available at: https://ggplot2.tidyverse.org (Accessed August 11, 2021).
Willis A. D. (2017). Rarefaction, Alpha Diversity, and Statistics. Front. Microbiol. 10. doi: 10.3389/fmicb.2019.02407
Wood D. E., Lu J., Langmead B. (2019). Improved metagenomic analysis with kraken 2. Genome Biol. 20, 257. doi: 10.1186/s13059-019-1891-0
Xiao Z., Xu P. (2007). Acetoin metabolism in bacteria. Crit. Rev. Microbiol. 33, 127–140. doi: 10.1080/10408410701364604
Yu C., Crump D. (1998). A review of the emission of VOCs from polymeric materials used in buildings. Building Environ. 33, 357–374. doi: 10.1016/S03601323(97)00055-3
Zhang X., Lian Z., Ding Q. (2016). Investigation variance in human psychological responses to wooden indoor environments. Building Environ. 109, 58–67. doi: 10.1016/j.buildenv.2016.09.014
Keywords: shotgun metagenomics, cross-laminated timber, green buildings, terpenes, evidence based design
Citation: Mhuireach GÁ, Collins S, Dietz L, Horve PF, Laguerre A, Northcutt D, Stenson J, Wymelenberg KVD, Gall E and Fretz M (2025) Effects of wetting events on mass timber surface microbial communities and VOC emissions: implications for building operation and occupant well-being. Front. Microbiomes 4:1395519. doi: 10.3389/frmbi.2025.1395519
Received: 04 March 2024; Accepted: 06 March 2025;
Published: 09 April 2025.
Edited by:
Alexander Mahnert, Medical University of Graz, AustriaReviewed by:
Hualong Hong, Xiamen University, ChinaCopyright © 2025 Mhuireach, Collins, Dietz, Horve, Laguerre, Northcutt, Stenson, Wymelenberg, Gall and Fretz. This is an open-access article distributed under the terms of the Creative Commons Attribution License (CC BY). The use, distribution or reproduction in other forums is permitted, provided the original author(s) and the copyright owner(s) are credited and that the original publication in this journal is cited, in accordance with accepted academic practice. No use, distribution or reproduction is permitted which does not comply with these terms.
*Correspondence: Gwynne Á. Mhuireach, Z3d5bmh3eWZAdW9yZWdvbi5lZHU=
†Present addresses: Susan Collins, Ginkgo Bioworks, Inc., Boston, MA, United States
Leslie Dietz, College of Engineering, Oregon State University, Corvallis, OR, United States
Kevin Van Den Wymelenberg, University of Nebraska–Lincoln, Lincoln, NE, United States
‡ORCID: Leslie Dietz, orcid.org/0000-0002-5623-1524
Disclaimer: All claims expressed in this article are solely those of the authors and do not necessarily represent those of their affiliated organizations, or those of the publisher, the editors and the reviewers. Any product that may be evaluated in this article or claim that may be made by its manufacturer is not guaranteed or endorsed by the publisher.
Research integrity at Frontiers
Learn more about the work of our research integrity team to safeguard the quality of each article we publish.