 Zhiyang Liu
 Yingbo Shen
 Yulin Fu2
 Da Sun
 Ziquan Lv
95% of researchers rate our articles as excellent or good
Learn more about the work of our research integrity team to safeguard the quality of each article we publish.
Find out more
ORIGINAL RESEARCH article
Front. Microbiomes , 11 July 2024
Sec. Nutrition, Metabolism and the Microbiome
Volume 3 - 2024 | https://doi.org/10.3389/frmbi.2024.1384703
Introduction: Hyperuricaemia (HUA), one of chronic diseases, has an increased prevalence and is related to diseases such as gout, arthritis, infectious diseases, etc. Antimicrobial resistance (AMR) in the gut is considered as an atypical chronic disease, and poses risk to human health. The gut microbiome has been proved to be a reservoir for AMR and play an important role in HUA patients. The microbial characteristics of the gut in individuals with HUA have been previously explored, however, the characteristics of the resistome in individuals with HUA have remained largely unexplored.
Methods: Thus, we investigated the landscape of the AMR in individuals with HUA and without HUA, and the potentially influential factors in a case-control study using metagenomics-based approaches.
Results: We found that drinking juice and abnormal stool were risk factors associated with HUA. The taxonomic diversity of gut microbiota in individuals with HUA was lower than that in non-HUA individuals. Notably, a higher abundance and diversity of the resistome (entire antimicrobial resistance genes) was observed in individuals with HUA (median: 1.10 vs. 0.76, P = 0.039, U-test), especially in tetracycline resistance genes (median: 0.46 vs. 0.20, P < 0.001, U-test), which are associated with more complex mobile genetic elements (MGEs) in individuals with HUA. Furthermore, we found that a higher abundance of the resistome was positively correlated with uric acid (UA) levels and affected by several host-associated factors (mainly dietary habits). Specifically, pork consumption and the consumption of root and tuber vegetables were identified as contributing factors. We also found a higher abundance of virulence genes (VGs), mostly related to adherence, antimicrobial activity, competitive advantage, and exoenzymes, in the gut microbial community of individuals with HUA.
Discussion: All findings revealed higher activity of the resistome and pathogenicity of the microbiota in individuals with HUA, indicating a higher health risk in the elderly HUA population.
● A higher abundance and diversity of resistome were observed in hyperuricaemic (HUA) individuals than in non-hyperuricaemic individuals.
● A positive correlation was identified between the resistome and uric acid (UA) levels, and host-associated factors were correlated with a higher abundance of the resistome in individuals with HUA.
● The microbiota of HUA individuals was associated with higher abundance of resistome and VGs than those in non-HUA individuals, which may pose a threat to human health.
Chronic diseases represent a pressing global health issue, with the percentage of deaths caused by them increasing from 67% to 74% over the past decade (Thomas et al., 2023). With progress of urbanisation and economic growth, people’s lifestyles and dietary patterns have greatly changed in last several decades; this has been accompanied by higher incidence of chronic diseases such as diabetes, hypertension, and hyperuricaemia (HUA) (Luo and Wang, 2022). Moreover, the mortality rates associated with these chronic diseases, particularly among elderly individuals (aged ≥ 60) have shown an increase from 2005 to 2020, indicating a heightened risk to elderly people (Cai et al., 2022a). Another study revealed that the proportion of deaths caused by chronic diseases among residents (aged ≥ 65) in China rose annually from 2004 (89.82%) to 2018 (91.41%) (Xia et al., 2021). In addition to deaths, chronic diseases impose an economic burden on society, especially in countries like India and China that have a large proportion of large elderly population (Xu and Yang, 2022). Furthermore, many countries are entering an ageing society stage, with China officially entering this stage (Fang et al., 2020). Hence, the attention on the elderly population with chronic diseases has escalated globally owing to increased mortality rates and economic burdens.
Numerous chronic diseases are linked to nutritional and metabolic disorders, especially those directly caused by malnutrition or metabolic dysregulation (Li et al., 2022). HUA, one of the chronic diseases resulting in arthritis and gout, has witnessed an increased prevalence in recent years worldwide (Yu and Cheng, 2020) as well as in Chinese adults (from 2015 to 2019, the prevalence rose from 11.1% to 14.0%.) (Liu et al., 2014; Zhang M. et al., 2021) and elderly (from 2010 to 2019, the prevalence maybe rose from 6.4% to 10.0%) (Song et al., 2018). Gout is triggered by urate crystals accumulating in joints, causing pain and inflammation (Riches et al., 2009), and prolonged exposure to high UA levels can result in UA stones and a higher likelihood of kidney disease (Fan et al., 2019). HUA directly or indirectly increases the risk of other chronic diseases (Yadav et al., 2013); several studies have indicated a significant association between HUA and chronic diseases such as obesity, metabolic syndrome, and diabetes (Li et al., 2013; King et al., 2018; Feng et al., 2022; Lee et al., 2022).
Disruptions in purine metabolism and uric acid (UA) excretion contribute to HUA (Qin et al., 2022). Approximately two-thirds of UA is eliminated through the kidneys and the remainder is decomposed by gut microbiota (Chu et al., 2021). When uric acid is secreted into the intestinal lumen, it is rapidly metabolised by microbes in the intestine, such as Escherichia coli, Clostridia and Pseudomonas (Crane, 2013). Once the dysbiosis of gut microbiota occurs, the above pathway would be disrupted, resulting in an imbalance between UA production and excretion, thus causing HUA; this emphasises the essential role of the gut microbiota in the HUA (Lv et al., 2020; Wang et al., 2022). Researches have found that dysbiosis of the gut microbiota is associated with an increased risk of infectious diseases in humans (Cai et al., 2022b; Maciel-Fiuza et al., 2023). Additionally, HUA is a risk factor for infection-related deaths in incident dialysis patients (Yoshida et al., 2020), and is related to patients with sepsis (Sreekanth and A. Maldar, 2022). All evidences indicate that HUA patients are possibly susceptible to bacterial infection via their gut microbiota dysbiosis.
Antimicrobial resistance (AMR) poses an urgent global threat to human health. AMR in the gut is considered an atypical chronic disease. This concern is supported by four main pieces of evidence: (1) the gut microbiome serves as a reservoir for AMR in humans (Anthony et al., 2021); (2) the AMR may persist in the human gut for extended periods and their elimination may prove challenging (Lee et al., 2023); (3) the antimicrobial resistance genes (ARGs) could be acquired by opportunistic bacteria and/or pathogenic bacteria, complicating the treatment of infectious diseases and increasing the risk of transmission and infection (Zhang B. et al., 2021); (4) the severe infections could be caused by resistant bacteria derived from gut microbiota (Libertucci and Young, 2019). Therefore, it is necessary to investigate the landscape of AMR in HUA patients gut, and to assess the risk caused by AMR when administering antibiotic treatment to patients with HUA, it may be necessary to consider the presence of AMR. However, studies thus far have largely focused on alterations in the gut microbiome in the HUA population and associations between microbiome diversity and HUA (de Oliveira and Burini, 2012; Klein et al., 2018; Liang et al., 2022; Wei et al., 2022); the association between the AMR and HUA remains largely unknown.
Hence, this study aimed to depict the landscape of the AMR of 60 elderly people with HUA and non-HUA (30:30) in a large community in Shenzhen, China, and explore its associations with demographics, gut microbiota, resistome (entire ARGs) and mobile genetic elements (MGEs) (Figure 1). This study introduces a novel perspective into the existing research on the gut microbiome’s association with HUA.
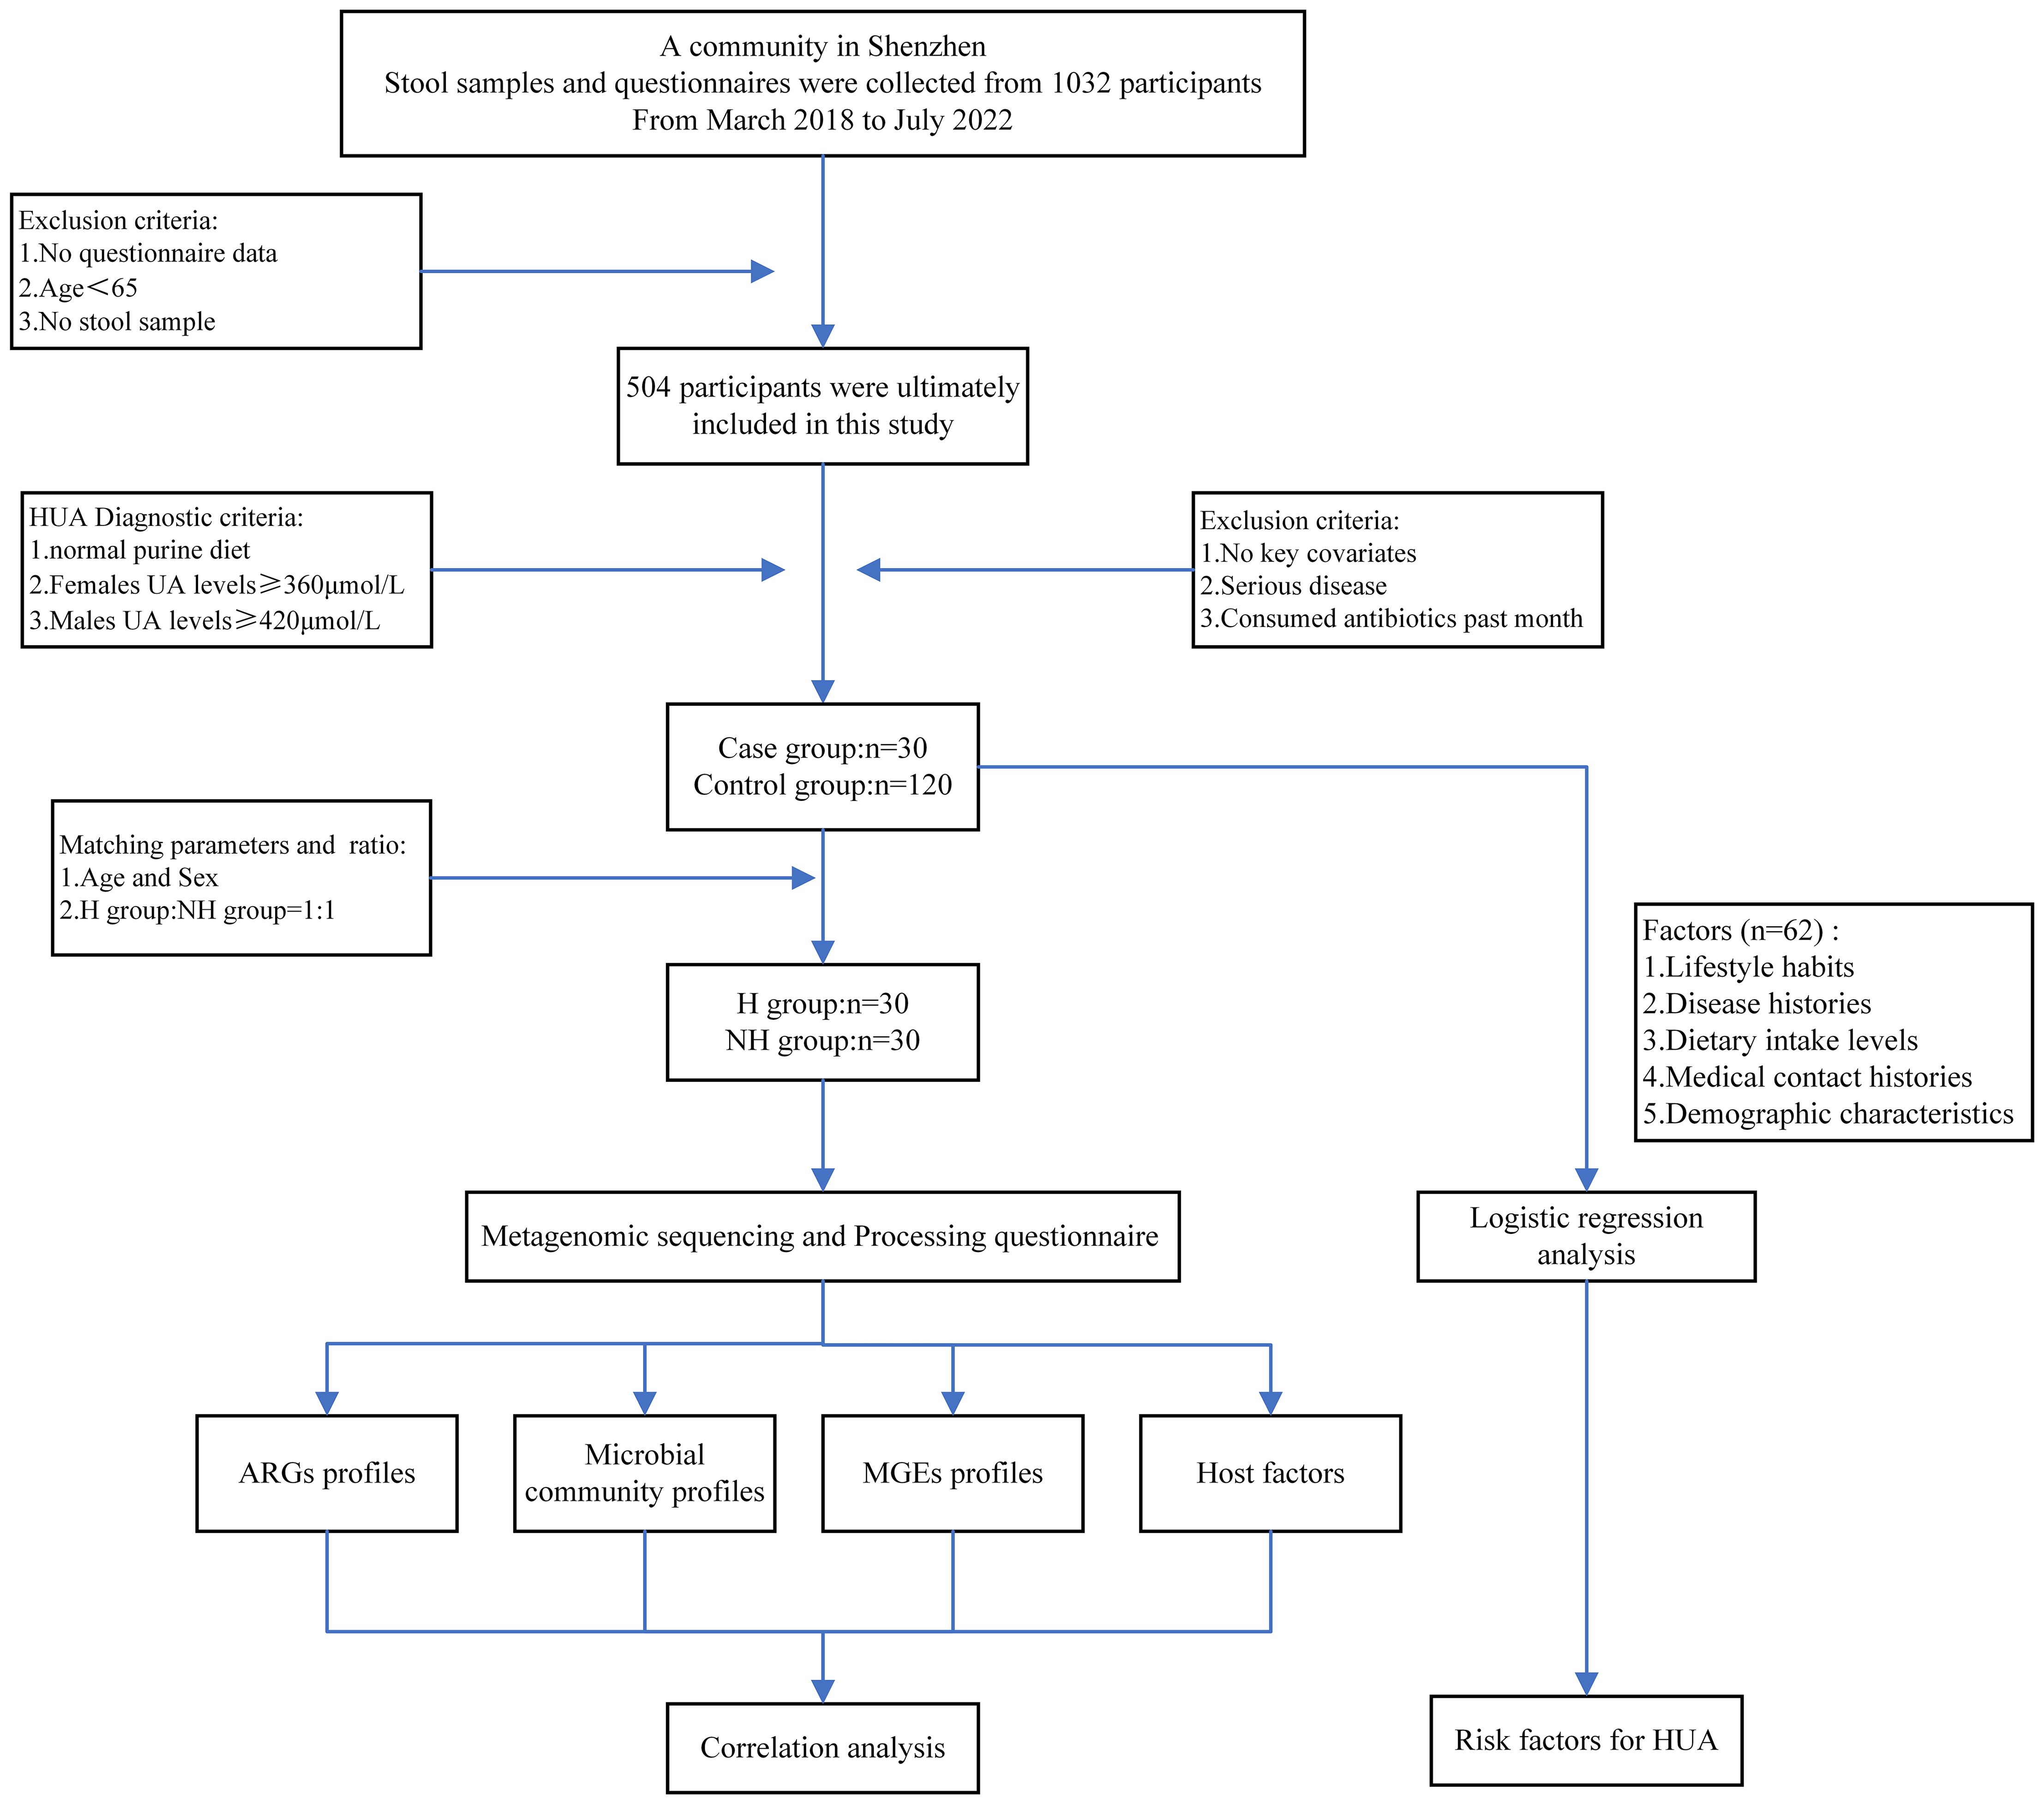
Figure 1 Flowchart of study design.
Following a rigorous diagnostic and exclusion process (Figure 1A), individuals with HUA and non-HUA individuals were divided into a case group (n=30) and a control group (n=120), respectively. A total of 62 factors in 5 main categories were used for univariate analysis (Supplementary Table S1). Significant differences (P < 0.05) were observed between the two groups in terms of drinking juice, keeping pets, exercise, abnormal stool, coarse grain and animal offal. Subsequently, 6 factors were used for multivariant logistic analysis via collinearity-test method for excluding confounders. Finally, drinking juice (OR = 2.271, 95%CI: 2.006~5.087, P = 0.012) and abnormal stool (OR = 4.061, 95%CI: 1.200~13.744, P = 0.024) were risk factors associated with HUA (Figure 2A). The adjusted model showed good fit through the Hosmer-Lemeshow test (χ² = 2.301, P = 0.593), and the receiver operator characteristic (ROC) curve was 0.935 (Figure 2B).
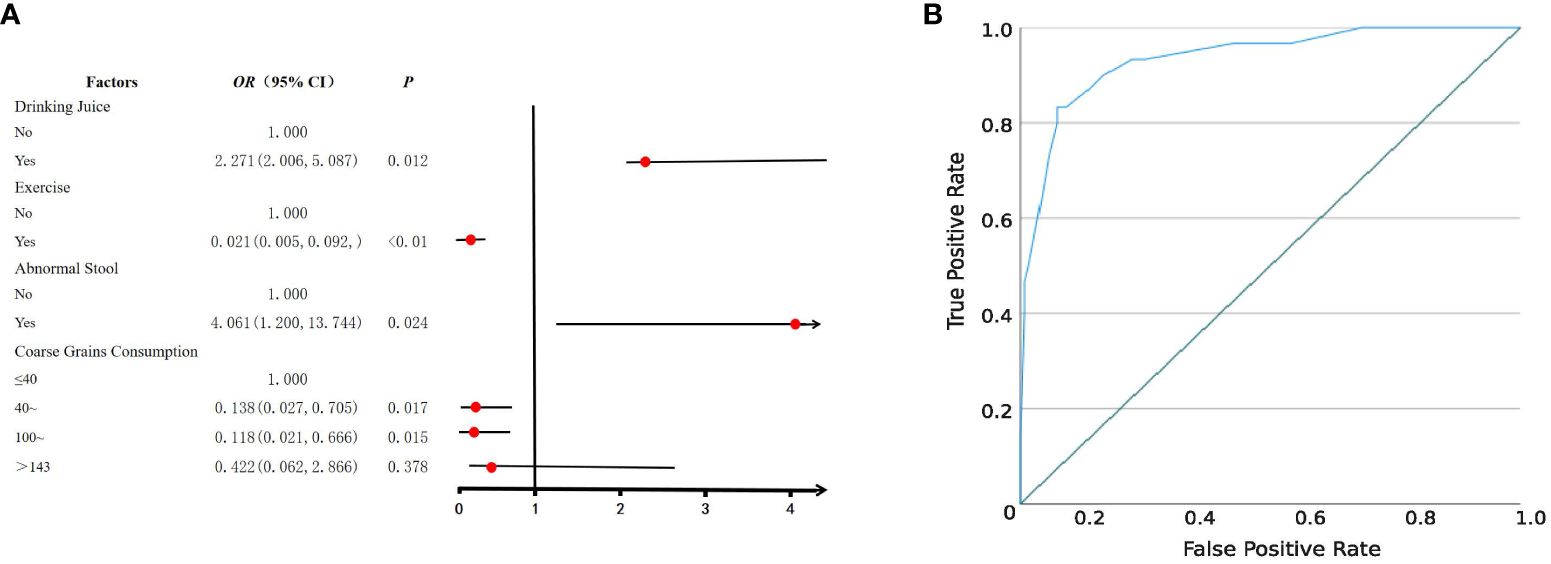
Figure 2 Logistic regression analysis of risk factors for HUA. (A) Forest plot reveals the results of multivariate logistic regression analysis. Red dots represent odds ratios (OR). The error bars represent 95% confidence intervals. After screening through univariate analysis (P < 0.05) and collinearity-test (VIF < 3), drinking juice, keeping pets, exercise, abnormal stool, coarse grain, and animal offal were included in the univariate analysis. (B) The receiver operator characteristic (ROC) curve.
Lachnospiraceae, Bacteroidaceae, and Ruminococcaceae were the predominant bacterial families in both groups (Figure 3A). The relative abundance of Bifidobacteriaceae was higher in the NH group (7.72%) than in the H group (4.48%) (P < 0.001, Z-test). Enterobacteriaceae accounted for 5.04% in the NH group, while it only accounted for 1.83% in the H group (P < 0.001, Z-test). At the genus level, Prevotella constituted 14.50% in the NH group but was not listed among the top 15 genera in the H group. Conversely, Pseudomonas was ranked fourth in the H group but not in the NH group (Figure 3B). These data indicate that the bacterial composition at the genus level in the two groups was distinct.
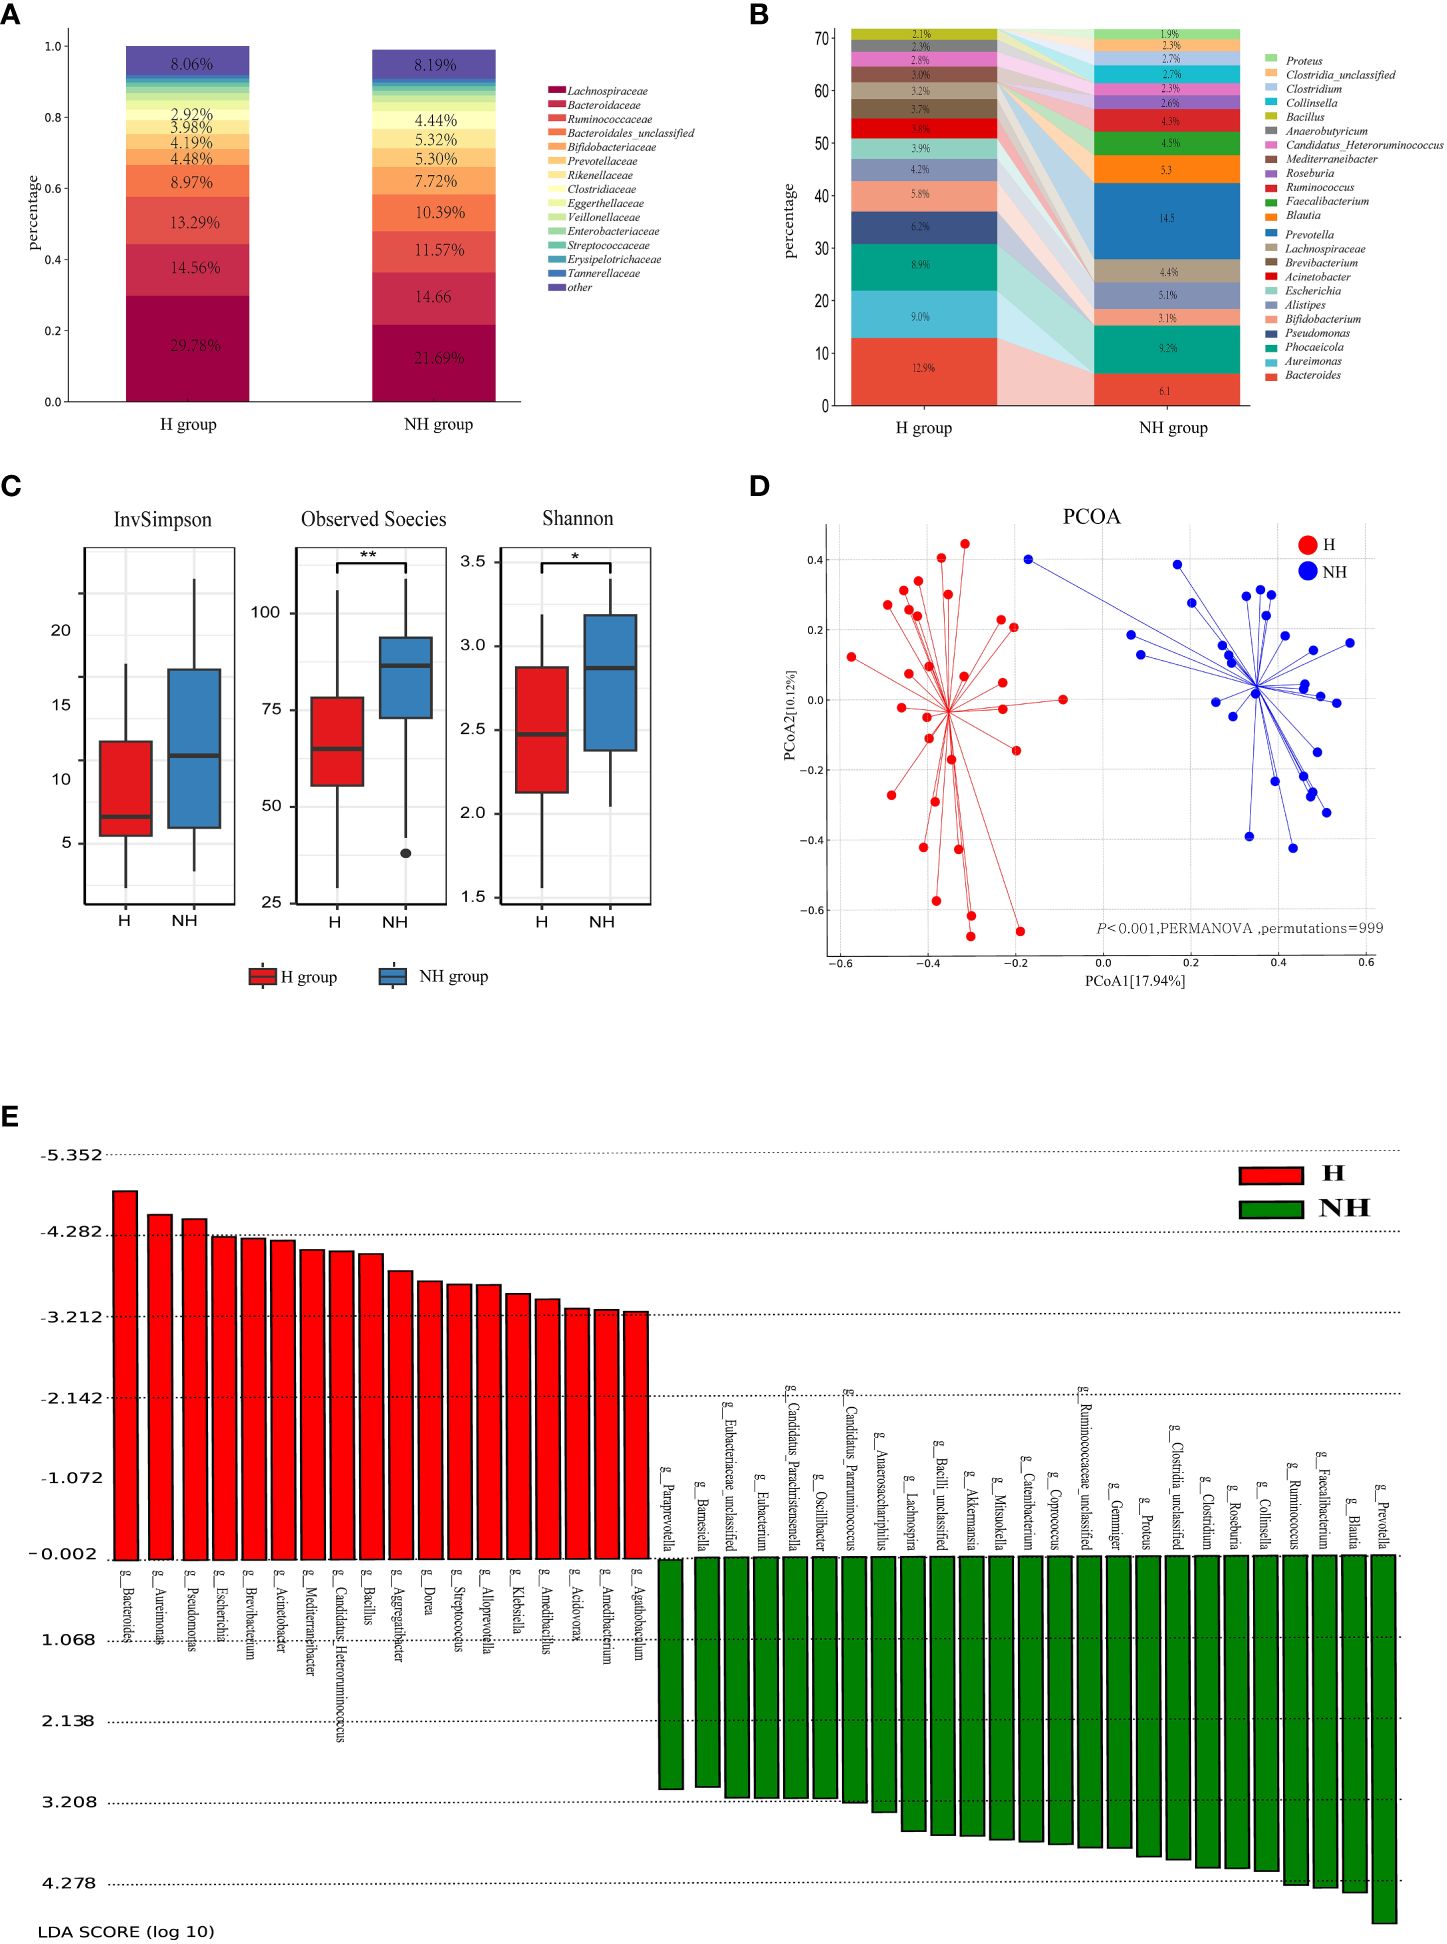
Figure 3 Microbial community profiles between the H group and NH group. (A) Distribution of bacteria between the H group and NH group under family level. The proportion of bacteria less than 2% was categorized into ‘other’. (B) Distribution of the top 15 bacteria between the H group and NH group under genus level. (C) α-diversity. Boxplots show the distribution of data around the median and IQR. P values lower than the threshold for significance (* < 0.05, ** < 0.01) were shown. (D) β-diversity. Analysis was using Bray Curtis distance and test by PERMANOVA (Bray-Curtis, P < 0.05, permutations = 999). (E) Linear discriminant analysis (LDA) effect size (LEfSe) analysis indicating the most differential bacteria between the H group and NH group. (LDA SCORE ≥ 103).
Subsequently, the diversity and similarity of microbial communities at the genus level in the H group and NH group were analysed using α-diversity indices (Shannon, InvSimpson, Observed species) and β-diversity analyses (principal coordinate analysis [PCoA]). The α-diversity in the H group (Shannon: median 2.47, interquartile range [IQR]: 2.08–2.86; Observed species: median 65.00, IQR: 54–77.5) was significantly lower than that in the NH group (Shannon: median 2.87, IQR: 2.34~3.18, P = 0.020, U-test; Observed species: median 86.50, IQR: 69–93.5, P = 0.004, t-test, Figure 3C). Moreover, the microbial community composition between the H and NH groups was significantly different (P < 0.001, permutational multivariate analysis of variance (PERMANOVA), Bray-Curtis; Figure 3D).
To better explore the potential biomarkers for HUA, we employed Linear Discriminant Analysis Effect Size (LEfSe) to identify specific genera between the two groups. The results indicated 20 significantly different bacterial genera between the two groups (Figure 3E). Bacillus, Bacteroides, Escherichia, Klebsiella, Pseudomonas, and Streptococcus were enriched in the H group, whereas Catenibacterium, Clostridium, Collinsella, Coprococcus, Faecalibacterium, Gemmiger, Lactobacillus, Mitsuokella, Prevotella, Roseburia, Ruminococcus, Blautia, Lachnospira, and Proteus were enriched in the NH group.
The entire ARGs in gut was called resistome. A total of 18 ARG types (417 subtypes) and 19 ARG types (406 subtypes) were identified in the H and NH groups, respectively (Figure 4A). In general, 102 ARG subtypes were unique to the H group and 91 to the NH group, and 315 subtypes were shared between the two groups (Supplementary Figure S1). Although there were certain commonalities, the distribution patterns of resistome across samples were not consistent (Supplementary Figure S2). Total abundance of resistome in the H group (median: 1.10, IQR: 0.93–1.76) was significantly higher than that in the NH group (median: 0.76, IQR: 0.52–1.41, P = 0.039, U-test, Figure 4B). Specifically, the abundance of tetracycline resistance genes in the H group (median: 0.46, IQR: 0.33–0.65) was significantly higher than in the NH group (median: 0.20, IQR: 0.15–0.37, P < 0.001, U-test). Similarly, vancomycin resistance genes in the H group (median: 0.03, IQR: 0.02–0.05) was significantly higher than in the NH group (median: 0.01, IQR: 0.004–0.02, P < 0.001, U-test, Figure 4B). Furthermore, tetracycline resistance genes were the predominant ARGs, comprising 31.66% and 18.18% in the H and NH groups, respectively (Supplementary Figure S3).
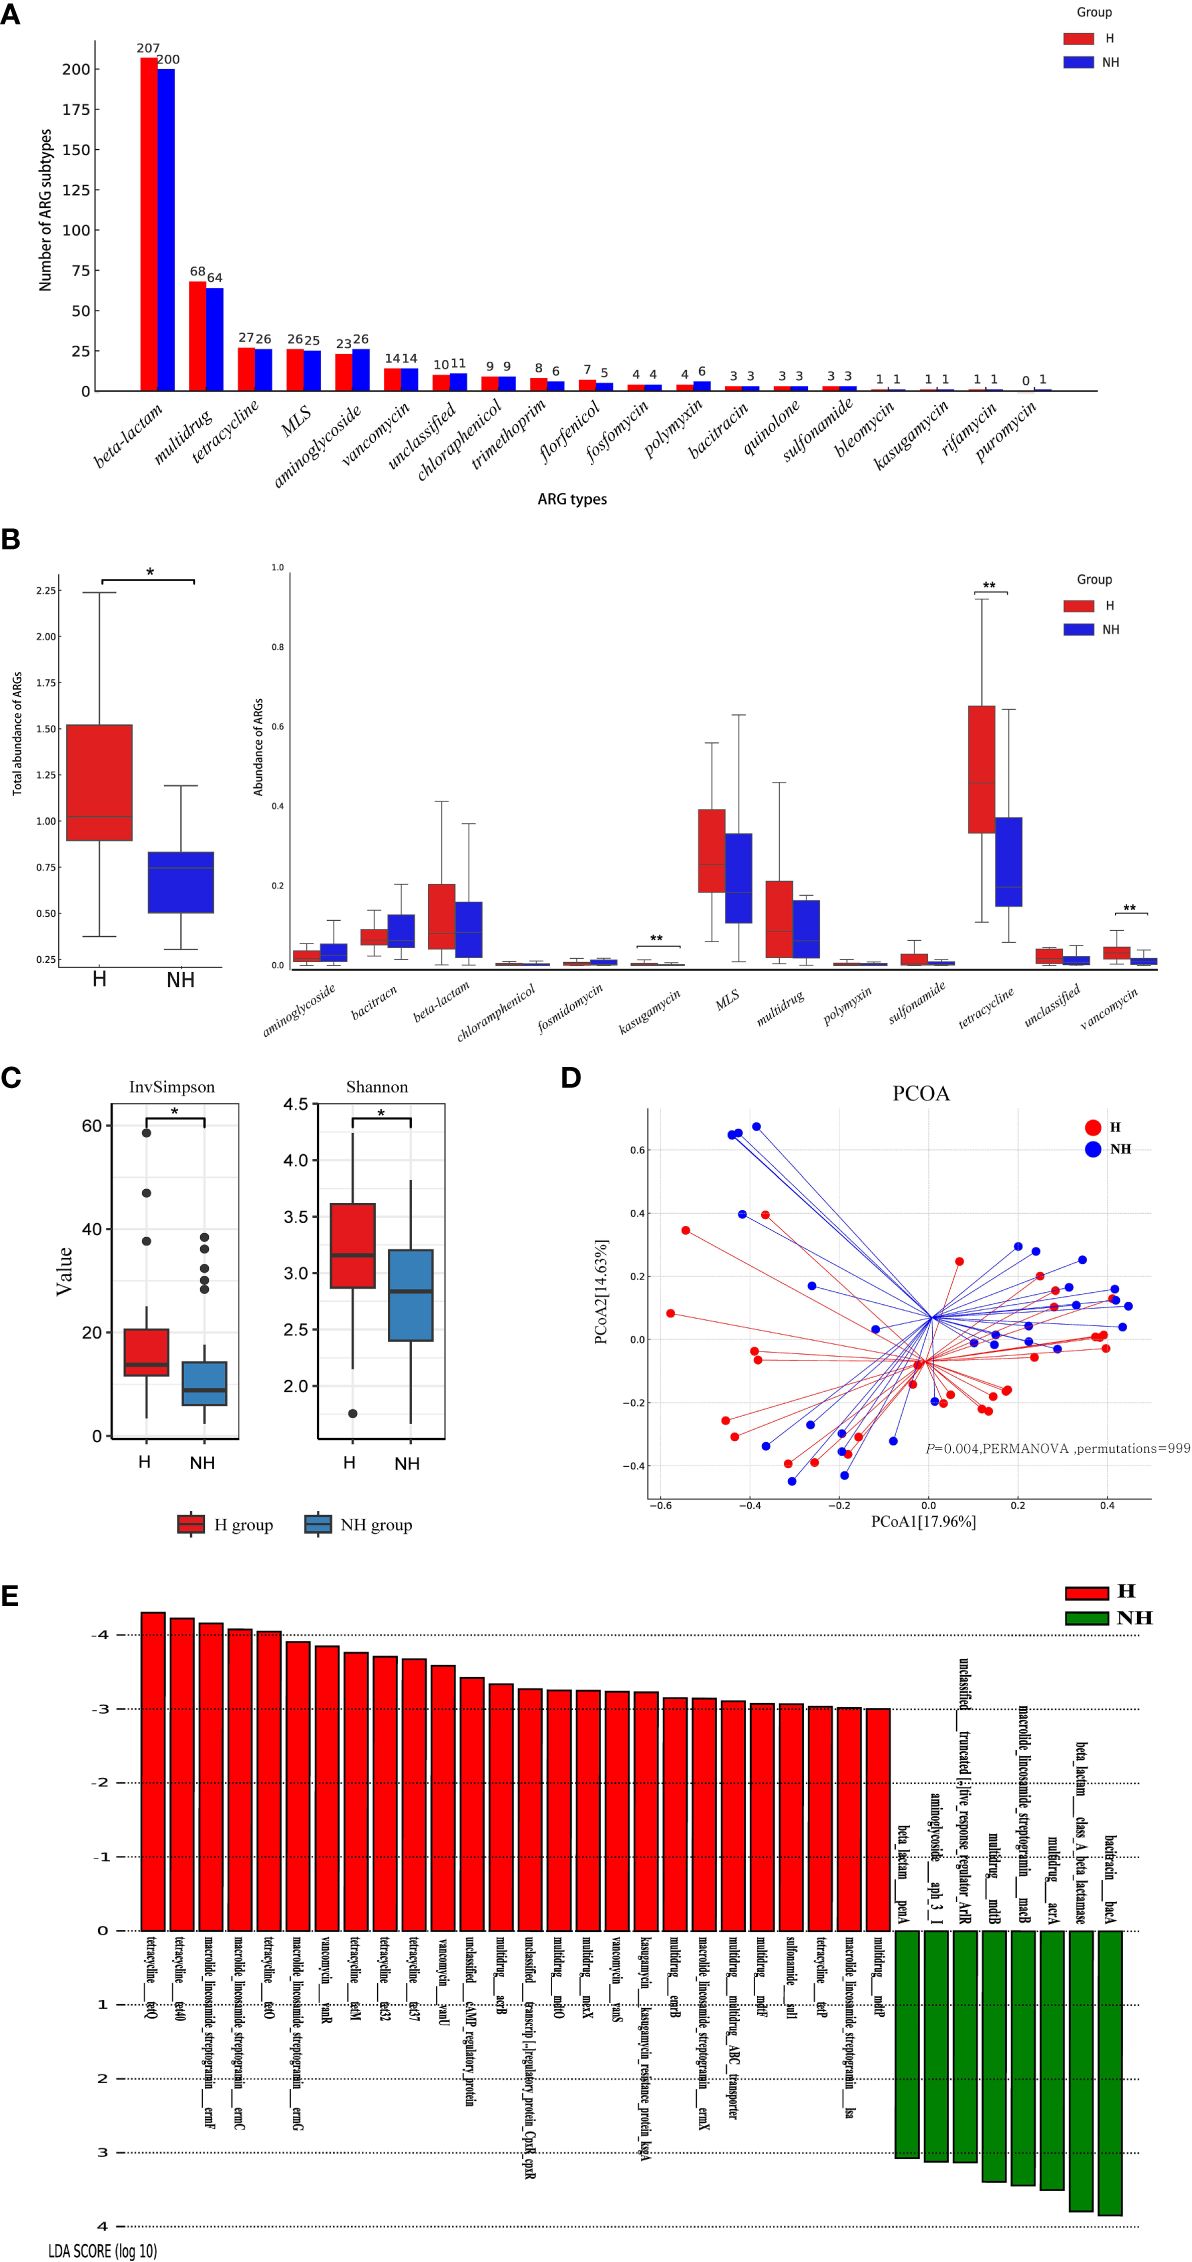
Figure 4 Composition, diversity and specificity of ARGs between the H group and NH group. (A) Number of ARG types and subtypes. The horizontal axis represents ARG types, and the vertical axis represents ARG subtypes. (B) Abundance of ARG types. Boxplots show the distribution of data around the median and IQR. P values lower than the threshold for significance (* < 0.05, ** < 0.01) were shown. (C) α-diversity. (D) β-diversity. Analysis was using Bray Curtis distance and test by PERMANOVA (Bray Curtis, P = 0.004, permutations = 999). (E) LEfSe analysis indicating the most differential ARGs between the H group and NH group (LDA SCORE ≥ 103). MLS, Macrolide-Lincosamide-Streptogramin.
We further analysed diversity of resistome between two groups using α-diversity and β-diversity. The α-diversity was significantly greater in the H group (Shannon, median: 3.13, IQR: 2.83–3.62; InvSimpson, median: 13.47, IQR: 11.47–20.67) than that in NH group (Shannon, median: 2.80, IQR: 2.37–3.20, P = 0.030, t-test; InvSimpson, median: 8.37, IQR: 6.51–22.98, P = 0.040, U-test, Figure 4C). Furthermore, different compositions of resistome were observed between the two groups (P = 0.004, PERMANOVA, permutations = 999, Figure 4D).
LEfSe was used to explore the specific differences in ARG subtypes between the two groups. The results showed that 25 and 8 ARG subtypes were significantly enriched in the H and NH groups, respectively (Figure 4E). Specifically, tetracycline resistance genes (tetQ, tet40, tetO, tetM, tet32, tet37, and tetP), macrolide-lincosamide-streptogramin (MLS) resistance genes (ermF, ermC, ermG, ermX, and lsa), vancomycin resistance genes (vanR, vanU and vanS), and several multidrug resistance genes were significantly present in the H group (Figure 4E).
More ARGs associated with potential pathogens in hyperuriacaemic individuals.
A total of 9,265 assembled contigs carrying ARGs was obtained from all metagenomics data, in which the 3,957 and 3,835 ARG subtypes were identified in the H and NH group, respectively, after excluding 1,474 contigs without exactly genus information (Supplementary Table S2). We further determined the ARGs subtypes in selected six potential pathogens and six non-pathogens that associated with HUA from LEfSe analysis. Total of non-duplicated ARG subtypes in potential pathogens in genus level including Klebsiella, Escherichia, Bacteroides, Streptococcus, Pseudomonas, and Bacillus possessed higher number in H group than those in NH group (175 vs. 147) (Figure 5A), and similar and opposite results were found in non-assembly data (128 in H group vs. 47 in NH group) (Supplementary Figure S4) and non-pathogens including Prevotella, Ruminococcus, Blautia, Roseburia, Lachnospira,and Alistipe (35 in H group vs. 47 in NH group) (Figure 5B).
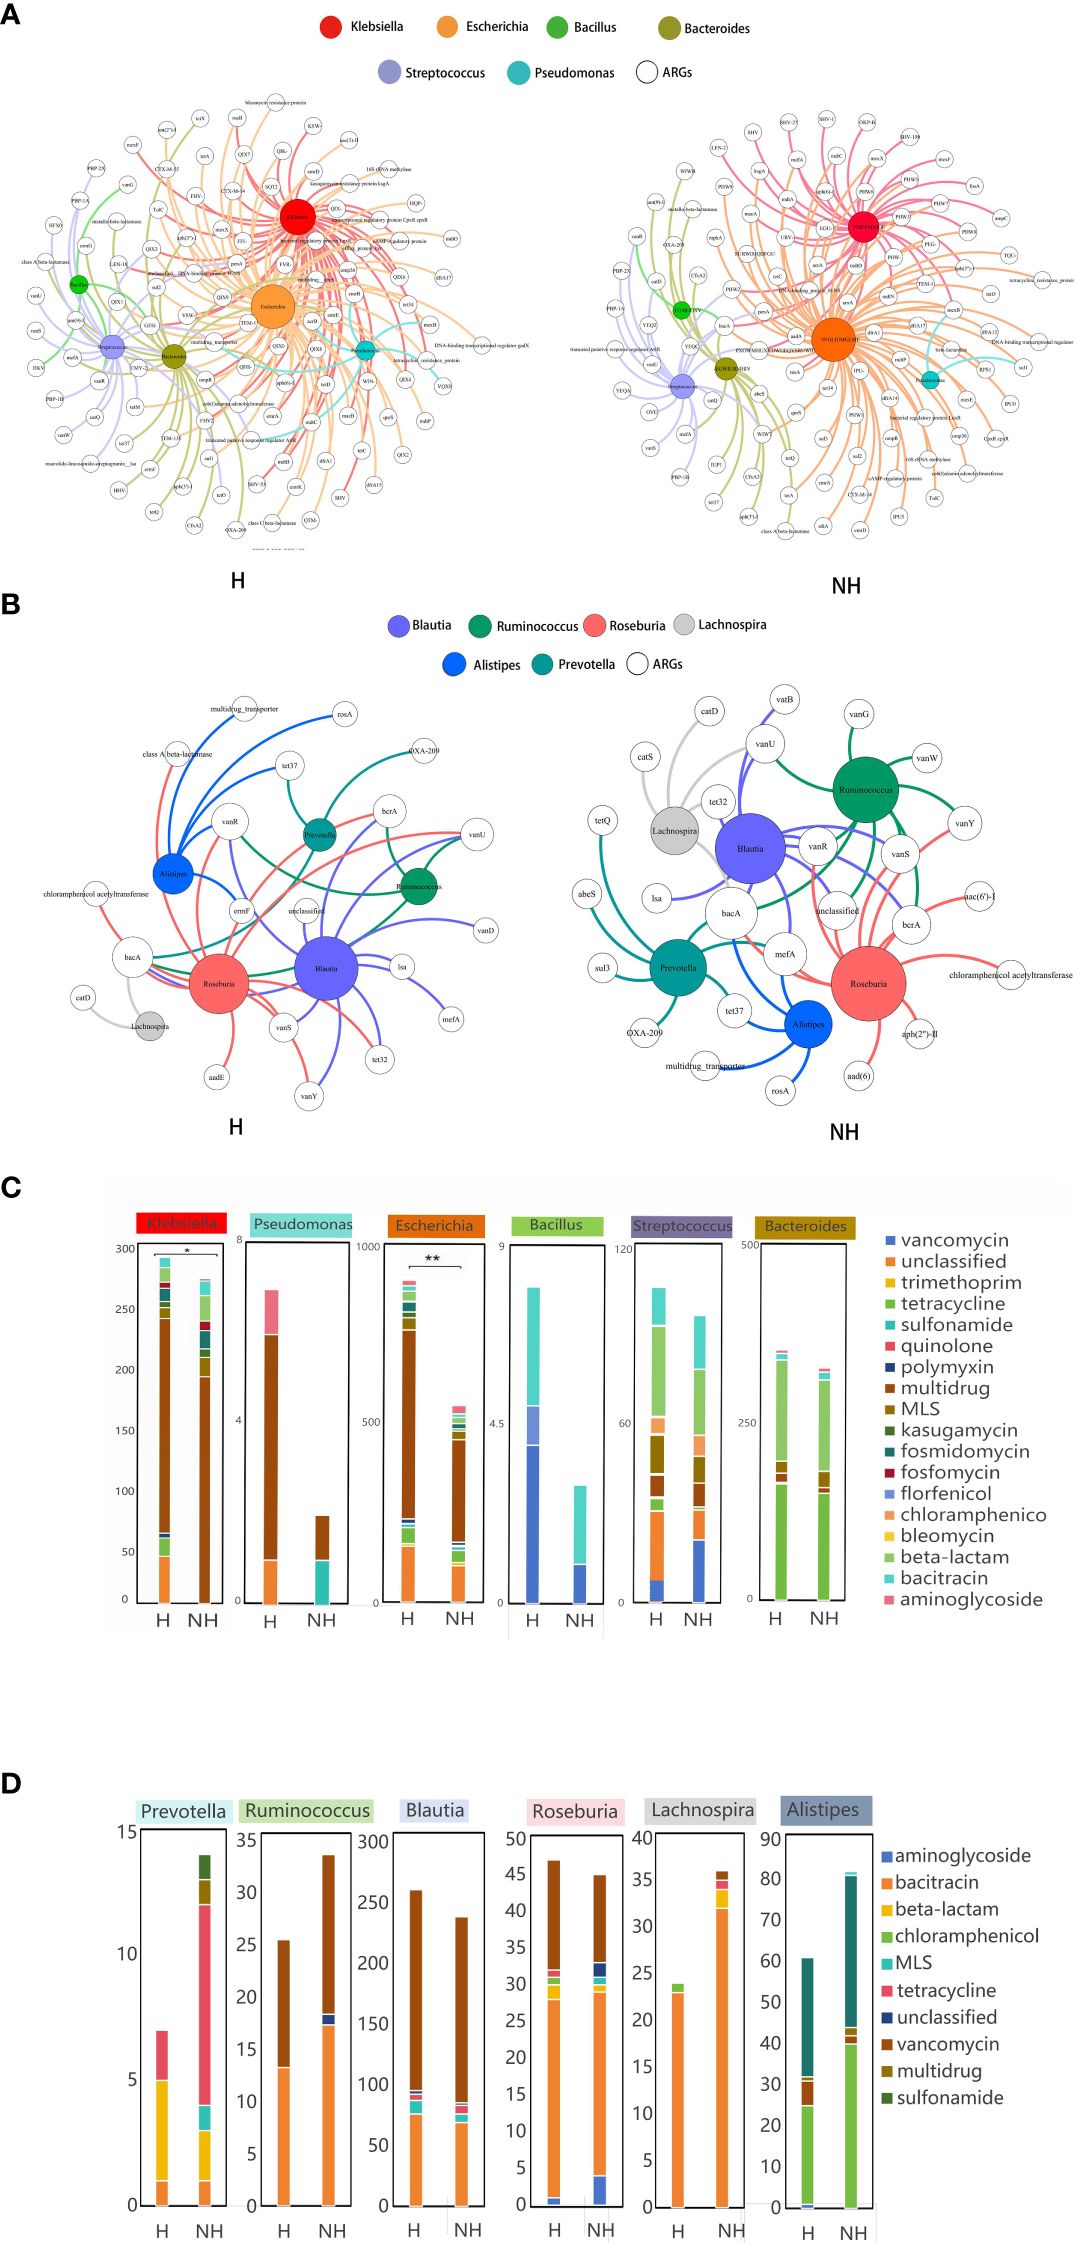
Figure 5 Host distribution of ARGs based on assembly contigs. (A) Network analysis between ARGs and potential pathogens based on assembly contigs. (B) Network analysis between ARGs and non-pathogens based on assembly contigs. (C) The distribution of the number of ARG subtypes in potential pathogens. (D) The distribution of the number of ARG subtypes in non-pathogens. P values lower than the threshold for significance (* < 0.05, ** < 0.01) were shown.
Furthermore, we also determined the number of ARG subtypes in pathogens and non-pathogens in H and NH group. We found that all pathogens in H group harbour significant higher number of ARG subtypes than those in NH group, especially in Escherichia genus (899 Vs. 550, P < 0.01, Z-test) (Figure 5C). However, the number of ARG subtypes in non-pathogens in H group was similar or lower than those in NH group (Figure 5D). In addition, multi-drug resistance genes were likely appeared in Escherichia, and the florfenicol resistance genes were found only in Bacillus in the H group. Above data indicates that potential pathogens harbour a greater diversity and number of ARGs in HUA individuals.
We further revealed that the ARG number (ρ = 0.358, P = 0.005), Shannon index (ρ = 0.24, P < 0.001) and InvSimpson index (ρ = 0.333, P = 0.010) were significantly correlated with the UA levels; however, they were negatively correlated with gut microbiota (Figure 6A). Procrustes analysis demonstrated a strong consistency of ARGs and gut microbiota in the H group (M2 = 0.534, P = 0.001, permutations = 999), but not in the NH group (M2 = 0.977, P = 0.001, permutations = 999, Figure 6B).
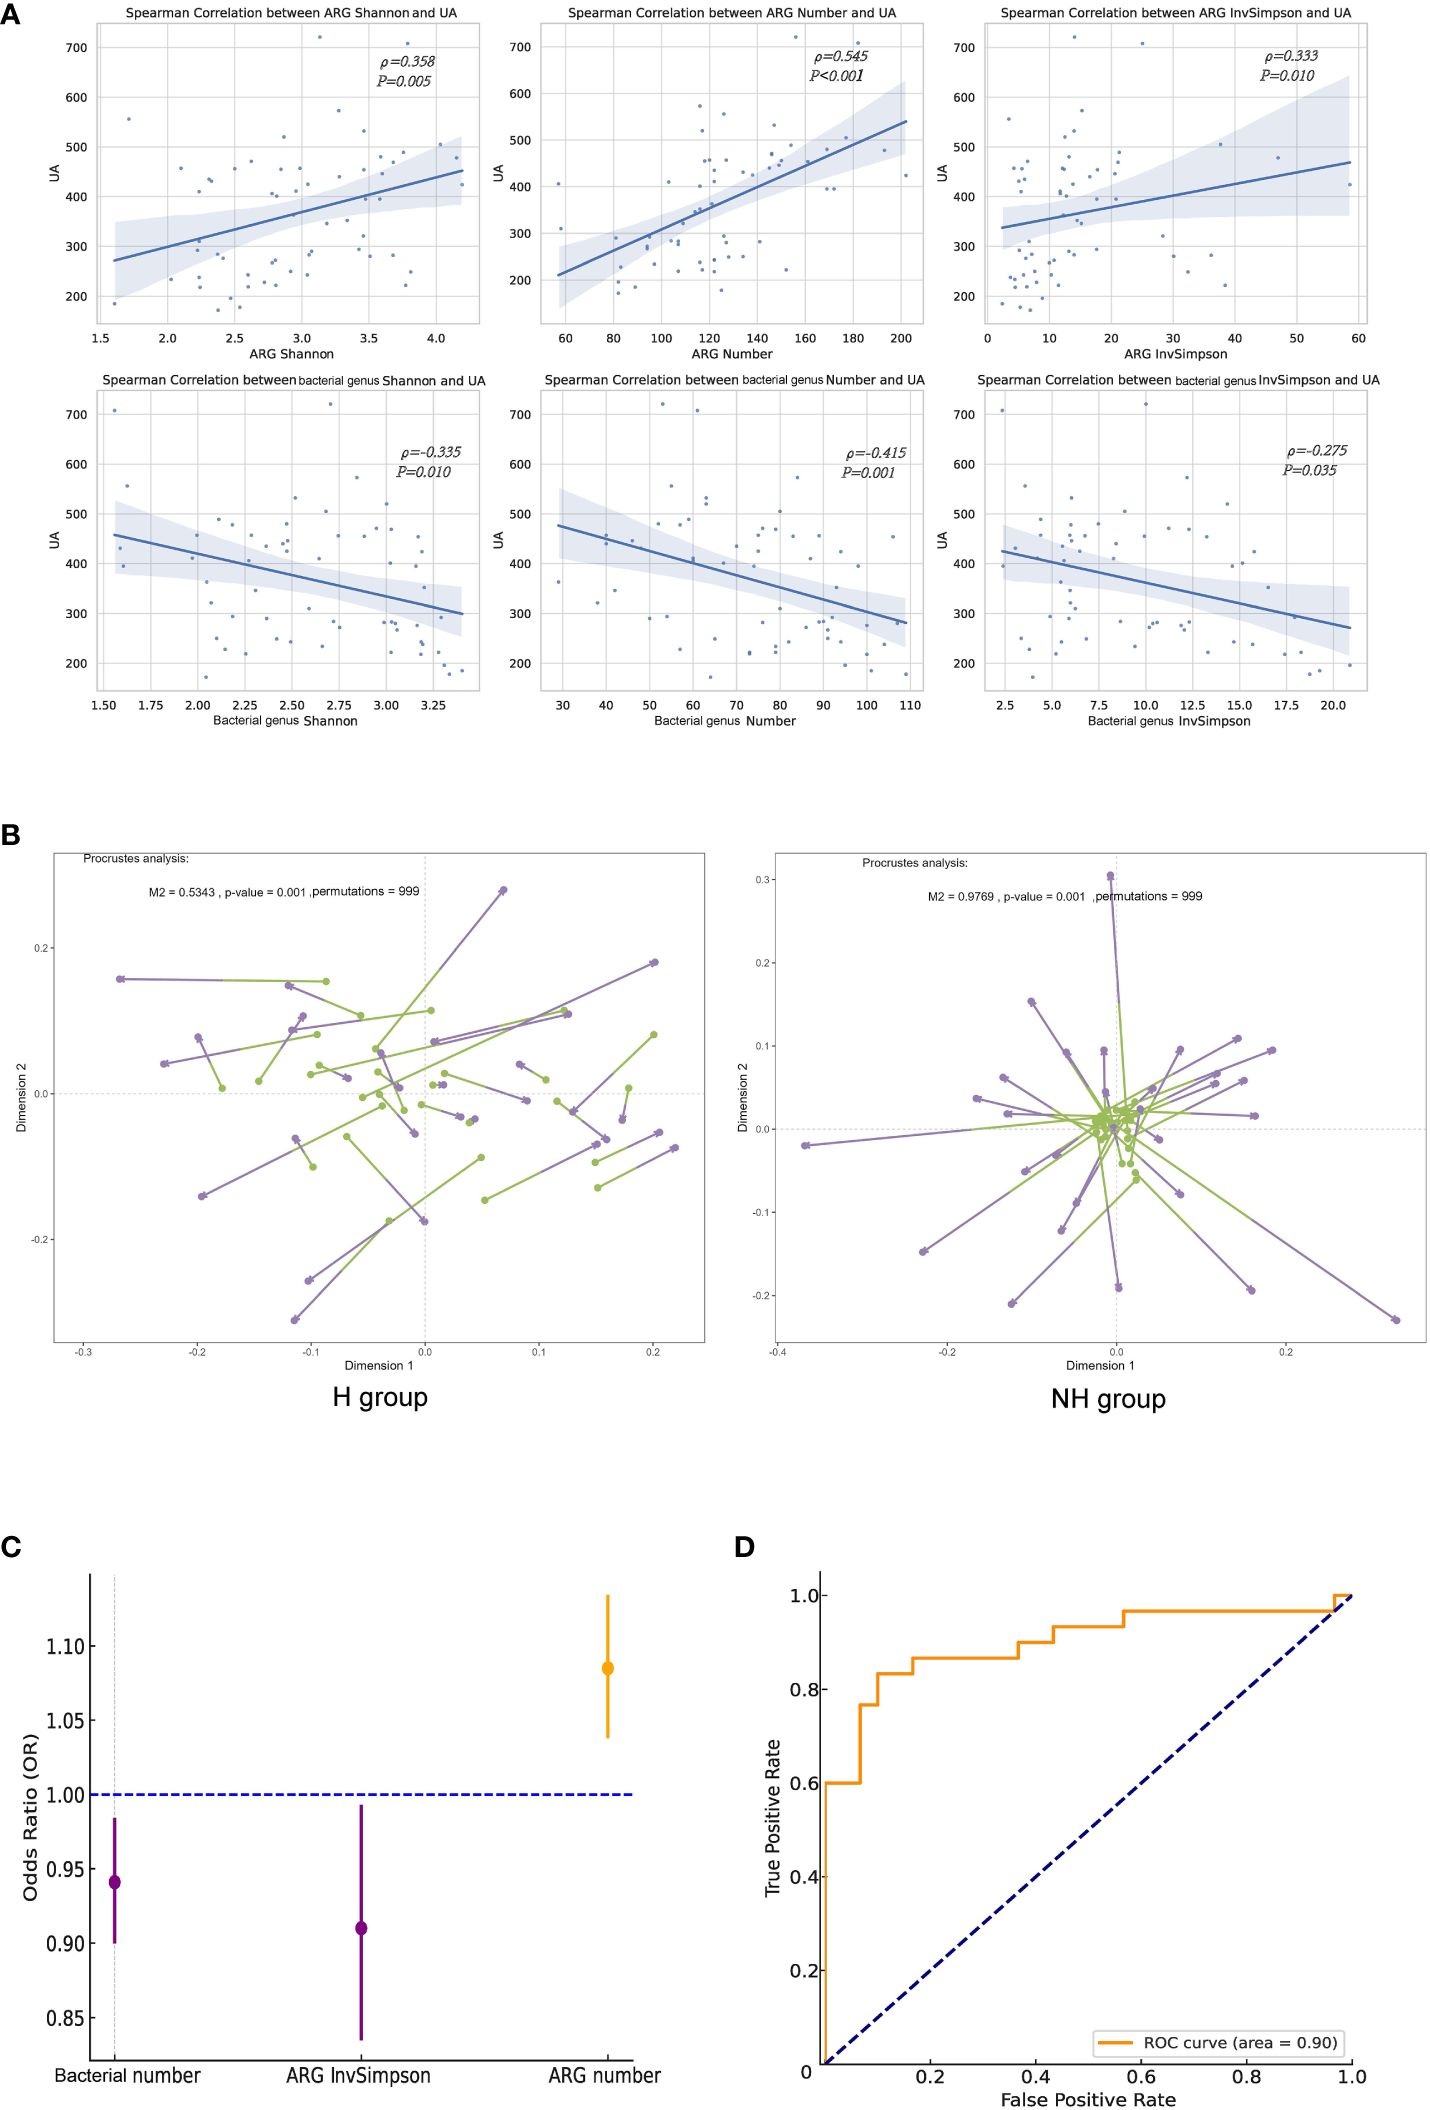
Figure 6 Correlation analyses between ARGs and UA. (A) Spearman correlation analysis. (B) Procrustes analysis. Longer lines between two dots indicate greater discordance between microbials and ARGs. Significant correlations (999 permutations) were detected in all comparisons. (C) Forest plot. The error bars represent 95% confidence intervals. (D) The ROC curve.
Logistic regression analysis was performed to investigate the association between the ARGs and HUA. After excluding collinearity factors, age, sex, BMI, education, household income, exercise, basal metabolic rate (BMR), gut bacterial indicators (Shannon, number, and InvSimpson), and ARG indicators (Shannon, number, and InvSimpson) were included in our model using a forward selection method. We found that ARG number (OR = 1.090, 95%CI: 1.04–1.13, P < 0.001) and ARG InvSimpson (OR = 0.910, 95%CI: 0.836–0.992, P = 0.031)/gut bacterial number (OR = 0.941, 95%CI: 0.901–0.983, P = 0.006) were positively and negatively associated with HUA, respectively (iterated three times, Figure 6C). The goodness and reliability of this model were confirmed using the Hosmer–Lemeshow test (χ² = 8.586, P = 0.378 > 0.05) and diagnostic receiver operating characteristic (ROC) curve area (0.900) to be satisfactory after adjustment, as evidenced by and the combined with 0.900 value (Figure 6D).
We included 5 demographic factors, 5 physiological factors, and 20 dietary intake levels to investigate the potential factors that may affect the differences in ARGs between the two groups. In total, 10 factors (8 of the 10 factors were associated with dietary consumption) were found to be significantly associated with the ARGs (Figure 7A). Pork consumption had the highest explanatory power (R² = 0.04, PERMANOVA, P = 0.014). We conducted a similar separate analysis for the H and NH groups. Our data showed more factors contributing to the effects on the ARGs in the H group (eight in the H group and three in the NH group) (Supplementary Figure S5), especially diet-related factors, associated with the ARGs in HUA individuals, indicating a higher complexity.
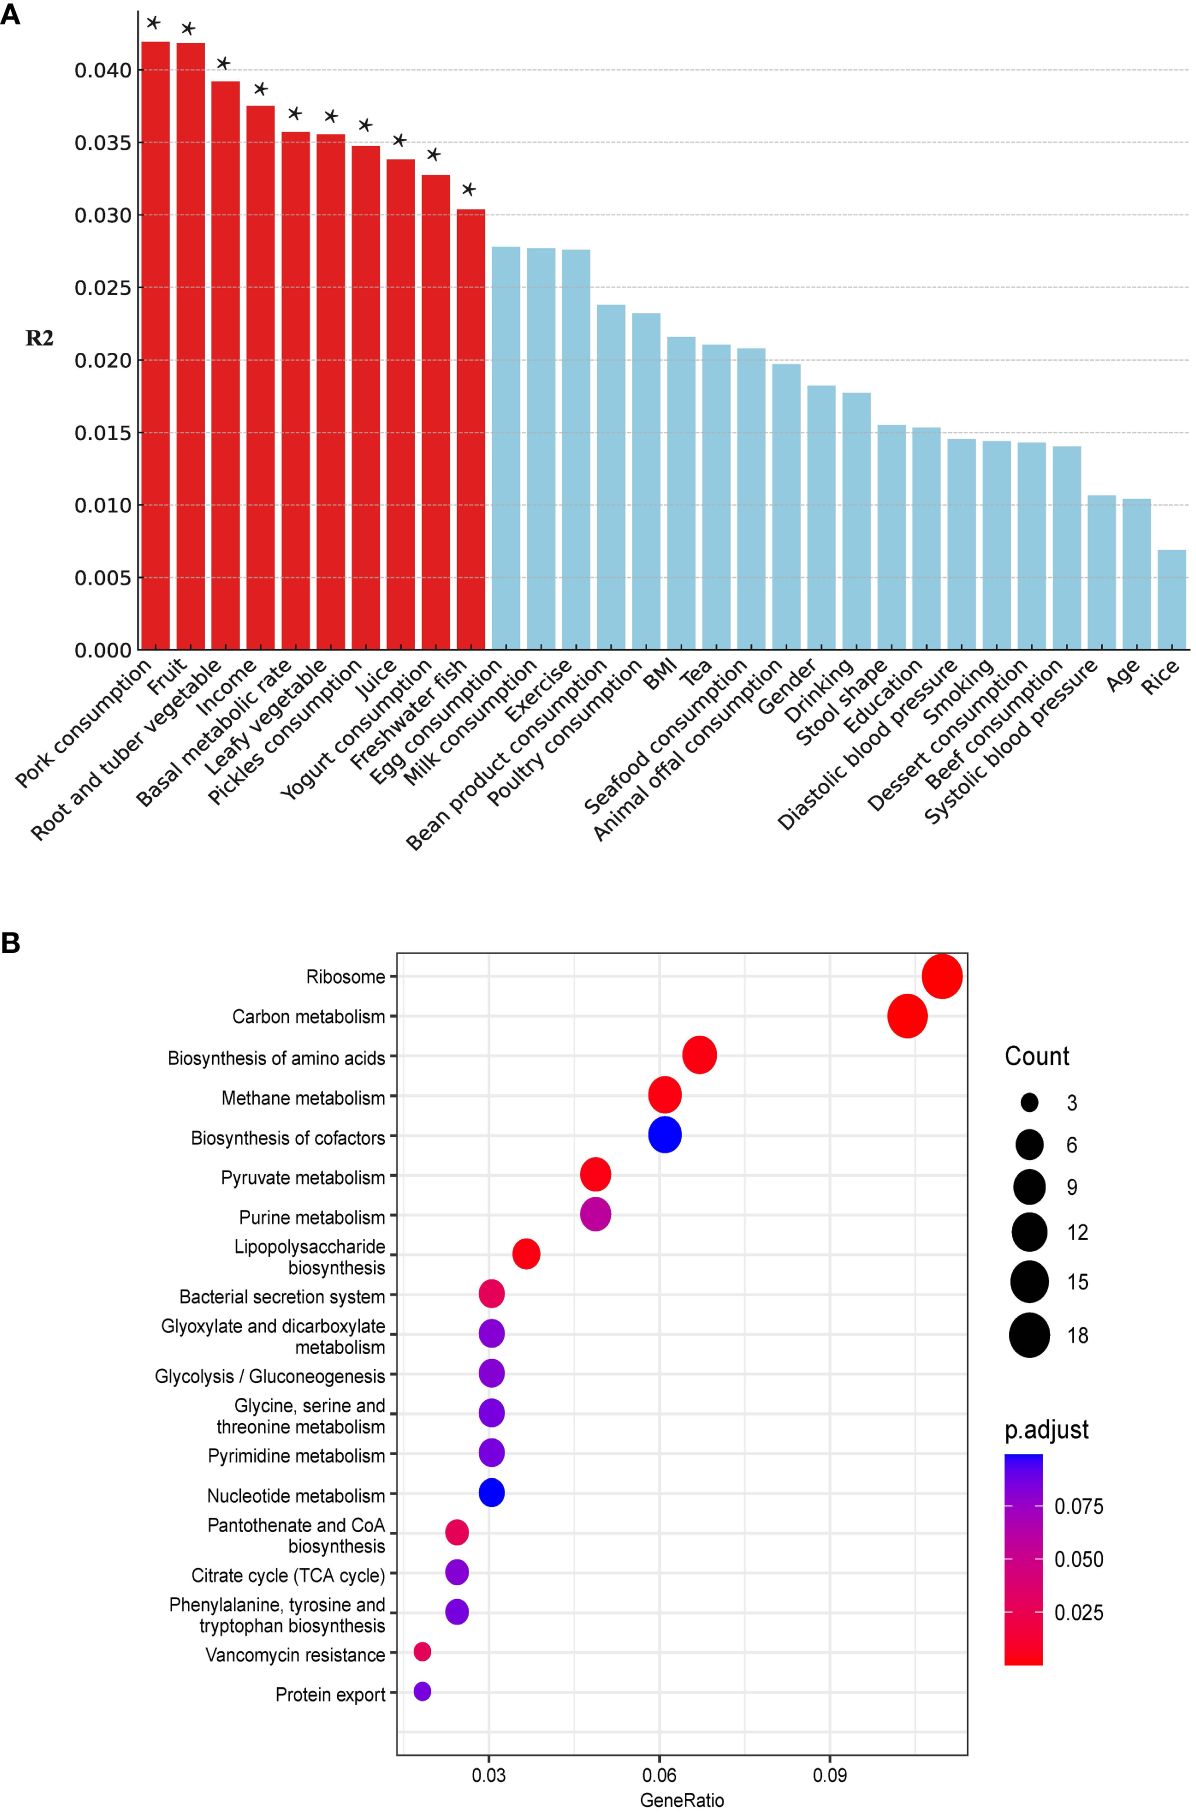
Figure 7 Host associated factors on gut resistome. (A) Effect size of host factors on gut resistome were calculated by PERMANOVA (permutations = 999). P values lower than the threshold for significance (* < 0.05) were represented as red bars. (B) Differential pathways between the H and NH groups. The horizontal axis ‘GeneRatio’ represents the proportion of different genes within a given pathway relative to the total number of different genes. The p.adjust values are Bonferroni-corrected p-values, indicating the statistical significance of the enrichment. The size of the circles correlates with the count of different genes associated with corresponding pathway.
Kyoto Encyclopaedia of Genes and Genomes (KEGG) pathway analysis revealed differentially enriched genes between the two groups and indicated different microbial compositions and metabolic functions between the two groups (H vs. NH, Figure 7B). The differentially genes between the H and NH groups were found to be enriched in pathways related to ARGs, amino acid biosynthesis and metabolism, phenylalanine, tyrosine, tryptophan biosynthesis, and energy metabolism. This emphasizes the differences in microbial composition between the H and NH groups, particularly in functions related to inflammation, immune response, bacterial secretion, and protein export. All these suggest that the microbiota in H group was prone to possess the higher ability of colonisation and pathogenesis in gut.
We further analysed virulence-associated genes in these two groups and identified 2682 and 2705 VGs in the H and NH groups, respectively (Supplementary Figure S6). Genes related to adherence (P < 0.001, U-test), antimicrobial activity/competitive advantage (P < 0.001, U-test), and exoenzymes (P < 0.001, U-test) were significantly upregulated in the H group (Supplementary Figure S7). This finding further confirmed our observations in KEGG analyses.
The analysis of risk factors for HUA revealed that drinking juice is one of the risk factors, while exercise and moderate coarse grains are protective factors. These findings are consistent with conclusions drawn from existing literature, highlighting the significant impact of dietary structure and exercise on the occurrence of HUA in elderly individuals (Ashida et al., 2015; Danve et al., 2021). Additionally, this study identified for the first time that abnormal stool was the risk factors for HUA. Abnormal stool characteristics partially reflect the intestinal condition of the subjects, which is closely related to the gut microbiota and indicates a possible dysbiosis of microbiota.
Recent studies have highlighted a link between ARGs and various chronic diseases, including diabetes, cirrhosis, and chronic kidney disease (Shamsaddini et al., 2021; Pan et al., 2022; Shuai et al., 2022). A previous study found that gut microbial diversity was negatively correlated with HUA; however, the gut resistome was not investigated (Yang et al., 2021). One study indicated that patients with HUA and with high UA levels have a weakened immune system and are potentially susceptible to pathogenic infections (Yu et al., 2023). Notably, our study found that elderly individuals with HUA had a higher abundance of ARGs in their gut than those without HUA. Furthermore, the abundance of ARGs in individuals with HUA was positively correlated with UA levels and the incidence of HUA. As the resistome in the gut microbiota is considered an atypical chronic disease, a higher abundance of the resistome increases the risk to human health. However, as the number of elderly individuals with HUA increases annually, health risks and socioeconomic burdens become more severe (Maresova et al., 2019). One study discovered that the burden of ARGs increases with human ageing (Tavella et al., 2021). Hence, more attention should be given to elderly individuals with HUA and higher resistome abundance to find an effective way of reducing resistome abundance and associated pathogens in the human gut.
The study identified 20 different species in the two groups, with Bacillus, Bacteroides, Escherichia, and Klebsiella being enriched in group H. Uricase, which is responsible for converting purines into urea and UA, is abundant in Bacillus (DeBosch et al., 2014). Escherichia secretes the key enzyme, xanthine dehydrogenase (XDH), which is crucial for purine oxidative metabolism (Wang et al., 2017). Our study corroborates the findings of a hospital population study, which revealed a significant reduction in gut microbial diversity in patients with HUA, accompanied by a notable increase in Bacteroides and a decrease in Ruminococcaceae (Liang et al., 2022). In the NH group, bacteria such as Lactobacillus and Clostridium were enriched. Lactobacillus is known to absorb and utilise purines, thereby reducing the intestinal absorption of dietary purines and lowering serum UA levels (Yamada et al., 2016). Additionally, Clostridium has been associated with UA decomposition (Yu et al., 2018). The core microbiome of HUA may be related to the gut microbiota, which is enriched in purine metabolism-related proteins, and Bacteroides is an important component (Liu et al., 2023). A close relationship between Klebsiella and elevated UA levels has been revealed (Yang et al., 2021). Our data on the composition of the gut microbiome in individuals were consistent with the findings of previous studies. Emphasis should be placed on the fact that Aureimonas, a common human opportunistic pathogen in the environment (Becker et al., 2022), was enriched in HUA individuals in this study; however, the relationship between Aureimonas and HUA remains unclear. A recent study found that hippuric acid derived from Alistipes indistinctus promotes intestinal UA excretion to alleviate HUA (Xu et al., 2024). In our study, we also observed that the total relative abundance of Alistipes in the H group (126.94) was lower than that in the NH group (150.96). Our results indicated a potential increase in the diversity, number and abundance of ARGs in the gut microbiota of patients with HUA. In addition, bacteria associated with HUA may have elevated levels of these ARGs. Furthermore, Procrustes analysis and logistic regression revealed a synergy between the diversity of ARGs and bacterial populations, which might collectively be associated with UA levels and the occurrence of HUA.
Pork consumption was the predominant factor associated with the gut resistome in individuals with HUA. This may be attributed to Guangdong being one of the largest pork-consuming regions in China. One study revealed high concentrations of tetracycline resistance genes in water samples from the coastal areas of Guangdong (Xu et al., 2019), whereas another revealed high concentrations of multidrug resistance genes in chicken and pork from Guangdong retail markets (Zhang et al., 2018). In the present study, tetracycline and multidrug ARGs were the most abundant subtypes. The above evidence suggests that water, meat, and human guts in Guangdong Province are contaminated with higher ARGs. Separate analyses of the H and NH groups indicated that the factors influencing gut ARGs composition differed under varying HUA conditions. In individuals with HUA, the influencing factors were primarily sex, dietary habits (including juice, rice, and vegetables), and education level. In contrast, in individuals without HUA, the influencing factors were limited to dietary habits, specifically fat consumption and diversity. These results indicate that lifestyle habits and personal characteristics of the subjects could be external factors affecting the variation in their gut ARG composition.
Pathway analysis revealed that in individuals with HUA, genes of the gut microbiota were enriched in inflammation, immunity, and bacterial survival, including vancomycin resistance, lipopolysaccharide biosynthesis, bacterial secretion system, and amino acid metabolism. This aligns with the higher abundance of genes related to adherence, antimicrobial activity, and exoenzymes in individuals with HUA. Additionally, the more complex relationship between MGEs and ARGs/microbes in individuals with HUA indicated a higher frequency of ARGs transmission in these individuals. These data suggest that the microbiota of individuals is associated with higher antimicrobial resistance and pathogenicity, which may increase the risk to human health. Combined with our findings, dietary habits may vary the composition of the gut microbiota and reconstruct the gut resistome, resulting in an imbalance of microbiota with the excretion of UA and potentially raising UA levels, which may initiate or exacerbate HUA.
Our study has some limitations. First, we focused exclusively on the elderly population, which may not be a representative of the entire population. Second, as an observational study, our findings establish a correlation rather than causality; further studies are required to elucidate the causal relationships.
Our study offers a comprehensive overview of the gut AMR in the elderly population and presents novel insights into the relationship between AMR and HUA. It also suggests a positive association between the gut AMR and host-associated factors. These findings highlight that individuals with HUA possess a higher risk of AMR, and potential intervention approaches are needed to be applied to reduce AMR in HUA individuals gut based on significant host-associated factors.
A flowchart of the study design is shown in Figure 1. A total of 1,032 volunteers were recruited through advertising posters and face-to-face introductions in a large community in Shenzhen City from March 1st 2018 to July 31st 2022. Each volunteer was assigned a unique number to avoid duplicate enrolment. Subsequently, participants provided stool samples and completed a questionnaire. Individual consent forms were translated into Mandarin, and consent was obtained from all volunteers. We did not recruit volunteers for whom consent could not be obtained. All participants retained the right to withdraw from the study at any stage.
Given the study’s focus on elderly people; we applied the following exclusion criteria: age less than 65 years, absence of stool samples, and lack of questionnaire data. After exclusion, 504 participants were included in this study. Subsequently, subjects were included based on HUA diagnostic criteria: 1) a normal purine diet, 2) blood uric acid (UA) levels exceeding 360 μmol/L for females and 420 μmol/L for males, respectively (Luo et al., 2022). We also excluded individuals who were missing key covariate data such as age, gender, BMI, smoking status, alcohol consumption, education level, and income level, and also who had serious illnesses like other gastrointestinal disorders, HIV, or cancer and consumed antibiotics within the past month. Finally, 30 participants with HUA were included in the case group. A matching ratio of 1:4 was used to randomly select participants (n = 120, 1:4) without HUA as the control group. After 1:1 matching by age and sex, the 30 participants in the case group and the 120 participants in the control group were respectively divided into the H group and the NH group for subsequent analysis.
Demographics, lifestyle, medical history, and physical activity data were collected using a questionnaire. Participants’ habitual dietary intake was assessed using a food frequency questionnaire that recorded their food consumption over a week. Trained nurses from the community health centre measured the weight, height, waist circumference, hip circumference, and blood pressure. All data were entered using EpiData Version 3.1 with a double-entry method.
All stool samples were placed in a low-temperature transportation box and promptly sent to the laboratory (within 8 h) and were stored at -80°C until they were ready for genomic DNA extraction. The genomic DNA was extracted using Tiangen Magnetic Beads (Beijing, China). The purity and integrity of the extracted DNA were evaluated by 1% agarose gel electrophoresis. The DNA was quantified using the Qubit® dsDNA Assay Kit by Qubit® 2.0 Fluorometer (Thermo Fisher Technologies, CA, USA). Approximate 1 μg of DNA was used for library construction using the NEBNext® Ultra DNA Library Prep Kit for Illumina (NEB, CA, USA). Preliminary quantification was performed using Qubit 2.0 after library construction, and subsequently, the insert size of the DNA library was checked using Agilent 2100 (Agilent, CA, USA). The effective concentration of the library was accurately quantified using the Q-PCR method (the effective concentration of the library > 3 nM). Paired-end sequencing reads were generated using an Illumina NovaSeq platform (Illumina, CA, USA) by Novogene Co., Ltd. All metagenomic sequence data had been uploaded to the public NCBI sequence read archive (SRA) database under the BioProject number PRJNA1059748.
Raw reads were quality-filtered using fastp (Chen et al., 2018) to remove sequences with a quality value > 38 or ambiguous nucleotides > 10. In cases where there was potential host contamination, default alignment was performed using Bowtie2 software (version 2.2.4, http://bowtie-bio.sourceforge.net/bowtie2/index.shtml) with the following parameters (Karlsson et al., 2013): –end-to-end, –sensitive, –I 200, –X 400. The reads with a match consistency ≥ 90% were filtered out. After quality filtering, approximately 10 GB of clean data were obtained for each sample. MetaPhlAn version 4.0.4 (17 Jan 2023) was used to analyse the relative abundance data at the family and genus levels (Truong et al., 2015). The abundances of ARGs, virulence genes (VGs), and MGEs were calculated using ARGs-SOP (Version 2.0) with default parameters using the SARG.2.2, VFDB, and Mobile Genetic Element Databases, respectively (Liu et al., 2022). To identify the hosts of antibiotic resistance genes, we used MEGAHIT version1.0.4-beta to assemble the data (Nielsen et al., 2014), and the contigs longer than 500 bp were kept for subsequent analyses. The filtered contigs were annotated for species using Kraken2 and we used DIAMOND to search the protein sequences against the SARG.2.2 database to identify ARGs containing contigs. The relative abundance of the KEGG pathway was determined using HUMANN3 (Franzosa et al., 2018).
For risk factors analyses, univariate analysis was conducted using the chi-square test or Fisher’s exact test (expected frequency < 5, use Fisher’s exact test; expected frequency > 5, use chi-square test). A collinearity-test was performed on the variables to select those with a variance inflation factor (VIF) < 3 for subsequent multivariate logistic regression analysis (VIF < 3 indicates no collinearity). Variables with P < 0.05 and VIF < 3 in previous analyses were further included in multivariable logistic regression model (enter, P < 0.05; excluded, P > 0.1, forward selection). We used the Wilcoxon rank-sum test (Mann–Whitney U-test) or t-test (depending on whether the data were normally distributed) to compare the number of observed features (i.e. richness), InvSimpson (i.e. richness), and Shannon index (i.e. diversity) (Anderson, 2001). The Z-test was used to compare the proportions of microbiota. We conducted PCoA (based on Bray–Curtis distances) to explore the similarities and differences in microbiota/ARGs/MGEs between the H and NH groups (Nocelli et al., 1999). LEfSe was used to distinguish differences in microbiota and ARGs between and within the H and NH groups (Segata et al., 2011). We also used Spearman’s correlation analysis to evaluate the linear associations between ARGs richness and diversity, and UA levels. All analyses were performed in R v3.6.1 (R Foundation for Statistical Computing, Vienna, Austria). P values < 0.05 were considered statistically significant. Heatmaps were generated using the heatmap package, while most other graphs such as box plot and bar chart were produced using the ggplot2 package (Chen et al., 2020). The α-diversity indices (Shannon, observed species, InvSimpson) of bacterial communities, ARGs, and MGEs for each sample were calculated using vegan package in R (Barberán et al., 2012). The β-diversity analysis was conducted using PCoA based on Bray–Curtis distances via vegan package (Cao et al., 2020), and PERMANOVA was used for statistical analysis (Anderson, 2001). We conducted Procrustes analysis based on Bray–Curtis dissimilarity to investigate the relationship between ARGs and gut microbiota. Network analyses between potential pathogens and ARGs were visualised using Gephi v0.9.2 (Chen et al., 2020).
The datasets presented in this study can be found in online repositories. The names of the repository/repositories and accession number(s) can be found here: NCBI SRA, accession PRJNA1059748.
The studies involving humans were approved by Ethical approval (R2018021) was granted by the Ethics Committee of the Shenzhen CDC on 19 January 2018. The studies were conducted in accordance with the local legislation and institutional requirements. The participants provided their written informed consent to participate in this study.
ZhL: Conceptualization, Data curation, Investigation, Methodology, Software, Writing – original draft, Writing – review & editing. YS: Methodology, Supervision, Writing – original draft, Writing – review & editing. YF: Data curation, Methodology, Software, Supervision, Writing – review & editing. DS: Data curation, Software, Writing – review & editing. LL: Supervision, Writing – original draft. ZiL: Conceptualization, Formal analysis, Funding acquisition, Project administration, Resources, Writing – original draft.
The author(s) declare financial support was received for the research, authorship, and/or publication of this article. This research was funded by Sanming Project of Medicine in Shenzhen [SZSM202011008], Shenzhen Science and Technology Program [JCYJ20210324124201004], Shenzhen Key Medical Discipline Construction Fund [SZXK066], Shenzhen Science and Technology Program [JSGG20220606141800001].
The authors thank all study participants from the central laboratory of Shenzhen center for disease Control and prevention. The authors appreciate the assistance in data storage and computation from the National Key Laboratory of Veterinary Public Health Safety and Novogene. The authors are grateful for the support provided by the University of South China. The authors extend their gratitude to the Shenzhen Yutian Community Health Service. The authors also thank Novogene for their support.
The authors declare that the research was conducted in the absence of any commercial or financial relationships that could be construed as a potential conflict of interest.
All claims expressed in this article are solely those of the authors and do not necessarily represent those of their affiliated organizations, or those of the publisher, the editors and the reviewers. Any product that may be evaluated in this article, or claim that may be made by its manufacturer, is not guaranteed or endorsed by the publisher.
The Supplementary Material for this article can be found online at: https://www.frontiersin.org/articles/10.3389/frmbi.2024.1384703/full#supplementary-material
Anderson M. J. J. W. B. (2001). A new method for non-parametric multivariate analysis of variance. 26 (1), 32–46. doi: 10.1111/j.1442-9993.2001.01070.pp.x
Anthony W. E., Burnham C. D., Dantas G., Kwon J. H. (2021). The gut microbiome as a reservoir for antimicrobial resistance. J. Infect. Dis. 223, S209–s213. doi: 10.1093/infdis/jiaa497
Ashida G., Funabiki K., Kretzberg J. (2015). Minimal conductance-based model of auditory coincidence detector neurons. PloS One 10, e0122796. doi: 10.1371/journal.pone.0122796
Barberán A., Bates S. T., Casamayor E. O., Fierer N. (2012). Using network analysis to explore co-occurrence patterns in soil microbial communities. Isme J. 6 (2), 343–351. doi: 10.1038/ismej.2011.119
Becker R., Ulrich K., Behrendt U., Schneck V., Ulrich A. (2022). Genomic characterization of Aureimonas altamirensis C2P003-A specific member of the microbiome of Fraxinus excelsior trees tolerant to ash aieback. Plants (Basel) 11 (24), 3487. doi: 10.3390/plants11243487
Cai Y., Cui X., Su B., Wu S. (2022a). Changes in mortality rates of major chronic diseases among populations aged over 60 years and their contributions to life expectancy increase - China, 2005–2020. China CDC Wkly 4 (39), 866–870. doi: 10.46234/ccdcw2022.179
Cai Y., Chen L., Zhang S., Zeng L., Zeng G. (2022b). The role of gut microbiota in infectious diseases. WIREs Mech. Dis. 14 (4), e1551. doi: 10.1002/wsbm.1551
Cao J., Hu Y., Liu F., Wang Y., Bi Y., Lv N., et al. (2020). Metagenomic analysis reveals the microbiome and resistome in migratory birds. Microbiome 8 (1), 26. doi: 10.1186/s40168-019-0781-8
Chen S., Zhou Y., Chen Y., Gu J. (2018). fastp: an ultra-fast all-in-one FASTQ preprocessor. Bioinformatics 34 (17), i884–i890. doi: 10.1093/bioinformatics/bty560
Chen H., Li Y., Sun W., Song L., Zuo R., Teng Y. (2020). Characterization and source identification of antibiotic resistance genes in the sediments of an interconnected river-lake system. Environ. Int. 137, 105538. doi: 10.1016/j.envint.2020.105538
Chu Y., Sun S., Huang Y., Gao Q., Xie X., Wang P., et al. (2021). Metagenomic analysis revealed the potential role of gut microbiome in gout. NPJ Biofilms Microbiomes 7 (1), 66. doi: 10.1038/s41522-021-00235-2
Crane J. K. (2013). Role of host xanthine oxidase in infection due to enteropathogenic and Shiga-toxigenic Escherichia coli. Gut Microbes 4, 388–391.
Danve A., Sehra S. T., Neogi T. (2021). Role of diet in hyperuricemia and gout. Best Pract. Res. Clin. Rheumatol 35, 101723. doi: 10.1016/j.berh.2021.101723
DeBosch B. J., Kluth O., Fujiwara H., Schürmann A., Moley K. (2014). Early-onset metabolic syndrome in mice lacking the intestinal uric acid transporter SLC2A9. Nat. Commun. 5, 4642. doi: 10.1038/ncomms5642
de Oliveira E. P., Burini R. C. (2012). High plasma uric acid concentration: causes and consequences. Diabetol. Metab. Syndr. 4, 12. doi: 10.1186/1758-5996-4-12
Fan S., Zhang P., Wang A. Y., Wang X., Wang L., Li G., et al. (2019). Hyperuricemia and its related histopathological features on renal biopsy. BMC Nephrol. 20 (1), 95. doi: 10.1186/s12882-019-1275-4
Fang E. F., Xie C., Schenkel J. A., Wu C., Long Q., Cui H., et al. (2020). A research agenda for ageing in China in the 21st century (2nd edition): Focusing on basic and translational research, long-term care, policy and social networks. Ageing Res. Rev. 64, 101174. doi: 10.1016/j.arr.2020.101174
Feng X., Yang Y., Xie H., Zhuang S., Fang Y., Dai Y., et al. (2022). The association between hyperuricemia and obesity metabolic phenotypes in chinese general population: A retrospective analysis. Front. Nutr. 9, 773220. doi: 10.3389/fnut.2022.773220
Franzosa E. A., McIver LJ., Rahnavard G., Thompson L. R., Schirmer M., Weingart G., et al. (2018). Species-level functional profiling of metagenomes and metatranscriptomes. Nat. Methods 15 (11), 962–968. doi: 10.1038/s41592-018-0176-y
Karlsson F. H., Tremaroli V., Nookaew I., Bergström G., Behre C. J., Fagerberg B., et al. (2013). Gut metagenome in European women with normal, impaired and diabetic glucose control. Nature 498 (7452), 99–103. doi: 10.1038/nature12198
King C., Lanaspa MA., Jensen T., Tolan D. R., Sánchez-Lozada L. G., Johnson R. J. (2018). Uric acid as a cause of the metabolic syndrome. Contrib Nephrol. 192, 88–102. doi: 10.1159/000484283
Klein E. Y., Van Boeckel T. P., Martinez E. M., Pant S., Gandra S., Levin S. A., et al. (2018). Global increase and geographic convergence in antibiotic consumption between 2000 and 2015. Proc. Natl. Acad. Sci. U.S.A. 115 (15), E3463–e3470. doi: 10.1073/pnas.1717295115
Lee M. J., Khang A. R., Kang Y. H., Yun M. S., Yi D. (2022). Synergistic interaction between hyperuricemia and abdominal obesity as a risk factor for metabolic syndrome components in korean population. Diabetes Metab. J. 46 (5), 756–766. doi: 10.4093/dmj.2021.0166
Lee K., Raguideau S., Sirén K., Asnicar F., Cumbo F., Hildebrand F., et al. (2023). Population-level impacts of antibiotic usage on the human gut microbiome. Nat. Commun. 14 (1), 1191. doi: 10.1038/s41467-023-36633-7
Li T., Guan L., Wang X., Li X., Zhou C., Wang X., et al. (2022). Relationship between dietary patterns and chronic diseases in rural population: management plays an important role in the link. Front. Nutr. 9, 866400. doi: 10.3389/fnut.2022.866400
Li C., Hsieh M. C., Chang S. J. (2013). Metabolic syndrome, diabetes, and hyperuricemia. Curr. Opin. Rheumatol 25, 210–216. doi: 10.1097/BOR.0b013e32835d951e
Liang M., Liu J., Chen W., He Y., Kahaer M., Li R., et al. (2022). Diagnostic model for predicting hyperuricemia based on alterations of the gut microbiome in individuals with different serum uric acid levels. Front. Endocrinol. (Lausanne) 13, 925119. doi: 10.3389/fendo.2022.925119
Libertucci J., Young V. B. (2019). The role of the microbiota in infectious diseases. Nat. Microbiol. 4, 35–45. doi: 10.1038/s41564-018-0278-4
Liu H., Zhang X. M., Wang Y. L., Liu B. C. (2014). Prevalence of hyperuricemia among Chinese adults: a national cross-sectional survey using multistage, stratified sampling. J. Nephrol. 27 (6), 653–658. doi: 10.1007/s40620-014-0082-z
Liu B., Zheng D., Zhou S., Chen L., Yang J. (2022). VFDB 2022: a general classification scheme for bacterial virulence factors. Nucleic Acids Res. 50, D912–D917. doi: 10.1093/nar/gkab1107
Liu X., Ke L., Lei K., Yu Q., Zhang W., Li C., et al. (2023). Antibiotic-induced gut microbiota dysbiosis has a functional impact on purine metabolism. BMC Microbiol. 23 (1), 187. doi: 10.1186/s12866-023-02932-8
Luo Q., Cai Y., Zhao Q., Tian L., Liu Y., Liu W. J. (2022). Effects of allopurinol on renal function in patients with diabetes: a systematic review and meta-analysis. Ren Fail 44 (1), 806–814. doi: 10.1080/0886022X.2022.2068443
Luo Y., Wang S. (2022). Urban living and chronic diseases in the presence of economic growth: Evidence from a long-term study in southeastern China. Front. Public Health 10, 1042413. doi: 10.3389/fpubh.2022.1042413
Lv Q., Xu D., Zhang X., Yang X., Zhao P., Cui X., et al. (2020). Association of hyperuricemia with immune disorders and intestinal barrier dysfunction. Front. Physiol. 11, 524236. doi: 10.3389/fphys.2020.524236
Maciel-Fiuza M. F., Muller G. C., Campos D. M. S., do Socorro Silva Costa P., Peruzzo J., Bonamigo R. R., et al. (2023). Role of gut microbiota in infectious and inflammatory diseases. Front. Microbiol. 14, 1098386. doi: 10.3389/fmicb.2023.1098386
Maresova P., Javanmardi E., Barakovic S., Barakovic Husic J., Tomsone S., Krejcar O., et al. (2019). Consequences of chronic diseases and other limitations associated with old age - a scoping review. BMC Public Health 19 (1), 1431. doi: 10.1186/s12889-019-7762-5
Nielsen H. B., Almeida M., Juncker A. S., Rasmussen S., Li J., Sunagawa S., et al. (2014). Identification and assembly of genomes and genetic elements in complex metagenomic samples without using reference genomes. Nat. Biotechnol. 32, 822–828. doi: 10.1038/nbt.2939
Nocelli E., Giovannini T., Bioni M., Alicchio R. (1999). RFLP- and RAPD-based genetic relationships of seven diploid species of Avena with the A genome. Genome 42 (5), 950–959. doi: 10.1139/g99-029
Pan X., Zhou Z., Liu B., Wu Z. (2022). A novel therapeutic concern: Antibiotic resistance genes in common chronic diseases. Front. Microbiol. 13, 1037389. doi: 10.3389/fmicb.2022.1037389
Qin N., Qin M., Shi W., Kong L., Wang L., Xu G., et al. (2022). Investigation of pathogenesis of hyperuricemia based on untargeted and targeted metabolomics. Sci. Rep. 12 (1), 13980. doi: 10.1038/s41598-022-18361-y
Riches P. L., Wright A. F., Ralston S. H. (2009). Recent insights into the pathogenesis of hyperuricaemia and gout. Hum. Mol. Genet. 18 (R2), R177–R184. doi: 10.1093/hmg/ddp369
Segata N., Izard J., Waldron L., Gevers D., Miropolsky L., Garrett WS., et al. (2011). Metagenomic biomarker discovery and explanation. Genome Biol. 12 (6), R60. doi: 10.1186/gb-2011-12-6-r60
Shamsaddini A., Gillevet P. M., Acharya C., Fagan A., Gavis E., Sikaroodi M., et al. (2021). Impact of antibiotic resistance genes in gut microbiome of patients with cirrhosis. Gastroenterology 161 (2), 508–521.e7. doi: 10.1053/j.gastro.2021.04.013
Shuai M., Zhang G., Zeng F. F., Fu Y., Liang X., Yuan L., et al. (2022). Human gut antibiotic resistome and progression of diabetes. Adv. Sci. (Weinh) 9 (11), e2104965. doi: 10.1002/advs.202104965
Song P., Wang H., Xia W., Chang X., Wang M., An L. (2018). Prevalence and correlates of hyperuricemia in the middle-aged and older adults in China. Sci. Rep. 8 (1), 4314. doi: 10.1038/s41598-018-22570-9
Sreekanth M. A. (2022). Hyperuricemia as an early marker in predicting mortality and morbidity in patients with sepsis. J. Assoc. Physicians India 70 (4), 11–12. doi: 10.21276/ijcmr.2019.6.3.39
Tavella T., Turroni S., Brigidi P., Candela M., Rampelli S. (2021). The human gut resistome up to extreme longevity. mSphere 6 (5), e0069121. doi: 10.1128/mSphere.00691-21
Thomas S. A., Browning CJ., Charchar F. J., Klein B., Ory M. G., Bowden-Jones H., et al. (2023). Transforming global approaches to chronic disease prevention and management across the lifespan: integrating genomics, behavior change, and digital health solutions. Front. Public Health 11, 1248254. doi: 10.3389/fpubh.2023.1248254
Truong D. T., Franzosa E. A., Tickle T. L., Scholz M., Weingart G., Pasolli E., et al. (2015). MetaPhlAn2 for enhanced metagenomic taxonomic profiling. Nat. Methods 12 (10), 902–903. doi: 10.1038/nmeth.3589
Wang Z., Li Y., Liao W., Huang J., Liu Y., Li Z., et al. (2022). Gut microbiota remodeling: A promising therapeutic strategy to confront hyperuricemia and gout. Front. Cell Infect. Microbiol. 12, 935723. doi: 10.3389/fcimb.2022.935723
Wang C. H., Zhang C., Xing X. H. (2017). Metabolic engineering of Escherichia coli cell factory for highly active xanthine dehydrogenase production. Bioresour Technol. 245, 1782–1789. doi: 10.1016/j.biortech.2017.05.144
Wei J., Zhang Y., Dalbeth N., Terkeltaub R., Yang T., Wang Y., et al. (2022). Association between gut microbiota and elevated serum urate in two independent cohorts. Arthritis Rheumatol. 74 (4), 682–691. doi: 10.1002/art.42009
Xia Z., Jiang Y. Y., Dong W. L., Mao F., Zhang S., Dong J. Q., et al. (2021). [Chronic and non-communicable disease mortality and trends in Chinese elderly, 2004–2018]. Zhonghua Liu Xing Bing Xue Za Zhi 42 (3), 499–507. doi: 10.3760/cma.j.cn112338-20200208-00079
Xu K., Wang J., Gong H., Li Y., Zhou L., Yan M. (2019). Occurrence of antibiotics and their associations with antibiotic resistance genes and bacterial communities in Guangdong coastal areas. Ecotoxicol Environ. Saf. 186, 109796. doi: 10.1016/j.ecoenv.2019.109796
Xu Y. X., Liu LD., Zhu J. Y., Zhu S. S., Ye B. Q., Yang J. L., et al. (2024). Alistipes indistinctus-derived hippuric acid promotes intestinal urate excretion to alleviate hyperuricemia. Cell Host Microbe 32 (3), 366–381.e9. doi: 10.1016/j.chom.2024.02.001
Xu X., Yang H. (2022). Does elderly chronic disease hinder the sustainability of borderline poor families’ Wellbeing: an investigation from catastrophic health expenditure in China. Int. J. Public Health 67, 1605030. doi: 10.3389/ijph.2022.1605030
Yadav D., Lee E. S., Kim H. M., Lee E. Y., Choi E., Chung C. H. (2013). Hyperuricemia as a potential determinant of metabolic syndrome. J. Lifestyle Med. 3 (2), 98–106.
Yamada N., Iwamoto C., Kano H., Yamaoka N., Fukuuchi T., Kaneko K., et al. (2016). Evaluation of purine utilization by Lactobacillus gasseri strains with potential to decrease the absorption of food-derived purines in the human intestine. Nucleosides Nucleotides Nucleic Acids 35 (10-12), 670–676. doi: 10.1080/15257770.2015.1125000
Yang H. T., Xiu W. J., Liu J. K., Yang Y., Hou X. G., Zheng Y. Y., et al. (2021). Gut Microbiota Characterization in Patients with Asymptomatic Hyperuricemia: probiotics increased. Bioengineered 12 (1), 7263–7275. doi: 10.1080/21655979.2021.1976897
Yoshida H., Inaguma D., Koshi-Ito E., Ogata S., Kitagawa A., Takahashi K., et al. (2020). Extreme hyperuricemia is a risk factor for infection-related deaths in incident dialysis patients: a multicenter prospective cohort study. Ren Fail 42 (1), 646–655. doi: 10.1080/0886022X.2020.1788582
Yu W., Cheng J. D. (2020). Uric acid and cardiovascular disease: an update from molecular mechanism to clinical perspective. Front. Pharmacol. 11, 582680. doi: 10.3389/fphar.2020.582680
Yu Y., Liu Q., Li H., Wen C., He Z. (2018). Alterations of the gut microbiome associated with the treatment of hyperuricaemia in male rats. Front. Microbiol. 9, 2233. doi: 10.3389/fmicb.2018.02233
Yu Q., Sun Z., Wang Y., Du X., Huang J., Wang L. (2023). Hyperuricemia is accompanied by elevated peripheral CD4(+) T cells. Sci. Rep. 13 (1), 12537. doi: 10.1038/s41598-023-39775-2
Zhang L., Fu Y., Xiong Z., Ma Y., Wei Y., Qu X., et al. (2018). Highly prevalent multidrug-resistant salmonella from chicken and pork meat at retail markets in guangdong, China. Front. Microbiol. 9, 2104. doi: 10.3389/fmicb.2018.02104
Zhang M., Zhu X., Wu J., Huang Z., Zhao Z., Zhang X., et al. (2021). Prevalence of hyperuricemia among chinese adults: findings from two nationally representative cross-sectional surveys in 2015–16 and 2018–19. Front. Immunol. 12, 791983. doi: 10.3389/fimmu.2021.791983
Keywords: hyperuricaemia, microbiota, resistome, metagenomics, elderly people
Citation: Liu Z, Shen Y, Fu Y, Sun D, Li L and Lv Z (2024) Association of resistome abundance with hyperuricaemia in elderly individuals: a metagenomics study. Front. Microbiomes 3:1384703. doi: 10.3389/frmbi.2024.1384703
Received: 10 February 2024; Accepted: 13 June 2024;
Published: 11 July 2024.
Edited by:
Franck Carbonero, Washington State University Health Sciences Spokane, United StatesReviewed by:
Gaurav Chauhan, University of Massachusetts Medical School, United StatesCopyright © 2024 Liu, Shen, Fu, Sun, Li and Lv. This is an open-access article distributed under the terms of the Creative Commons Attribution License (CC BY). The use, distribution or reproduction in other forums is permitted, provided the original author(s) and the copyright owner(s) are credited and that the original publication in this journal is cited, in accordance with accepted academic practice. No use, distribution or reproduction is permitted which does not comply with these terms.
*Correspondence: Ziquan Lv, bHZ6aXF1YW4xOTg0QDEyNi5jb20=; Liang Li, bGlhbmdsaWh5QHVzYy5lZHUuY24=
†These authors have contributed equally to this work
Disclaimer: All claims expressed in this article are solely those of the authors and do not necessarily represent those of their affiliated organizations, or those of the publisher, the editors and the reviewers. Any product that may be evaluated in this article or claim that may be made by its manufacturer is not guaranteed or endorsed by the publisher.
Research integrity at Frontiers
Learn more about the work of our research integrity team to safeguard the quality of each article we publish.