 Ju Sun Song
 Joung Ouk Ryan Kim
 Sung Min Yoon
 Min-Jung Kwon4
95% of researchers rate our articles as excellent or good
Learn more about the work of our research integrity team to safeguard the quality of each article we publish.
Find out more
ORIGINAL RESEARCH article
Front. Microbiomes , 26 May 2023
Sec. Host and Microbe Associations
Volume 2 - 2023 | https://doi.org/10.3389/frmbi.2023.1072059
Introduction: Several animal and clinical studies have reported that the state of the human gut microbiome is associated with hypertension. In this study, we investigated the association between the gut microbiome and hypertension in a Korean population from an enterotypic perspective.
Methods: A total of 623 participants were enrolled from a healthcare center and classified into four enterotypes, Bacteroides1- (Bac1), Bacteroides2- (Bac2), Prevotella- (Pre), and Ruminococcus enterotype-like-composition (Rum).
Results: When comparing the four enterotypes, clinical characteristics related to obesity, metabolic syndrome, and blood pressure were significantly associated with th e enterotypes, showing unfavorable associations with the Bac2 group and the opposite for the Rum group. Similarly, the prevalence of hypertension was highest in the Bac2 group and lowest in the Rum group. When analyzing the association between gut microbiota and blood pressure for each enterotype, gut microbial features of lower diversity, depletion of important short chain fatty acid-producing taxa, such as Faecalibacterium, Blautia, Anaerostipes, and enrichment of lipopolysaccharide -producing taxa, such as Megamonas, were found only in the dysbiotic Bac2 group.
Discussion: From an enterotype perspective, this study on a large Korean cohort shows that low-diversity Bacteroides2-enterotype-like composition is associated with hypertension, while the reverse is true for high-diversity Ruminococcus-enterotype-like composition and, to a limited degree, Bacteroides1-enterotype-like composition. In addition, we suggest that the effect of gut microbiota-mediated risk of hypertension could be modulated by altering the gut microbiome via diet. Dietary intervention trials promoting a balanced Korean diet instead of a more Western alternative may provide more definitive evidence for the involvement and role of the gut microbiome in relation to blood pressure.
Hypertension is a major global health issue affecting 1.13 billion people worldwide, according to the World Health Organization. It increases the risk of cardiovascular diseases, including heart disease and stroke, and represents a tremendous public health burden. Its high prevalence is also an issue in Korea, with the number of patients with hypertension exceeding 12 million in 2018 (Kim et al., 2021) and continuously increasing, owing to the rapid aging of the population and westernized lifestyles.
Hypertension is a complex multifactorial disease, with genetic, environmental, and demographic factors contributing to its prevalence. Recently, animal studies have indicated that the gut microbiota play an important role in the regulation of blood pressure (Yang et al., 2015; Adnan et al., 2017; Santisteban et al., 2017). Numerous clinical studies have attempted to elucidate the relationship between the gut microbiota and hypertension, as well as to identify microbial markers of hypertension (Li et al., 2017; Yan et al., 2017; Sun et al., 2019; Nagase et al., 2020; Verhaar et al., 2020; Maifeld et al., 2021; Nakai et al., 2021). Metabolites produced by the gut microbiota, such as short-chain fatty acids (SCFAs), trimethylamine N-oxide (TMAO), and lipopolysaccharides (LPS), are suggested to directly affect endothelial, kidney, and heart tissues, amongst others (Al Khodor et al., 2017; Kang and Cai, 2018; Marques et al., 2018; Oyama and Node, 2019; Yang et al., 2020). However, even large-cohort studies have not identified consistent microbial markers and occasionally produce slightly conflicting results. Therefore, the relationship between hypertension and the gut microbiota still needs to be elucidated (Sun et al., 2019; Palmu et al., 2020; Verhaar et al., 2020).
The gut microbiome exhibits large individual differences and is affected by various factors. Among them, diet has a significant influence on the human gut microbiota. Variations in the gut microbiota exist regardless of age, sex, ethnicity, and geography, and are mainly determined by habitual diet. These recurrent patterns of microbial composition in the gut microbiome can be separated into several clusters termed the “enterotype.” These enterotypes are functionally and ecologically different. Therefore, it can be assumed that different enterotypes and their microbial architectures influence the development of hypertension in different ways and to varying degrees.
To elucidate these interactions and investigate the microbial markers associated with hypertension, in this study, we analyzed the association between the gut microbiota and hypertension across different enterotypes using 16S rRNA amplicon sequencing data.
Individuals aged 19 years or older who underwent health checkups were recruited from the clinics of the Kangbuk Samsung Hospital Total Healthcare Centers in Seoul and Suwon, South Korea. Demographic and clinical data were collected from health checkup reports. Patients’ blood pressure was measured three times, and the average was considered as the final measurement. According to the 2017 guidelines for high blood pressure in adults (Whelton et al., 2017), participants with systolic blood pressure (SBP) < 120 mmHg and diastolic blood pressure (DBP) < 80 mmHg were classified into the normotension group, whereas participants with SBP > 130 mmHg or DBP > 80 mmHg were classified into the hypertension group. Patients with cancer, active intestinal inflammatory diseases, renal failure, heart failure, peripheral artery disease, or secondary hypertension were excluded from the study. None of the participants received antihypertensive treatment. Individuals receiving antibiotics or probiotics during the preceding three months were also excluded.
This study was approved by the Ethics Committee of the Gangbuk Samsung Hospital (protocol number: KBSMC 2019-04-040), and all participants provided written informed consent.
Fecal samples were self-collected using a stool collection kit (NBgene-GUT kit; Noble Biosciences, Republic of Korea) containing preservatives. All samples arrived within 3 days of sampling. DNA was immediately extracted upon arrival of the samples using a Chemagic DNA Stool Kit (PerkinElmer, USA) with a modified bead-beating pretreatment step. Each sample was aliquoted into a bead tube (Lysing matrix E; MP Biomedical, USA) and homogenized using a Fastprep-24 homogenizer for 1 min. The V4 hypervariable region was amplified using a NEXTflex 16S V4 Amplicon-Seq kit (BioO Scientific, Austin, TX, USA) and sequenced using an Illumina MiSeq Reagent Kit v2 (500 cycles) following the manufacturer’s protocol.
At least 20,000 reads were obtained per sample and sequence reads were analyzed using the QIIME 2 framework (Bolyen et al., 2019). Demultiplexed and primer-trimmed data were quality-filtered and denoised using the DADA2 plugin (Callahan et al., 2016). Amplicon sequence variants (ASV) with fewer than 10 reads or those present in only a single sample were removed, and each amplicon sequence variant was assigned using naive Bayes machine-learning taxonomy classifiers in the q2-feature-classifier (Bokulich et al., 2018) trained against the NCBI refseq database. The data were transformed into proportions by dividing the number of reads for each taxon in a sample by the total number of reads in that sample. Finally, rare taxa with an abundance of less than 0.1% were removed.
The Shannon diversity index was calculated to determine alpha diversity, and the Bray–Curtis dissimilarity on the genus-level relative abundance matrix was used to compare the communities. A linear discriminant analysis effect size (LEfSe) approach was adopted to discover microbiological markers associated with hypertension status using the default settings (e.g., inear discriminative analysis [LDA] score >2) (Segata et al., 2011). Enterotyping of the genus-level abundance microbial profiles was performed using the Dirichlet multinomial mixtures (DMM) approach implemented in the R package DirichletMultinomial (Holmes et al., 2012). Inter-individual microbiome variation was visualized using principal coordinate analysis. PERMANOVA using the “adonis” command in the vegan package of R (10,000 simulations) (Warton et al., 2012) was used for microbial community comparisons.
The explanatory power of clinical variables and their effect size on microbial community variation were evaluated using distance-based redundancy analysis (db-RDA) performed at the genus level using the Bray–Curtis dissimilarity matrix, as implemented in vegan (Oksanen et al., 2014).
Statistical comparisons of clinical variables and alpha-diversity of the gut microbiota were performed using the Mann–Whitney U-test and Kruskal–Wallis test, with a post-hoc Dunn test for two groups and more than three groups, respectively. Statistical differences in categorical variables and the prevalence of enterotypes between the groups were evaluated using the chi-square test and pairwise Fisher’s exact tests, respectively.
We enrolled 623 participants, including 503 normotensive individuals and 120 patients with hypertension; Their clinical metadata and ASV data for 16S rRNA sequencing are presented in Supplementary Table 1, their clinical characteristics are listed in Table 1. BMI and waist circumference showed the most significant differences between the two groups, followed by sex, triglyceride level, and age. While the beta diversity, as calculated by the Bray-Curtis distance, did not differ between the hypertension and normotension groups (p=0.0796, Figure 1B), the alpha diversity of the gut microbiota for the hypertension group was significantly lower than that for the normotension group (p=1.2x10⁻⁵, Figure 1A). By conducting a LEfSe analysis across all taxa, from phylum to genus, we identified distinct features that were differentially abundant between the two groups. Figures 1C, D show that the normotension group exhibited higher levels of Gram-positive bacteria, such as Clostridia, Ruminococcaceae, and Lachnospiraceae, which are mostly SCFA-producing bacteria. Conversely, the hypertensive group had higher levels of Gram-negative bacteria, predominantly from the families Bacteroidetes and Negativicutes.
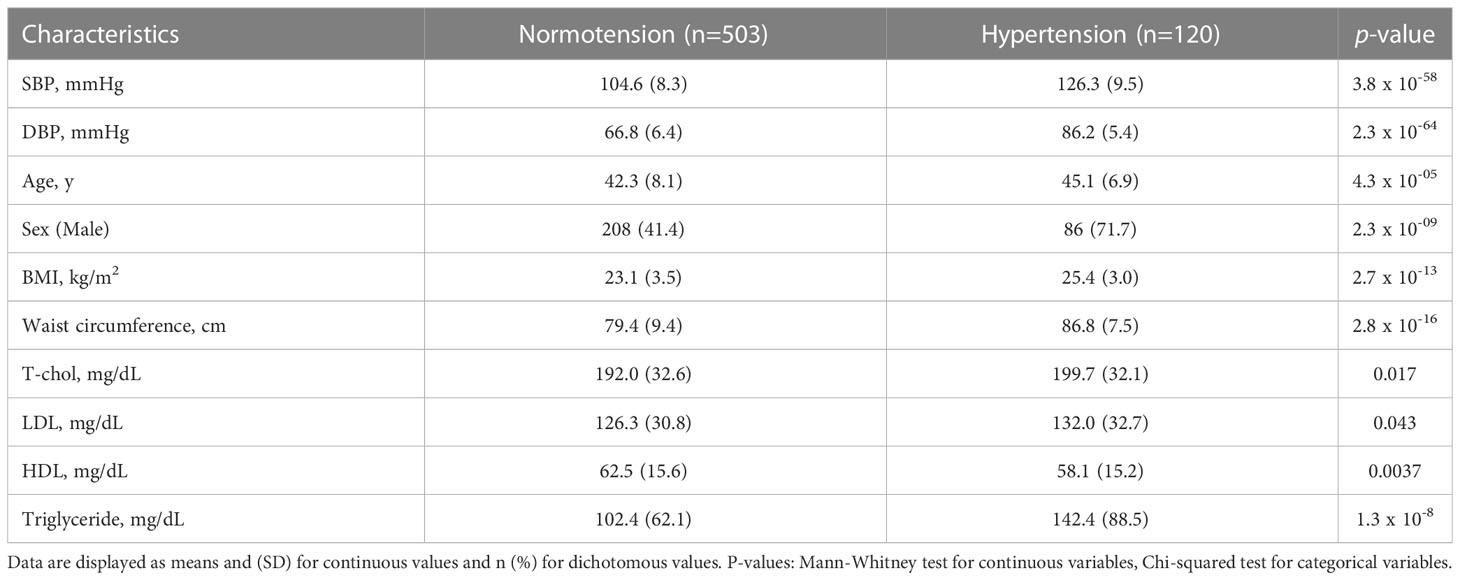
Table 1 Demographic and clinical characteristics of the total cohort of participants.
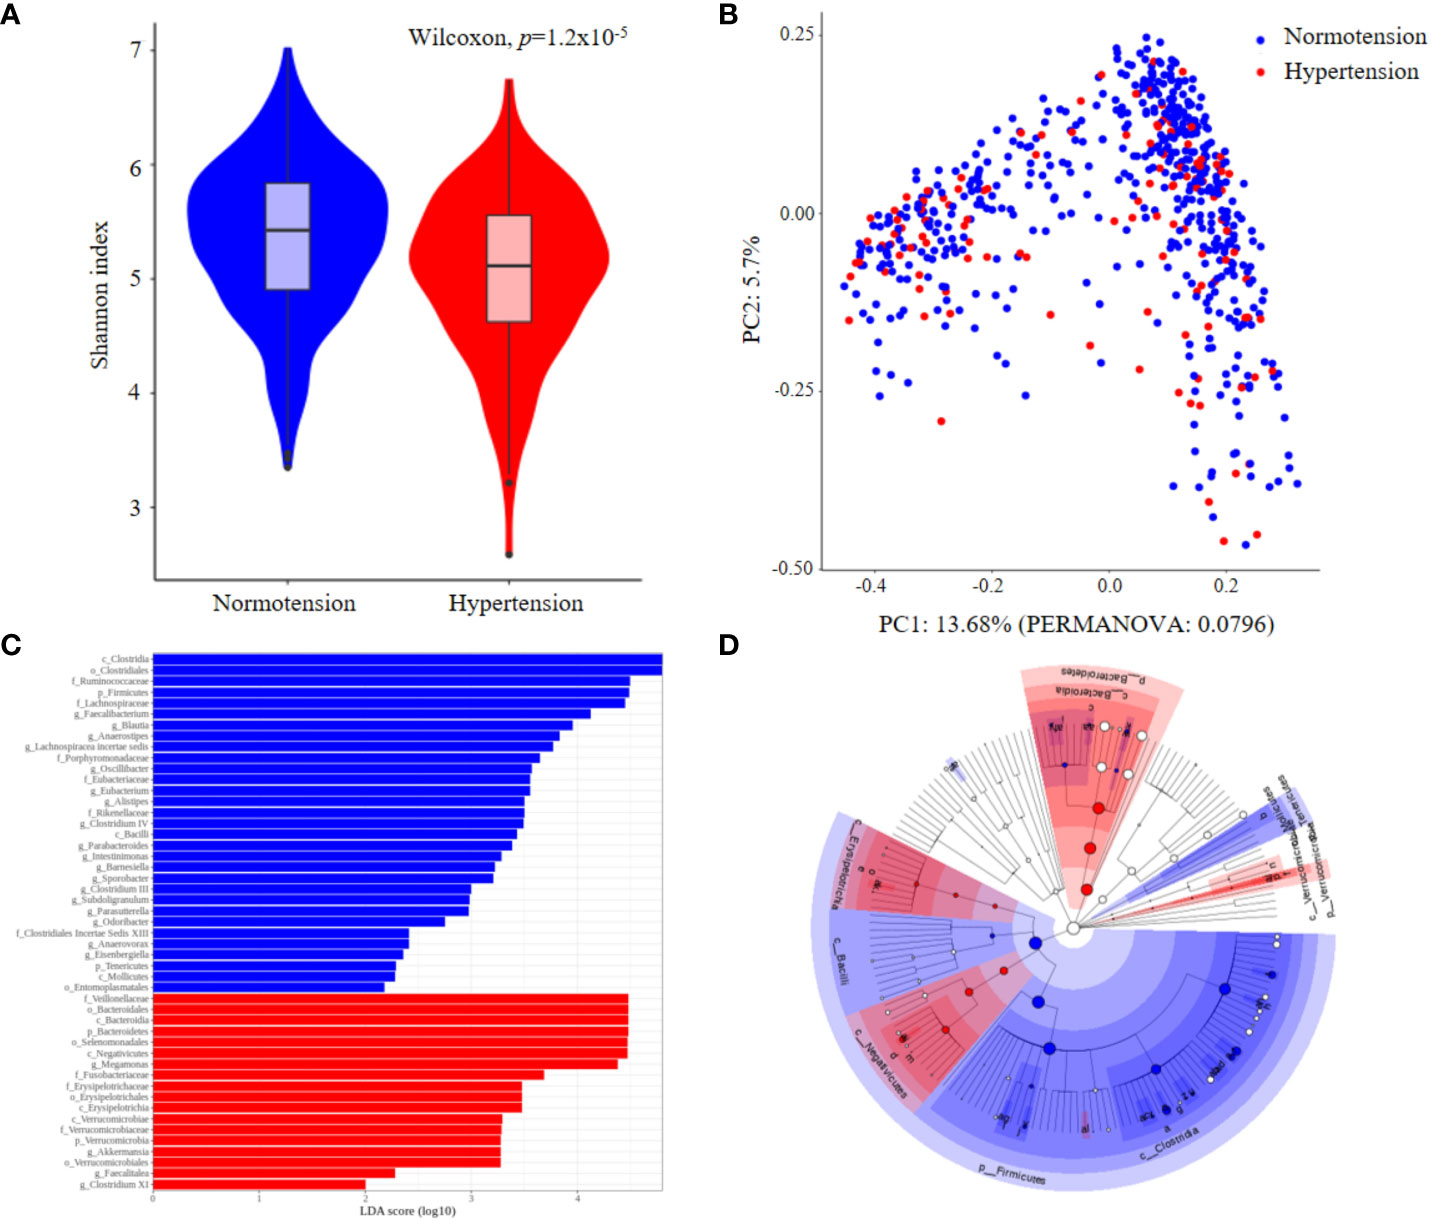
Figure 1 Comparison of gut microbial features between normotension and hypertension groups for the entire cohort. (A) Alpha-diversity. (B) Principal coordinates analysis (PCoA) derived from Bray–Curtis distances. (C) Linear discriminative analysis (LDA) effect size (LEfSe) analysis. (D) Cladogram showing differentially abundant taxonomic clades with an LDA score >2.0.
We enterotyped the entire cohort using Dirichlet multinomial mixtures on genus-level profiles to explore the potential relationship between the fecal microbiome community constellations and clinical characteristics, particularly blood pressure. The LaPlace approximation of the DMM Model fit determined the number of optimal clusters that best fit the data, and four distinct microbiota were distinguished (Figures 2A, B). These four enterotypes were designated according to their relative abundance profiles as follows: Bacteroides1- (Bac1), Bacteroides2- (Bac2), Prevotella- (Pre), and Ruminococcus-enterotype-like composition (Rum), as depicted in Figure 2C. A total of 201, 144, 201, and 77 individuals were classified as Bac1, Bac2, Pre and Rum, respectively.
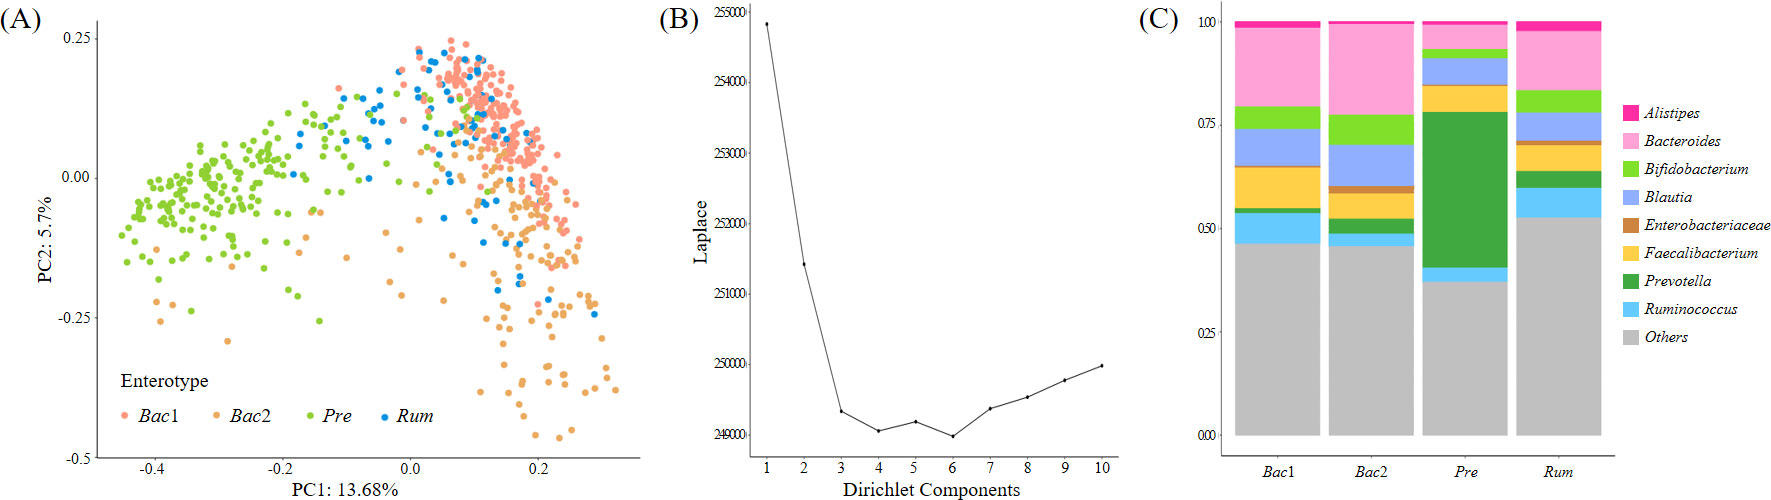
Figure 2 Enterotyping of the entire cohort. (A) Principal coordinate visualization of the four enterotypes resulting from community typing, performed using the Dirichlet Multinomial Mixture Model (DMM) on genus-level gut microbiome profiles. (B) LaPlace approximation of DMM Model fit supporting the recognition of four distinct microbiota structures in our cohort. (C) Stacked bar graphs indicating that each DMM cluster is dominated by a distinct bacterial genus.
We compared the clinical characteristics (Table 2) and gut microbial features of the four enterotypes. Five of the clinical variables, i.e., BMI, waist circumference, triglyceride, SBP, and DBP, showed the most significant differences and were all related to obesity or metabolic syndrome. The db-RDA showed the significant relevance of these five clinical variables in explaining the patterns of the four enterotypes (p<0.001 in univariate db-RDA), with 51.7% of the non-redundant cumulative explanatory power (Supplementary Figure 1).
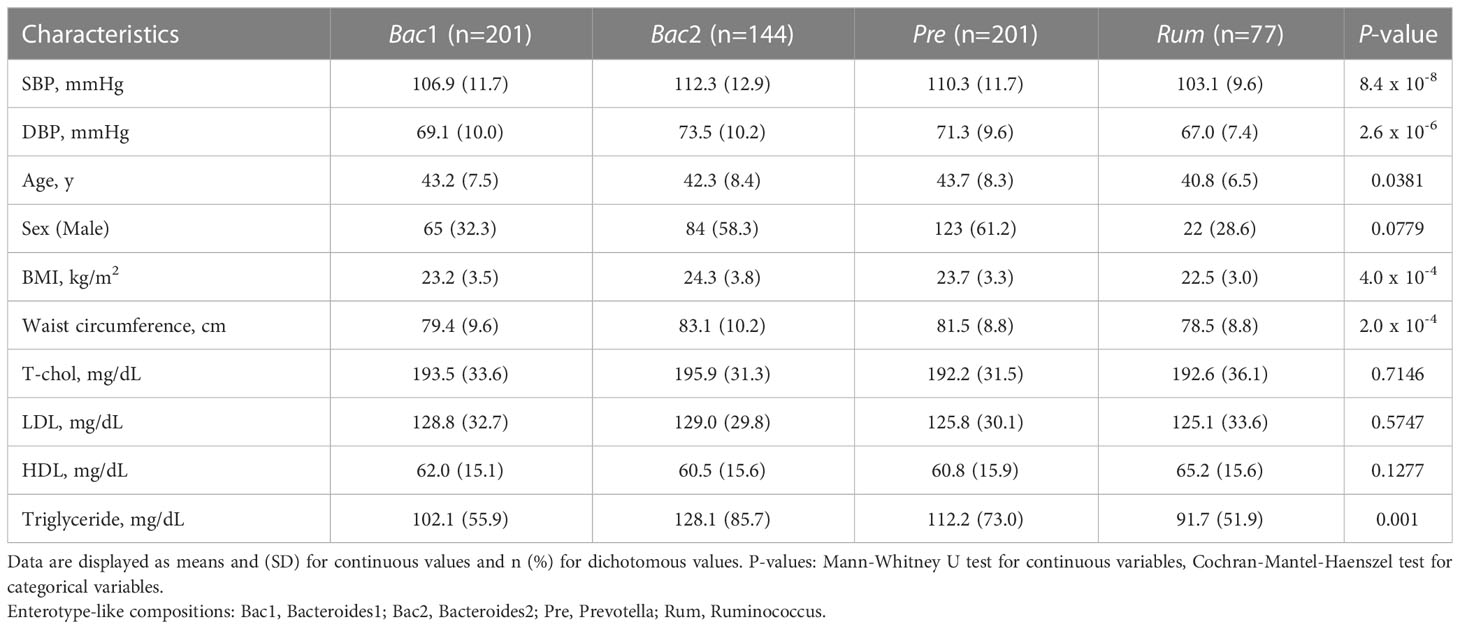
Table 2 Each enterotype’s demographic and clinical characteristics.
Notably, individuals belonging to the Bac2 group displayed significantly higher values for these five clinical variables compared to individuals classified into the Rum and Bac1 groups, although there were no significant differences between the Bac2 and Pre groups. The Rum group showed the lowest values for the clinical variables (Figures 3A–E). The five aforementioned clinical variables, encompassing blood pressure, exhibited consistent patterns of elevation and reduction. The Bac2 group had the highest prevalence of hypertension (26.4%), followed by the Pre (22.9%), Bac1 (15.4%), and Rum groups (6.5%). The prevalence of hypertension differed significantly between the Bac2 and Rum groups (pairwise Fisher’s exact test, p=0.002), and the Pre and Rum groups (p=0.005) (Figure 3F).
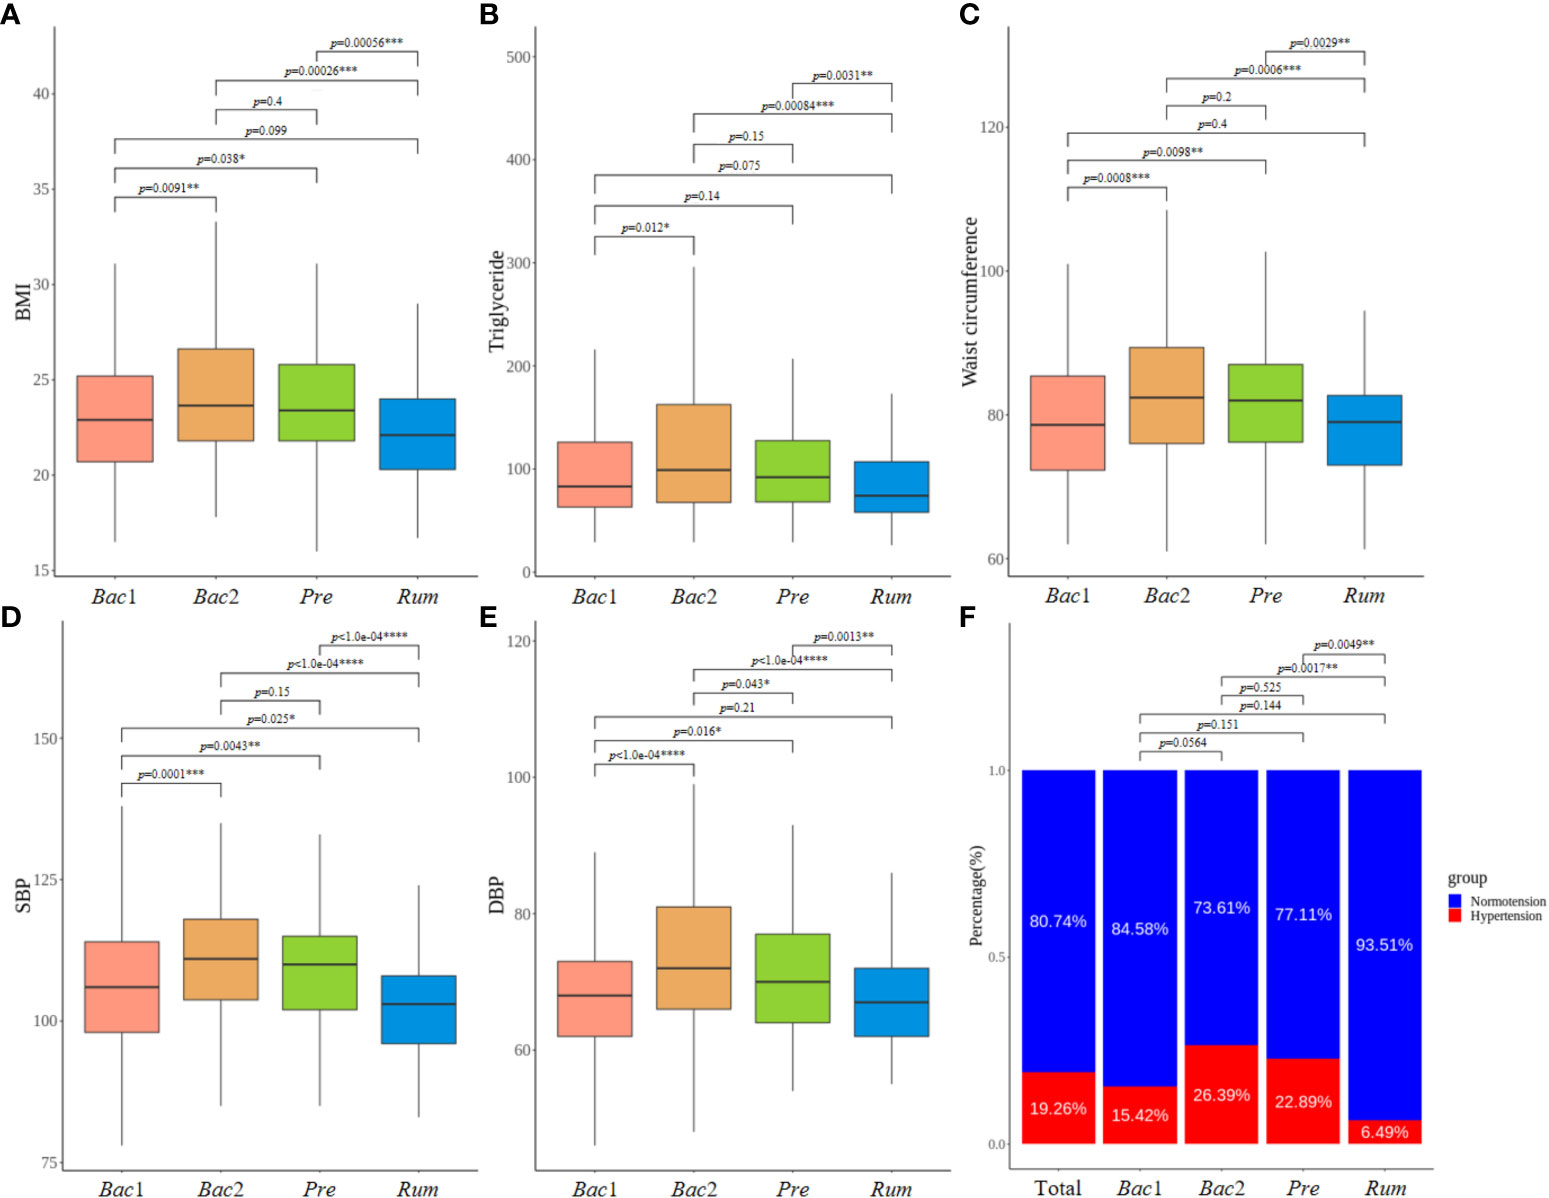
Figure 3 Comparison of clinical characteristics between enterotypes. (A–E) Comparison of five clinical characteristics with most significant differences across four enterotypes. All of these variables, including blood pressure values, exhibited a consistent pattern of both elevation and reduction. (B) Prevalence of hypertension varied according to the enterotypes, showing the highest prevalence in the Bact2 enterotype and the remarkable lowest prevalence in the Rum enterotype. P-values less than 0.05, 0.01, 0.001 and 0.0001 were marked with *, **, *** and ****, respectively.
The alpha diversity of the gut microbiome was assessed across enterotypes. Although the analysis of the prevalence of enterotypes along the alpha-diversity axis revealed a bimodal distribution consistent with previous observations, the location of the distribution differed between enterotypes, revealing the lowest and highest diversity in the Bac2 and Rum groups, respectively (Figure 4A). Additionally, the alpha diversity was significantly different across all enterotypes (Kruskal-Wallis test, p<0.0001) (Figure 4B). The diversity of the gut microbiota exhibited a positive correlation with the above five clinical characteristics, and these findings provide evidence for the dysbiotic microbiotal configurations associated with the Bac2 group.
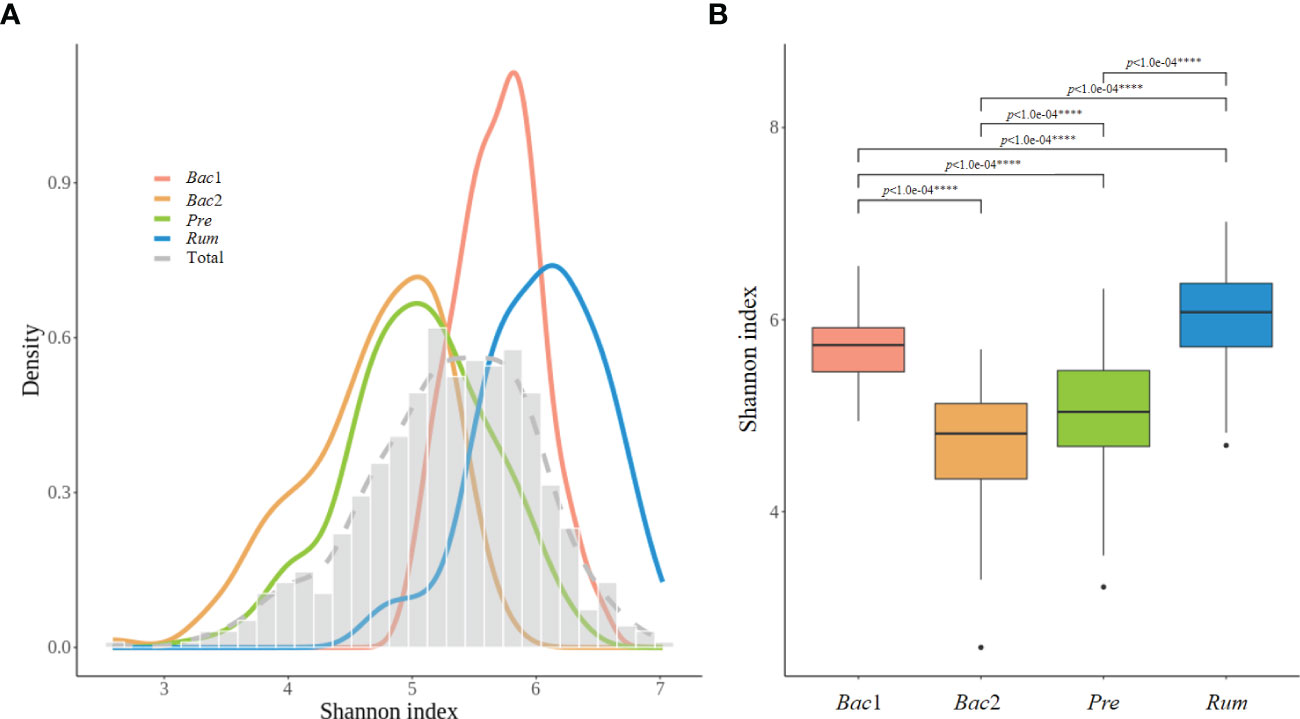
Figure 4 Alpha-diversity of the four enterotypes. (A) Distribution of alpha-diversity between enterotypes, with low diversity corresponding to the Bact2 enterotype and high diversity corresponding to the the Rum enterotype. (B) Box plot representing the first and third quartiles of the distribution of alpha-diversity. The alpha diversity showed significant differences between all each other enterotypes. P-values less than 0.0001 was marked with ****.
We then compared the normotension and hypertension groups for each enterotype. The clinical characteristics of the patients are shown in Table 3. BMI, waist circumference, and age were usually different between the two blood pressure groups for all enterotypes. However, high-density lipoprotein cholesterol (HDL) and triglyceride (TG) levels between the two blood pressure groups were significantly different only in the Bac1 group (Table 3).
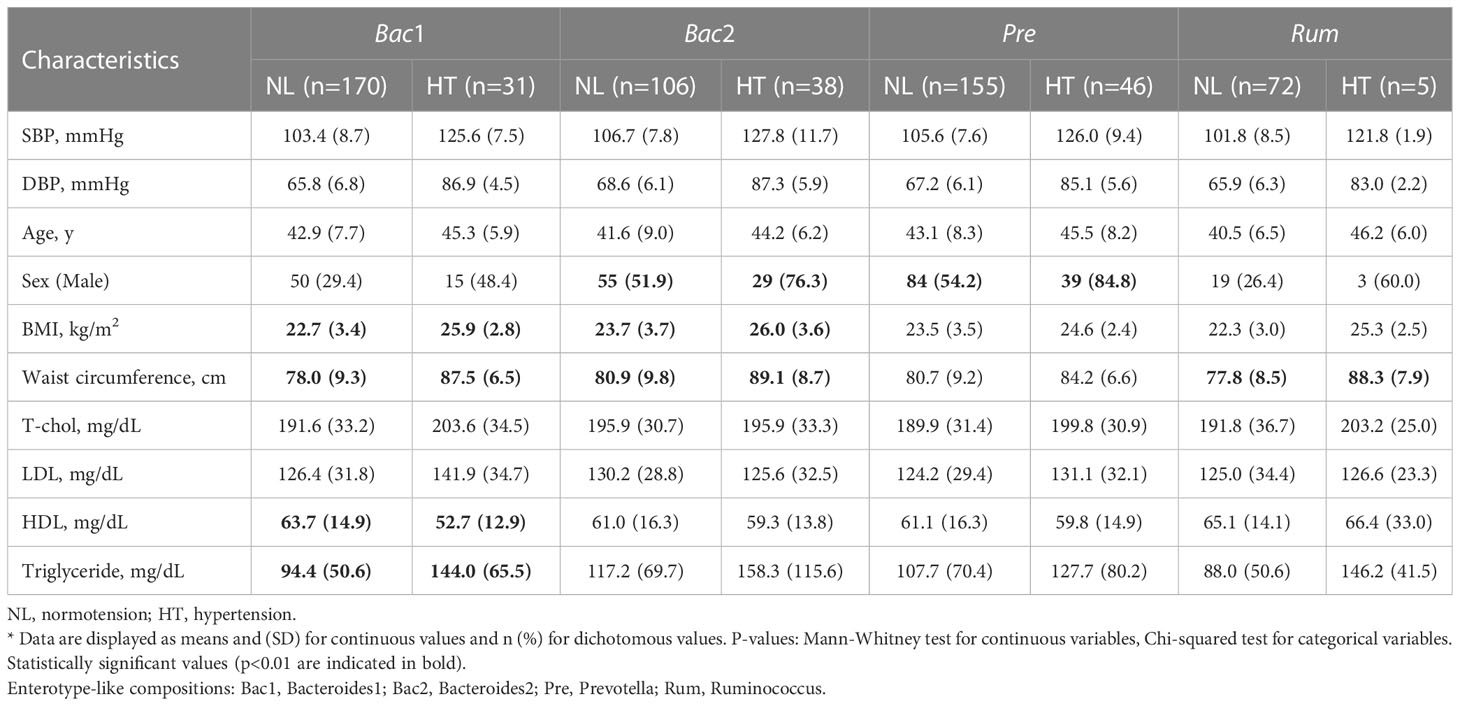
Table 3 Comparison of demographic and clinical characteristics between normotension and hypertension groups in each enterotype.
To evaluate the association between gut microbial features and hypertension with respect to enterotype, we compared the gut microbial features of the normotension and hypertension groups for each enterotype. Notably, the other groups, with the exception of the Bac2 group, did not show any significant differences in alpha diversity between the two blood pressure groups, but the Bac2 group had slightly lower diversity in the hypertension group (Kruskal-Wallis, p=0.087) (Figure 5A). In the analysis of beta diversity, no enterotypes exhibited statistically significant differences between the two blood pressure groups (Supplementary Figure 2). To investigate the distinctive taxa between the two blood pressure groups for each enterotype, we conducted a LEfSe analysis at the genus level. Except for the Rum group, all other groups revealed significant differences in taxonomic composition between the two blood pressure groups (Figures 5B–D). Among the taxa, genera with an LDA score greater than 4 were only detected in the Bac2 group, with depletion of Faecalibacterium, Blautia, and Anaerostipes and enrichment of Megamonas in the hypertension group. We compared these taxa in the entire cohort and found that among the hypertension groups Faecalibacterium in the Bac2 group was significantly lower than that in the Bac1 and Pre groups (Kruskal-Wallis, p<0.01), but the other taxa, Blautia, Anaerostipes, and Megamonas, did not show such differences between the four enterotypes (Figure 6).
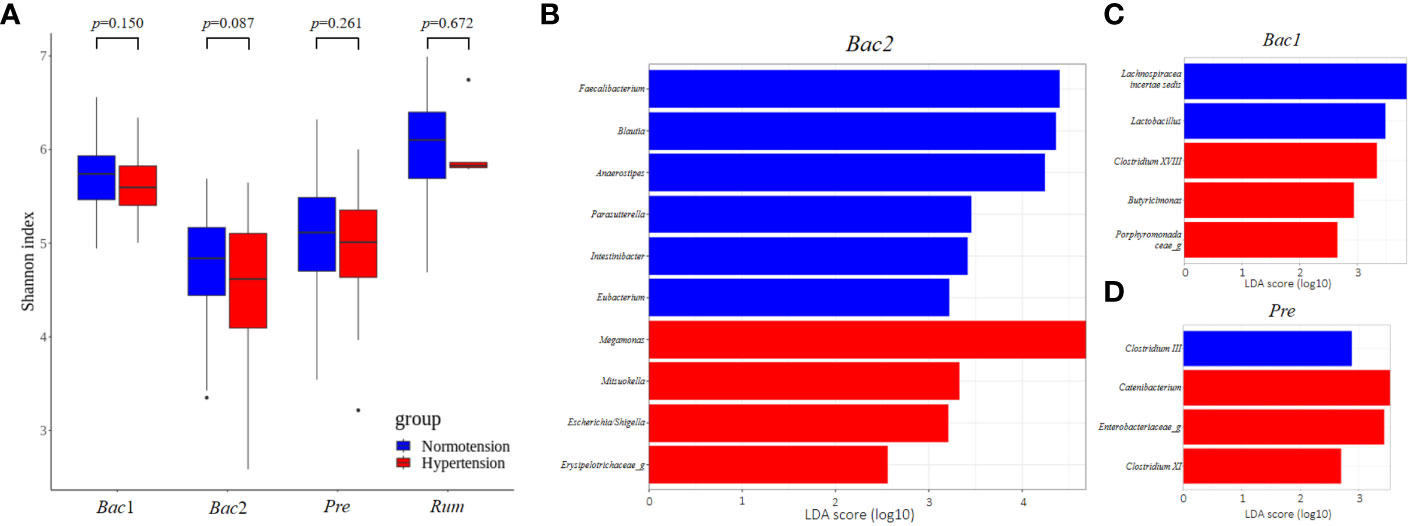
Figure 5 Comparison of gut microbial features between two blood pressure groups in each enterotype. (A) Comparison of alpha-diversity. Of the four enterotypes, only the Bact2 enterotype showed a significantly lower diversity in the hypertension group. (B–D) Linear Discriminant Analysis Effect Size (LEfSe) analysis, showing those genera with significantly different abundances between the two blood pressure groups. There were no significantly different taxa in the Rum enterotype. Significantly different taxa with an LDA score greater than 4 were only found in the Bact2 enterotype.
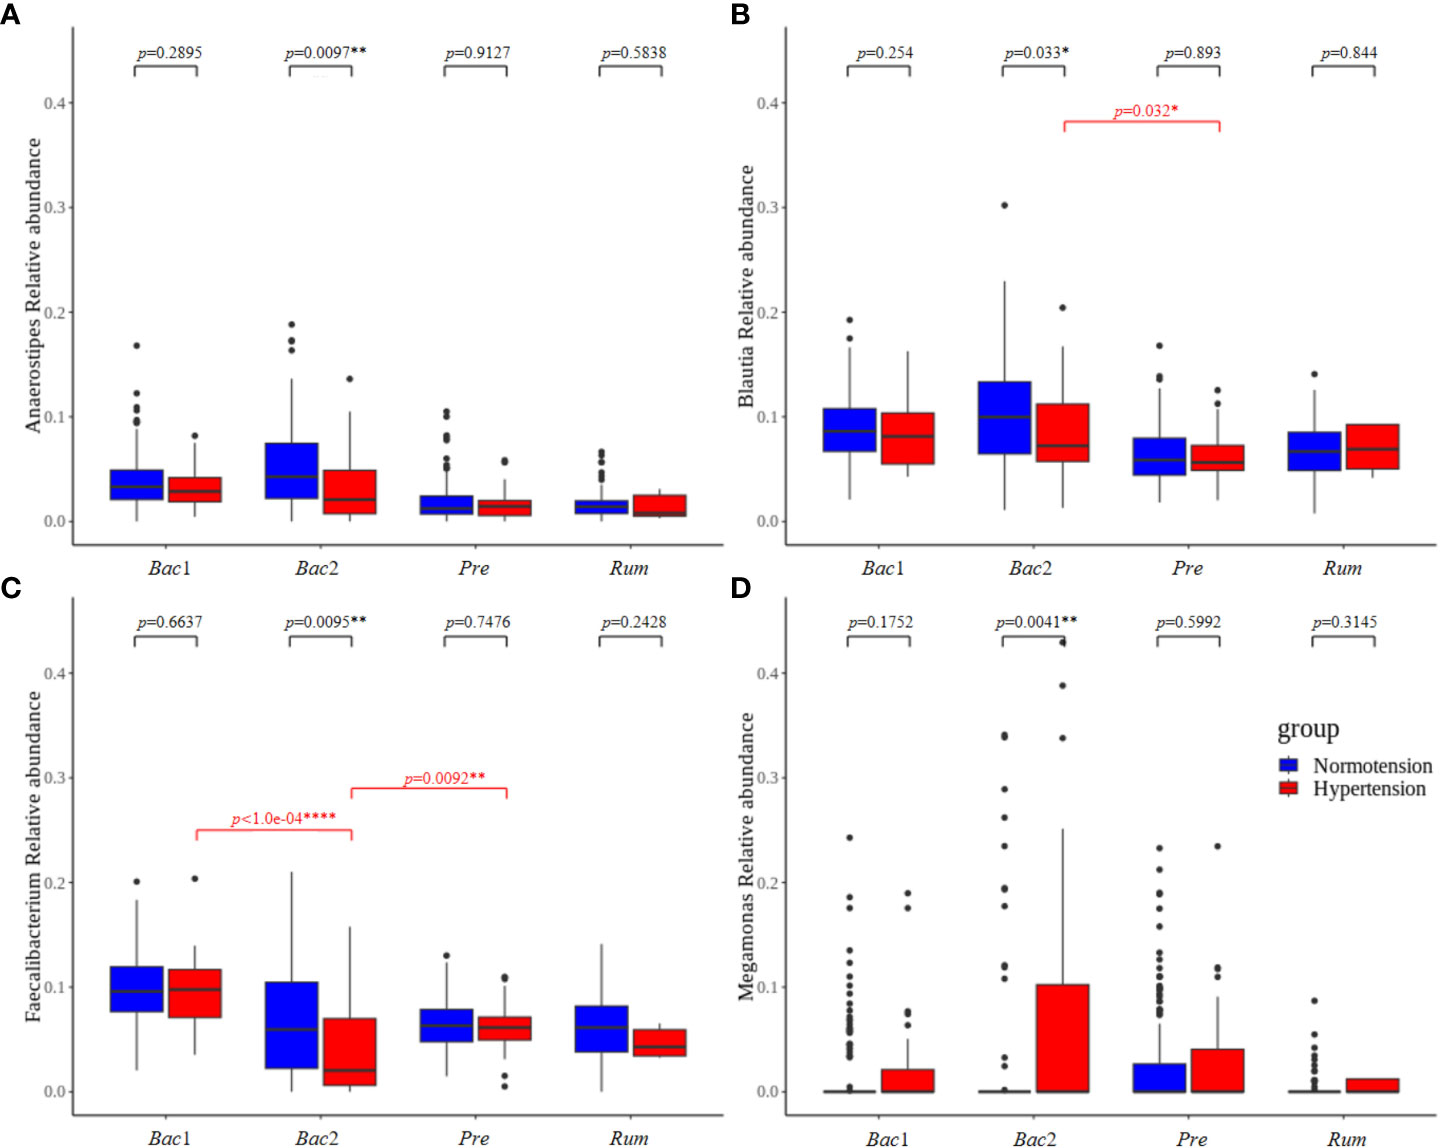
Figure 6 The taxa that showed significant differences between the normotension and hypertension groups belonged to the Bact2 enterotype. Faecalibacterium, Blautia, Anaerostipes, and Megamonas were compared in the entire cohort. Of the hypertension groups, only Faecalibacterium belonging to the Bact2 enterotype was significantly lower than the other enterotypes; the other taxa, Blautia, Anaerostipes, and Megamonas, did not show any significant differences between the hypertension groups of four enterotypes. P-values less than 0.05, 0.01, and 0.0001 were marked with *, **, and ****, respectively.
In the overall comparison of gut microbial features between the normotension and hypertension groups, the latter was associated with low gut microbial diversity and some distinctive taxa, depleted SCFA-producing bacteria, such as Ruminococcacea and Faecalibacterium, and enriched LPS-producing gram-negative bacteria, such as Bacteroidales, Negativiticus, and Megamonas, although there were no significant differences in gut microbial composition. SCFAs are the products of indigestible dietary fiber fermentation by colonic microbes and may alter blood pressure (Marques et al., 2018; Yang et al., 2020). They can directly regulate blood pressure by binding to the SCFA receptor on vascular smooth muscle and endothelial cells. Several animal studies have demonstrated a relationship between hypotensive effects and increased SCFA levels due to high-fiber diet intake, as well as acetate and propionate supplementation (Pluznick et al., 2013; Marques et al., 2017). Bacterial LPS is a representative pathogen-associated molecular pattern that allows human cells to detect bacterial invasion and initiate innate immune response (Matsuura, 2013). Colonic-derived LPS can pass into the circulatory system, thereby increasing the plasma LPS level (termed metabolic endotoxemia) and promoting systemic inflammation involved in various metabolic diseases, such as obesity, diabetes, and non-alcoholic fatty liver disease (Mohammad and Thiemermann, 2020).
In this study, we attempted to analyze the association between gut microbiota and hypertension in terms of enterotype, beyond simply comparing the gut microbiota of normotensive and hypertensive groups, because the microbial architecture is functionally and ecologically different between enterotypes. Enterotypes have generally been defined by the dominance of either Bacteroides, Prevotella, or Ruminococcacea (Arumugam et al., 2011) and are strongly associated with long-term diets. Individuals consuming carbohydrate-rich diets, including dietary fiber and simple sugars, belong to the Prevotella enterotype, whereas those consuming protein-and animal fat-rich diets belong to the Bacteroides enterotype (Wu et al., 2011). Ruminococcaceae is associated with the long-term consumption of fruits and vegetables (Tomova et al., 2019). Considering Korean diets, the Ruminococcaceae enterotype has been linked to adults on a Korean-style balanced diet (Wu X. et al., 2021). Recently, the splitting of the Bacteroides group into two subgroups, Bacteroides 1 and Bacteroides 2, showed that the latter could be linked to lower gut microbial gene richness and clinical characteristics, including severe obesity and systemic inflammation (Aron-Wisnewsky et al., 2019; Vieira-Silva et al., 2020). Our analysis also produced four enterotype clusters, in line with previous reports on gut microbiome community variation (Ding and Schloss, 2014; Vandeputte et al., 2017; Vieira-Silva et al., 2019).
Considering the clinical characteristics among the four enterotypes, the Bac2 enterotype was associated with significantly higher levels of obesity or metabolic syndrome-defining variables, including BMI, waist circumference, triglyceride level, and blood pressure. In addition, the Bac2 enterotype was characterized by lower gut microbial diversity and decreased levels of Faecalibacterium, a potent butyrate-producing bacterium. These findings are consistent with those of most investigators, who suggested that the Bacteroides2 enterotype is a dysbiotic gut microbiome with pro-inflammatory properties and is associated with obesity and inflammation-related diseases. In contrast, the Rum enterotype in our study had the lowest values for these hypertension-related clinical characteristics, as well as the highest gut microbial diversity. The Ruminococcaceae enterotype has been considered abundant for the gut microbe producing anti-inflammatory compounds, causing a lower inflammatory response (Tomova et al., 2019; Alili et al., 2021; Brial et al., 2021; Wu X. et al., 2021; Geng et al., 2022).
Therefore, the gut microbial features identified as being related to blood pressure in the entire cohort, such as gut microbial diversity and relative abundance of SCFA- or LPS-producing bacteria, seemed to be the features associated with the Bac2 or Rum enterotypes rather than those directly related to blood pressure.
We tested the association between gut microbiota and blood pressure for each enterotype to clarify the presence of an enterotype-mediated gut microbial risk pattern determined by the local microenvironment. The results revealed that, with the exception of the Bac2 enterotype, there were no associations between hypertension status and gut microbiota in the Pre, Bac1, and Rum enterotypes. However, the clinical characteristics significantly associated with hypertension in the entire cohort showed significant differences among these three enterotypes. Therefore, the development of hypertension in these enterotypes could be attributed to typical clinical features related to hypertension, such as aging, sex, obesity, or lipid value, rather than the gut microbiota. Interestingly, HDL and TG levels only showed a significant association with hypertension in the Bac1 enterotype. Despite the lack of a precise understanding of the underlying mechanism, it is believed to be related to the animal food-based dietary habits of the Bacteroides enterotype.
Interestingly, only in the Bac2 enterotype, there were differences in the gut microbial features such as the microbial diversity and relative abundance of taxa including Faecalibacterium, Blautia, Anaerostipes, and Megamonas, as well as in the clinical characteristics related to hypertension between the two blood pressure groups. However, among those distinctive taxa, only Faecalibacterium, but not Blautia, Anaerostipes, or Megamonas, was significantly lower in the hypertension group of the Bac2 enterotype than those in the other enterotypes. Although the Bac2 enterotype inherently possesses dysbiotic traits, the observation that the Faecalibacterium proportion of the gut microbiome in the Bac2 enterotype hypertension group was significantly lower than that in the hypertension groups of the other enterotypes implies that hypertension in this particular enterotype is additionally linked to gut microbiome dysbiosis, as well as clinical manifestations.
In particular, butyrate can enter the bloodstream and exert a potent hypotensive effect by preventing vascular inflammation. It can also act on vagal afferent neurons and the central nervous system to affect blood pressure (Onyszkiewicz et al., 2019; Wu Y. et al., 2021). Consistent with previous results, Faecalibacterium which is considered the most potent butyrate-producing bacteria and the biomarker most closely associated with hypertension prevention also revealed to had the strongest association with decreased blood pressure in our study.
We discovered that the clinical phenotypes associated with obesity or metabolic syndrome, including hypertension, showed an unfavorable association with the Bac2 enterotype and a protective relationship with the Rum enterotype. Considering this result, the increasing number of people with hypertension in Korea (Kim et al., 2021) may be related to the increasing prevalence of the Bacteroides enterotype, as well as the loss of microbial diversity and SCFA-producing bacteria in the gut, due to the westernization of diet in the Korean population. Therefore, our findings are consistent with previous reports of lowered cardiometabolic risk profiles in participants consuming diets rich in fruits and vegetables (Borgi et al., 2016).
Furthermore, we found that among the four enterotypes the pro-inflammatory features of depleted SCFA-producing bacteria were associated with hypertension in the dysbiotic Bac2 enterotype, and that the effect of gut microbiota-mediated risk for hypertension might be modulated according to the local microbial environment. Many human intervention studies aimed at reducing blood pressure through the modulation of the gut microbiome using dietary fiber, prebiotics, or postbiotics are ongoing. However, considering our study’s results, it seems that the impact of these interventions may differ depending on the enterotype. Clinical trials with stratification of the target population according to enterotype, and those comparing the effectiveness of SCFAs in reducing blood pressure across different enterotypes, may provide a reference for creating treatment guidelines that screen and select the population in line with microbial modulation as the primary treatment, thus opening up the possibility of a tailored approach in the treatment of hypertension.
To our knowledge, this is the first study to evaluate the association between the gut microbiota and hypertension in a large Korean cohort. This study assessed the enterotype-based relationship between the gut microbiome and hypertension and showed that low-diversity Bacteroides2-enterotype-like composition is associated with hypertension, while the reverse is true for high-diversity Ruminococcus-enterotype-like composition. As well as, the depletion of SCFA-producing bacteria and increase in LPS-producing bacteria as dysbiosis associated with hypertension were significant only in the Bac2 enterotype. Further prospective studies with larger sample sizes or other ethnicities could provide more definitive and significant evidence for assessing the involvement of enterotypes in the association between the gut microbiome and hypertension.
The datasets presented in this study can be found in online repositories. The names of the repository/repositories and accession number(s) can be found below: https://www.ebi.ac.uk/ena, PRJEB56540.
The studies involving human participants were reviewed and approved by Ethics Committee of Gangbuk Samsung Hospital. The patients/participants provided their written informed consent to participate in this study.
JS conceived of the presented idea, planned the experiments and wrote the manuscript. JK and SY developed the theory and performed the computations. M-JK contributed to sample preparation. C-SK supervised the project. All authors contributed to the article and approved the submitted version.
The authors disclosed receipt of the following financial support for the research of this article: This work was supported by the Ministry of Trade, Industry and Energy [grant number 20004368].
JS, SY and C-SK were employed in the GC Genome.
The remaining authors declare that the research was conducted in the absence of any commercial or financial relationships that could be construed as potential conflict of interest.
All claims expressed in this article are solely those of the authors and do not necessarily represent those of their affiliated organizations, or those of the publisher, the editors and the reviewers. Any product that may be evaluated in this article, or claim that may be made by its manufacturer, is not guaranteed or endorsed by the publisher.
The Supplementary Material for this article can be found online at: https://www.frontiersin.org/articles/10.3389/frmbi.2023.1072059/full#supplementary-material
Supplementary Table 1 | Metadata and ASV data for each of the samples
Supplementary Figure 1 | Clinical covariates correlating to microbiome community variation (dbRDA, genus-level Bray–Curtis distance), either independently (univariate effect sizes in black) or in a multivariate model (cumulative effect sizes in grey).
Supplementary Figure 2 | Beta diversity as a principal coordinates analysis (PCoA) plot derived from Bray–Curtis distances of two blood pressure groups in each enterotype. There was no significant difference between the two groups for all four enterotypes. (A) Bac1 enterotype (B) Bac2 enterotype (C) Pre enterotype (D) Rum enterotype
Adnan S., Nelson J. W., Ajami N. J., Venna V. R., Petrosino J. F., Bryan R. M., et al. (2017). Alterations in the gut microbiota can elicit hypertension in rats. Physiol. Genomics 49 (2), 96–104. doi: 10.1152/physiolgenomics.00081.2016
Alili R., Belda E., Fabre O., Pelloux V., Giordano N., Legrand R., et al. (2021). Characterization of the gut microbiota in individuals with overweight or obesity during a real-world weight loss dietary program: a focus on the bacteroides 2 enterotype. Biomedicines 10 (1), 16. doi: 10.3390/biomedicines10010016
Al Khodor S., Reichert B., Shatat I. F. (2017). The microbiome and blood pressure: can microbes regulate our blood pressure? Front. Pediatr. 5, 138. doi: 10.3389/fped.2017.00138
Aron-Wisnewsky J., Prifti E., Belda E., Ichou F., Kayser B. D., Dao M. C., et al. (2019). Major microbiota dysbiosis in severe obesity: fate after bariatric surgery. Gut 68 (1), 70–82. doi: 10.1136/gutjnl-2018-316103
Arumugam M., Raes J., Pelletier E., Le Paslier D., Yamada T., Mende D. R., et al. (2011). Enterotypes of the human gut microbiome. Nature 473, 174–180. doi: 10.1038/nature09944
Bokulich N. A., Kaehler B. D., Rideout J. R., Dillon M., Bolyen E., Knight R., et al. (2018). Optimizing taxonomic classification of marker-gene amplicon sequences with QIIME 2’s q2-feature-classifier plugin. Microbiome 6 (1), 90. doi: 10.1186/s40168-018-0470-z
Bolyen E., Rideout J. R., Dillon M. R., Bokulich N. A., Abnet C. C., Al-Ghalith G. A., et al. (2019). Reproducible, interactive, scalable and extensible microbiome data science using QIIME 2. Nat. Biotechnol. 37 (8), 852–857. doi: 10.1038/s41587-019-0209-9
Borgi L., Muraki I., Satija A., Willett W. C., Rimm E. B., Forman J. P. (2016). Fruit and vegetable consumption and the incidence of hypertension in three prospective cohort studies. Hypertension 67 (2), 288–293. doi: 10.1161/HYPERTENSIONAHA.115.06497
Brial F., Chilloux J., Nielsen T., Vieira-Silva S., Falony G., Andrikopoulos P., et al. (2021). Human and preclinical studies of the host–gut microbiome co-metabolite hippurate as a marker and mediator of metabolic health. Gut 70 (11), 2105–2114. doi: 10.1136/gutjnl-2020-323314
Callahan B. J., McMurdie P. J., Rosen M. J., Han A. W., Johnson A. J. A., Holmes S. P. (2016). DADA2: high-resolution sample inference from illumina amplicon data. Nat. Methods 13 (7), 581–583. doi: 10.1038/nmeth.3869
Ding T., Schloss P. D. (2014). Dynamics and associations of microbial community types across the human body. Nature 509 (7500), 357–360. doi: 10.1038/nature13178
Geng J., Ni Q., Sun W., Li L., Feng X. (2022). The links between gut microbiota and obesity and obesity related diseases. BioMed. Pharmacother. 147, 112678. doi: 10.1016/j.biopha.2022.112678
Holmes I., Holmes I., Harris K., Quince C. (2012). Dirichlet multinomial mixtures: generative models for microbial metagenomics. PloS One 7 (2), e30126. doi: 10.1371/journal.pone.0030126
Kang Y., Cai Y. (2018). Gut microbiota and hypertension: from pathogenesis to new therapeutic strategies. Clin. Res. Hepatol. Gastroenterol. 42 (2), 110–117. doi: 10.1016/j.clinre.2017.09.006
Kim H. C., Cho S. M. J., Lee H., Lee H. H., Baek J., Heo J. E. (2021). Korea Hypertension fact sheet 2020: analysis of nationwide population-based data. Clin. Hypertens. 27 (1), 8. doi: 10.1186/s40885-021-00166-2
Li J., Zhao F., Wang Y., Chen J., Tao J., Tian G., et al. (2017). Gut microbiota dysbiosis contributes to the development of hypertension. Microbiome 5 (1), 14. doi: 10.1186/s40168-016-0222-x
Maifeld A., Bartolomaeus H., Löber U., Avery E. G., Steckhan N., Markó L., et al. (2021). Fasting alters the gut microbiome reducing blood pressure and body weight in metabolic syndrome patients. Nat. Commun. 12 (1), 1970. doi: 10.1038/s41467-021-22097-0
Marques F. Z., Nelson E., Chu P. Y., Horlock D., Fiedler A., Ziemann M., et al. (2017). High-fiber diet and acetate supplementation change the gut microbiota and prevent the development of hypertension and heart failure in hypertensive mice. Circulation 135 (10), 964–977. doi: 10.1161/CIRCULATIONAHA.116.024545
Marques F. Z., Mackay C. R., Kaye D. M. (2018). Beyond gut feelings: how the gut microbiota regulates blood pressure. Nat. Rev. Cardiol. 15 (1), 20–32. doi: 10.1038/nrcardio.2017.120
Matsuura M. (2013). Structural modifications of bacterial lipopolysaccharide that facilitate gram-negative bacteria evasion of host innate immunity. Front. Immunol. 4, 109. doi: 10.3389/fimmu.2013.00109
Mohammad S., Thiemermann C. (2020). Role of metabolic endotoxemia in systemic inflammation and potential interventions. Front. Immunol. 11, 594150. doi: 10.3389/fimmu.2020.594150
Nagase S., Karashima S., Tsujiguchi H., Tsuboi H., Miyagi S., Kometani M., et al. (2020). Impact of gut microbiome on hypertensive patients with low-salt intake: shika study results. Front. Med. (Lausanne) 7, 475. doi: 10.3389/fmed.2020.00475
Nakai M., Ribeiro R. V., Stevens B. R., Gill P., Muralitharan R. R., Yiallourou S., et al. (2021). Essential hypertension is associated with changes in gut microbial metabolic pathways: a multisite analysis of ambulatory blood pressure. Hypertension 78 (3), 804–815. doi: 10.1161/HYPERTENSIONAHA.121.17288
Oksanen J., Blanchet F. G., Kindt R., Legendre P., Minchin P. R., O’Hara R. B., et al. (2014) Vegan: community ecology package. r package version 2.2-0. Available at: http://CRAN.Rproject.org/package=vegan.
Onyszkiewicz M., Gawrys-Kopczynska M., Konopelski P., Aleksandrowicz P., Sawicka A., Koźniewska E., et al. (2019). Butyric acid, a gut bacteria metabolite, lowers arterial blood pressure via colon-vagus nerve signaling and GPR41/43 receptors. Pflugers Arch. 471 (11-12), 1441–1453. doi: 10.1007/s00424-019-02322-y
Oyama J. I., Node K. (2019). Gut microbiota and hypertension. Hypertens. Res. 42 (5), 741–743. doi: 10.1038/s41440-018-0203-5
Palmu J., Salosensaari A., Havulinna A. S., Cheng S., Inouye M., Jain M., et al. (2020). Association between the gut microbiota and blood pressure in a population cohort of 6953 individuals. J. Am. Heart Assoc. 9 (15), e016641. doi: 10.1161/JAHA.120.016641
Pluznick J. L., Protzko R. J., Gevorgyan H., Peterlin Z., Sipos A., Han J., et al. (2013). Olfactory receptor responding to gut microbiota-derived signals plays a role in renin secretion and blood pressure regulation. Proc. Natl. Acad. Sci. U.S.A. 110 (11), 4410–4415. doi: 10.1073/pnas.1215927110
Santisteban M. M., Qi Y., Zubcevic J., Kim S., Yang T., Shenoy V., et al. (2017). Hypertension-linked pathophysiological alterations in the gut. Circ. Res. 120 (2), 312–323. doi: 10.1161/CIRCRESAHA.116.309006
Segata N., Izard J., Waldron L., Gevers D., Miropolsky L., Garrett W. S., et al. (2011). Metagenomic biomarker discovery and explanation. Genome Biol. 12 (6), R60. doi: 10.1186/gb-2011-12-6-r60
Sun S., Lulla A., Sioda M., Winglee K., Wu M. C., Jacobs D. R., et al. (2019). Gut microbiota composition and blood pressure. Hypertension 73 (5), 998–1006. doi: 10.1161/HYPERTENSIONAHA.118.12109
Tomova A., Bukovsky I., Rembert E., Yonas W., Alwarith J., Barnard N. D., et al. (2019). The effects of vegetarian and vegan diets on gut microbiota. Front. Nutr. 6, 47. doi: 10.3389/fnut.2019.00047
Vandeputte D., Kathagen G., D'hoe K., Vieira-Silva S., Valles-Colomer M., Sabino J., et al. (2017). Quantitative microbiome profiling links gut community variation to microbial load. Nature 551 (7681), 507–511. doi: 10.1038/nature24460
Verhaar B. J. H., Collard D., Prodan A., Levels J. H. M., Zwinderman A. H., Bäckhed F., et al. (2020). Associations between gut microbiota, faecal short-chain fatty acids, and blood pressure across ethnic groups: the HELIUS study. Eur. Heart J. 41 (44), 4259–4267. doi: 10.1093/eurheartj/ehaa704
Vieira-Silva S., Sabino J., Valles-Colomer M., Falony G., Kathagen G., Caenepeel C., et al. (2019). Quantitative microbiome profiling disentangles inflammation- and bile duct obstruction-associated microbiota alterations across PSC/IBD diagnoses. Nat. Microbiol. 4 (11), 1826–1831. doi: 10.1038/s41564-019-0483-9
Vieira-Silva S., Falony G., Belda E., Nielsen T., Aron-Wisnewsky J., Chakaroun R., et al. (2020). Statin therapy is associated with lower prevalence of gut microbiota dysbiosis. Nature 581 (7808), 310–315. doi: 10.1038/s41586-020-2269-x
Warton D. I., Wright S. T., Wang Y. (2012). Distance-based multivariate analyses confound location and dispersion effects. Methods Ecol. Evol. 3 (1), 89–101. doi: 10.1111/j.2041-210X.2011.00127.x
Whelton P. K., Carey R. M., Aronow W. S., Casey D. E., Collins K. J., Dennison Himmelfarb C., et al. (2017). ACC/AHA/AAPA/ABC/ACPM/AGS/APhA/ASH/ASPC/NMA/PCNA guideline for the prevention, detection, evaluation, and management of high blood pressure in adults: a report of the American college of Cardiology/American heart association task force on clinical practice guidelines. J. Am. Coll. Cardiol. 71 (19), e127–e248. doi: 10.1161/HYP.0000000000000065
Wu G. D., Chen J., Hoffmann C., Bittinger K., Chen Y. Y., Keilbaugh S.A., et al. (2011). Linking long-term dietary patterns with gut microbial enterotypes. Science 334 (6052), 105–108. doi: 10.1126/science.1208344
Wu X., Unno T., Kang S., Park S. (2021). 33 a Korean-style balanced diet has a potential connection with ruminococcaceae enterotype and reduction of metabolic syndrome incidence in Korean adults. Nutrients 13 (2), 495. doi: 10.3390/nu13020495
Wu Y., Xu H., Tu X., Gao Z. (2021). The role of short-chain fatty acids of gut microbiota origin in hypertension. Front. Microbiol. 12, 730809. doi: 10.3389/fmicb.2021.730809
Yan Q., Gu Y., Li X., Yang W., Jia L., Chen C., et al. (2017). Alterations of the gut microbiome in hypertension. Front. Cell Infect. Microbiol. 7, 381. doi: 10.3389/fcimb.2017.00381
Yang T., Santisteban M. M., Rodriguez V., Li E., Ahmari N., Carvajal J. M., et al. (2015). Gut dysbiosis is linked to hypertension. Hypertension 65 (6), 1331–1340. doi: 10.1161/HYPERTENSIONAHA.115.05315
Keywords: gut microbiome, hypertension, enterotype, Faecalibacterium, diet
Citation: Song JS, Kim JOR, Yoon SM, Kwon M-J and Ki C-S (2023) The association between gut microbiome and hypertension varies according to enterotypes: a Korean study. Front. Microbiomes 2:1072059. doi: 10.3389/frmbi.2023.1072059
Received: 17 October 2022; Accepted: 11 May 2023;
Published: 26 May 2023.
Edited by:
Marcus de Goffau, University of Cambridge, United KingdomReviewed by:
Chih-Yao Hou, National Kaohsiung University of Science and Technology, TaiwanCopyright © 2023 Song, Kim, Yoon, Kwon and Ki. This is an open-access article distributed under the terms of the Creative Commons Attribution License (CC BY). The use, distribution or reproduction in other forums is permitted, provided the original author(s) and the copyright owner(s) are credited and that the original publication in this journal is cited, in accordance with accepted academic practice. No use, distribution or reproduction is permitted which does not comply with these terms.
*Correspondence: Chang-Seok Ki, Y3NraUBnY2NvcnAuY29t
Disclaimer: All claims expressed in this article are solely those of the authors and do not necessarily represent those of their affiliated organizations, or those of the publisher, the editors and the reviewers. Any product that may be evaluated in this article or claim that may be made by its manufacturer is not guaranteed or endorsed by the publisher.
Research integrity at Frontiers
Learn more about the work of our research integrity team to safeguard the quality of each article we publish.