 Shiwei Wang
 Yu Tan
 Qing Luo
 Xinmei Fang
 Hanmingyue Zhu
 Shuying Li
 Yujue Zhou4
 Tianhui Zhu
94% of researchers rate our articles as excellent or good
Learn more about the work of our research integrity team to safeguard the quality of each article we publish.
Find out more
ORIGINAL RESEARCH article
Front. Microbiol., 01 April 2025
Sec. Microbe and Virus Interactions with Plants
Volume 16 - 2025 | https://doi.org/10.3389/fmicb.2025.1551476
Introduction: Phyllosphere-associated microbes directly influence plant-pathogen interactions, and the external environment and the plant shape the phyllosphere microbiome.
Methods: In this study, we integrated 16S rRNA and ITS high-throughput sequencing to systematically investigate changes in the phyllosphere microbiome between symptomatic and asymptomatic walnut leaves affected by spot disease, with consideration of phenological stage progression. Additionally, we explored how abiotic (AT, DT, SCTCC & LPDD) and biotic factors (Pn & Gs) impact microbial communities.
Results: Our findings revealed significant differences in the diversity of the phyllosphere microbiome between symptomatic and asymptomatic leaves at the same phenological stage. Furthermore, the structure and function of phyllosphere-associated microbiome changed as the phenological stage progressed. Fungal taxa that related to the function Plant_Pathogen and bacterial taxa that related to the KEGG pathway functions Fatty acid biosynthesis and Biotin metabolism were increased in the symptomatic group. The keystone species driving the walnut phyllosphere microbiome was Pseudomonas spp., which substantially influenced the microbiome of symptomatic vs. asymptomatic leaves. Notably, Pseudomonas spp. interacted with Xanthomonas spp. and Pantoea spp. Correlation analysis revealed that the dew point temperature constituted the primary abiotic factor of phyllosphere bacterial community composition, whereas liquid precipitation depth dimension was identified as the dominant factor shaping fungal taxa. Additionally, leaf net photosynthetic rate and stomatal conductance were closely linked to the phyllosphere microbiome.
Discussion: These results advance our understanding of community-level microbial responses to pathogen invasion and highlight the multifactorial drivers of phyllosphere microbiome assembly. Ultimately, they contribute to predicting and managing walnut leaf-related diseases.
In nature, plants and microorganisms form an intricate network. They can colonize the surface or interior of plants and be classified as rhizosphere microorganisms, phyllosphere microorganisms, seed microorganisms, and more, depending on the location of their habitats. Research on the plant microbiome has historically focused on the soil and rhizosphere microbiomes, with nearly three times more attention than on the phyllosphere microbiome (Koskella, 2020). The phyllosphere microbiome primarily resides in the above-ground part of the plant, and the foliar microbiome alone can contain up to 1026 bacterial cells, originating from sources such as air, rain, and insects (Peñuelas and Jaume, 2014). Additionally, soil microorganisms can be transferred to the phyllosphere through the xylem and phloem (Bell et al., 2021). Abiotic factors—such as temperature, humidity, light, and nutrients—influence the phyllosphere microbial community, while biotic factors such as plant species, age, and condition also play a role (Laforest-Lapointe et al., 2016; Li et al., 2021; Alsanius et al., 2017; Thapa et al., 2017; Chen et al., 2021). Plant-microbe-environment interactions become more crucial given the growing impact of human activities and environmental degradation on plant ecosystems in recent years. Like rhizosphere microorganisms, phyllosphere microorganisms are crucial for maintaining host homeostasis and enhancing host defense through microbial interactions, host metabolism regulation, and immune system triggering (De Mandal and Jeon, 2023). The phyllosphere microbiome experiences changes in diversity and abundance under biotic or abiotic stresses, influenced by microbial interactions involving keystone taxa—key regulators that shape community structure (Agler et al., 2016). The host and microbiome engage in two-way cooperative strategies, such as biomass production and nitrogen fixation, to boost host growth and facilitate plant recruitment of microorganisms in the phyllosphere for pathogen defense (Abadi et al., 2020; Li et al., 2022). The phyllosphere microbiome can be influenced by plant leaf infections, often manifesting as a reduction in diversity and a shift in dominant communities, and it has been demonstrated in studies on soybean, tomato, and Arabidopsis thaliana that these changes play a crucial role in maintaining plant health (Chen et al., 2020; Díaz-Cruz and Cassone, 2022; Ehau-Taumaunu and Hockett, 2023; Goossens et al., 2023). To gain a deeper understanding of plant-microbe, microbe-microbe, and plant-microbe-environment interactions, exploring the relationship between pathogen invasion and the phyllosphere microbiome at the community level is essential.
Walnut (Juglans regia L.) leaf spotting diseases, including black spot, brown spot, and wilt, occur worldwide and can induce a wide range of destructive symptoms. These symptoms range from damage to leaves, branches, and fruits, severely jeopardizing their growth and yield. Interestingly, walnut pathogens that cause foliar diseases show multi-pathogen complex infestations or cross-over. Specifically, Xanthomonas campestris pv. juglandis is the primary causal agent for walnut black spot disease. Additionally, Pseudomonas syringae, Pantoea agglomerans, and Alternaria spp. serve as companion pathogens (Keshtkar et al., 2016). However, Pseudomonas flavescens, Alternaria spp., and Fusarium spp. are reported as the pathogens responsible for causing walnut blight (Kałużna et al., 2014; Kim et al., 2020), Fusarium spp., Alternaria spp., Phomopsis spp., Cladosporium spp., and Colletotrichum spp. contribute to brown spot disease in walnuts (Liu et al., 2023). Maybe pathogen crossover partly explains why disease etiology is not always straightforward under natural conditions; rather, disease occurs due to interactions between multiple pathogens. The phyllosphere microbiome may offer some resistance to leaf diseases, and understanding how the phyllosphere microbiome responds to walnut leaf spotting diseases can aid in developing more effective strategies for prevention and control.
In this study, we integrated high-throughput sequencing to investigate and compare the phyllosphere microbiomes between symptomatic (black/brown/any abnormal spots) and asymptomatic leaves from walnut trees under natural field conditions. This study aimed to (i) characterize the composition, diversity, and structural shifts in the phyllosphere microbiome between symptomatic and asymptomatic leaves, (ii) analyze how changes in phyllosphere microbial diversity and community structure affect microbiome functions, and (iii) analyze whether and how the phyllosphere microbiome of symptomatic and asymptomatic leaves is affected by abiotic and biotic factors in different phenological stages. The results provide potential insights for managing leaf diseases in walnuts, which are globally significant nuts.
Two groups of leaf samples (symptomatic and asymptomatic) of Juglans regia L. (“chuanzao” cultivar) were collected from an orchard in Ma Lie Township, Hanyuan County, Ya’an City, Sichuan Province, China (29°20ʹ N, 102°46ʹ E). The symptomatic and asymptomatic leaves were identified based on visual spotting disease symptoms (black/brown/any abnormal spots disease area) and the degree of disease (Supplementary Figure S1; Supplementary Table SI). Five asymptomatic and five symptomatic walnut trees, each of similar size and growth conditions, were selected. Sixty leaves (symptomatic or asymptomatic) per tree were collected; five well-developed and fully mature leaves were selected from each canopy layer (upper, middle, and lower) in every direction (east, west, south, and north). All leaves were carefully placed in sterile Ziploc bags, promptly transported to the laboratory within 12 h, and stored at −80°C. Symptomatic or asymptomatic leaves at each sampling time point were homogeneously mixed evenly, and 50 leaves of similar size from the same tree were chosen as one sample for high-throughput sequencing analysis in this study. The sampling timing was determined based on the phenological stage of walnuts, including the fact that leaves were sampled at five time points across the season, aiming to reflect the dynamics of the microbial community on walnut leaves. Sampling periods included mid-May (leaf expansion period), mid-June (after the leaves were fully expanded), early July to late August (fruit swelling), late August to early September (the core-hardening stage), and early October (before leaves fell) in 2018. Asymptomatic (healthy, he) leaves were marked as HE/he groups, and symptomatic (infected, in) leaves were marked as IN/in groups, upper case letters are fungal samples, and lower case letters are bacterial samples, as shown in Supplementary Table SI.
The collection of microorganisms on the leaves referenced the methods by Donegan et al. (1991), Rossetti et al. (2017) and Fan et al. (2024), and certain modifications were made. After mixing the 50 walnut leaves, 30 leaves were selected and cut into 5 × 5 mm fragments using scissors (sterilized at 121°C). Subsequently, the pieces were transferred to a sterilized triangular flask, and 200 mL of sterile 0.9% NaCl solution was added. The flask was sealed with a breathable sealing membrane and incubated on a shaker at 4°C, 120 rpm for 1 h. Afterward, the walnut leaf residue was filtered through a layer of sterile gauze, and the resulting filtrate was centrifuged at 14,000 × g, 4°C for 30 min. The precipitate was resuspended in a small sterile 0.9% NaCl solution. This same processing procedure was applied to each sample. Asymptomatic and symptomatic leaves constituted five distinct groups per time point of samples. Total genomic DNA was extracted using the modified cetyltrimethylammonium bromide (CTAB) method (Stewart and Via, 1993).
The primers 515F (5’-GTGCCAGCMGCCGCGG-3′) and 806R (5’-GGACTACHVGGGTWTCTAAT-3′) were used for the amplification of the bacterial 16S rRNA V4 region and the primers ITS5-1737F (5’-GGAAGTAAAAGTCGTAACAAGG-3′) and ITS2-2043R (5’-GCTGCGTTCTTCATCGATGC-3′) were used for the amplification of the fungal ITS1 region. The library was constructed using a TruSeq® DNA PCR-Free Sample Preparation kit. The completed library was quantified by Qubit and Q-PCR and sequenced using a HiSeq 2,500 PE250 platform. Paired-end reads were assigned to samples based on their unique barcode and truncated by cutting off the barcode and primer sequence, then they were merged using FLASH (V1.2.7),1 and the splicing sequences were called raw tags. The spliced sequences were filtered to obtain high-quality tags in the effective tags. Sequences with ≥97% similarity were assigned to the same operational taxonomic units (OTUs) by Uparse software (Uparse v7.0.1001).2 Species classification was performed with the Mothur algorithm (Schloss et al., 2009) and the SILVA132 SSU rRNA database,3 applying a confidence threshold of 0.8–1. This pipeline generated taxonomic information and community composition profiles across all hierarchical levels (kingdom to species).
QIIME (Version 1.9.1) was used to analyze the samples’ PD_whole_tree, Shannon, Simpson, Chao1, and ACE diversity index to analyze the alpha diversity of the samples (Caporaso et al., 2010). Bar and Venn diagrams were used to visualize the uniqueness and overlap of OTUs detected in symptomatic versus asymptomatic leaves across five sampling time points. We combined multiple sequence comparisons and relative abundance comparisons to analyze changes in microbial community compositions. Non-metric multi-dimensional scaling (NMDS) and multiple response permutation procedure (MRPP) were conducted at the genus level to investigate differences in microbial community structure between groups. Species differing between groups were further analyzed based on linear discriminant analysis effect size (LEfSe) and similarity percentage (SIMPER) analysis. For network analyses, co-occurrence networks of the samples were performed using the Spearman correlation calculated to assess the complexity of the interactions in phyllosphere microbiota. The function prediction of fungal and bacterial OTUs was performed with the FUNGuild and PICRUSt2.
Air temperature (AT), dew point temperature (DT), sky condition total coverage code (SCTCC), and liquid precipitation depth dimension - six-hour duration (LPDD) with microbial communities were analyzed by canonical correspondence analysis/redundancy analysis (RDA/CCA) analysis, Mantel analysis (Mantel-test), and Spearman correlation calculated. These are used to explain the degree of correlation between environmental factors and community and species distributions. Further, variance partitioning analysis (VPA) was conducted to quantify the amount of species distribution explained by one or more of these factors. Environmental data can be accessed from the National Oceanic and Atmospheric Administration, National Centers for Environmental Information.4
A Li-6800 portable photosynthesis-fluorescence analyzer (Li-Cor, Lincoln, NE, United States) was used for leaf photosynthetic properties. The flow rate was 500 μmol·s−1, the concentration of CO2 was 400 μmol·mol−1, the photosynthetic active radiation was 800 μmol·m−2s−1, and the time 9:00–11:30 (at every sampling time point) was when we measured the photosynthetic index. Walnut trees which selected to collect high-throughput sequencing analysis samples as biological replicates for each sampling. Three mature leaves at the middle canopy layer were sampled from each tree, with the most severe infection site as the central measurement point. Net photosynthetic rate (Pn) and stomatal conductance (Gs) measurements were conducted in triplicate and averaged for statistical analysis. Sampling positions on asymptomatic leaves were designated using the corresponding measurement point on symptomatic leaves as central reference points for physiological assessments. The effects of leaf photosynthetic characteristics on the phyllosphere microbial community were analyzed by canonical correspondence analysis/redundancy analysis (RDA/CCA).
The Wilcox test was employed to assess the statistical significance of differences in relative abundance between sample groups, and the Bray-Curtis distance was used to analyze the extent of differences between sample groups and their community distribution patterns. R software (version 3.6.3, the R Foundation for Statistical Computing, Vienna, Austria) was used for NMDS, MRPP, LEfSe, SIMPER, CCA/RDA, Mantel-test, and VPA, even generating figures. Co-occurrence networks were generated by Graphviz (version 2.38.0) and Cytoscape (version 3.9.1). FUNGuild and PICRUSt2 were carried out through the free online platform of Wekemo Bioincloud.5
In this study, we obtained 75,476 sequences for 16S rRNA amplicon sequencing and 83,312 sequences for ITS1 amplicon sequencing from each group of leaf samples. The bacterial and fungal sequence data were deposited in the NCBI database under the SRA accession of PRJNA873261 and PRJNA600291, respectively. After data analysis, high-quality sequences were clustered into 1,998 16S rRNA and 2,155 ITS operational taxonomic units (OTUs) with 97% identity. Between-group community differences (HE vs. IN) in fungi was published in a separate paper.6 Phyllosphere bacterial community composition also differed between the symptomatic and asymptomatic groups. At each sampling time, the percentage of shared OTUs (% = shared OTUs/total OTUs) in the symptomatic and asymptomatic groups each were 76.23%, 39.58%, 40.43%, 47.22 and 54.56% (Figure 1A). Asymptomatic leaves also differed in the community composition of bacteria at different phenological stages of walnut. The proportion of shared OTUs was slightly higher in the symptomatic groups (4.91%) than in the asymptomatic groups (3.82%) throughout the sampling cycle (Figures 1B,C).
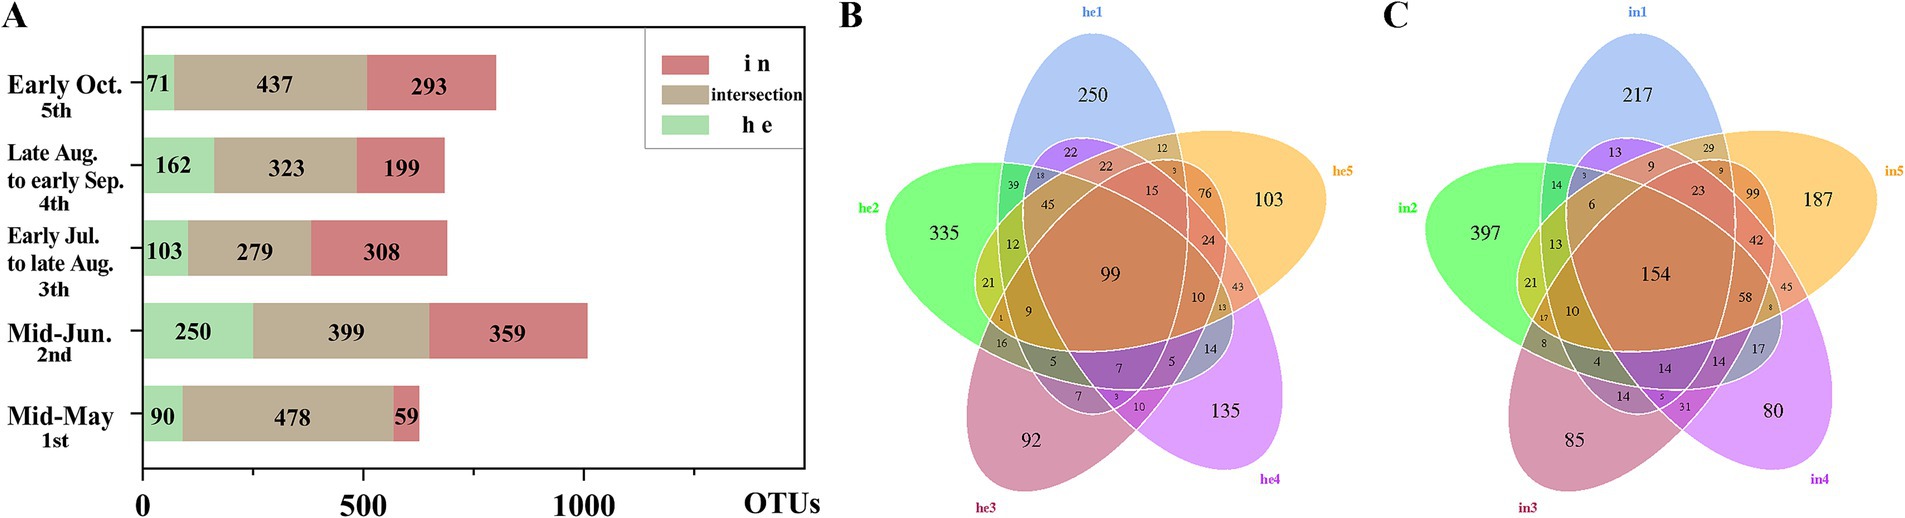
Figure 1. Differences in overall composition with symptomatic and asymptomatic walnut phyllosphere microbial communities at operational taxonomic unit (OTU) level. (A) Stacked bar charts: differences in shared and exclusive OTUs of microbial communities in symptomatic and asymptomatic leaves at each sampling time for bacteria; (B) Flower plot: differences in the number of OTUs in samples from the asymptomatic group at different sampling times; (C) Venn plot: differences in the number of OTUs in samples from the symptomatic group at different sampling times.
Alpha diversity indices include Shannon, Chao1, ACE, PD_whole_tree, and Simpson (Supplementary Table SII). Bacterial community richness and diversity were higher in the symptomatic group compared to the asymptomatic group in the same period. With the development of the phenological period, the phyllosphere bacterial richness index (Chao1) and diversity index (Shannon) changed, and two indices are highly significant differences (p-value <0.001) were observed at both the he3 vs. in3 and he5 vs. in5 (Figures 2A,B; Table 1). NMDS at the genus level (Stress <0.2) quantified shifts in walnut phyllosphere microbiota. Peak community distance between symptomatic and asymptomatic leaves occurred at the third sampling. As the phenological period progressed, phyllosphere fungal communities clustered in the fourth and fifth samplings, while bacterial communities remained relatively separated at each sampling, indicating that the phenological period affects bacteria more than fungi (Supplementary Figures S3A,B). Further, the multiple response permutation procedure (MRPP) showed that infection significantly impacted (p < 0.05) the diversity of phyllosphere microbial bacterial communities (Table 2).
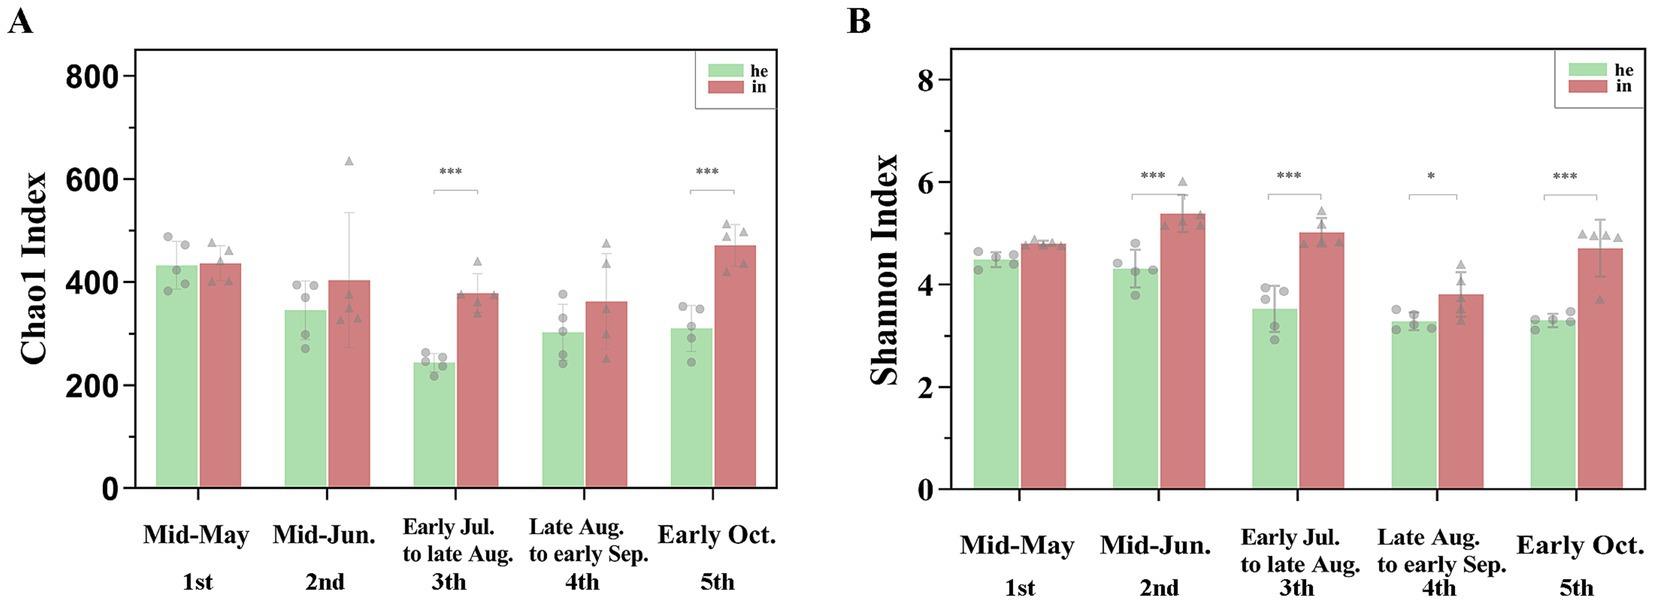
Figure 2. Differences in richness and diversity indices of phyllosphere microbial communities associated with symptomatic and asymptomatic walnut leaf. (A) Chao1 index for richness; (B) Shannon index for diversity. Different number of * indicate significant differences between symptomatic and asymptomatic walnut leaf, as follows: *0.01 < p ≤ 0.05; **0.001 < p ≤ 0.01; ***p ≤ 0.001.
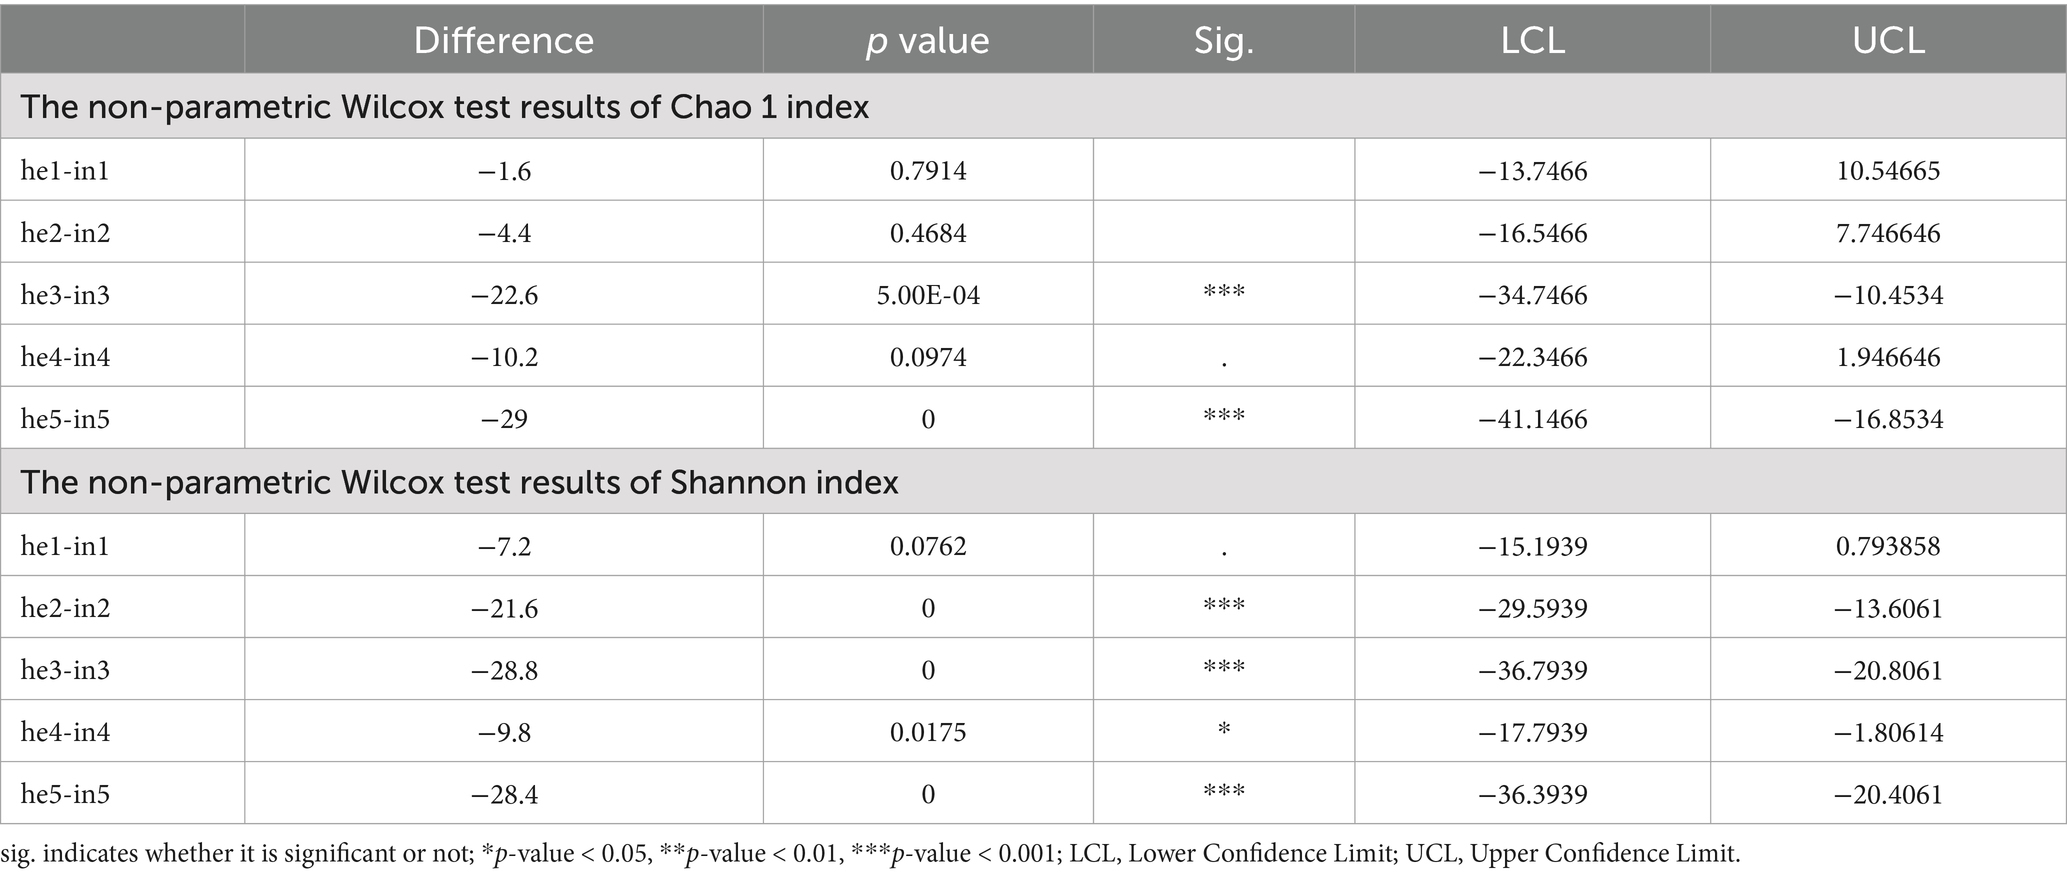
Table 1. The non-parametric Wilcox test results.
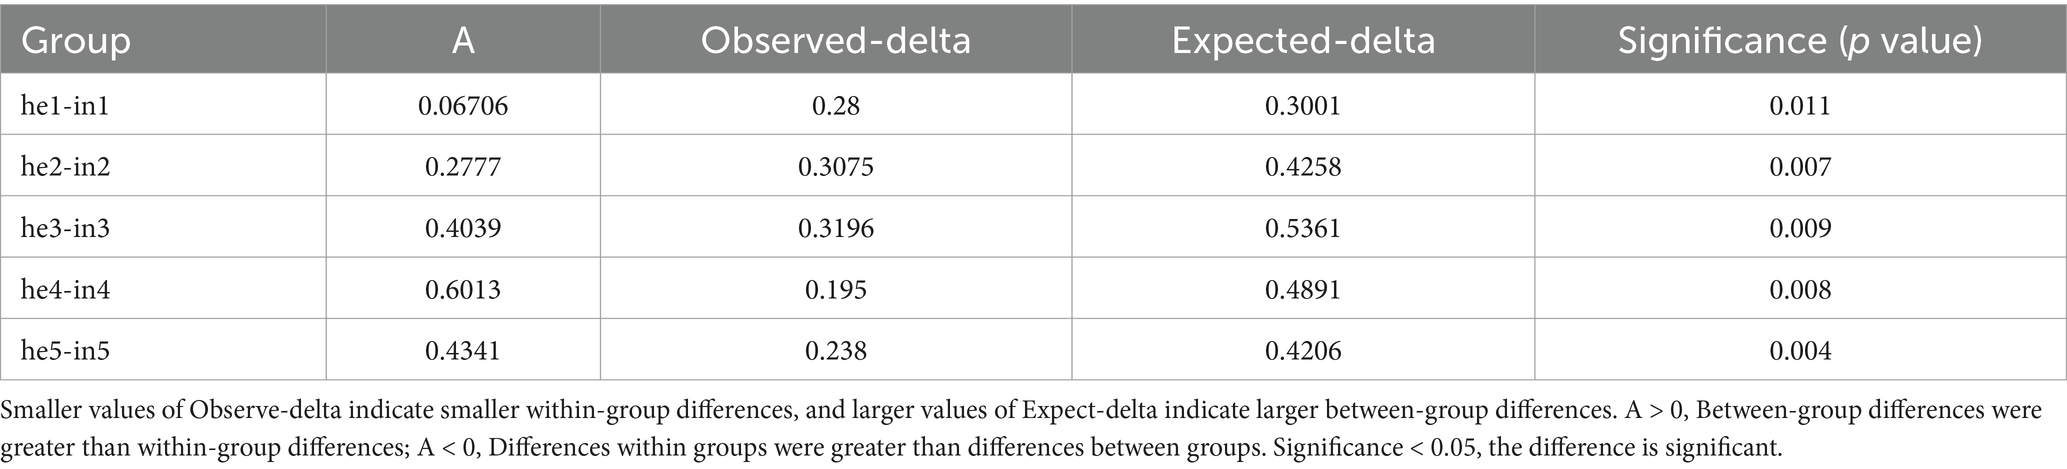
Table 2. Multiple response permutation procedure (MRPP) of differences in phyllosphere bacteria structure between symptomatic and asymptomatic group.
We analyzed the relative abundance of bacterial species to assess community composition across conditions. At the phylum level, the dominant ones for the symptomatic groups (in1–in5) and asymptomatic groups (he1–he5) mainly included Proteobacteria, Oxyphotobacteria, and Bacteroidetes (Figure 3A). At the genus level, the relative abundance of Pseudomonas spp. and Xanthomonas spp. was significantly higher in in3, in4, in5 than in he3, he4, he5 (Figures 3B,C). The relative abundance of Pseudomonas spp. increased 237.79-fold, and that of Xanthomonas spp. increased 289.93-fold in the third sample (Figures 3B,C; Supplementary Table SIII).

Figure 3. Abundance and composition of phyllosphere microbe. Relative abundance by bacterial group analysis of (A) the top 10 at the phylum level, (B) the top 35 at the genus level. Heatmap clustering of bacteria (C) at the genus level, cluster analysis was based on the Bray–Curtis method and only the top 35 abundant genera were included. Columns represent different sample groups, and rows represent different genera. On the left is the hierarchical clustering at the phylum level, light-pink, cyan-blue, light-coral, light-blue, light-yellow, and light-green represent Actinobacteria, Bacteroidetes, Deinococcus-Thermus, Firmicutes, Oxyphotobacteria, and Proteobacteria, respectively. Color represents relative abundance (by Z-score) from low (blue, −2) to high (red, 2). Sankey Diagram (D), the classification of microorganisms at different levels; the three columns represent the three levels of family-genus-species.
Sankey diagram was used to represent the pathogenic bacteria and biocontrol potential bacteria of walnut leaf spotting diseases. The relative abundance of Xanthomonas spp. was higher in the symptomatic groups (in) than in the asymptomatic groups (he) throughout the sampling cycle, reaching a maximum in the third sampling time and gradually decreasing with the disease progression. Pseudomonas spp. occupied the largest proportion of all samples, and the relative abundance of Erwinia spp. was slightly higher than that of Xanthomonas spp. in both symptomatic and asymptomatic groups; the relative abundance of Xanthomonas spp. in symptomatic groups was higher than that in asymptomatic groups during the same sampling time (Figure 3D; Supplementary Table SIII).
Phyllosphere bacterial microbial taxa from phylum to genus were identified between symptomatic and asymptomatic walnut leaf groups using linear discriminant analysis and the effect size analysis. Throughout the sampling cycle, the microbial communities of the symptomatic groups were significantly (p < 0.05) altered compared to the asymptomatic groups (Figure 4A; Table 2); it is characterized by the high relative abundance of 11 genera, including Xanthomonas spp., Pseudomonas spp., and Pantoea spp., which play an important role as biomarkers in the symptomatic phyllosphere microbiome. While unidentified Oxyphotobacteria, Methylobaterium, Aureimonas, and unidentified Enterobacteriaceae as biomarkers in the asymptomatic group. Among them, the symptomatic groups were most affected by Pseudomonas spp., and Oxyphotobacteria spp. had the maximum LDA score among the asymptomatic groups.
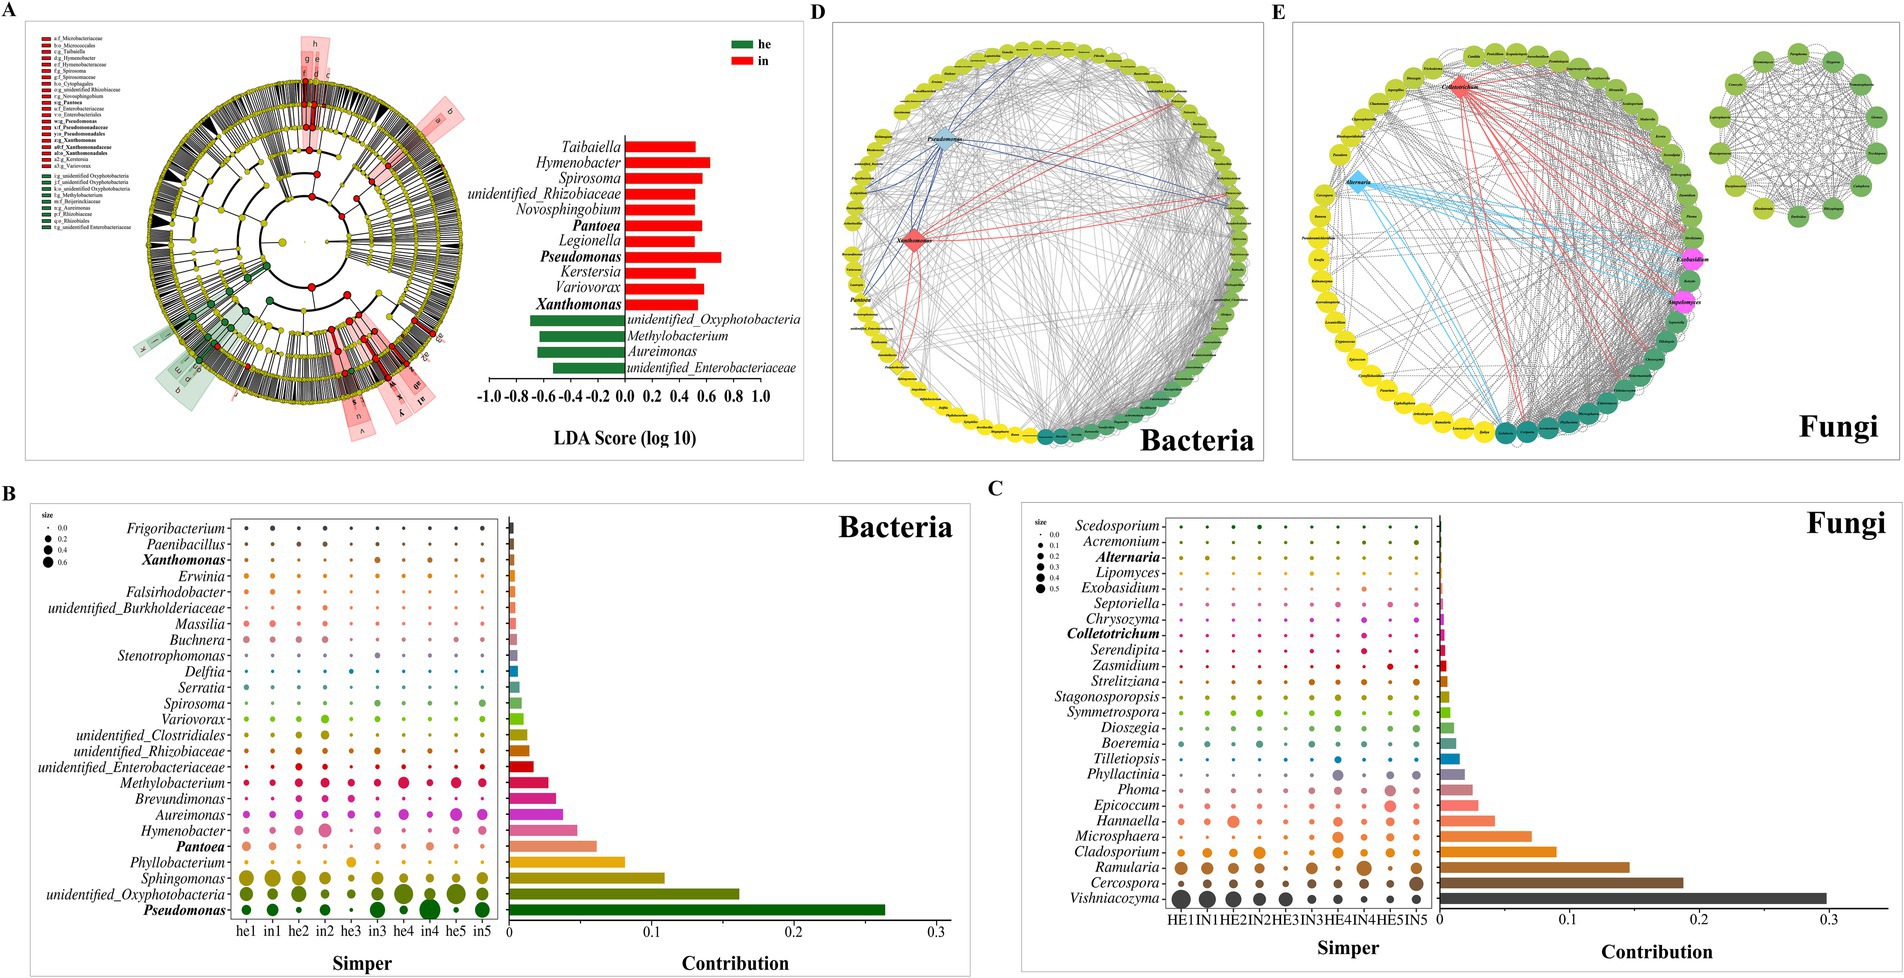
Figure 4. Differences in phyllosphere microbial community structure of walnut leaf in different groups. (A) Cladograms of linear discriminant analysis coupled with the effect size analysis with logarithmic linear discriminant analysis >3.25 (p < 0.05) reveals the differences in abundant taxa of phyllosphere bacterial communities between symptomatic and asymptomatic group at phylum to genus levels. (B,C) Contribution of phyllosphere bacteria and fungi at the genus levels to intergroup differences between symptomatic and asymptomatic walnut leaf, similarity percentage was based on Bray–Curtis distances and only the top 25 genera were included. Bubble size represents the relative abundance of the species, Contribution is the value of the species’ contribution to the variability of the symptomatic and asymptomatic group. (D,E) Genus-level species correlation network diagram, the top 100 at the genus level were calculated based on Spearman correlation coefficients, with correlation coefficients greater than 0.6 in absolute value and p < 0.05 as valid connections. Node color represents connectivity at the genus level from low (lighter) to high (darker).
Similarity percentage (SIMPER) was used to identify the major species driving phyllosphere microbial community patterns. The analysis of phyllosphere bacteria between asymptomatic and symptomatic groups (he vs. in) showed that Pseudomonas spp. ranked first and accounted for 26.38% of the total Bray-Curtis difference between symptomatic and asymptomatic groups, Pantoea spp. accounted for 6.14%, Xanthomonas spp. accounted for 0.35% (Figure 4B). In comparing fungal asymptomatic and symptomatic groups (HE vs. IN), Vishniacozyma spp. contributed the highest value, while the Cladosporium spp., Colletotrichum spp., and Alternaria spp. contributed 8.98, 0.33, and 0.11%, respectively, of the total difference (Figure 4C).
A species correlation network diagram of the asymptomatic and symptomatic leaf group’s core genera was constructed. The asymptomatic and symptomatic phyllosphere microbiomes were identified to be related to each other, forming co-occurrence networks (correlation coefficients greater than 0.6 in absolute value and p < 0.05; Figures 4D,E; Supplementary Tables SV, SVI). It showed that Xanthomonas spp. with Pseudomonas spp., Pseudarthrobacter spp., Pelomonas spp. and Paracoccus spp., Pseudomonas spp. with Pantoea spp. had valid connections (p < 0.05). Besides, both the Colletotrichum spp. and Alternaria spp. had valid connections with Exobasidium spp., Ampelomyces spp.
The FUNGuild analysis showed that the relative abundance of fungal taxa associated with Plant_Pathogen functions in the symptomatic walnut phyllosphere was increased by up to 30.33% higher than the asymptomatic phyllosphere during the sampling period. In contrast, asymptomatic fungi exhibited a higher relative abundance of taxa linked to Fungal Parasite-Undefined Saprotroph functions from the first to fourth sampling time (Figure 5A; Supplementary Figure S2). Additionally, fungal taxa related to Fungal_Parasite functions in the symptomatic group showed a 12.17 to 31.65% lower relative abundance compared to the asymptomatic group (Figure 5A; Supplementary Figure S2). On the other hand, the PICRUSt2 analysis indicated that infection increased the relative abundance of phyllosphere bacterial taxa associated with the KEGG pathway functions of Fatty acid biosynthesis and Biotin metabolism. Conversely, asymptomatic groups accumulated more bacterial taxa enriched in Cell cycle -Caulobacter and Streptomycin biosynthesis functions than symptomatic groups (Figure 5B; Supplementary Figure S2).
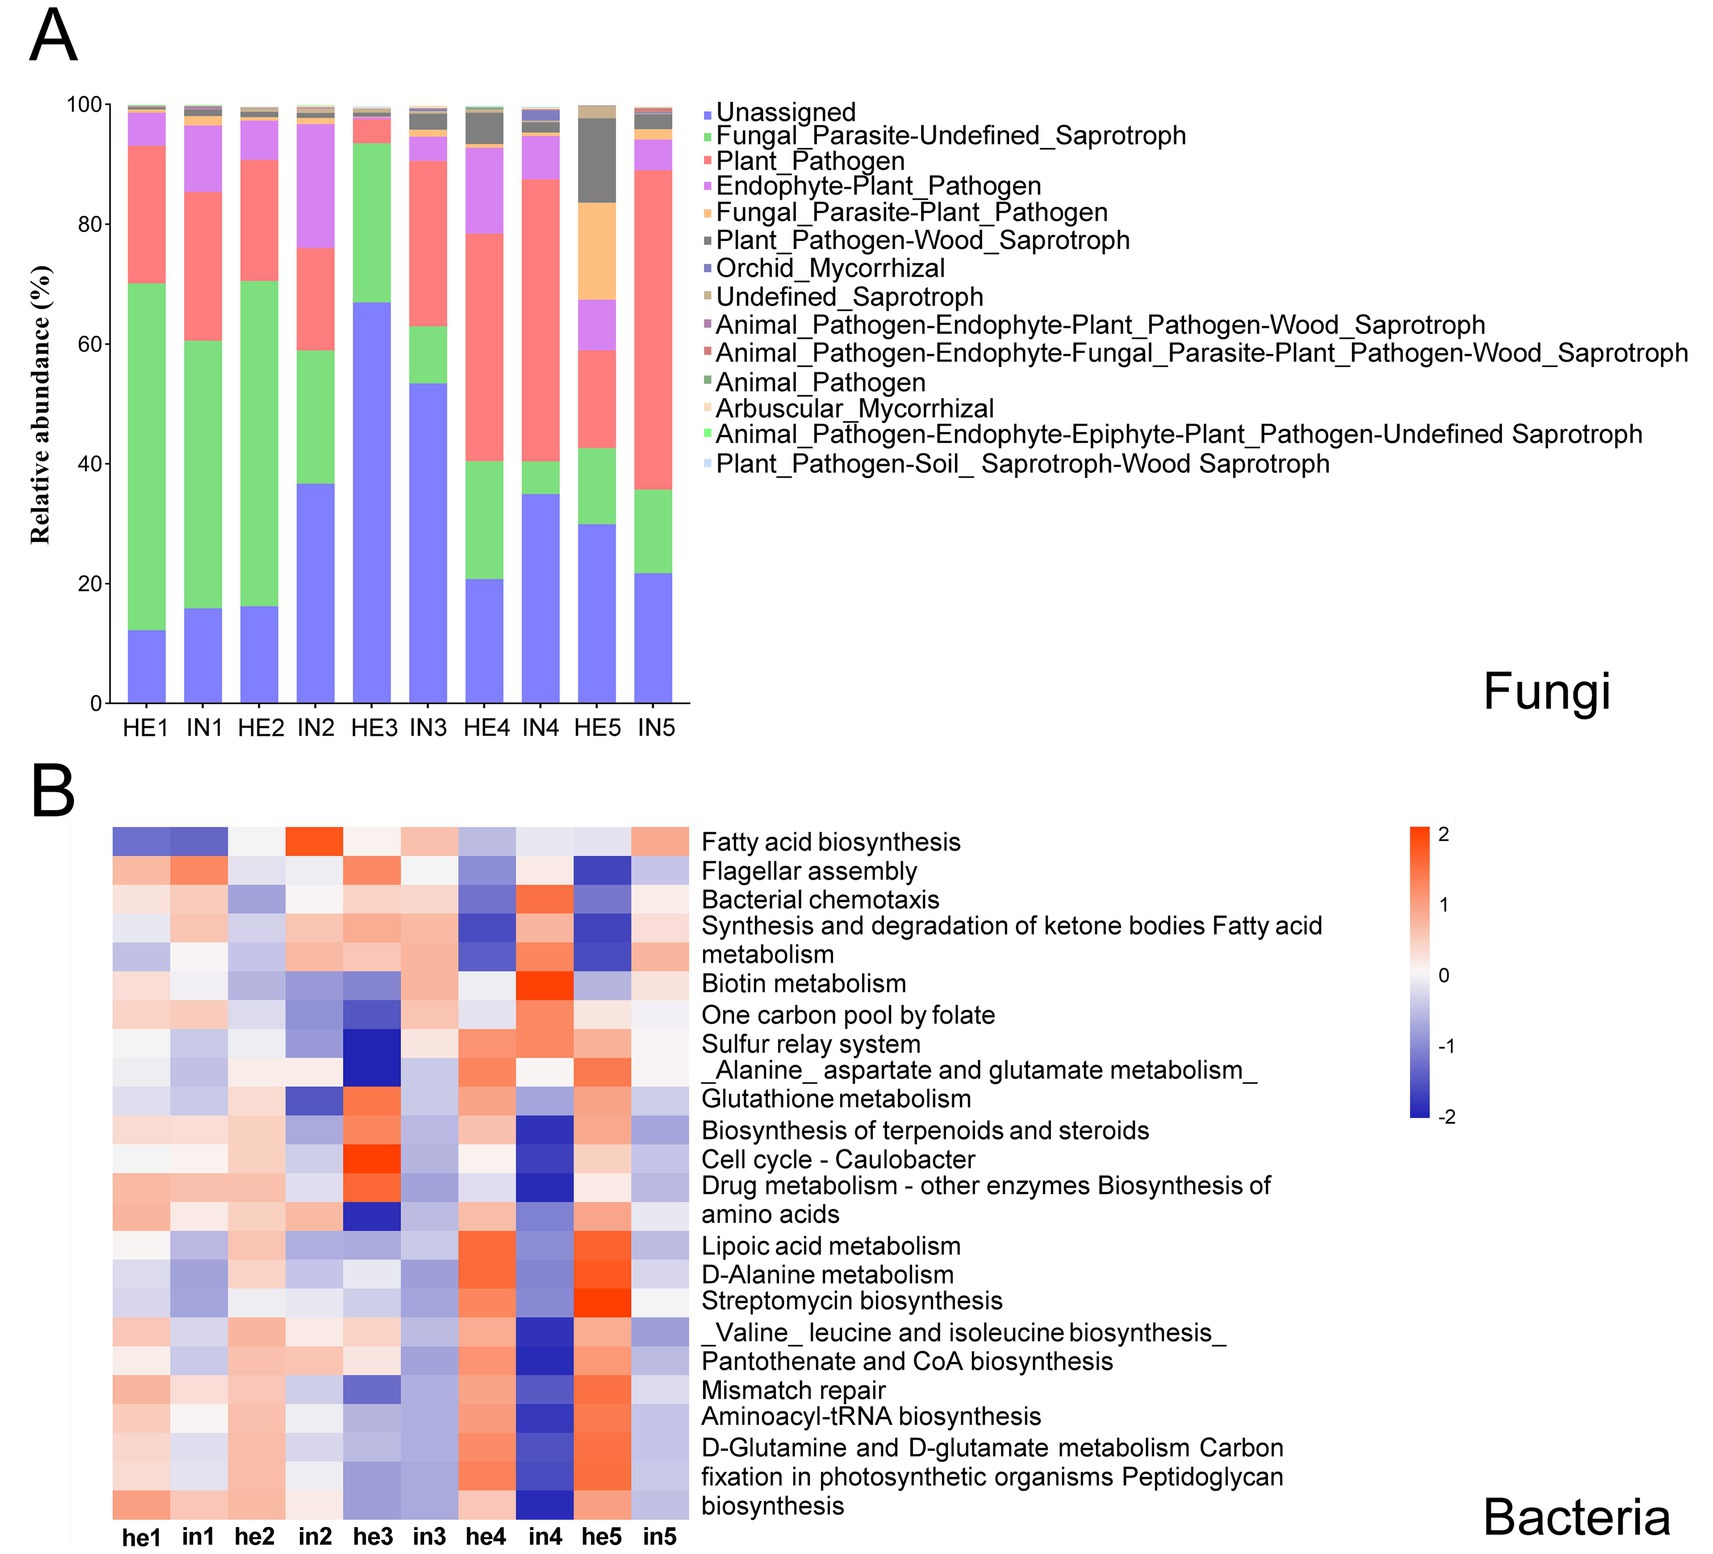
Figure 5. Functional predictions of phyllospheric fungal and bacterial communities. (A) Variations in compositions, predicted by FUNGuild, fungal functional groups. (B) Heatmap of the top 25 abundant bacterial functions in the KEGG pathway, predicted by PICRUSt2, red represents high relative abundance of functional pathways, while blue represents low relative abundance. Columns represent different sample groups, and rows represent different functional pathways.
Redundancy analysis (RDA) was used to investigate the effects of abiotic factors, including Air temperature (AT), dew point temperature (DT), sky condition total coverage code (SCTCC), and liquid precipitation depth dimension (LPDD) on the phyllosphere microbial taxa of symptomatic and asymptomatic walnut leaves. According to the sampling time, the data of environmental factors in that time range were recorded (Supplementary Table SIII). RDA results of bacterial and fungal communities with environmental factors revealed a positive correlation between each factor. The correlation between dew point temperature and bacterial community and species distribution was the highest, followed by liquid precipitation depth dimension and the lowest correlation with air temperature (Figure 6A). The correlation between liquid precipitation depth dimension and fungal community and species distribution was the highest, dew point temperature the second highest, and sky condition total coverage code the lowest (Figure 6B).
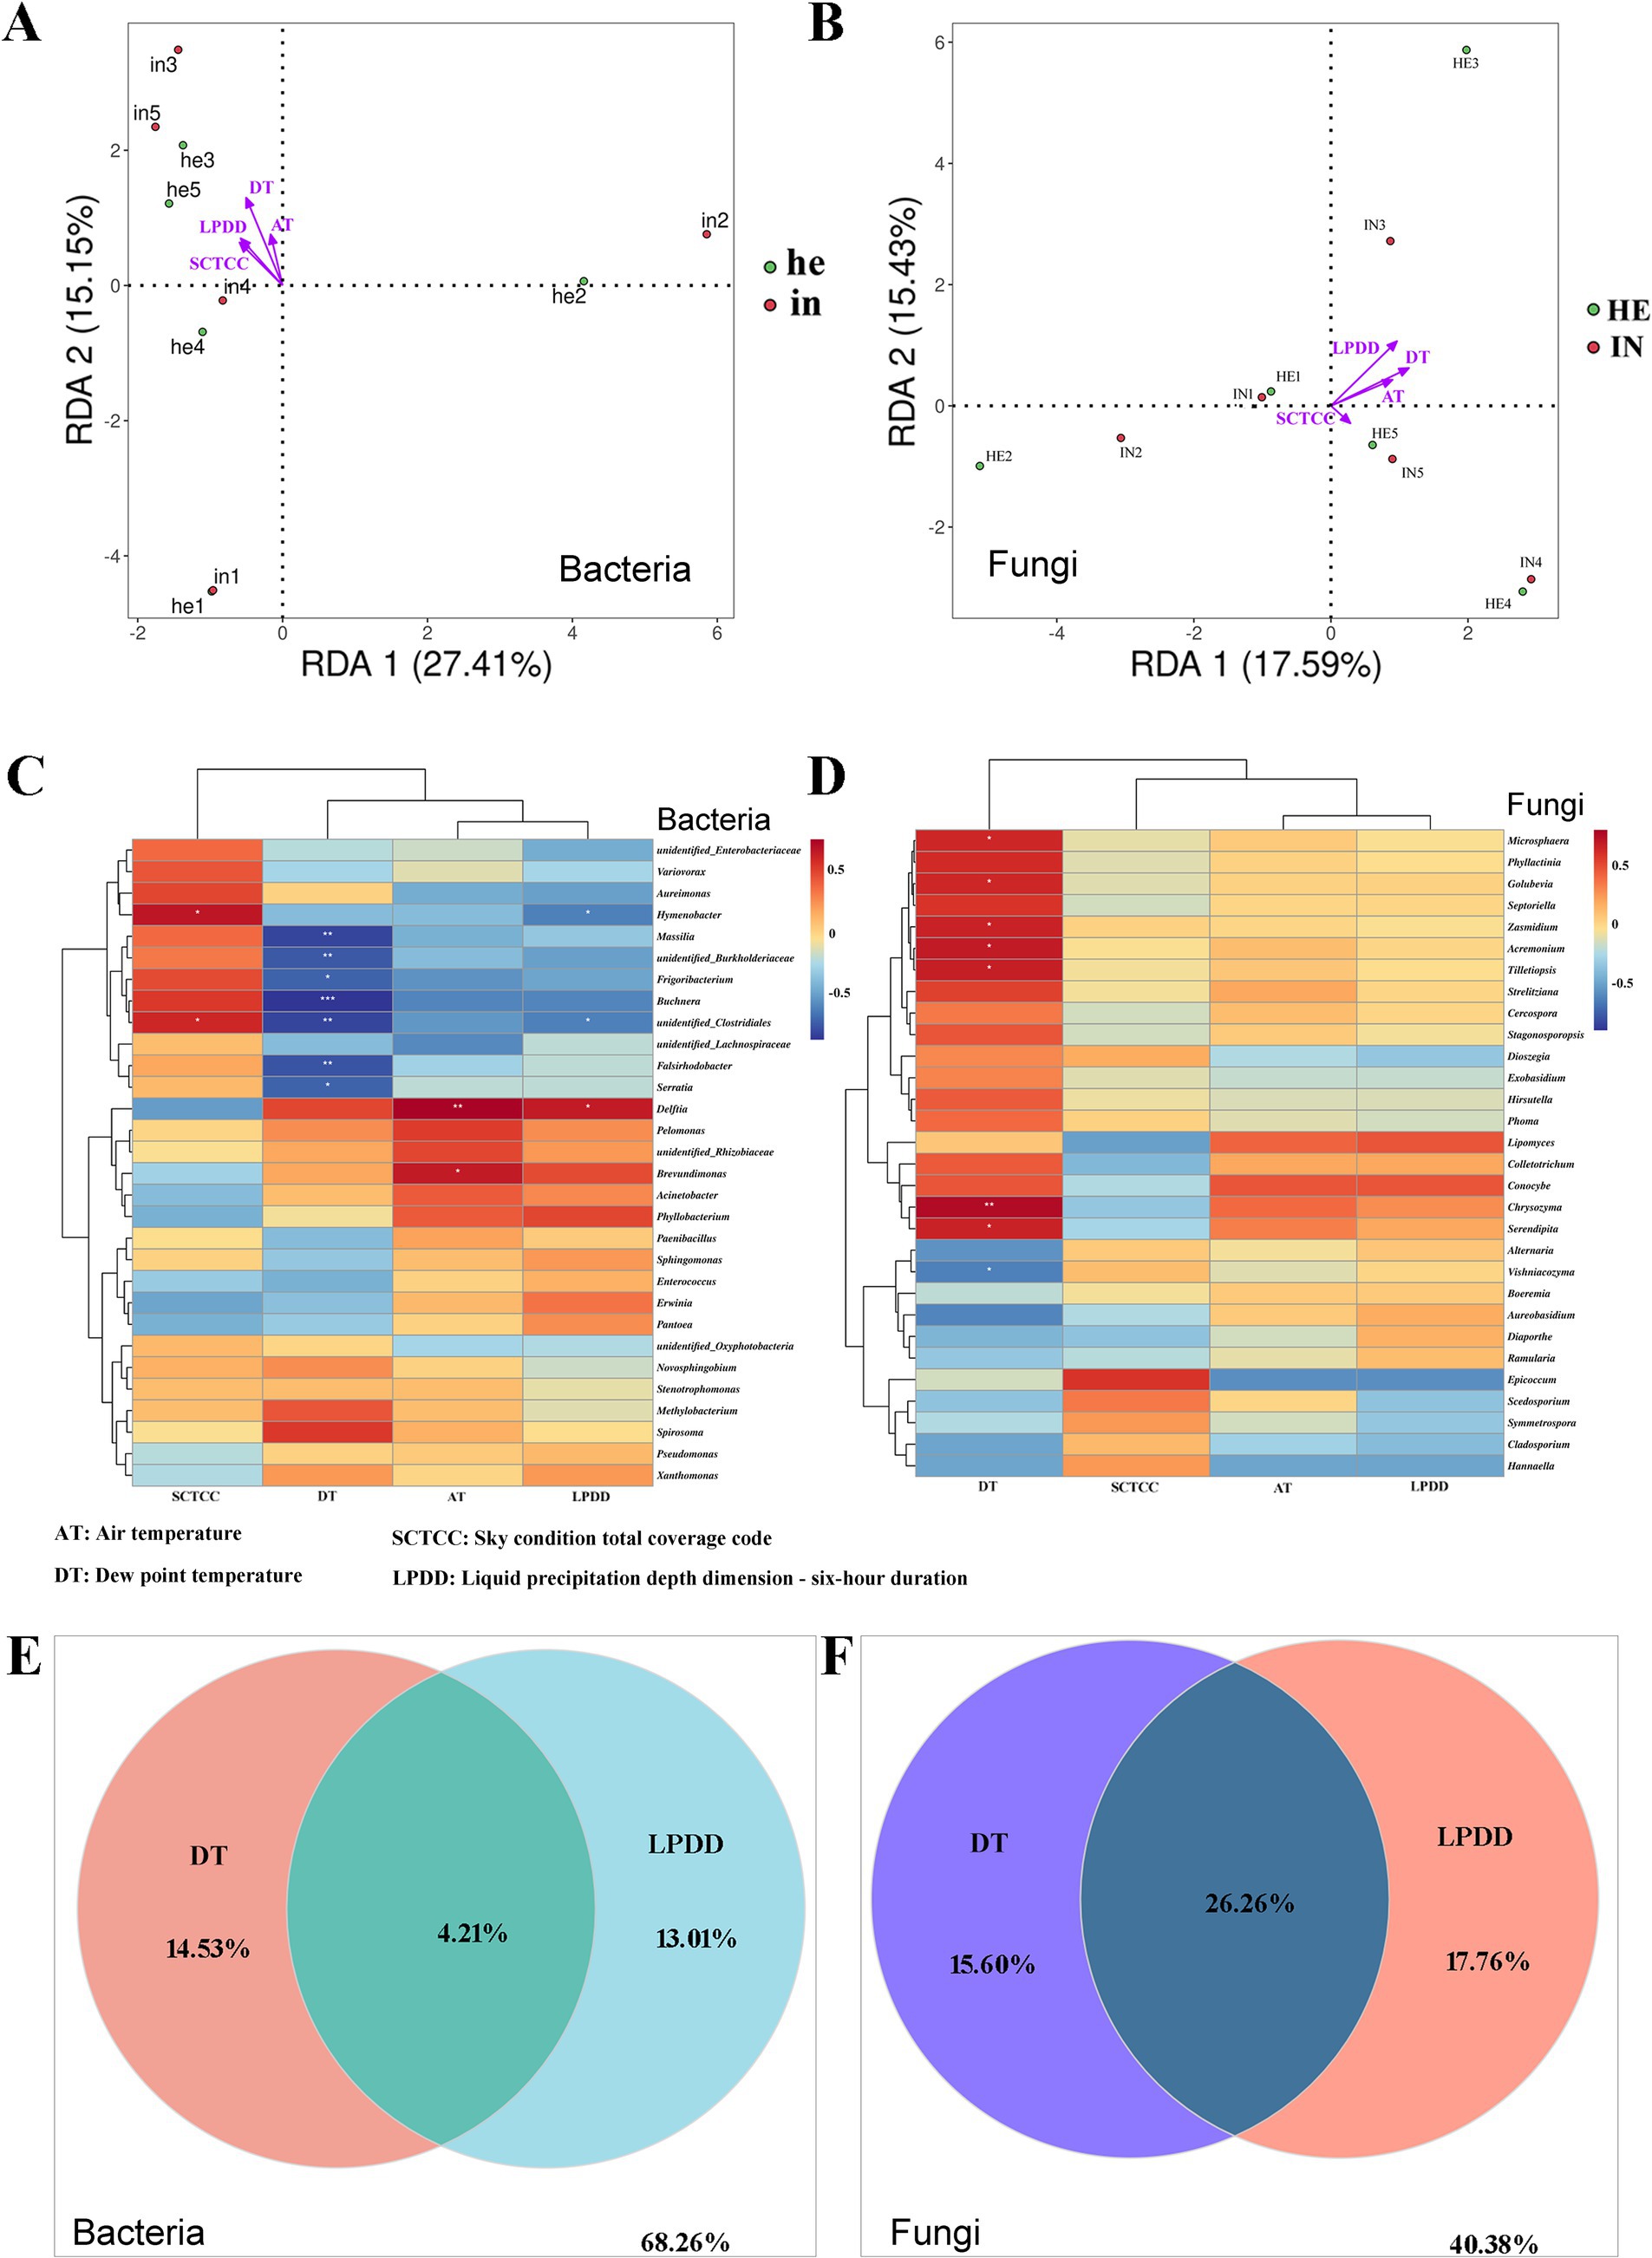
Figure 6. Redundancy analysis (RDA), Spearman correlation heatmaps, and Variance partitioning analysis (VPA) for revealing the relationships between the relative abundance of key microbes at the genus level and environmental factors (Air temperature, AT; dew point temperature, DT; sky condition total coverage code, SCTCC; liquid precipitation depth dimension - six-hour duration, LPDD) of the symptomatic and asymptomatic group. (A,B) RDA of correlation between phyllosphere bacteria and fungi relative abundance and environmental factors; (C,D) Heatmaps of relationships between phyllosphere bacterial and fungal taxas relative abundance and environmental factors, columns represent different environmental factors, and rows represent different genera, and color from blue to red represents Spearman’s rank correlation coefficient (rho) from −1 to 1, *0.01 < p ≤ 0.05; **0.001 < p ≤ 0.01; ***p ≤ 0.001; (E,F) VPA of contributions of dew point temperature and iquid precipitation depth dimension to changes in phyllosphere bacterial and fungal communities in walnut.
Further, the mantel-test was used to analyze the correlation between these factors and microbial communities (Table 3). Significant correlations (p < 0.05) between all four environmental factors and bacterial/fungal community species distribution were found. While liquid precipitation depth dimension (r = 0.2189, p = 0.001) and dew point temperature (r = 0.2058, p = 0.001) were highly correlated with bacterial community species abundance, fungal community species abundance was highly correlated with sky condition total coverage code (r = 0.3753, p = 0.001) and liquid precipitation depth dimension (r = 0.2553, p = 0.001).
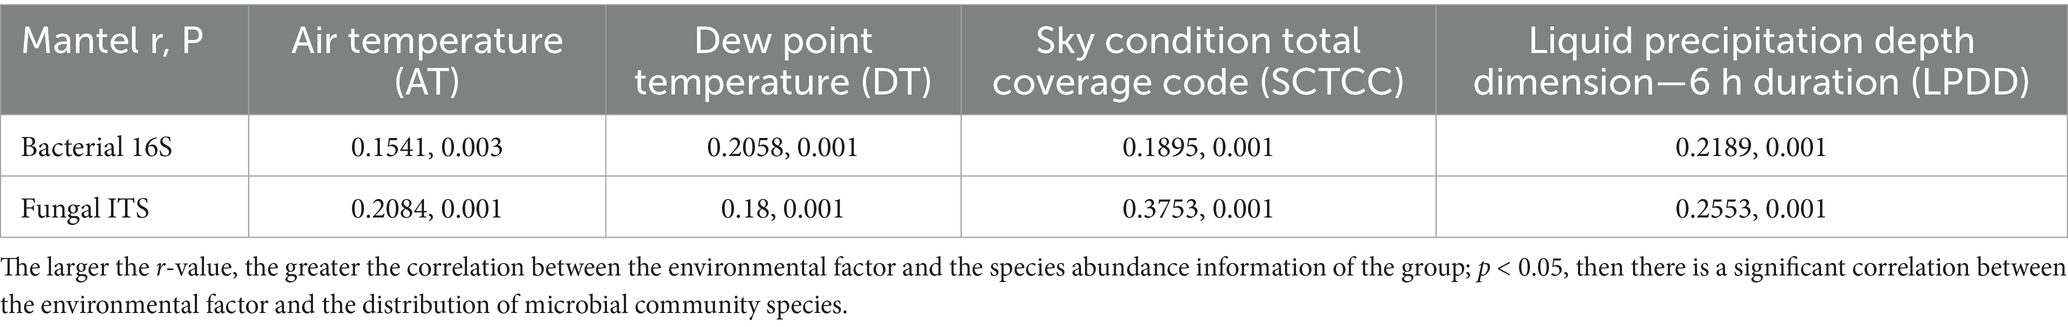
Table 3. Mantel-test calculations of walnut phyllosphere bacterial and fungal communities in relation to environmental factors.
The heatmap clustering examined the difference in the phyllosphere’s top 30 abundant bacterial and fungal genera. The phyllosphere bacteria genera Massilia, unidentifed_Burkholderiaceae, Frigoribacterium, Buchnera, unidentifed_Clostridiales, Falshirodobacteria, and Serratia, were all negatively correlated with the dew point temperature. The genus unidentifed_Clostridiales is also negatively correlated with liquid precipitation depth dimension but positively correlated with sky condition total coverage code. The genus Delftia was positively correlated with air temperature and liquid precipitation depth dimension, and the genus Hymenobacter was negatively correlated with liquid precipitation depth dimension but positively correlated with sky condition total coverage code (Figure 6C). As for the fungal taxa, Microsphaera, Golubevia, Zasmidium, Acremonium, Tilletiopsis, Chrysozyma, and Serendipita were all positively correlated with dew point temperature, and Vishniacozyma was negatively correlated (Figure 6D).
Dew point temperature and liquid precipitation depth dimension were selected for variance partitioning analysis to understand the contribution of the two environmental factors individually and in interaction with the microbial community changes, respectively. The results showed that the interaction of dew point temperature and liquid precipitation depth dimension contributed more to changes in both bacterial and fungal communities than the two factors alone, and the contribution of the interaction was more pronounced in the fungal community (Figures 6E,F).
Symptomatic leaves showed significant decreases in net photosynthetic rate and stomatal conductance compared to asymptomatic leaves, except at the first sampling time (Figures 7A,B). The effect of leaf photosynthetic characteristics on the phyllosphere microbial community was investigated by redundancy analysis (RDA). Significant correlation showed between bacterial community and net photosynthetic rate (R2 = 0. 0.8768, p = 0.002) and stomatal conductance (R2 = 0.9063, p = 0.002; Figure 7C). As for fungal community, it was significantly correlated with net photosynthetic rate (R2 = 0.8895, p = 0.002) and slightly weaker correlation with stomatal conductance (R2 = 0.8737, p = 0.005; Figure 7D).

Figure 7. The relationships between the relative abundance at the genus level and host plant performances of the symptomatic and asymptomatic group. (A) Net photosynthetic rate (Pn) of symptomatic and asymptomatic walnut leaves during the sampling times; (B) Stomatal conductance (Gs) of symptomatic and asymptomatic walnut leaves during the sampling times; (C,D) Redundancy analysis (RDA) of correlation between phyllosphere bacteria and fungi relative abundance and walnut leaves performances (Pn and Gs). *0.01 < p ≤ 0.05; **0.001 < p ≤ 0.01; ***p ≤ 0.001.
Redundancy analysis (RDA) revealed the integrated environment-plant performance model with single-factor models demonstrated higher explanatory power for microbial community variation. The cumulative explanatory proportions of RDA1 and RDA2 reached 36.9 and 43.58%, respectively, in the integrated model of fungal and bacterial communities. In contrast, single-factor models showed lower cumulative proportions: environmental parameters alone accounted for 33.02% (fungi) and 42.56% (bacteria) of variation, while plant performance traits alone explained 28.71% (fungi) and 22.004% (bacteria), respectively. These results indicate that the synergistic consideration of environmental parameters (AT, DT, SCTCC, LPDD) and plant physiological traits (Pn, Gs) exerts stronger influences on phyllosphere microbial communities than individual factor analyses (Supplementary Figures S4A,B; Figures 6A,B, 7C,D). Notably, net photosynthetic rate (Pn) emerged as the most significant factor for fungal community composition among the explanatory variables. In contrast, dew point temperature (DT) showed predominant influence on bacterial community assembly (Supplementary Figures S4A,B).
In this study, asymptomatic and symptomatic walnut leaves from different phenological periods were collected to explore the differences in the phyllosphere microbial community by amplifying the V4 region of 16S rRNA and the ITS region of rDNA. Previous research has consistently demonstrated that phyllosphere microbes’ populations change during plant-pathogen interactions and that the phyllosphere community undergoes changes when pathogens infect leaves. It is generally agreed that communities with stable configurations and high species richness exhibit greater resistance to pathogen invasion (Wei et al., 2015; Liu et al., 2024). Our results showed that the phyllosphere microbial bacterial community richness in asymptomatic walnut leaves was lowest in the third sampling (early Jul. to late Aug.). In contrast, fungal community richness and diversity were lowest in the third sampling data. Further to the prediction of the function of the phyllosphere microbial community, there were far more fungal taxa associated with Fungal_Pathogen in symptomatic leaves (IN3) than in asymptomatic leaves (HE3; Figure 5A). This evidence supports a greater likelihood of leaf spotting disease at the fruit swelling stage. The peak of community distance between symptomatic and asymptomatic leaves also appeared in the third sampling (Supplementary Figure S3), and combined with the area of leaf spotting disease (Supplementary Table SI), changes in the abundance and diversity of the phyllosphere microbial community coincided with the peak severity of disease occurrence. As phenological stages progressed, fungal communities transitioned from a dispersed state to relative clustering in the late sampling times, whereas bacterial communities maintained a relative dispersed distribution (Supplementary Figure S3). This observation aligns with evidence suggesting bacterial communities exhibit higher sensitivity to phenological shifts, potentially due to their faster metabolic responses to resource fluctuations (Wujisiguleng et al., 2023). However, the results of our previous analyses corroborate that the phyllosphere fungal community of symptomatic walnuts exhibited higher richness (as measured by the Chao1 index) and greater diversity (as indicated by the Shannon index) compared to asymptomatic leaves at the same time point (Wang et al., 2022). Similar results were obtained in this work for higher bacterial community richness and diversity under leaf infection (Figure 2); this is consistent with the trend of a significant increase in the phyllosphere bacterial and fungal Shannon and Chao1 index in infected Pinus koraiensis (Deng et al., 2021). This may be related to pathogen invasion disrupts leaf surface integrity through mechanical wounding and enzymatic degradation, creating entry points for microbial colonization, and this physical damage facilitates intracellular nutrient leakage while suppressing plant immune responses (Xiong et al., 2021; Zhang et al., 2023).
We found a significant effect of disease on the diversity of phyllosphere microbial bacterial communities (Table 2). It is noteworthy that Firmicutes had lower abundance and Proteobacteria had higher abundance in the third and fourth samples with severe walnut leaf disease (Figure 3A). Numerous studies have demonstrated that changes in the abundance of Firmicutes and Proteobacteria are closely related to the ecological dysbiosis of the phyllosphere microbiota (Gong and Xin, 2021), showing a shift from a Firmicutes phylum rich community to a Proteobacteria phylum rich community (Lee et al., 2021; Runge et al., 2023; Sun et al., 2023). Meanwhile, we found that the relative abundance of Bacillus spp. was higher in the phyllosphere microbial community of asymptomatic leaves than that of symptomatic leaves (Figure 3D). Further, Bacillus gibsonii and Bacillus velezensis are reported antagonistic bacteria against the pathogen of maize and walnut in our species level results (Batool et al., 2019; Wang and Zhu, 2023). Bacillus spp. have been shown to exhibit antagonistic activity against Colletotrchum spp., Xanthomonas spp. and also play a positive role in walnut leaf homeostasis (Srikhong et al., 2018; Marin et al., 2019). Interestingly, we noted that Pseudomonas spp. was also present in asymptomatic leaves (Figure 3D); Pseudomonas orientalis is an antagonist of the apple flower against phytopathogens but Pseudomonas cichorii caused tobacco, rromaine lettuce, escarole, tomato, lettuce and endive leaf spot diease (Zengerer et al., 2018; Arshad et al., 2021; Lan et al., 2022; Patel et al., 2021; Osdaghi, 2022).
Phyllosphere microbial communities are influenced by abiotic and host factors that act directly on hub taxa (Agler et al., 2016). We identified the primary bacterium driving the microbial community pattern of symptomatic and asymptomatic walnut leaves as the genus Pseudomonas by similarity percentage, which is also included in the plant-associated microbial keystone taxa summarized by Banerjee et al. (2018). Other pathogenic bacteria (Xanthomonas spp., Pantoea spp.) and pathogenic fungi (Cladosporium spp., Colletotrichum spp., Alternaria spp.) of walnut leaf spotting diseases were among the top 25 genera in their respective contribution values (Figures 4B,C). The pathogen Exobasidium causes leaf diseases of Camellia Oleifera and rabbiteye blueberry (Ingram et al., 2019; Zhang et al., 2022), but its pathogenicity in walnut has not been assessed. This study revealed the existence of valid connections with the identified leaf spotting disease pathogenic fungus, Colletotrichum and Alternaria (Figure 4E). Studies on other plants show that Pseudomonas spp. can self-aggregate and co-aggregate with Xanthomonas spp. (Afkhamifar et al., 2023). Our results also demonstrate an interaction between the two (Figure 4D), which can correlate with walnut leaf diseases showing a multi-pathogen complex infestation and multiple diseases interacting under natural conditions. In previous studies, the main causal agent of the walnut black spot was Xanthomonas (Lamichhane, 2014), but our results suggest that when targeting walnut leaf spotting diseases for prevention and control, it could be centered around Pseudomonas (Figures 4A,B,D), perhaps with better results, but further research is needed to find out exactly what effects are produced between the several pathogens. On the other hand, microbial community profiling identified Oxyphotobacteria, Methylobaterium, Aureimonas, and unidentified Enterobacteriaceae as biomarkers in asymptomatic walnut leaves phyllosphere microbiome, particularly during the third to fifth sampling times (Figures 4A,B). The sustained dominance of Methylobacterium (a known phyllosphere mutualist) and Oxyphotobacteria suggests their synergistic roles in host protection. These taxa may enhance plant firness through synergistic roles in host protection and promote plant growth (Zhu et al., 2023; Zhang et al., 2024), potentially explaining their association with the health of asymptomatic plants.
Since seasonal variation is centered on changes in a number of environmental factors, including temperature, humidity, and light, we investigate the relationship between these abiotic factors and the phyllosphere microbial community. The results showed that air temperature (AT), dew point temperature (DT), sky condition total coverage code (SCTCC) and liquid precipitation depth dimension (LPDD) were all significantly correlated with the phyllosphere microbial community, with DT and LPDD being the most highly correlated factors for bacterial and fungal communities, respectively (Figures 6A,B). As for fungi, the genera Microsphaera, Golubevia, Zasmidium, and Tilletiopsis, which showed significant positive correlation with dew point temperature (Figure 6D), include plant pathogens and may cause powdery mildew, oil spot, and others (Abasova et al., 2017; Richter et al., 2019; Afkhamifar et al., 2023; Aguilera-Cogley et al., 2023; Guarnaccia et al., 2024). Xanthomonas spp. and Pseudomonas spp. were all positively correlated with LPDD (Figure 6C), which is consistent with the effect of rainfall on the relative abundance of both genera of bacteria in the epiphytic bacterial communities of cucumber and tomato (Allard et al., 2020). The correlation with precipitation may be related to the spread of phyllosphere bacteria through rain splash or windblown rain (Bahadur and Srivastava, 2022), and the increase in water utilization by Pseudomonas spp. through the release of surfactants (Hernandez and Lindow, 2019). Throughout the sampling period, the third sampling time was the highest temperature, and the fourth was the next highest. The relative abundance of Xanthomonas, Pseudomonas, and Erwinia was elevated at this time (Figures 3B,D), in agreement with Aydogan et al. (2020) on the effect of elevated temperature on the relative abundance of potential phyllosphere pathogens as well.
In addition to abiotic factors, the state of the plant itself influences the phyllosphere microbial community. We investigated the relationship between net photosynthetic rate, stomatal conductance, and the phyllosphere microbial community. Walnut leaf infections significantly reduced net photosynthetic rate and stomatal conductance, which was consistent with the trend of reduced stomatal conductance after Quercus robur (Hajji et al., 2009). Xanthomonas and Pseudomonas tend to enter plant stems, leaves, or floral tissues through wounds or natural openings (e.g., stomata or hydathodes; Gudesblat et al., 2009). Li et al. (2021) showed that chlorophyll and plant biomass influence the diversity of the phyllosphere microbial community, and both factors are positively correlated with leaf photosynthesis. Through redundancy analysis (RDA), we found that bacterial and fungal communities significantly correlated with photosynthetic properties (Figures 7C,D), demonstrating that phyllosphere microbes and leaves influence and regulate each other. Redundancy analysis (RDA) of the environment and plant performance model identified net photosynthetic rate (Pn) and dew point temperature (DPT) as key drivers shaping phyllosphere fungal and bacterial community composition, respectively (Supplementary Figure S4). Mechanistically, the net photosynthetic rate fluctuations may regulate fungal communities by changing the quantity and quality of carbon sources plants provide to fungi (Chen et al., 2024). In contrast, dew point temperature likely influences bacterial communities by affecting the water vapor content and condensation in the phyllosphere (Gao et al., 2016).
This study revealed dynamic shifts in the phyllosphere microbial communities of walnut leaves during phenological progression, driven by pathogen infection, environmental factors, and host physiological traits. These results demonstrated that symptomatic leaves exhibited significantly higher bacterial richness and diversity than asymptomatic leaves. The observed differences were correlated with disease severity during phenology progression. Notably, symptomatic leaves were characterized by Pseudomonas spp. (a keystone species) forming ecological associations with other pathogens (Xanthomonas and Pantoea) associated with walnut leaf spotting disease. In contrast, asymptomatic leaves predominantly harbored beneficial taxa including Methylobacterium and Oxyphotobacteria. Environmental factors, particularly dew point temperature (DT) and liquid precipitation depth (LPDD), significantly influenced phyllosphere community, with their interaction exerting stronger effects than individual factors. Net photosynthetic rate (Pn) and dew-point temperature (DT) are the most prominent factors exerting influence on fungal and bacterial communities under integrated environment-plant performance model, highlighting bidirectional plant-microbe interactions. These findings reveal the dynamic complexity of phyllosphere microbial ecology in disease contexts, shaped by microbial interactions and environmental-physiological factor synergies. While this study provides insights into microbial shifts during walnut leaf spot disease, limitations are unresolved pathogenicity mechanisms that warrant further investigation. Future research should prioritize targeted biocontrol strategies leveraging antagonistic taxa (e.g., Bacillus spp.) and explore multi-omics approaches to decipher functional pathways underlying microbial-plant-environment interactions.
The datasets presented in this study can be found in online repositories. The names of the repository/repositories and accession number(s) can be found in the article/Supplementary material.
SW: Conceptualization, Data curation, Investigation, Methodology, Visualization, Writing – original draft. YT: Conceptualization, Formal analysis, Investigation, Methodology, Resources, Validation, Writing – review & editing. QL: Formal analysis, Investigation, Validation, Writing – review & editing. XF: Formal analysis, Investigation, Validation, Writing – review & editing. HZ: Conceptualization, Methodology, Project administration, Writing – review & editing. SL: Methodology, Resources, Validation, Writing – review & editing. YZ: Conceptualization, Methodology, Project administration, Writing – review & editing. TZ: Conceptualization, Funding acquisition, Methodology, Project administration, Supervision, Writing – review & editing.
The author(s) declare that financial support was received for the research and/or publication of this article. This research was supported and funded by the Yaan Science and Technology Program (No. 23ZDYF0002).
The authors declare that the research was conducted in the absence of any commercial or financial relationships that could be construed as a potential conflict of interest.
The author(s) declare that no Gen AI was used in the creation of this manuscript.
All claims expressed in this article are solely those of the authors and do not necessarily represent those of their affiliated organizations, or those of the publisher, the editors and the reviewers. Any product that may be evaluated in this article, or claim that may be made by its manufacturer, is not guaranteed or endorsed by the publisher.
The Supplementary material for this article can be found online at: https://www.frontiersin.org/articles/10.3389/fmicb.2025.1551476/full#supplementary-material
Abadi, V. A. J. M., Sepehri, M., Rahmani, H. A., Zarei, M., Ronaghi, A., Taghavi, S. M., et al. (2020). Role of dominant phyllosphere bacteria with plant growth–promoting characteristics on growth and nutrition of maize (Zea mays L.). J. Soil Sci. Plant Nutr. 20, 2348–2363. doi: 10.1007/s42729-020-00302-1
Abasova, L. V., Aghayeva, D. N., and Takamatsu, S. (2017). Erysiphe azerbaijanica and E. Linderae: two new powdery mildew species (Erysiphales) belonging to the Microsphaera lineage of Erysiphe. Mycoscience 59, 181–187. doi: 10.1016/j.myc.2017.10.002
Afkhamifar, A., Moslemkhani, C., Hasanzadeh, N., and Razmi, J. (2023). Interactions of seed-borne bacterial pathogens Xanthomonas translucens and Pseudomonas syringae pv syringae on wheat. J. Plant Pathol. 105, 859–867. doi: 10.1007/s42161-023-01383-4
Agler, M. T., Ruhe, J., Kroll, S., Morhenn, C., Kim, S. T., Weigel, D., et al. (2016). Microbial hub taxa link host and abiotic factors to plant microbiome variation. PLoS Biol. 14:e1002352. doi: 10.1371/journal.pbio.1002352
Aguilera-Cogley, V., Sedano, E., and Vicent, A. (2023). Inoculum and disease dynamics of citrus greasy spot caused by Zasmidium citrigriseum in sweet orange in Panama. Plant Pathol. 72, 696–707. doi: 10.1111/ppa.13703
Allard, S. M., Ottesen, A. R., and Micallef, S. A. (2020). Rain induces temporary shifts in epiphytic bacterial communities of cucumber and tomato fruit. Sci. Rep. 10:1765. doi: 10.1038/s41598-020-58671-7
Alsanius, B. W., Bergstrand, K. J., Hartmann, R., Gharaie, S., Wohanka, W., Dorais, M., et al. (2017). Ornamental flowers in new light: artificial lighting shapes the microbial phyllosphere community structure of greenhouse grown sunflowers (Helianthus annuus L.). Sci. Hortic. 216, 234–247. doi: 10.1016/j.scienta.2017.01.022
Arshad, S., Nematollahi, S., Rouhrazi, K., and Khezrinejad, N. (2021). Characterization of Pseudomonas cichorii isolated from tomato and lettuce in Iran. J. Plant Pathol. 103, 853–861. doi: 10.1007/s42161-021-00863-9
Aydogan, E. L., Budich, O., Hardt, M., Choi, Y. H., Jansen-Willems, A. B., Moser, G., et al. (2020). Global warming shifts the composition of the abundant bacterial phyllosphere microbiota as indicated by a cultivation-dependent and-independent study of the grassland phyllosphere of a long-term warming field experiment. FEMS Microbiol. Ecol. 96:fiaa 087. doi: 10.1093/femsec/fiaa087
Bahadur, A., and Srivastava, J. N. (2022). “Integrated management of citrus canker disease (Xanthomonas axonopodis pv. Citri)” in Diseases of horticultural crops: Diagnosis and management. eds. J. N. Srivastava and A. K. Singh (New York: Apple Academic Press), 169–183.
Banerjee, S., Schlaeppi, K., and van der Heijden, M. G. A. (2018). Keystone taxa as drivers of microbiome structure and functioning. Nat. Rev. Microbiol. 16, 567–576. doi: 10.1038/s41579-018-0024-1
Batool, R., Rehman, S., Rafique, M., Amna, A. J., Mukhtar, T., et al. (2019). Biocontrol potential of Bacillus gibsonii and Brevibacterium frigoritolerans in suppression of Fusarium stalk rot of maize: a sustainable approach. Asian J. Agric. Biol. 7, 320–333.
Bell, J. K., Helgason, B., and Siciliano, S. D. (2021). Brassica napus phyllosphere bacterial composition changes with growth stage. Plant Soil 464, 501–516. doi: 10.1007/s11104-021-04965-2
Caporaso, J. G., Kuczynski, J., Stombaugh, J., Bittinger, K., Bush-man, F. D., Costello, E. K., et al. (2010). QIIME allows analysis of high-throughput community sequencing data. Nat. Methods 7, 335–336. doi: 10.1038/nmeth.f.303
Chen, Q. L., Hu, H. W., Yan, Z. Z., Li, C. Y., Nguyen, B. A. T., Zhu, Y. G., et al. (2021). Precipitation increases the abundance of fungal plant pathogens in Eucalyptus phyllosphere. Environ. Microbiol. 23, 7688–7700. doi: 10.1111/1462-2920.15728
Chen, T., Nomura, K., Wang, X., Sohrabi, R., Xu, J., Yao, L. Y., et al. (2020). A plant genetic network for preventing dysbiosis in the phyllosphere. Nature 580, 653–657. doi: 10.1038/s41586-020-2185-0
Chen, H., Song, Y. J., Wang, Y., Wang, H., Ding, Z. T., and Fan, K. (2024). Zno nanoparticles: improving photosynthesis, shoot development, and phyllosphere microbiome composition in tea plants. J. Nanobiotechnol. 22:389. doi: 10.1186/s12951-024-02667-2
De Mandal, S., and Jeon, J. (2023). Phyllosphere microbiome in plant health and disease. Plan. Theory 12:3481. doi: 10.3390/plants12193481
Deng, J. J., Yu, D. P., Zhou, W. M., Zhou, L., and Zhu, W. X. (2021). Variations of phyllosphere and rhizosphere microbial communities of Pinus koraiensis infected by Bursaphelenchus xylophilus. Microb. Ecol. 84, 285–301. doi: 10.1007/s00248-021-01850-4
Díaz-Cruz, G. A., and Cassone, B. J. (2022). Changes in the phyllosphere and rhizosphere microbial communities of soybean in the presence of pathogens. FEMS Microbiol. Ecol. 98:fiac022. doi: 10.1093/femsec/fiac022
Donegan, K., Matyac, C., Seidler, R., and Porteous, A. (1991). Evaluation of methods for sampling, recovery, and enumeration of bacteria applied to the phylloplane. Appl. Environ. Microbiol. 57, 51–56. doi: 10.1128/aem.57.1.51-56.1991
Ehau-Taumaunu, H., and Hockett, K. L. (2023). Passaging phyllosphere microbial communities develop suppression towards bacterial speck disease in tomato. Phytobiomes J. 7, 233–243. doi: 10.1094/PBIOMES-05-22-0030-FI
Fan, X. Y., Matsumoto, H., Xu, H. R., Fang, H. D., Pan, Q. Q., Lv, T. X., et al. (2024). Aspergillus cvjetkovicii protects against phytopathogens through interspecies chemical signalling in the phyllosphere. Nat. Microbiol. 9, 2862–2876. doi: 10.1038/s41564-024-01781-z
Gao, M., Yan, X., Qiu, T. L., Han, M. L., and Wang, X. M. (2016). Variation of correlations between factors and culturable airborne bacteria and fungi. Atmos. Environ. 128, 10–19. doi: 10.1016/j.atmosenv.2015.12.008
Gong, T. Y., and Xin, X. F. (2021). Phyllosphere microbiota: community dynamics and its interaction with plant hosts. J. Integr. Plant Biol. 63, 297–304. doi: 10.1111/jipb.13060
Goossens, P., Spooren, J., Baremans, K. C. M., Andel, A., Lapin, D., Echobardo, N., et al. (2023). Obligate biotroph downy mildew consistently induces near-identical protective microbiomes in Arabidopsis thaliana. Nat. Microbiol. 8, 2349–2364. doi: 10.1038/s41564-023-01502-y
Guarnaccia, V., Remolif, G. M. E., Nari, L., Gualandri, V., Angeli, D., Oettl, S., et al. (2024). Characterization of fungal species involved in white haze disorder on apples in northern Italy and description of Golubevia Mali sp. nov. and Entyloma Mali sp. nov. Postharvest Biol. Technol. 209:s112678. doi: 10.1016/j.postharvbio.2023.112678
Gudesblat, G. E., Torres, P. S., and Vojnov, A. A. (2009). Xanthomonas campestris overcomes Arabidopsis stomatal innate immunity through a DSF cell-to-cell signal-regulated virulence factor. Plant Physiol. 149, 1017–1027. doi: 10.1104/pp.108.126870
Hajji, M., Dreyer, E., and Marçais, B. (2009). Impact of Erysiphe alphitoides on transpiration and photosynthesis in Quercus robur leaves. Eur. J. Plant Pathol. 125, 63–72. doi: 10.1007/s10658-009-9458-7
Hernandez, M. N., and Lindow, S. E. (2019). Pseudomonas syringae increases water availability in leaf microenvironments via production of hygroscopic syringafactin. Appl. Environ. Microbiol. 85, e01014–e01019. doi: 10.1128/AEM.01014-19
Ingram, R. J., Ludwig, H. D., and Scherm, H. (2019). Epidemiology of Exobasidium leaf and fruit spot of rabbiteye blueberry: pathogen overwintering, primary infection, and disease progression on leaves and fruit. Plant Dis. 103, 1293–1301. doi: 10.1094/PDIS-09-18-1534-RE
Kałużna, M., Pulawska, J., Waleron, M., and Sobiczewski, P. (2014). The genetic characterization of Xanthomonas arboricola pv. Juglandis, the causal agent of walnut blight in Poland. Plant Pathol. 63, 1404–1416. doi: 10.1111/ppa.12211
Keshtkar, A. R., Khodakaramian, G., and Rouhrazi, K. (2016). Isolation and characterization of Pseudomonas syringae pv. Syringae which induce leaf spot on walnut. Eur. J. Plant Pathol. 146, 837–846. doi: 10.1007/s10658-016-0962-2
Kim, H. S., Lee, D. H., Lee, S. K., Lee, S. H., and Seo, S. T. (2020). First report of walnut blight canker on walnut tree (Juglans regia) by Pseudomonas flavescens in South Korea. J. Plant Pathol. 102:943. doi: 10.1007/s42161-020-00520-7
Laforest-Lapointe, I., Messier, C., and Kembel, S. W. (2016). Host species identity, site and time drive temperate tree phyllosphere bacterial community structure. Microbiome 4, 27–10. doi: 10.1186/s40168-016-0174-1
Lamichhane, J. R. (2014). Xanthomonas arboricola diseases of stone fruit, almond, and walnut trees: Progress toward understanding and management. Plant Dis. 98, 1600–1610. doi: 10.1094/PDIS-08-14-0831-FE
Lan, D. Y., Shu, F. L., Lu, Y. H., Shou, A. F., Lin, W., and Yuan, G. Q. (2022). First report of a leaf spot disease of tobacco caused by Pseudomonas cichorii in China. Plant Dis. 106:1058. doi: 10.1094/PDIS-10-21-2158-PDN
Lee, S. M., Kong, H. G., Song, G. C., and Ryu, C. M. (2021). Disruption of Firmicutes and Actinobacteria abundance in tomato rhizosphere causes the incidence of bacterial wilt disease. ISME J. 15, 330–347. doi: 10.1038/s41396-020-00785-x
Li, Y., Zhang, Z. Y., Liu, W. Y., Ke, M. J., Qu, Q., Zhou, Z. G., et al. (2021). Phyllosphere bacterial assemblage is affected by plant genotypes and growth stages. Microbiol. Res. 248:126743. doi: 10.1016/j.micres.2021.126743
Li, P. D., Zhu, Z. R., Zhang, Y., Xu, J. P., Wang, H. K., Wang, Z. Y., et al. (2022). The phyllosphere microbiome shifts toward combating melanose pathogen. Microbiome 10, 56–17. doi: 10.1186/s40168-022-01234-x
Liu, S. Y., Guo, N. N., Jin, J. Y., Zhang, Q. Q., and Yu, Y. B. (2024). Characterizing the alterations in the phyllosphere microbiome in relation to blister blight disease in tea plants. Res. Square. doi: 10.21203/rs.3.rs-3862672/v1
Liu, Z. J., Zhang, R., and Sun, D. Y. (2023). Alternaria alternata causing brown spot disease on walnut in Xinjiang, China. Plant Dis. 107:2224. doi: 10.1094/PDIS-07-22-1536-PDN
Marin, V. R., Ferrarezi, J. H., Vieira, G., and Sass, D. C. (2019). Recent advances in the biocontrol of Xanthomonas spp. World J. Microbiol. Biotechnol. 35:72. doi: 10.1007/s11274-019-2646-5
Osdaghi, E. (2022). Pseudomonas cichorii (bacterial blight of endive). CABI Compendium, CABI Int. doi: 10.1079/cabicompendium.44942
Patel, N., Patel, R., Wyenandt, C. A., and Kobayashi, D. Y. (2021). First report of Pseudomonas cichorii causing bacterial leaf spot on Romaine lettuce (Lactuca sativa var. longifolia) and escarole (Cichorium endivia) in New Jersey. Plant Dis. 105:4150. doi: 10.1094/PDIS-05-21-0929-PDN
Peñuelas, J., and Jaume, T. (2014). The foliar microbiome. Trends Plant Sci. 19, 278–280. doi: 10.1016/j.tplants.2013.12.007
Richter, C., Yurkov, A. M., Boekhout, T., and Stadler, M. (2019). Diversity of Tilletiopsis-like fungi in Exobasidiomycetes (Ustilaginomycotina) and description of six novel species. Front. Microbiol. 10:462920. doi: 10.3389/fmicb.2019.02544
Rossetti, A., Mazzaglia, A., Muganu, M., Paolocci, M., Sguizzato, M., Esposito, E., et al. (2017). Microparticles containing gallic and ellagic acids for the biological control of bacterial diseases of kiwifruit plants. J. Plant Dis. Prot. 124, 563–575. doi: 10.1007/s41348-017-0096-6
Runge, P., Ventura, F., Kemen, E., and Stam, R. (2023). Distinct phyllosphere microbiome of wild tomato species in Central Peru upon dysbiosis. Microb. Ecol. 85, 168–183. doi: 10.1007/s00248-021-01947-w
Schloss, P. D., Westcott, S. L., Ryabin, T., Hall, J. R., Hartmann, M., Hollister, E. B., et al. (2009). Introducing mothur: open-source, platform-independent, community-supported software for describing and comparing microbial communities. Appl. Environ. Microbiol. 75, 7537–7541. doi: 10.1128/AEM.01541-09
Srikhong, P., Lertmongkonthum, K., Sowanpreecha, R., and Rerngsamran, P. (2018). Bacillus sp. strain M10 as a potential biocontrol agent protecting chili pepper and tomato fruits from anthracnose disease caused by Colletotrichum capsici. BioControl 63, 833–842. doi: 10.1007/s10526-018-9902-8
Stewart, C. N. J., and Via, L. E. (1993). A rapid CTAB DNA isolation technique useful for RAPD fingerprinting and other PCR applications. BioTechniques 14, 748–750.
Sun, M. L., Shi, C. H., Huang, Y., Wang, H. C., Li, J. J., Cai, L. T., et al. (2023). Effect of disease severity on the structure and diversity of the phyllosphere microbial community in tobacco. Front. Microbiol. 13:1081576. doi: 10.3389/fmicb.2022.1081576
Thapa, S., Prasanna, R., Ranjan, K., Velmourougane, K., and Ramakrishnan, B. (2017). Nutrients and host attributes modulate the abundance and functional traits of phyllosphere microbiome in rice. Microbiol. Res. 204, 55–64. doi: 10.1016/j.micres.2017.07.007
Wang, S. W., Tan, Y., Li, S. J., and Zhu, T. H. (2022). Structural and dynamic analysis of leaf-associated fungal community of walnut leaves infected by leaf spot disease based illumina high-throughput sequencing technology. Pol. J. Microbiol. 71, 429–441. doi: 10.33073/pjm-2022-038
Wang, L. M., and Zhu, T. H. (2023). Strong opponent of walnut anthracnose—Bacillus velezensis and its transcriptome analysis. Microorganisms 11:1885. doi: 10.3390/microorganisms11081885
Wei, Z., Yang, T., Friman, V. P., Xu, Y. C., Shen, Q. R., and Jousset, A. (2015). Trophic network architecture of root-associated bacterial communities determines pathogen invasion and plant health. Nat. Commun. 6:8413. doi: 10.1038/ncomms9413
Wujisiguleng, P. Y. Q., Hu, J. P., Zhang, Y. Q., Li, B., Liu, J. L., et al. (2023). Response of phyllosphere bacteria and fungi of Reaumuria trigyna to seasonal change. Microbiol. China. 50, 48–63. doi: 10.13344/j.microbiol.china.220376
Xiong, C., Singh, B. K., He, J. Z., Han, Y. L., Li, P. P., Wan, L. H., et al. (2021). Plant developmental stage drives the differentiation in ecological role of the maize microbiome. Microbiome. 9, 171–115. doi: 10.1186/s40168-021-01118-6
Zengerer, V., Schmid, M., Bieri, M., Müller, D. C., Remus-Emsermann, M. N. P., Ahrens, C. H., et al. (2018). Pseudomonas orientalis F9: a potent antagonist against phytopathogens with phytotoxic effect in the apple flower. Front. Microbiol. 9:145. doi: 10.3389/fmicb.2018.00145
Zhang, T. T., Cai, X. Y., Teng, L., Xiang, L., Zhong, N. F., and Liu, H. M. (2022). Molecular characterization of three novel mycoviruses in the plant pathogenic fungus Exobasidium. Virus Res. 307:198608. doi: 10.1016/j.virusres.2021.198608
Zhang, Y. X., Cao, B., Pan, Y. M., Tao, S. Q., and Zhang, N. L. (2023). Metabolite-mediated responses of Phyllosphere microbiota to rust infection in two Malus species. Microbiol. Spectr. 11, e03831–e03822. doi: 10.1128/spectrum.03831-22
Zhang, C., Zhou, D. F., Wang, M. Y., Song, Y. Z., Zhang, C., Zhang, M. M., et al. (2024). Phosphoribosylpyrophosphate synthetase as a metabolic valve advances Methylobacterium/Methylorubrum phyllosphere colonization and plant growth. Nat. Commun. 15:5969. doi: 10.1038/s41467-024-50342-9
Keywords: plant-microbe interactions, phyllosphere microbiota, leaf disease, Juglans regia L., high-throughput sequencing
Citation: Wang S, Tan Y, Luo Q, Fang X, Zhu H, Li S, Zhou Y and Zhu T (2025) Temporal dynamics of walnut phyllosphere microbiota under synergistic pathogen exposure and environmental perturbation. Front. Microbiol. 16:1551476. doi: 10.3389/fmicb.2025.1551476
Edited by:
Anna Maria Pirttilä, University of Oulu, FinlandReviewed by:
Denver Walitang, Romblon State University, PhilippinesCopyright © 2025 Wang, Tan, Luo, Fang, Zhu, Li, Zhou and Zhu. This is an open-access article distributed under the terms of the Creative Commons Attribution License (CC BY). The use, distribution or reproduction in other forums is permitted, provided the original author(s) and the copyright owner(s) are credited and that the original publication in this journal is cited, in accordance with accepted academic practice. No use, distribution or reproduction is permitted which does not comply with these terms.
*Correspondence: Tianhui Zhu, emh1dGgxMjI3QDEyNi5jb20=
†These authors have contributed equally to this work and share first authorship
Disclaimer: All claims expressed in this article are solely those of the authors and do not necessarily represent those of their affiliated organizations, or those of the publisher, the editors and the reviewers. Any product that may be evaluated in this article or claim that may be made by its manufacturer is not guaranteed or endorsed by the publisher.
Research integrity at Frontiers
Learn more about the work of our research integrity team to safeguard the quality of each article we publish.