 Longhui Deng1,2
 Damian Bölsterli1
 Clemens Glombitza3†
 Bo Barker Jørgensen3†
 Hans Røy3†
 Mark Alexander Lever1,4*
- 1Institute of Biogeochemistry and Pollutant Dynamics, Swiss Federal Institute of Technology, ETH Zurich, Zurich, Switzerland
- 2School of Oceanography, Shanghai Jiao Tong University, Shanghai, China
- 3Center for Geomicrobiology, Department of Bioscience, Aarhus University, Aarhus, Denmark
- 4Marine Science Institute, University of Texas at Austin, Port Aransas, TX, United States
Marine sediments contain Earth’s largest reservoir of methane, with most of this methane being produced and consumed in situ by methane-cycling archaea. While numerous studies have investigated communities of methane-cycling archaea in hydrocarbon seeps and sulfate–methane transition zones, less is known about how these archaea change from the seafloor downward throughout diffusion-dominated marine sediments. Focusing on four continental margin sites of the North Sea-Baltic Sea transition, we here investigate the in situ drivers of methane-cycling archaeal community structure and metabolism based on geochemical and stable carbon-isotopic gradients, functional gene (mcrA) copy numbers and phylogenetic compositions, and thermodynamic calculations. We observe major changes in community structure that largely follow vertical gradients in sulfate concentrations and lateral gradients in organic carbon reactivity and content. While methane-cycling archaeal communities in bioturbated and sulfatic zones are dominated by known methyl-disproportionating Methanosarcinaceae and putatively CO2-reducing Methanomicrobiaceae, the communities change toward dominance of methane-oxidizing taxa (ANME-2a-b, ANME-2c, ANME-1a-b) in sulfate–methane transition zones (SMTZs). By contrast, the underlying methanogenesis zones are dominated by the physiologically uncharacterized ANME-1d, new genus-level groups of putatively CO2-reducing Methanomicrobiaceae, and methyl-reducing Methanomassiliicoccales. Notably, mcrA copy numbers of several major taxa increase by 2 to 4 orders of magnitude from the sulfatic zone into the SMTZ or methanic zone, providing evidence of net population growth in subsurface sediment. We propose that burial-related geochemical changes cause methane-cycling archaea in continental margin sediments to go through three successional stages (sulfatic, SMTZ, methanic). Herein, the onset of each new successional stage is characterized by a period of growth- and mortality-driven turnover in the dominant taxa.
Introduction
Despite being Earth’s largest methane reservoir, marine sediments are only minor sources of atmospheric methane compared to freshwater sediments (Reeburgh, 2007). High concentrations of sulfate in seawater restrict most microbial methane production to deeper sediment layers beneath the ‘sulfatic zone’ (Jørgensen, 2021) and promote the anaerobic oxidation of >90% of marine sedimentary methane before it can reach the seafloor or overlying water (Reeburgh, 2007). Nonetheless, recent studies suggest that methane emissions from marine sediments are higher than previously thought, particularly in coastal and continental shelf environments (Weber et al., 2019; Lapham et al., 2024). These emissions may increase in the future due to eutrophication and climatic warming (James et al., 2016), which promote bottom water oxygen depletion and water column stratification and lead to shallowing of methanic zones (Dean et al., 2018; Bianchi et al., 2021).
Most sedimentary methane is produced by methanogenic archaea (methanogens). The latter convert microbial fermentation products to methane via a process known as methanogenesis (Schink, 1997). The distribution of methanogens is partially controlled by competition with respiring microorganisms that use oxygen, nitrate, metal oxides (Mn(IV), Fe(III)), or sulfate as electron acceptors. These organisms typically have higher energy gains from the same energy substrates than methanogens (Lovley and Goodwin, 1988). As a result, methanogenesis often dominates respiration only in deeper, so-called ‘methanic zones’ (Jørgensen, 2021), in which these energetically superior electron acceptors are depleted (Jørgensen and Kasten, 2006). A major fraction of the methane produced in methanic zones diffuses into overlying sulfate–methane transition zones (SMTZs), where it is consumed by Anaerobic Oxidation of Methane (AOM), a process that is performed by ANaerobic MEthanotrophic archaea (ANME), which are closely related to methanogenic archaea. These ANMEs, in many cases through syntrophic associations with bacteria, couple AOM to the reduction of sulfate (Boetius et al., 2000), metal oxides (Ettwig et al., 2016), or nitrate (Haroon et al., 2013). Among these, AOM coupled to sulfate reduction is by far the most important methanotrophic pathway in anoxic marine sediments (Egger et al., 2018).
Multiple archaeal taxa have been linked to methanogenesis and AOM in marine sediments. Previous studies suggest that the dominant methanogens belong to the euryarchaeal orders Methanomicrobiales, Methanosarcinales, Methanocellales, Methanobacteriales and Methanomassiliicoccales (Lever, 2013; Wen et al., 2017). Known ANMEs are also Euryarchaeota and include the order-level ANME-1, the family-level ANME-2a-b (“Candidatus Methanocomedenaceae”), ANME-2c (“Candidatus Methanogasteraceae”), and ANME-2d (Methanoperedenaceae) (order Methanosarcinales), and the genus-level ANME-3 (“Candidatus Methanovorans”) (family Methanosarcinaceae; Chadwick et al., 2022).
All known archaeal methanogens produce methane via the reductive acetyl CoA pathway, and reduce methyl coenzyme M to methane via methyl coenzyme M reductase as a terminal step (Liu and Whitman, 2008). Four variations of this pathway are known, which differ in carbon substrates: (a) CO2 reduction, typically involving H2 or formate as electron donors (‘hydrogenotrophic’); (b) acetate disproportionation (‘aceticlastic’); (c) methylated compound, e.g., methanol, methylamines, or methylsulfides, cycling by methyl group disproportionation or methyl group reduction with H2 (‘methylotrophic’; Whitman et al., 2014); and (d) O-demethylation of methoxylated aromatic compounds (methoxydotrophic; Mayumi et al., 2016). In addition, some methanogens, e.g., Methanothrix and Methanosarcina (both Methanosarcinales), perform CO2 reduction by extracellular electron transfer (EET) via conductive structures that connect to partner organisms, minerals or organic carbon compounds (Rotaru et al., 2014; Gao and Lu, 2021).
Most biogenic methane is believed to be produced via the aceticlastic and hydrogenotrophic reactions (Conrad, 1999, 2020), with CO2 reduction prevailing in methanic zones of marine sediments. This inference is mainly based on measurements indicating that CO2 reduction produces more negative carbon isotopic signatures (δ13C-CH4: −60 to −110‰) than aceticlastic methanogenesis (δ13C-CH4: −50 to −60‰; Whiticar et al., 1986), and by direct measurements with radiolabeled CO2 and acetate (Beulig et al., 2018). By contrast, methyl group disproportionation has been shown to frequently dominate methanogenic reactions in sulfate-reducing marine surface sediments (Xiao et al., 2018; Zhuang et al., 2018). This co-existence of methanogens with sulfate reducers at high sulfate concentrations has been attributed to methylated compounds being “non-competitive” substrates that are not used by most sulfate reducers (Oremland et al., 1982; King, 1984).
To date, most research on sedimentary methane-cycling archaea has focused on advective systems, such as hydrocarbon seeps (Knittel et al., 2005; Lloyd et al., 2010; Orcutt et al., 2010; Yanagawa et al., 2011; Ruff et al., 2015; Takano et al., 2018; Niu et al., 2022), and on SMTZs of diffusion-dominated sediments (Harrison et al., 2009; Beulig et al., 2019). Comparatively less is known about the community structure and pathways of methanogenesis and AOM in bioturbated surface sediments [bioturbation zone (BZ)], sulfatic zones (SZs), and methanic zones (MZs) of diffusion-dominated sediments, and how these communities and pathways respond to vertically changing geochemical conditions and laterally changing sedimentary settings. Here we explore the diversity, community structure and pathways of methane-cycling communities and their potential environmental drivers at four continental margin sites at the North Sea-Baltic Sea transition. We integrate chemical, stable isotopic, and Gibbs energy data with methane-cycling archaeal abundance and community data from three sites that range from coastal eutrophic to off-shore oligotrophic and differ greatly in sedimentation rates, organic carbon inputs, electron acceptor distributions, as well as microbial and macrofaunal activity and community structure. We used sediment cores previously described by Kristensen et al. (2018) and Deng et al. (2020), three of which extend well into the MZ and were sampled at high depth resolution across the SMTZ, thus allowing for detailed analyses of methanogenic and methanotrophic community shifts across this important biogeochemical transition. Based on our comprehensive geochemical and microbiological dataset, we identify key drivers of methanogenic and methanotrophic communities in continental margin sediments.
Materials and methods
Site description
All samples were taken during a cruise of the R/V Aurora in August–September 2014. The four sites AU1 (586 m water depth), AU2 (319 m), AU3 (43 m), and AU4 (37 m) are located along a water-depth and bioturbation gradient from the North Sea into the Baltic Sea (Figure 1). Organic matter reactivity and sedimentation rates (AU1: 0.14 cm yr−1; AU2: 0.27 cm yr−1; AU3: 0.30 cm yr−1; AU4: 0.33 cm yr−1) increase with decreasing water depth and distance to shore (Deng et al., 2020). AU1 and AU2 are in the Skagerrak region, with AU1 being located near the bottom of the Norwegian Trench and AU2 on the southern slope of the same trench. Both sites are characterized by silty clay and low-reactivity allochthonous organic matter and have high rates of iron and manganese reduction in the top 10 cm (Kristensen et al., 2018; Deng et al., 2020). AU3 in the northern Kattegat is dominated by fine sands, while AU4 in Lillebælt Strait, which leads into the Baltic Sea, is dominated by silty clay. AU4 is subject to seasonal bottom water hypoxia and was sulfidic with the exception of a 1 mm thick oxidized surface layer (Kristensen et al., 2018). Macrofaunal biomass increases from AU1 to AU3, but macrofauna was absent from AU4 at the time of sampling (Kristensen et al., 2018; Deng et al., 2020). The depths of macrofaunal ventilation and sediment reworking are lowest at AU1 (ventilation: 0–5 cm; reworking: 0–8 cm) and in a similar range at AU2 (ventilation: 0–13 cm; reworking: 0–40 cm) and AU3 (ventilation: 0–12 cm; reworking: 0–35 cm) (Deng et al., 2020).
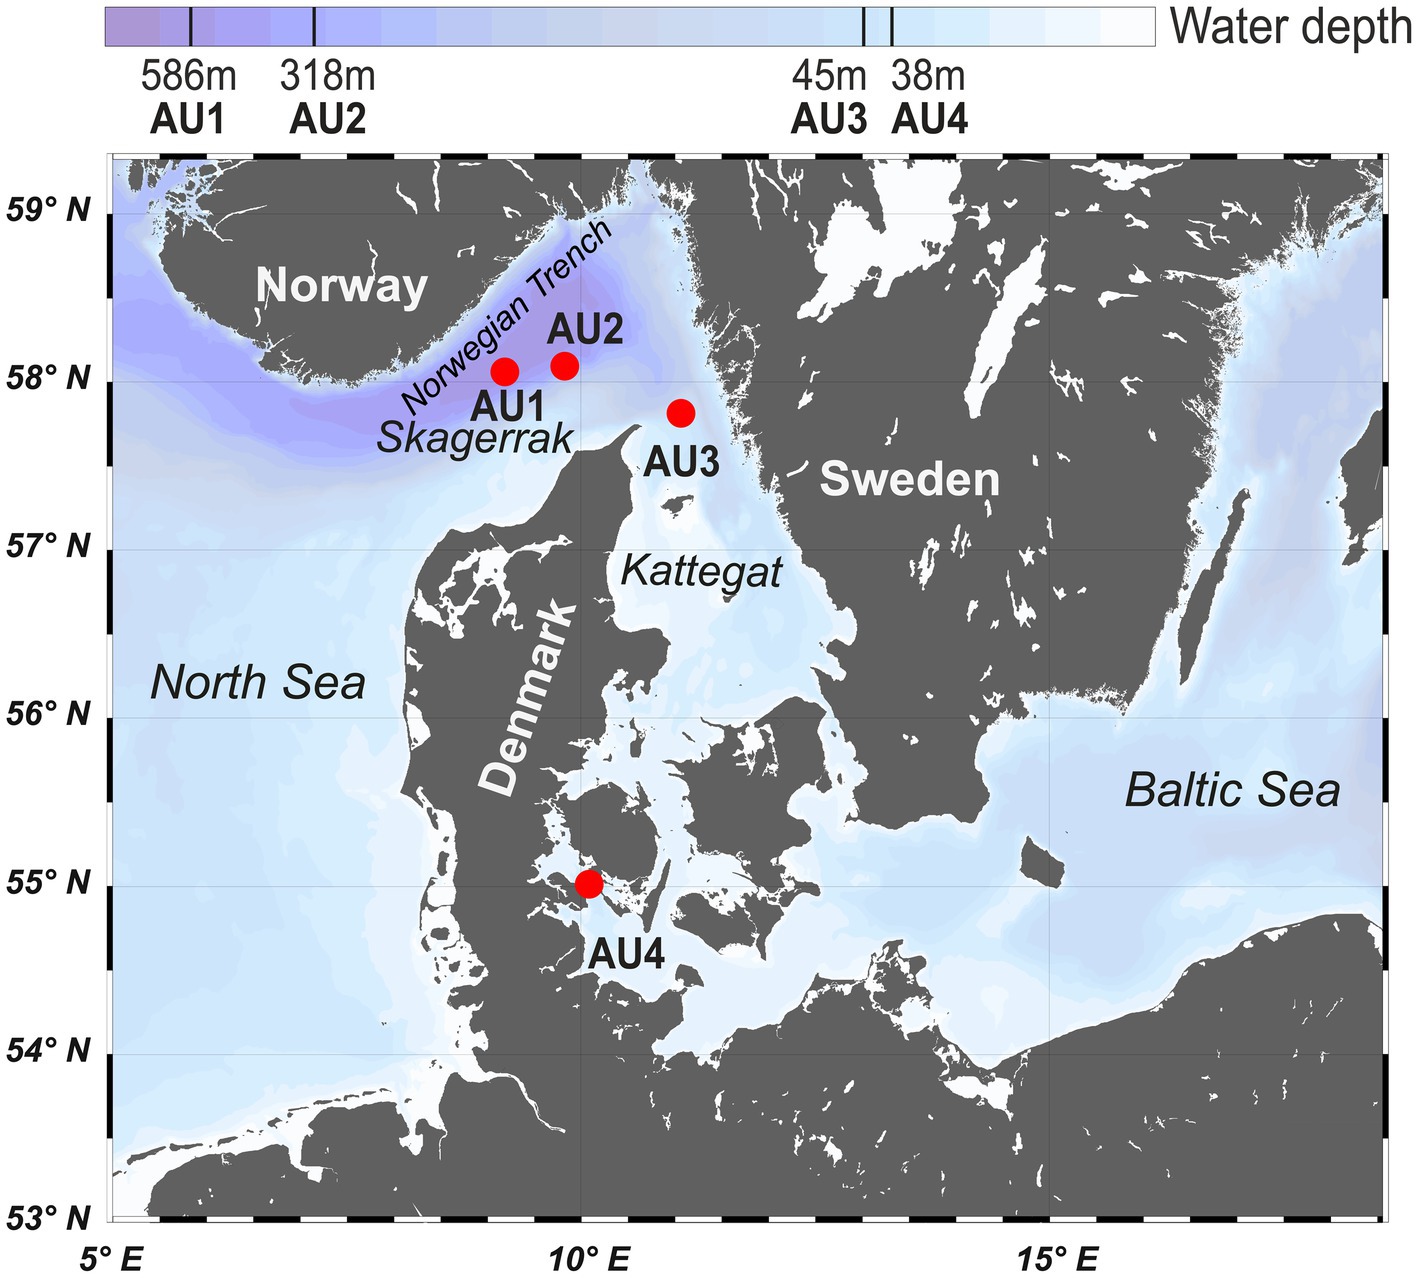
Figure 1. Map of the Skagerrak-Kattegat-Belt Sea area. The four sampling sites (AU1-AU4) fall along a gradient of decreasing water depth and are indicated by red dots.
Sampling scheme
The top 40–50 cm of sediment was sampled using a Rumohr corer, a lightweight (45 kg) gravity corer without a core catcher, which can recover cores with undisturbed surface sediments. All deeper sediments [to 500 cm below seafloor (cmbsf)] were collected using a conventional gravity corer with a 6 m steel barrel, core catcher, internal PVC core liner, and approximately 1,000 kg of lead weight. Sediment porewater was sampled from Rumohr cores in 5 cm depth intervals. Porewater from gravity cores was collected in 10 cm intervals in the upper 1 m, and in 25 cm intervals below. Porewater was extracted using rhizon samplers (Rhizosphere, The Netherlands) that were inserted horizontally through 4 mm wide holes drilled into the side of the PVC core liners. Of the porewater samples, a 1 mL aliquot was immediately used for pH and alkalinity determination. In addition, 1 mL was preserved with 10 μL saturated HgCl2 at 4°C for DIC and δ13C-DIC analyses, 1 mL was stored at 4°C for dissolved SO42− quantification, and 2–4 mL were frozen at −20°C for analyses of volatile fatty acid (VFA) concentrations. Subsequently, the Rumohr cores were extruded in 2 cm intervals to 20 cm depth followed by 4 cm intervals to 48 cm depth, while the gravity cores were sampled at 8–10 cm depth intervals. All sediment for DNA, methane, δ13C-methane, total organic carbon (TOC), and δ13C-TOC analyses was sampled using 5 mL sterile, cut-off syringes. Samples for DNA, TOC, and δ13C-TOC analyses were immediately frozen at −20°C and transferred to −80°C upon arrival at the home laboratory. Samples for analyses of methane concentrations and δ13C-methane were preserved in saturated NaCl (6 M) and stored at 4°C until measurement.
DNA extraction
DNA was extracted from sediments following lysis protocol II of Lever et al. (2015) using 0.2 g of wet sediment per sample. This protocol combines chemical (lysis solution I) and mechanical cell lysis (bead-beating: 0.1 mm Zirconium beads), 2× washing with chloroform:isoamyl alcohol (24:1), and precipitation with linear polyacrylamide, NaCl and ethanol. DNA was purified according to protocol A of the CleanAll DNA/RNA Clean-Up and Concentration Micro Kit (Norgen Biotek Corp., Canada). DNA extracts were the same as previously used for 16S rRNA gene quantification and sequencing in Deng et al. (2020).
Quantitative PCR (qPCR)
mcrA gene copy concentrations in DNA extracts were quantified on a LightCycler 480 II (Roche Life Science, Switzerland) by qPCR assays using the Mlas_F (5′- GGT GGT GTM GGD TTC ACM CAR TA −3′) / McrA-rev (5′- CGT TCA TBG CGT AGT TVG GRT AGT −3′) primer pair (Steinberg and Regan, 2009) and the LightCycler 480 SYBR Green I Master reaction mix (Roche Life Science, Switzerland). Thermal cycler protocols consisted of (1) enzyme activation and initial denaturation (95°C, 5 min) followed by (2) 50 cycles of (a) denaturation (95°C, 10 s), (b) annealing (53°C, 20 s), (c) elongation (72°C, 30 s), and (d) fluorescence measurement (84°C, 5 s), and lastly (3) a stepwise melting curve from 95 to 53°C in 1 min intervals to check for primer specificity. Plasmids of mcrA from Methanocorpusculum parvum were applied as standards. All standards and samples were measured in duplicate.
Sequencing and bioinformatics
mcrA amplicon libraries were prepared according to a published workflow that includes an initial booster PCR to increase amplicon copy numbers, followed by a “tailed primer PCR” to attach sequencing adaptors, and a final “index PCR” in which PCR products from each sample were labeled with sample-specific barcodes (Deng et al., 2020; Supplementary Information). Herein the number of PCR cycles was kept to a minimum to minimize primer biases. Throughout these PCR assays, we used the same primer pair and PCR conditions as for qPCR, except that we used the KAPA HiFI Hot Start ReadyMix instead of the SybrGreen I Master reagents. The mcrA amplicons were sequenced at ETH Zurich’s Centre for Genetic Diversity (https://gdc.ethz.ch/) using the Illumina MiSeq platform (Illumina Inc., California, USA). Raw reads were quality-checked by FastQC,1 read ends trimmed using seqtk,2 paired end reads merged using flash (Magoč and Salzberg, 2011), primer sites trimmed by usearch (Martin, 2011), and quality filtering done by prinseq (Schmieder and Edwards, 2011). Zero-radius Operational Taxonomic Units (ZOTUs) were generated using the UNOISE3 algorithm (Edgar, 2016) and clustered using a 97% identity threshold to generate 97% ZOTUs’ (referred to as ‘ZOTUs’ from now on). Taxonomic assignments were done in ARB3 using neighbor-joining phylogenetic trees with Jukes Cantor correction and 1,000 bootstrap replicate calculations. These trees were based on a public database (mcrA4All; Lever et al., 2023)4 with >2,400 high-quality, optimally aligned mcrA sequences from pure culture, amplicon sequencing, metagenome, and whole-genome studies. All mcrA ZOTU sequences are publicly accessible at the National Center for Biotechnology Information homepage (Accession #: KIEX00000000; BioProject: PRJNA1066864; BioSample: SAMN39507872).
Geochemical analyses
Depth profiles of TOC and δ13C-TOC and porewater concentrations of sulfate, methane, and DIC were published previously (Marshall et al., 2019; Deng et al., 2020). δ13C-DIC and δ13C-methane were analyzed as outlined in Lapham et al. (2024; all values reported in reference to VPDB). Concentrations of volatile fatty acids (VFAs) were determined by 2D-ion chromatography as previously published (Glombitza et al., 2014). pH was measured immediately after pore water retrieval followed by acid titration to determine alkalinity. 0.5 mL of pore water sample were titrated with diluted HCl (20, 40, or 80 mM) to reach an end pH value between 3.5 and 3.9. Alkalinity was calculated from the start and endpoint pH and the added amount of acid according to a standard method (Grasshoff et al., 1983).
Gibbs energy calculations
Gibbs energies (ΔGr) of (1) methanogenesis reactions from H2 + CO2 (HCO3− + 4 H2 + H+ ➔ CH4 + 3 H2O), acetate (CH3COO− + H2O ➔ CH4 + HCO3−), methanol (4 CH3OH ➔ 3 CH4 + HCO3− + H2O + H+), and methanol+H2 (CH3OH + H2 ➔ CH4 + H2O), (2) anaerobic acetate oxidation (CH3COO− + 4 H2O ➔ 2 HCO3− + 4 H2 + H+), and (3) sulfate-dependent AOM (SO42− + CH4 ➔ HS− + HCO3− + H2O) were calculated based on the equation
where ΔGr0 is the Gibbs energy (kJ mol−1 of reaction) at standard concentrations (1 M per each reactant and product, pH 7.0), corrected for in situ temperature T (K) and pressure p (bar) based on standard enthalpies and molar volumes as outlined in Stumm and Morgan (1996), R is the universal gas constant (0.008314 kJ mol−1 K−1), and Qr the quotient of product and reactant activities. Calculations were done for measured concentrations of DIC, acetate, methane, and sulfate, and measured pH values. For H2, methanol, and hydrogen sulfide (HS−) concentrations, which were not measured, we performed calculations for concentrations that were estimated to be at the lower and upper in situ extremes of these chemicals (H2: 0.1 nM and 10 nM; methanol: 1 nM and 1 μM; HS−: 1 nM and 10 mM). Calculations involving assumed concentration minima and maxima were used to assess the energetic feasibility of hydrogenotrophic and methylotrophic methanogenesis reactions and AOM, and the conditions or locations where these reactions were most likely to take place. Activities of all aqueous species were calculated from measured concentrations multiplied by their activity coefficients. These were γHCO32− = 0.532 (Millero and Schreiber, 1982), γCH4 = 1.24 (Millero, 2000), γSO42− = 0.104 (Millero and Schreiber, 1982), and γHS− = 0.685 (Clegg and Whitfield, 1991). The activity coefficients of H2 and acetate were set to those of methane and bicarbonate, respectively. We assumed an activity of 1.0 for methanol. Following convention, the activity of H+ was equal to its pH-value, and the activity of H2O was set to 1.0. Standard Gibbs energies (∆Gf°), standard enthalpies (∆Hf°), and standard molal volumes (∆Vf°) of formation are shown in Supplementary Table S1.
Multivariate statistics
All statistical analyses were performed in R.5 Richness (the observed number of ZOTUs), Pielou’s Evenness (a measure of how similar the abundances of different ZOTUs were; Heip et al., 1998), and Non-metric Multi-Dimensional Scaling (NMDS) based on Bray-Curtis distances of mcrA communities between samples were calculated using the ‘phyloseq’ package (McMurdie and Holmes, 2013). PERmutational Multivariate ANalysis Of VAriance (PERMANOVA, permutations = 999) and statistical tests (Welch’s t test and Wilcoxon test) were performed using the “vegan” and “stats” packages, respectively (McMurdie and Holmes, 2013). Correlations between abundances of mcrA groups and environmental variables were calculated and visualized using the “corrplot” package (Wei et al., 2017). All calculations were performed based on ZOTU-level phylogenetic assignments unless stated otherwise.
Results
Geochemical profiles related to the sedimentary methane cycle
The four stations show up to 10-fold differences in total organic carbon (TOC) contents, as well as an increase in microbial activity from deep to shallow stations (Figure 2). TOC contents (% sediment dry wt.) are highest at the sulfidic coastal station (AU4; 4.7–6%), lowest at the sandy shallow water station (AU3; 0.5–1%), and have intermediate values at the two deep stations (AU1: 1.3–1.9%; AU2; 1.7–2.1%). Corresponding DIC concentrations, used as a proxy for organic matter mineralization rates, indicate increases in DIC depth gradients from the deepest (AU1) to the shallowest station (AU4). This apparent increase in mineralization rates from deep to shallow water is also reflected in the depth of sulfate penetration, which decreases with water depth (AU1: >400 cm, AU2: 95 cm, AU3: 75 cm, AU4: 20 cm). Correspondingly, methane concentrations remain at background values (≤10 μM) throughout the sulfate-rich AU1 core but increase steeply to millimolar concentrations in the SMTZ at the three other stations. SO42− and DIC concentrations are nearly constant in the top 60, 10, and 25 cm of AU1, AU2, and AU3. This is explained by significant bioirrigation activity at these sites, and surface intervals with iron and manganese reduction-dominated microbial respiration at AU1 and AU2 (Kristensen et al., 2018; Deng et al., 2020).

Figure 2. Depth profiles of TOC, DIC, SO42−, CH4, δ13C-TOC, δ13C-DIC, δ13C-CH4, formate, and acetate at AU1-4. Depth intervals of the bioturbation zone (BZ), sulfatic zone (SZ), sulfate–methane-transition zone (SMTZ), and methanic zone (MZ) are indicated by horizontal dashed lines and gray bars, respectively. Due to out-gassing of CH4 from sediments with in situ CH4 concentrations >1 mM at atmospheric pressure during sampling, most measured CH4 concentrations below the SMTZ (symbols connected by the dotted lines) are likely to be significant underestimates and do not represent in situ concentrations.
The carbon stable isotopic compositions show clear trends across stations. The δ13C-TOC values throughout AU1 to AU3 and in the top 20 cm of AU4 are in the typical range of marine phytoplankton (−24 to −22‰; Fry and Sherr, 1989). Below 20 cm, the δ13C-TOC at AU4 increases slightly (−20‰ at 50 cm and below). The δ13C-CH4 at AU1 decreases from −30‰ at 5 cm to −41‰ at 390 cm. At AU2 and AU3, δ13C-CH4 values are also around −30‰ in surface sediments, but decrease throughout the SZ and SMTZ, reaching their lowest values right below the SMTZ (−80‰), before increasing slightly in deeper parts of the MZ (−70 to −60‰). In marked contrast, at AU4 δ13C-CH4 increases from −60‰ in the surface sediment to −50‰ at 40 cm and remains relatively constant below (−58 ± 2‰).
The δ13C-DIC profiles also show strong variations between sites. At all sites, δ13C-DIC values are near seawater values (0‰) in surface sediments. Yet, while at AU1 δ13C-DIC values show a gradual decrease with depth to −18‰ at 390 cm, all other stations have unimodal distributions, with the most negative δ13C-DIC values in the SMTZ (AU2: −30‰; AU3: −46‰; AU4: −10‰). In the uppermost section of the MZs, the δ13C-DIC increases steeply and leads to δ13C-DIC > 0‰ below a certain depth in the MZ (AU2: 3 m; AU3: 1.6 m; AU4: 0.2 m). δ13C-DIC at the bottoms of cores from these stations has values of +3‰ (AU2), +14‰ (AU3), and + 22‰ (AU4).
Concentrations of formate and acetate were generally in the low micromolar range (≤10 μM), with acetate concentrations exceeding those of formate in most samples. At AU1, both remain below 4 μM from 0 to 250 cm but show a strong subsurface peak at 265 cm (formate: 24 μM, acetate: 8 μM), below which concentrations drop again. At AU2, formate and acetate concentrations are <3 μM above the SMTZ. Below the SMTZ, formate concentrations increase down to 351 cm (formate: 6 μM; acetate: 9 μM) before decreasing again toward the core bottom (formate: 1 μM; acetate: 7 μM), and acetate shows an additional peak in the uppermost sample of the MZ (20 μM; 101 cm). By comparison, formate and acetate concentrations are more constant with depth at AU3 (formate: 0.9 ± 0.5 μM, acetate: 4 ± 1 μM). At AU4, both formate and acetate concentrations increase from 1.5 μM at 5 cm to 4–5 μM at 40 cm. Below this depth, formate concentrations gradually decrease to 0.7 μM, while acetate concentrations gradually increase to 11 μM.
Depth-related trends in absolute and relative abundances of mcrA copies
Copy numbers of mcrA are similar in surface sediments of all sites, independent of whether these are bioturbated and have an oxidized surface layer (AU1-3) or not (AU4). Yet, copy numbers increase from the oligotrophic AU1 to the eutrophic AU4 when deeper layers are compared. In addition, mcrA copies increase from the SMTZ into the underlying MZ at AU2-4, suggesting net population growth of methane-cycling archaeal populations after sediment burial (Figure 3A).
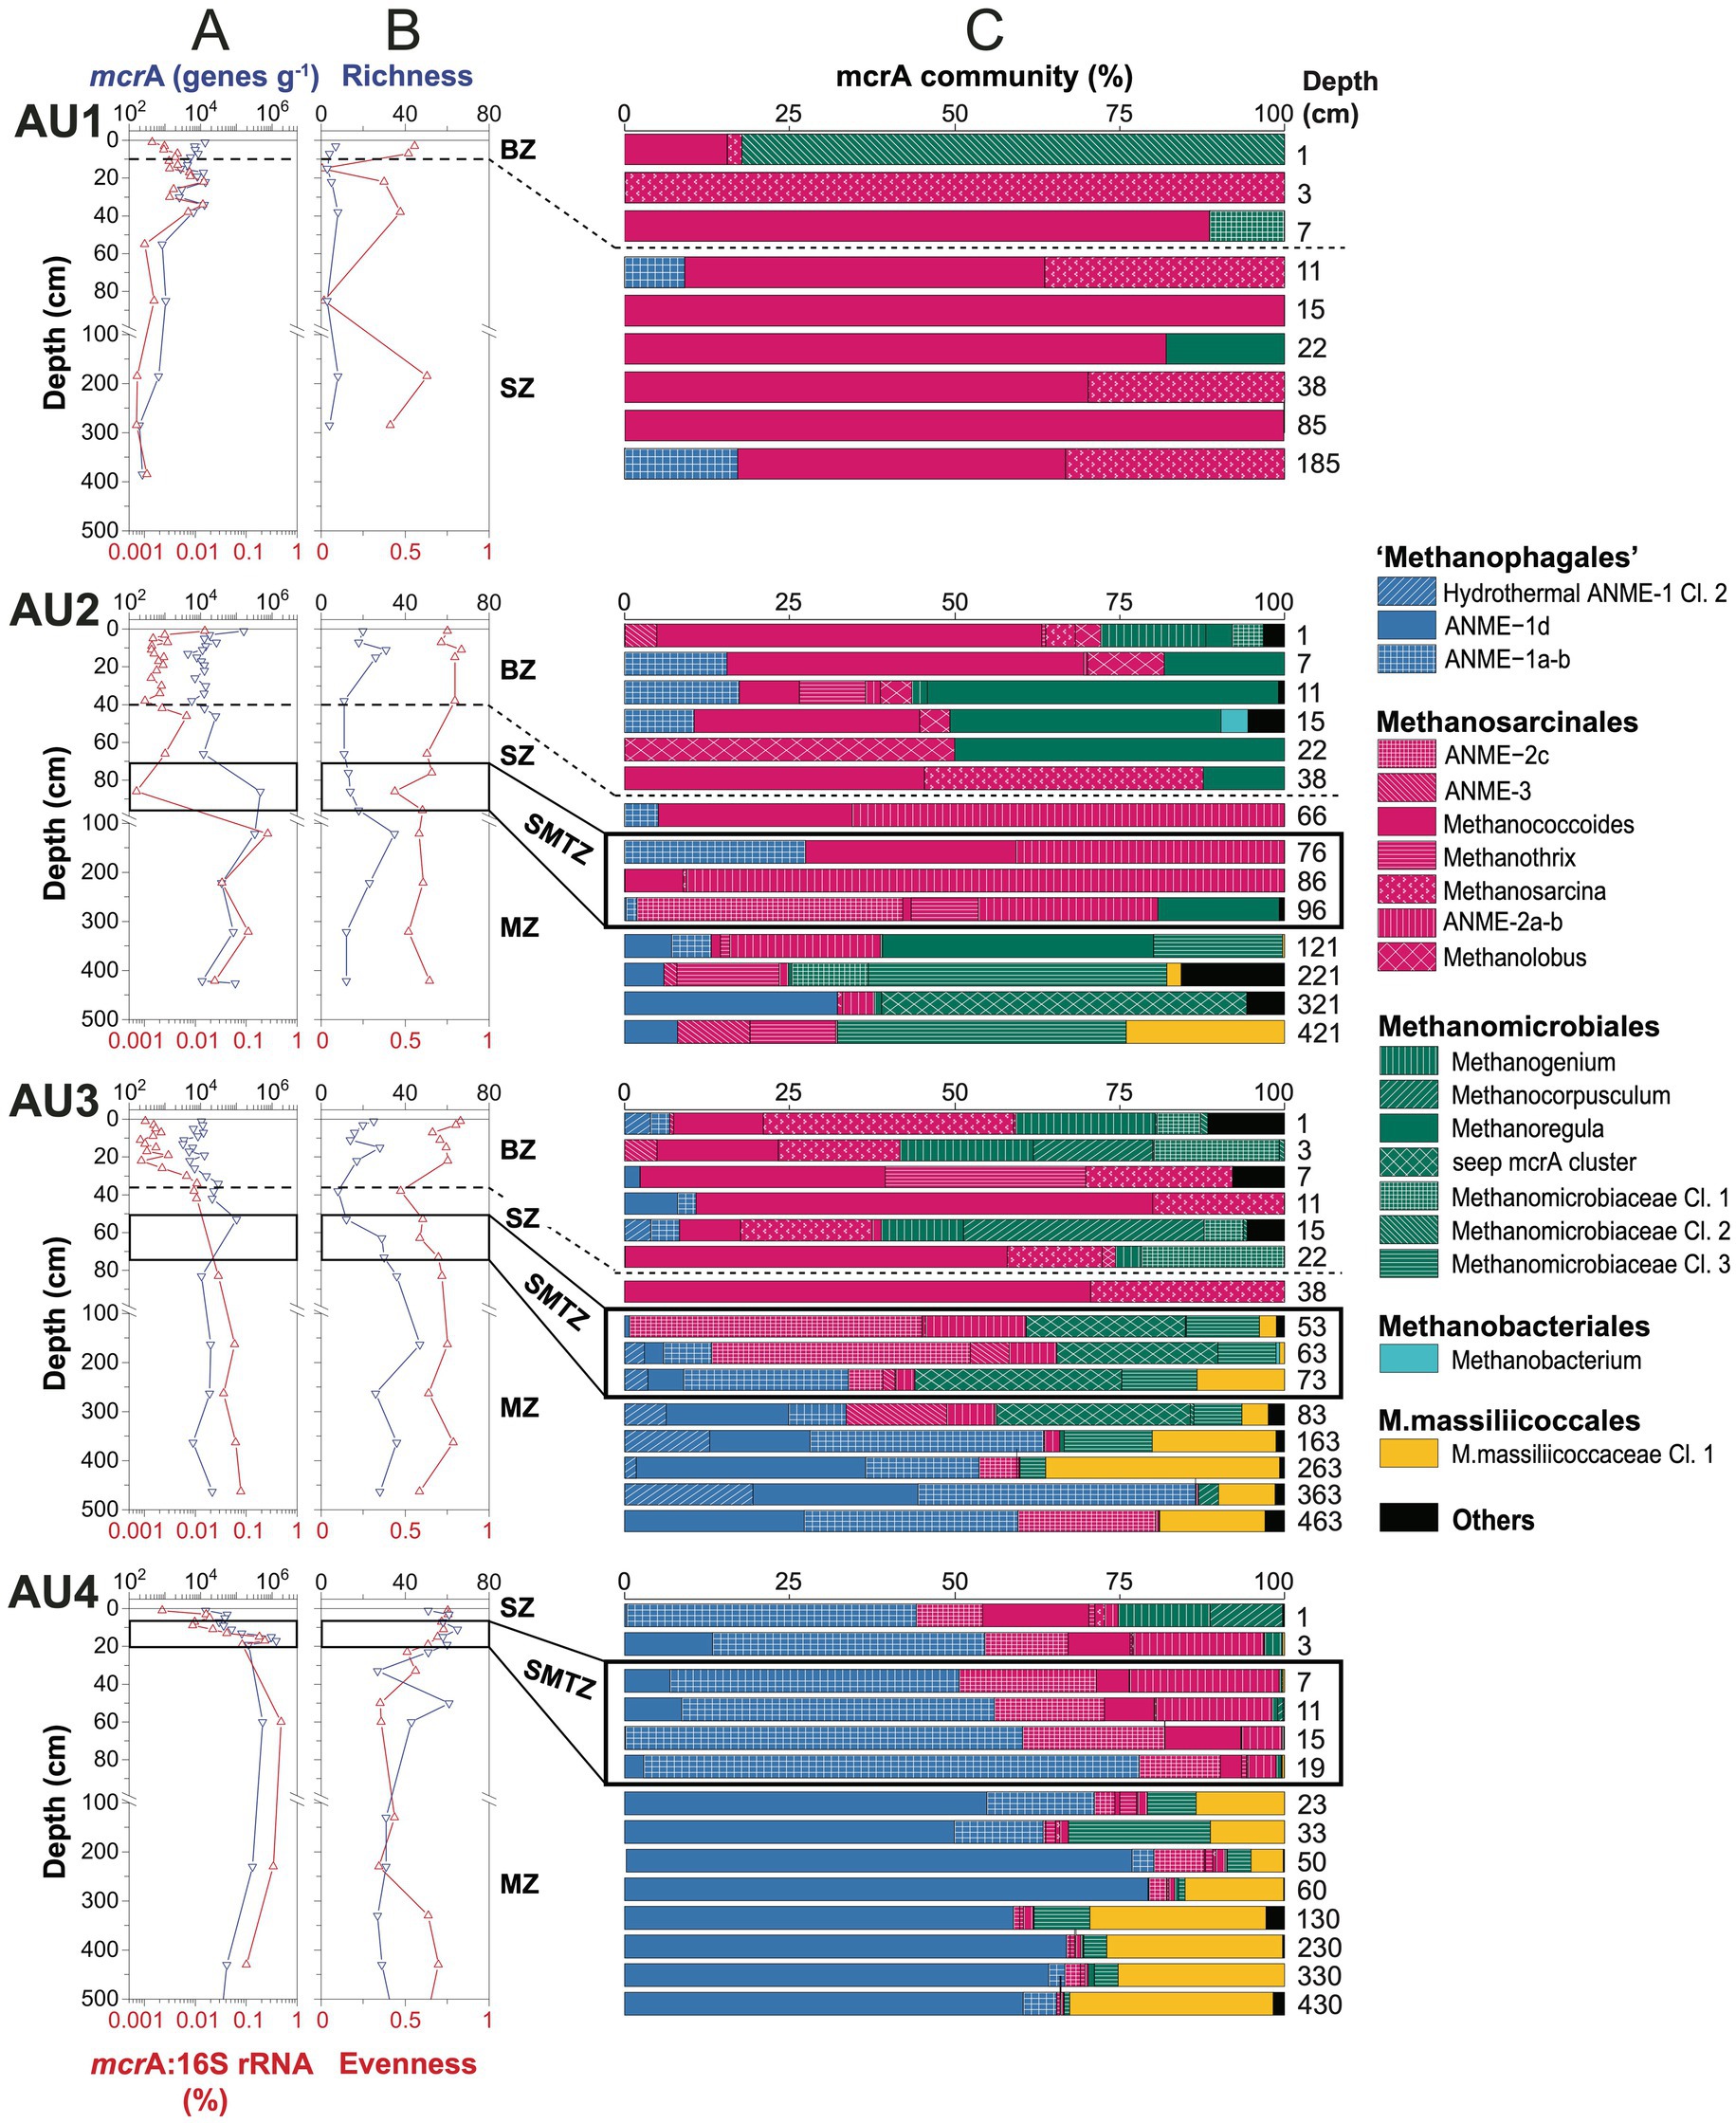
Figure 3. Depth profiles of methane-cycling archaeal communities at AU1-4. (A) mcrA gene copy numbers per gram wet sediment and ratios of mcrA to total 16S rRNA gene copy numbers; (B) richness and evenness based on mcrA ZOTUs clustered at 97% similarity level; (C) mcrA community composition at the genus-level. Samples above the horizontal dashed lines were located within the bioturbation zone. Black boxes indicate samples that were located within the sulfate–methane transition. BZ, bioturbation zone; SZ, sulfatic zone; SMTZ, sulfate–methane transition zone; MZ, methanic zone.
At AU1, mcrA abundances fluctuate around 104 gene copies g−1 within the upper 40 cm and decrease to ~102 gene copies g−1 below. At AU2, except for a high value at the sediment surface (~105 genes g−1), mcrA copies are relatively stable (~104 genes g−1) within the bioturbated upper 40 cm, below which they increase to 5 × 10⁵ copies g−1 at and right below the SMTZ, and then decrease gradually to ~104 g−1 at the core bottom. At AU3, mcrA copies are ~104 g−1 in the strongly bioturbated top 20 cm, increase to ~105 g−1 at 53 cm and are relatively stable around 104 g−1 below. At AU4, mcrA copies increase from ~104 g−1 at the sediment surface to ~106 g−1 around the SMTZ (20 cm) and are relatively constant below (~105 g−1).
Abundances of methane-cycling archaea relative to total microbial abundances were estimated based on ratios of mcrA to total 16S rRNA gene copy numbers (bacterial+archaeal). These ratios suggest (local) increases in the relative abundances of methane-cycling archaea with sediment depth at all 4 locations. At AU1, which has no MZ, these increases are restricted to sediments near and right below the bottom of the BZ (1 cm: 0.001%; 22 cm: 0.015%), below which they decrease back to 0.001%. At the other three stations, relative abundances are in the same range as at AU1 in surface sediment (0.001%) and also increase at the bottom of the BZ (AU2, AU3). An additional increase occurs further down across the SMTZ into the uppermost MZ, where maximum values of 0.3% (AU2), 0.1% (AU3), and 0.5% (AU4) are reached. While relative abundances of methane-cycling archaea were highest at the core bottom of AU3, relative abundances at AU2 and AU4 decreased again toward the core bottom to values of 0.01% (AU2) and 0.1% (AU4).
Zonation of major methane-cycling archaeal clades in relation to sites and vertical zones
mcrA richness calculated based on ZOTUs increases from AU1 to AU4 (Figure 3B). At AU1, ZOTU richness is low remaining <10 at all depths. The other locations have higher richness, and have local peaks of ≥30 ZOTUs in the BZ and/or upper MZ. Pielou’s Evenness, which was also based on ZOTUs, is on average lowest with high scatter at AU1, and is stable with slight depth-related decreases at the other stations. Overall, evenness is highest at AU3.
The community composition of methane-cycling archaea varies greatly across sites and in relation to the BZ, SZ, SMTZ, and MZ (Figure 3C; for taxonomic assignments see phylogenetic tree in Figure 4). Diverse genera of Methanosarcinales and Methanomicrobiales dominate throughout AU1 and AU2, and down to the SMTZ of AU3, while the Candidate order Methanophagales (ANME-1) dominates the lower part of the SMTZ and MZ of AU3 and AU4. Notably also, Methanomassiliicoccales account for major fractions (~10–35%) of mcrA reads throughout the MZs of AU3 and AU4 and at the bottom of AU2.
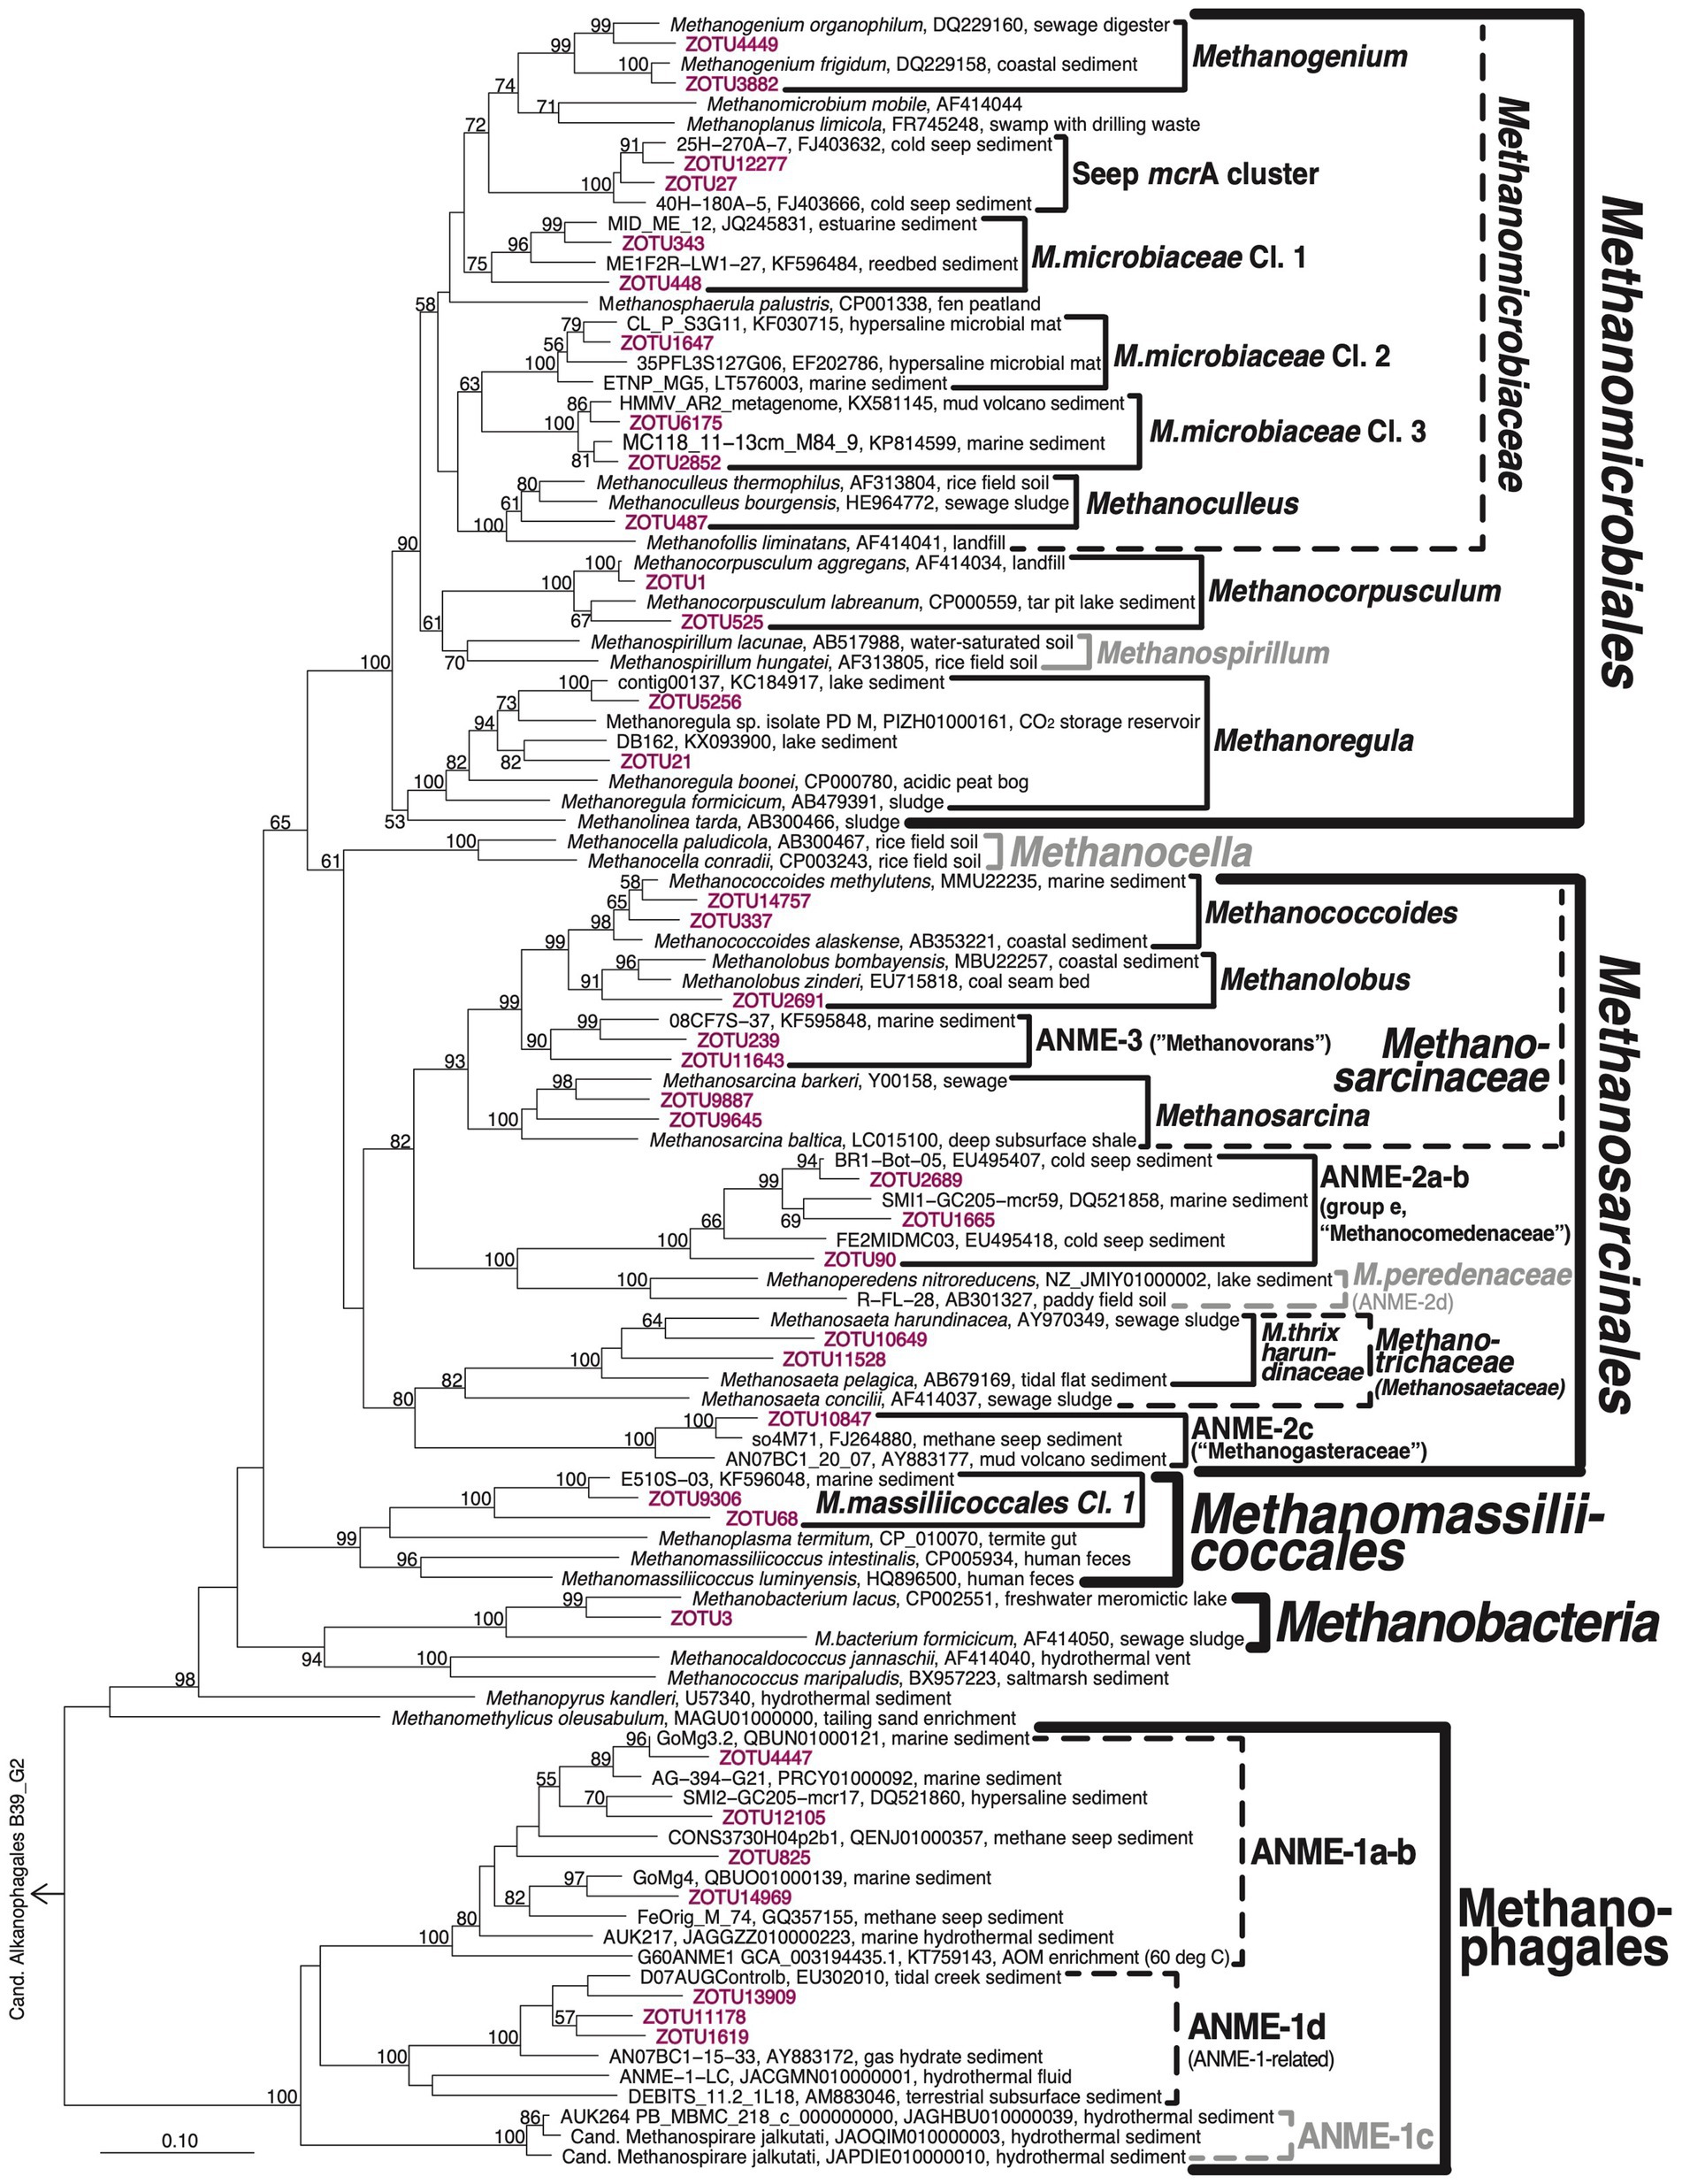
Figure 4. Phylogenetic tree of mcrA clades. Representative ZOTUs of environmentally important clades are shown in magenta. Latin names of proposed candidate taxa based on genomic analyses are placed in quotes. Clades that were not detected but included for illustration purposes are shown in gray. ‘Hydrothermal ANME-1 cluster’ (represented by ZOTU825) is treated as separate from ANME-1a-b in Figure 3 and in the text because of its clear phylogenetic separation from ANME-1a-b in more extensive, sequence-rich mcrA trees.
At the genus- and family-level we observe additional site- and geochemical zone-related trends (also see Figure 4 and next section). AU1 is dominated by a new cluster of Methanomicrobiales (Methanomicrobiaceae Cluster 2) at the sediment surface. Throughout the remaining core, sequences belonging to Methanococcoides and Methanosarcina (both Methanosarcinaceae) dominate, with minor contributions of ANME-1a-b, Methanoregula and Methanomicrobiaceae Cl. 1 in a few layers.
Methanococcoides and Methanolobus dominate the BZ and SZ of AU2 along with Methanoregula and Methanogenium. A major shift occurs in the SMTZ, where sequences of the family-level ANME-2a-b (also known as ‘group e’ or Candidatus Methanocomedenaceae), a sister clade of anaerobic methane-oxidizing Methanoperedenaceae (both Methanosarcinales), dominate, along with methanotrophic ANME-2c (Methanogasteraceae) (one sample only). A second shift occurs below in the MZ, toward a heterogeneous assemblage dominated by the new Methanomicrobiaceae Cluster 3, seep mcrA cluster (Lever and Teske, 2015), and Methanoregula (all Methanomicrobiales). Notably, Methanothrix (also known as Methanosaeta) account for significant percentages (~10–15%) in several layers, as do ANME-1d, a sister clade of ANME-1a-b [(Lever et al., 2023); for further information, see next section]. ANME-1a-b are also abundant at AU2, but mainly in and above the SMTZ.
Methanococcoides, Methanosarcina, Methanogenium and Methanomicrobiaceae Cl. 1 (also) dominate the BZ and upper SZ of AU3, along with Methanocorpusculum. As at AU2, there is a clear community shift in the lower SZ and SMTZ, where ANME-2a-b, ANME-2c, ANME-3 (“Candidatus Methanovorans”), seep mcrA cluster, and Methanomicrobiaceae Cl. 3 become dominant. In the lower part of the SMTZ the community shifts again, becoming dominated by ANME-1a-b, ANME-1d, and Methanomassiliicoccales in the MZ.
The vertical zonation at AU4, which has no bioturbation zone, is distinct from the other sites. ANME-1-a-b dominates the SZ and SMTZ and is replaced by ANME-1d in the upper part of the MZ. The SZ and SMTZ additionally have significant percentages of ANME-2a-b, ANME-2c, and Methanococcoides, while Methanogenium and Methanocorpusculum contributely to communities in surface sediment. In addition to ANME-1d, Methanomassiliicoccales and to a lesser degree Methanomicrobiaceae Cl. 3 and ANME-2c are relatively abundant in the MZ.
mcrA phylogeny
A phylogenetic tree confirms the high diversity of methane-cycling archaeal taxa at the four sites (Figure 4). Most of this diversity is within the Methanomicrobiales and Methanosarcinales. While uncharacterized clusters dominate the former, the latter are dominated by metabolically well-characterized groups. Phylogenetic diversity is considerably lower within the ANME-1/Methanophagales, the Methanomassiliicoccales (class Thermoplasmata), and Methanobacteria.
In terms of phylogenetic diversity, the Methanomicrobiales are dominated by Methanomicrobiaceae, which comprise six of the eight detected Methanomicrobiales clusters. Within the Methanomicrobiaceae, the genera Methanogenium and Methanoculleus have cultured members, whereas the Seep mcrA cluster and newly proposed Methanomicrobiaceae Clusters 1–3 are only known from environmental samples, including methane seeps (Seep mcrA cluster) and a range of marine sedimentary habitats (Methanomicrobiaceae Cl. 1–3; Figure 4). Since all cultured members of Methanomicrobiaceae perform methanogenesis by CO2 reduction using H2 or formate as electron donors (Whitman et al., 2014), the four uncharacterized Methanomicrobiaceae likely also perform these reactions. The remaining groups consist of close relatives of Methanocorpusculum aggregans and a subcluster of Methanoregula. Cultured members of both groups reduce CO2 using H2 and/or formate as electron donors (Whitman et al., 2014).
The Methanosarcinales groups present consist of Methanococcoides and Methanolobus, which grow by disproportionation of methanol and methylamines (both genera), and several additional C1 compounds (certain Methanolobus; Oremland and Boone, 1994, Liang et al., 2022). The closely related ANME-3 group is considered to be methanotrophic (Bhattarai et al., 2019). Methanosarcina are substrate generalists, known to produce methane from H2/CO2, acetate, methanol, methyl sulfides, and methylamines, but not formate (Whitman et al., 2014). In addition, members of this group can grow by CO2 reduction via extracellular electron transfer (EET) from minerals or syntrophic partners (Rotaru et al., 2014; Gao and Lu, 2021). Outside of the Methanosarcinaceae the three additional groups of Methanosarcinales include ANME-2a-b (also known as group e), a sister clade of Methanoperedenaceae, members of which use nitrate-, iron(III)-, and manganese(IV) as electron acceptors for AOM (Haroon et al., 2013; Ettwig et al., 2016). Members of ANME-2a-b have been widely reported from methane seeps with AOM (e.g., Hallam et al., 2003; Lloyd et al., 2006). In addition, the known methanotrophic ANME-2c group (also known as ‘group c-d’; Knittel and Boetius, 2009) is present along with aceticlastic Methanotrichaceae (also known as Methanosaetaceae; Oren, 2014). Within the latter, all sequences fall into a genus-level cluster with the previously isolated Methanothrix pelagica and Methanothrix harundinaceae. Notably, Methanothrix harundinacea, similar to certain Methanosarcina, can also grow by CO2 reduction via DIET (Gao and Lu, 2021).
The community structure of Methanophagales consists of two major groups. ANME-1a-b is one of the most studied groups of methanotrophic archaea. Different from phylogenomic or 16S rRNA gene sequence analyses, ANME-1a cannot be reliably separated from ANME-1b based on mcrA sequence analyses (hence the name ANME-1a-b). In addition, we detect the recently named ANME-1d cluster (Lever et al., 2023). This cluster, which is also known as ANME-1-related group (Lever and Teske, 2015; Aromokeye et al., 2020), has been found in subseafloor sediments (Lever et al., 2023), serpentinitic hydrothermal vents (Kelley et al., 2005), deep coalbeds (Fry et al., 2009), and gas hydrate sediments (Kormas et al., 2008). ANME-1d is phylogenetically clearly distinct from ANME-1a-b (Figure 4), likely representing a separate family or even order (Lever and Teske, 2015).
The Methanomassiliicoccales detected here belong to a phylogenetic cluster that is distinct from the cultured genus Methanomassiliicoccus or the genome-sequenced candidate genera Methanoplasma or Methanomethylophilus. The closest relatives of this cluster based on mcrA phylogeny were detected in other (marine) sedimentary environments (e.g., KF596048, KF595850, AND KF595354 from Zhou et al., 2015). Based on pure culture and genomic evidence all three known genera of Methanomassiliicoccales are methanogens that reduce methanol or methylamines with H2 (Lang et al., 2015; Kröninger et al., 2017). Members of the CO2-reducing Methanobacteriales, which were only detected at significant abundances in one sample from the bioturbation zone of AU2, are represented by one phylotype (ZOTU3) that is most closely related to Methanobacterium lacus.
Substrate use
Known substrate uses of different methane-cycling archaeal groups provide insights into the distributions of methane-cycling pathways in the sediment (Figure 5). Taxa that perform methyl disproportionation were largely restricted to the BZ and SZ of AU1-AU3. By contrast, taxa that use methanol+H2, were largely absent from these layers, but increased to significant percentages in the MZ. Known CO2-reducing taxa showed rather patchy distributions, dominating AU2 except in the SMTZ, showing locally high percentages in all major zones of AU3, and being numerically abundant in surface and a few deeper samples of AU1 and AU4. Putative methanotrophs (ANME-1a-b, Hydrothermal ANME-1, ANME-2) accounted for high percentages in all SMTZs. In addition, these methanotrophs dominated the MZ of AU3 and SZ of AU4, and had locally significant contributions in the BZ and SZ of AU1-AU3. Remarkably, the energy substrates of a major, locally dominant, fraction of mcrA reads, belonging primarily to ANME-1d and uncultured Methanomicrobiaceae, are unknown.
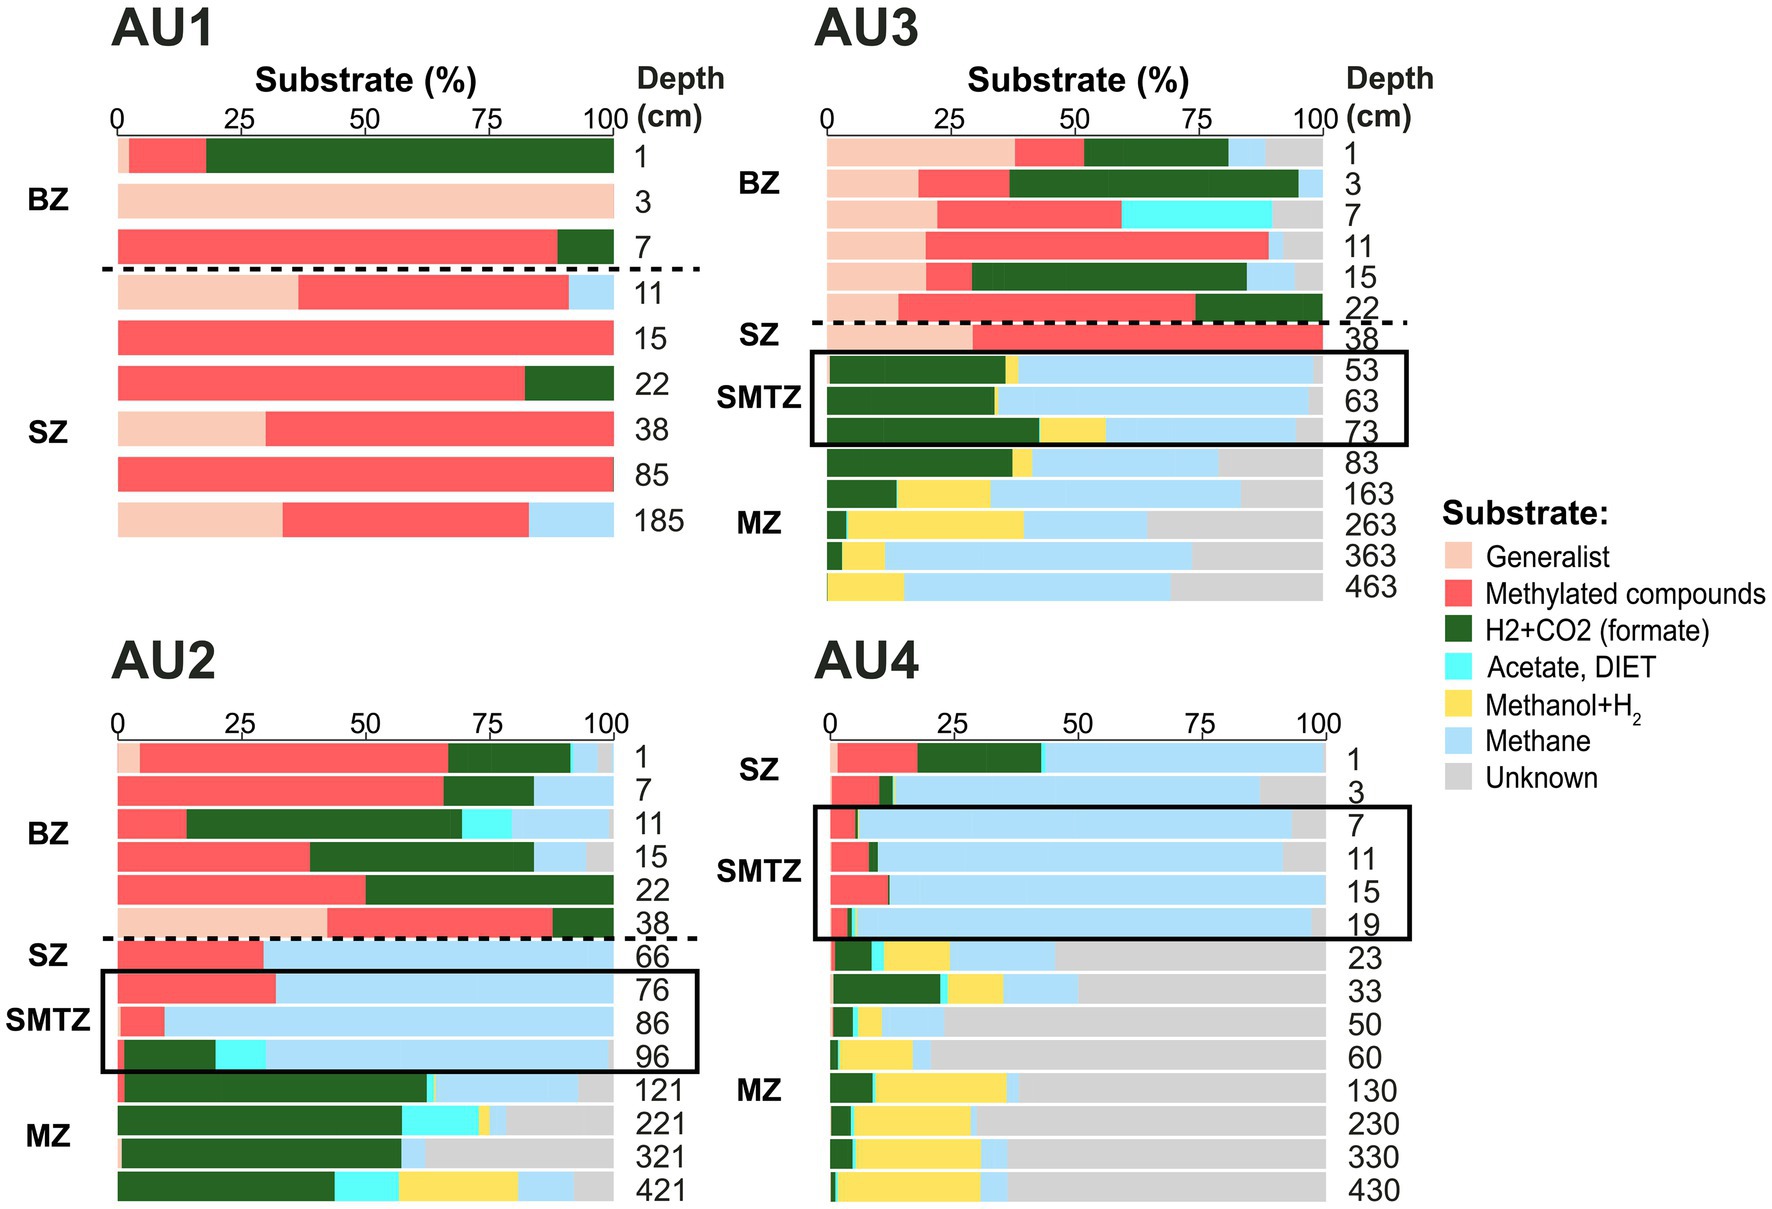
Figure 5. Depth profiles of major energy substrates at AU1-AU4, inferred from taxonomic identity, and related physiological knowledge, of major mcrA clades. In each sample, read percentages of all taxa (Figure 3) that use a specific substrate or substrate spectrum based on prior publications (Whitman et al., 2014; Lang et al., 2015; Gao and Lu, 2021; Chadwick et al., 2022, and references within) were summed into one substrate category. For instance, light blue reflects the combined read percentages of all known methanotrophs (ANME-1a-b, ANME-2a-b, ANME-2c, and ANME-3) from Figure 3. Similarly, “generalist” reflects the read percentages of Methanosarcina, the only known broad-substrate spectrum genus of methane-cycling archaea, from Figure 3. Samples above the horizontal dashed lines were located within the bioturbation zone. Black boxes indicate samples located within the sulfate–methane transition. BZ, bioturbation zone; SZ, sulfatic zone; SMTZ, sulfate–methane transition zone; MZ, methanic zone.
Zonation of mcrA community structure at the ZOTU-level
Analyses of methane-cycling archaeal distributions at the ZOTU-level show clear zonations also at the “species-level,” with sulfate concentrations as a likely key driver (NMDS1; Figure 6A). In addition, site-specific clustering can be observed (NMDS2). Community fingerprints overlap considerably between AU1, AU2, and AU3, but are more distinct in the sulfidic, more organic carbon-rich sediments of AU4. Examining ZOTU zonations in relation to biogeochemical zone (Figure 6B), communities in the BZ overlap strongly with those in the SZ but are mostly distinct from those in the MZ. By contrast, communities in the SMTZ, depending on location, variably cluster with samples from the BZ, SZ, or MZ.
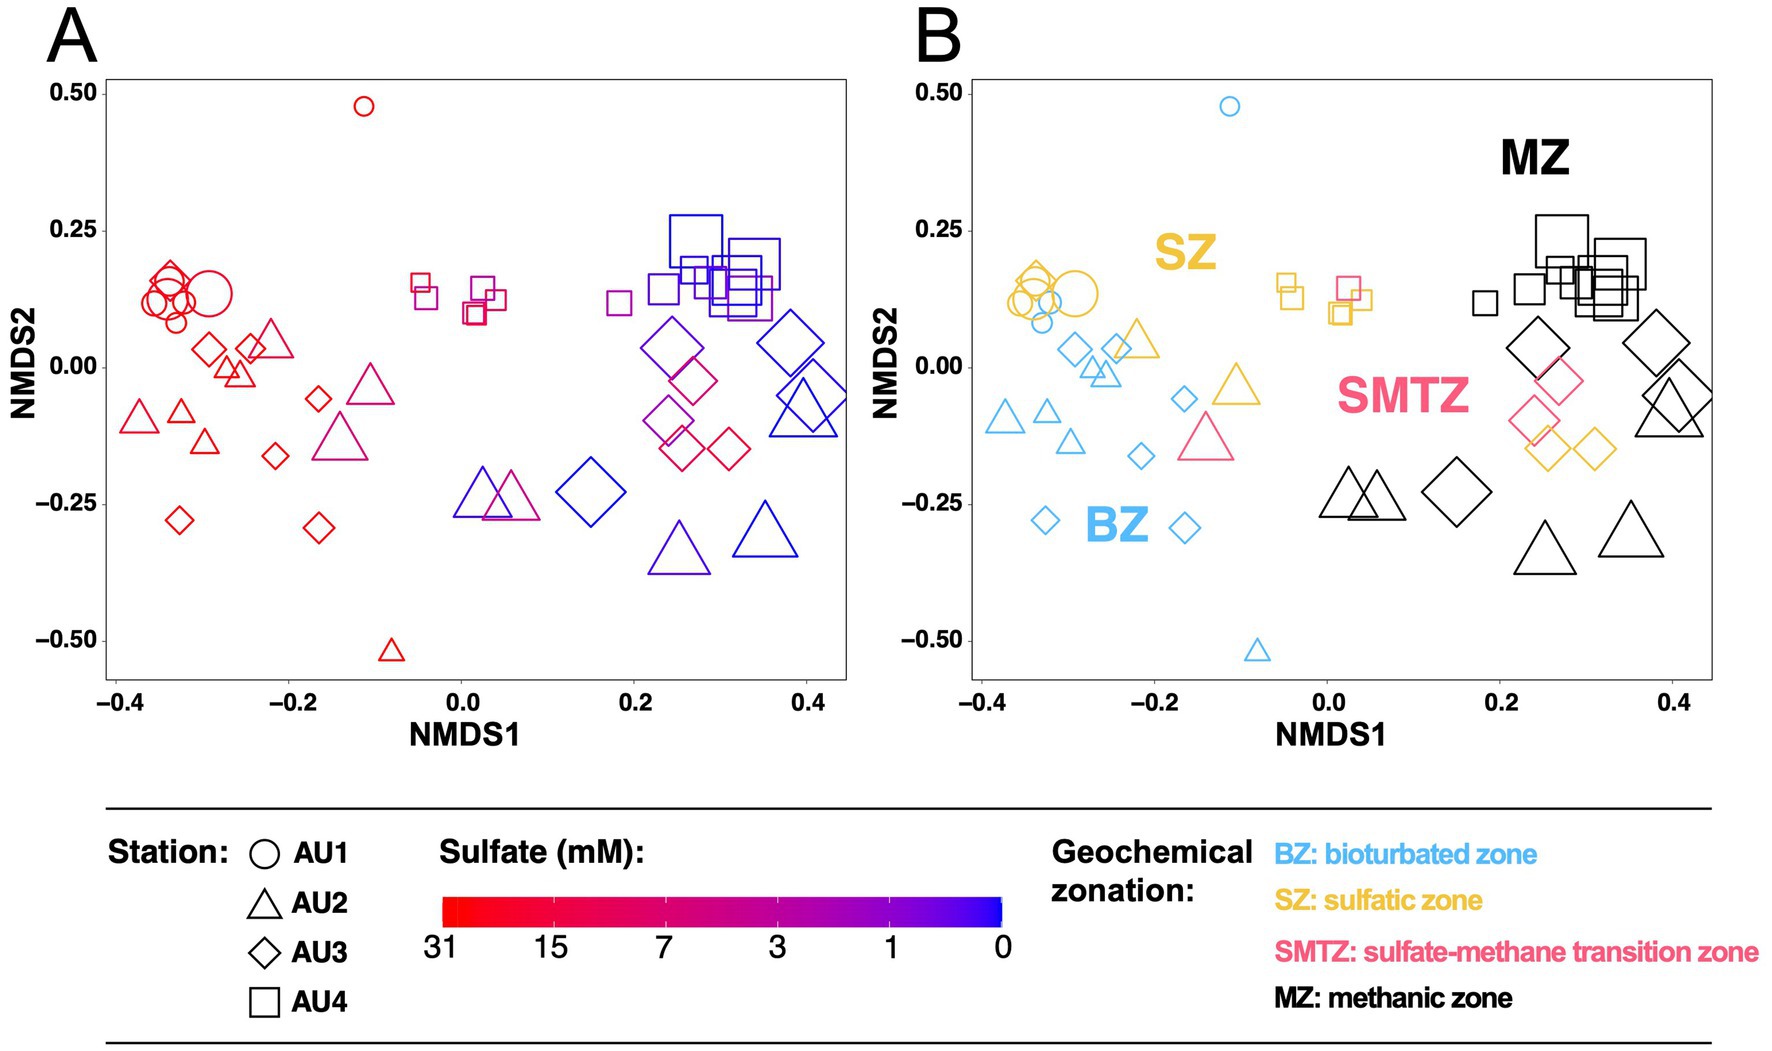
Figure 6. Non-Metric Multidimensional Scaling (NMDS) based on Bray-Curtis distances of mcrA communities at the 97% ZOTU-level in relation to (A) sulfate concentrations and (B) biogeochemical zone. Symbol sizes are proportional to sediment depth.
Discussion
By integrating geochemical, stable isotopic, and methane-cycling archaeal abundance and community data from coastal eutrophic to off-shore oligotrophic sites, we explore the drivers of methanogenesis and anaerobic oxidation of methane in continental margin sediments. Our analyses indicate that active methane-cycling is not restricted to sulfate–methane transition zones (SMTZs) and methanic zones (MZs), but also occurs in bioturbation zones (BZs) and sulfatic zones (SZs). Pervasive vertical and horizontal changes in methane-cycling communities and inferred metabolisms indicate a major role of depth- and site-specific environmental variables in driving the methane cycle in continental margin sediments.
Distribution of methanogenic and methanotrophic activity
Downcore concentration profiles of methane, with low (micromolar) concentrations throughout the BZ and SZ, and increases to millimolar concentrations where sulfate is depleted in deeper layers, are consistent with the standard biogeochemical zonation (e.g., Jørgensen and Kasten, 2006; Figure 2). Accordingly, methanogenesis is suppressed by competing microbial reactions with higher energy yields, e.g., aerobic respiration, sulfate and metal reduction, in sediments where O2, sulfate and/or metal oxides are present. The distinct increase in methane concentrations in deeper, sulfate-depleted layers suggests that methanogenesis only becomes dominant once energetically superior respiration reactions are electron acceptor-limited. The steep drop in methane in the SMTZ is, moreover, consistent with sulfate-dependent AOM consuming upward-diffusing methane from the MZ in sediment layers where this methane overlaps with sulfate diffusing downward from overlying seawater.
While the concentration profiles of sulfate and methane indicate peak methane-cycling activity in the SMTZ and MZ, isotopic data suggest that active methane cycling, with in situ oxidation and possibly production, is also present in the BZ and SZ. At AU1 and AU2, δ13C-CH4 values increase from the MZ to the overlying SZ and BZ. Gradual oxidation of methane that has escaped oxidation in the SMTZ and is diffusing up into the SZ may drive this shift to higher δ13C-CH4. Herein the amount of isotopically “light” methane that is oxidized to DIC is too small to significantly lower the δ13C-DIC, given the much larger pool size of DIC from organic matter mineralization (Figure 2). In addition, “cryptic” methanogenesis, i.e., methane production without a clear imprint on methane concentrations due to simultaneous methane consumption by AOM, may occur throughout the SZ and BZ. The nearly parallel δ13C-CH4 and δ13C-DIC profiles throughout AU1, and in certain surface sedimentary intervals of AU2 and AU3, are consistent with low rates of CO2 reduction, wherein the δ13C-CH4 follows the δ13C-DIC with a fixed offset due to a constant isotopic fractionation factor during the conversion of CO2 (DIC) to methane. Similarly, low rates of other methanogenic reactions, e.g., acetate and methyl group disproportionation, cannot be ruled out based on the C-isotopic data. Fractionations produced by these reactions could be masked by other C-isotopic fractionations related to methane cycling.
Further down in the SMTZ, the dominant methane cycling reactions become more evident. In the SMTZ of AU2 and AU3, the slight increase in δ13C-CH4 and strong decrease in δ13C-DIC to values below those of δ13C-TOC indicate oxidation of isotopically light methane as a major source of DIC. Notably, AU4 shows a different trend. Despite the strong upward decrease in methane concentrations across the SMTZ, the δ13C-CH4 and δ13C-DIC both show parallel decreases toward the seafloor. We propose that, at AU4, significant rates of methanogenic CO2 reduction co-occur with AOM within the SMTZ. Despite the clear decrease in methane concentrations from the MZ up through the SMTZ, which suggest net oxidation of methane, the stronger negative isotopic fractionation associated with methanogenic CO2 reduction appears to dominate δ13C-CH4 values over the comparatively weaker isotopic fractionations associated with AOM. This interpretation matches past studies that indicate considerably higher C fractionations associated with methanogenic CO2 reduction (α = 1.045–1.082; reviewed in Conrad, 2005) than with AOM (α = 1.004–1.021; reviewed in Alperin and Hoehler, 2009). A similar co-occurrence of methane production and AOM in the SMTZ was previously proposed for organic-rich coastal sediments based on radiotracer incubations (Beulig et al., 2018) and C-isotopic analyses of methane-cycling microbial aggregates within SMTZs (Alperin and Hoehler, 2009). In addition, given the shallow sediment depth of the SMTZ at AU4 (~10 to 20 cm), it is possible that the strong decrease in methane concentration near the sediment surface is not solely caused by AOM, but additionally by methane diffusion or even ebullition into overlying water. Similar processes were recently proposed to explain “methane leakage” in eutrophic lakes (van Grinsven et al., 2022) and in organic-rich sediments of the eastern Baltic Sea (Hermans et al., 2024; Lapham et al., 2024). In the lake study, lower energy yields of methane oxidation compared to organotrophic reactions involving oxidation of amino acids, sugars, and certain VFAs were proposed to result in methanotrophs being outcompeted by organotrophs for shared electron acceptors in surface sediments of eutrophic lakes.
Measured δ13C-CH4 and δ13C-DIC profiles in the MZs of AU2 through AU4 are nearly parallel and increase with depth, consistent with CO2 reduction as the dominant methanogenic pathway. The offset between δ13C-CH4 and δ13C-DIC is remarkably constant between sites, mostly ranging from −68.2 to −80.5 per mil, which corresponds to an isotopic fractionation factor (α) of 1.075–1.085 for methanogenic CO2 reduction. These values are among the highest reported from marine sediments (Conrad, 2005). At all three sites, the rates of methanogenic CO2 reduction are high enough to drive δ13C-DIC into the positive range, to values that are up to +40 per mil higher than the δ13C-TOC (AU4).
Net growth of methane-cycling archaea in response to vertical geochemical gradients
Copy numbers of mcrA are similar in surface sediments of all sites but are uniformly low in absolute abundances (102–104 copies g−1 sediment) and relative abundances, with mcrA:16S rRNA gene ratios of 10−5–10−4 (0.001–0.01%) (Figure 3A). Comparing deeper layers, there is, however, a clear increase in copy numbers from the oligotrophic AU1 to the eutrophic AU4. This trend matches the increase in sedimentary organic carbon content and reactivity from the deep Norway Trench site (AU1, 586 m) to the southern slope of the Norway Trench (AU2, 319 m) and shallow shelf sites, which include the sandy Kattegat site (AU3, 43 m) and muddy, sulfidic Lillebælt site (AU4, 37 m; Kristensen et al., 2018; Deng et al., 2020). Presumably, higher energy availability due to higher organic matter content and reactivity drives this increase in methane-cycling archaeal abundances in subsurface, sulfate-depleted layers from offshore to nearshore. Nevertheless, ratios of mcrA to total 16S rRNA gene copy numbers indicate that methane-cycling archaea account for only a small fraction (mostly <<1%) of the total microbial community, even in the SMTZ and MZ (Figure 3A). Thus, methane-cycling archaea appear to be part of a rare, albeit geochemically important, microbial biosphere in continental margin sediments. This observation is consistent with previously published data on these archaea from ocean drilling cores (Lever, 2013; Lever et al., 2023).
In addition to the trends in mcrA copy numbers across sites, there are clear vertical trends within sites. At AU1 through AU3, mcrA copy numbers increase at the bottom of the BZ, suggesting adverse effects of macrofaunal ventilation on methane-cycling archaeal community size. In addition, at AU2 through AU4, mcrA copy numbers increase by an order of magnitude from the lower SZ to the SMTZ and uppermost layer of the MZ. We interpret this as evidence of net population growth (i.e., cell division rates > mortality rates) in the past, when the low numbers of methane-cycling archaeal populations in SZs were buried from the SZ to the SMTZ and MZ, where geochemical regimes are more favorable due to high methane concentrations (methanotrophs) and reduced competition with sulfate reducers (methanogens) (Figure 3A). This interpretation is supported by data on methane-cycling archaea in subseafloor sediments of the Peru Trench. There, mcrA was below detection throughout the SZ, but became widely detectable in the SMTZ and MZ, suggesting net population growth of methane-cycling archaea thousands of years after sediment deposition, when geochemical conditions became more favorable (Lever et al., 2023).
Methane-cycling archaeal communities of bioturbated and sulfate-rich sediments
Phylogenetic analyses reveal diverse methane-cycling archaeal communities that vary with site location and in relation to vertical biogeochemical zones. Herein the biggest changes, both at the ZOTU-level and at higher phylogenetic levels, occur between sulfate-rich sediment (BZ + SZ), the SMTZ, and the MZ (Figures 3B,C, 6). These community changes are not only apparent at the relative abundance-level, but also when taxon-specific absolute abundances are compared across vertical biogeochemical zones (Figure 7).
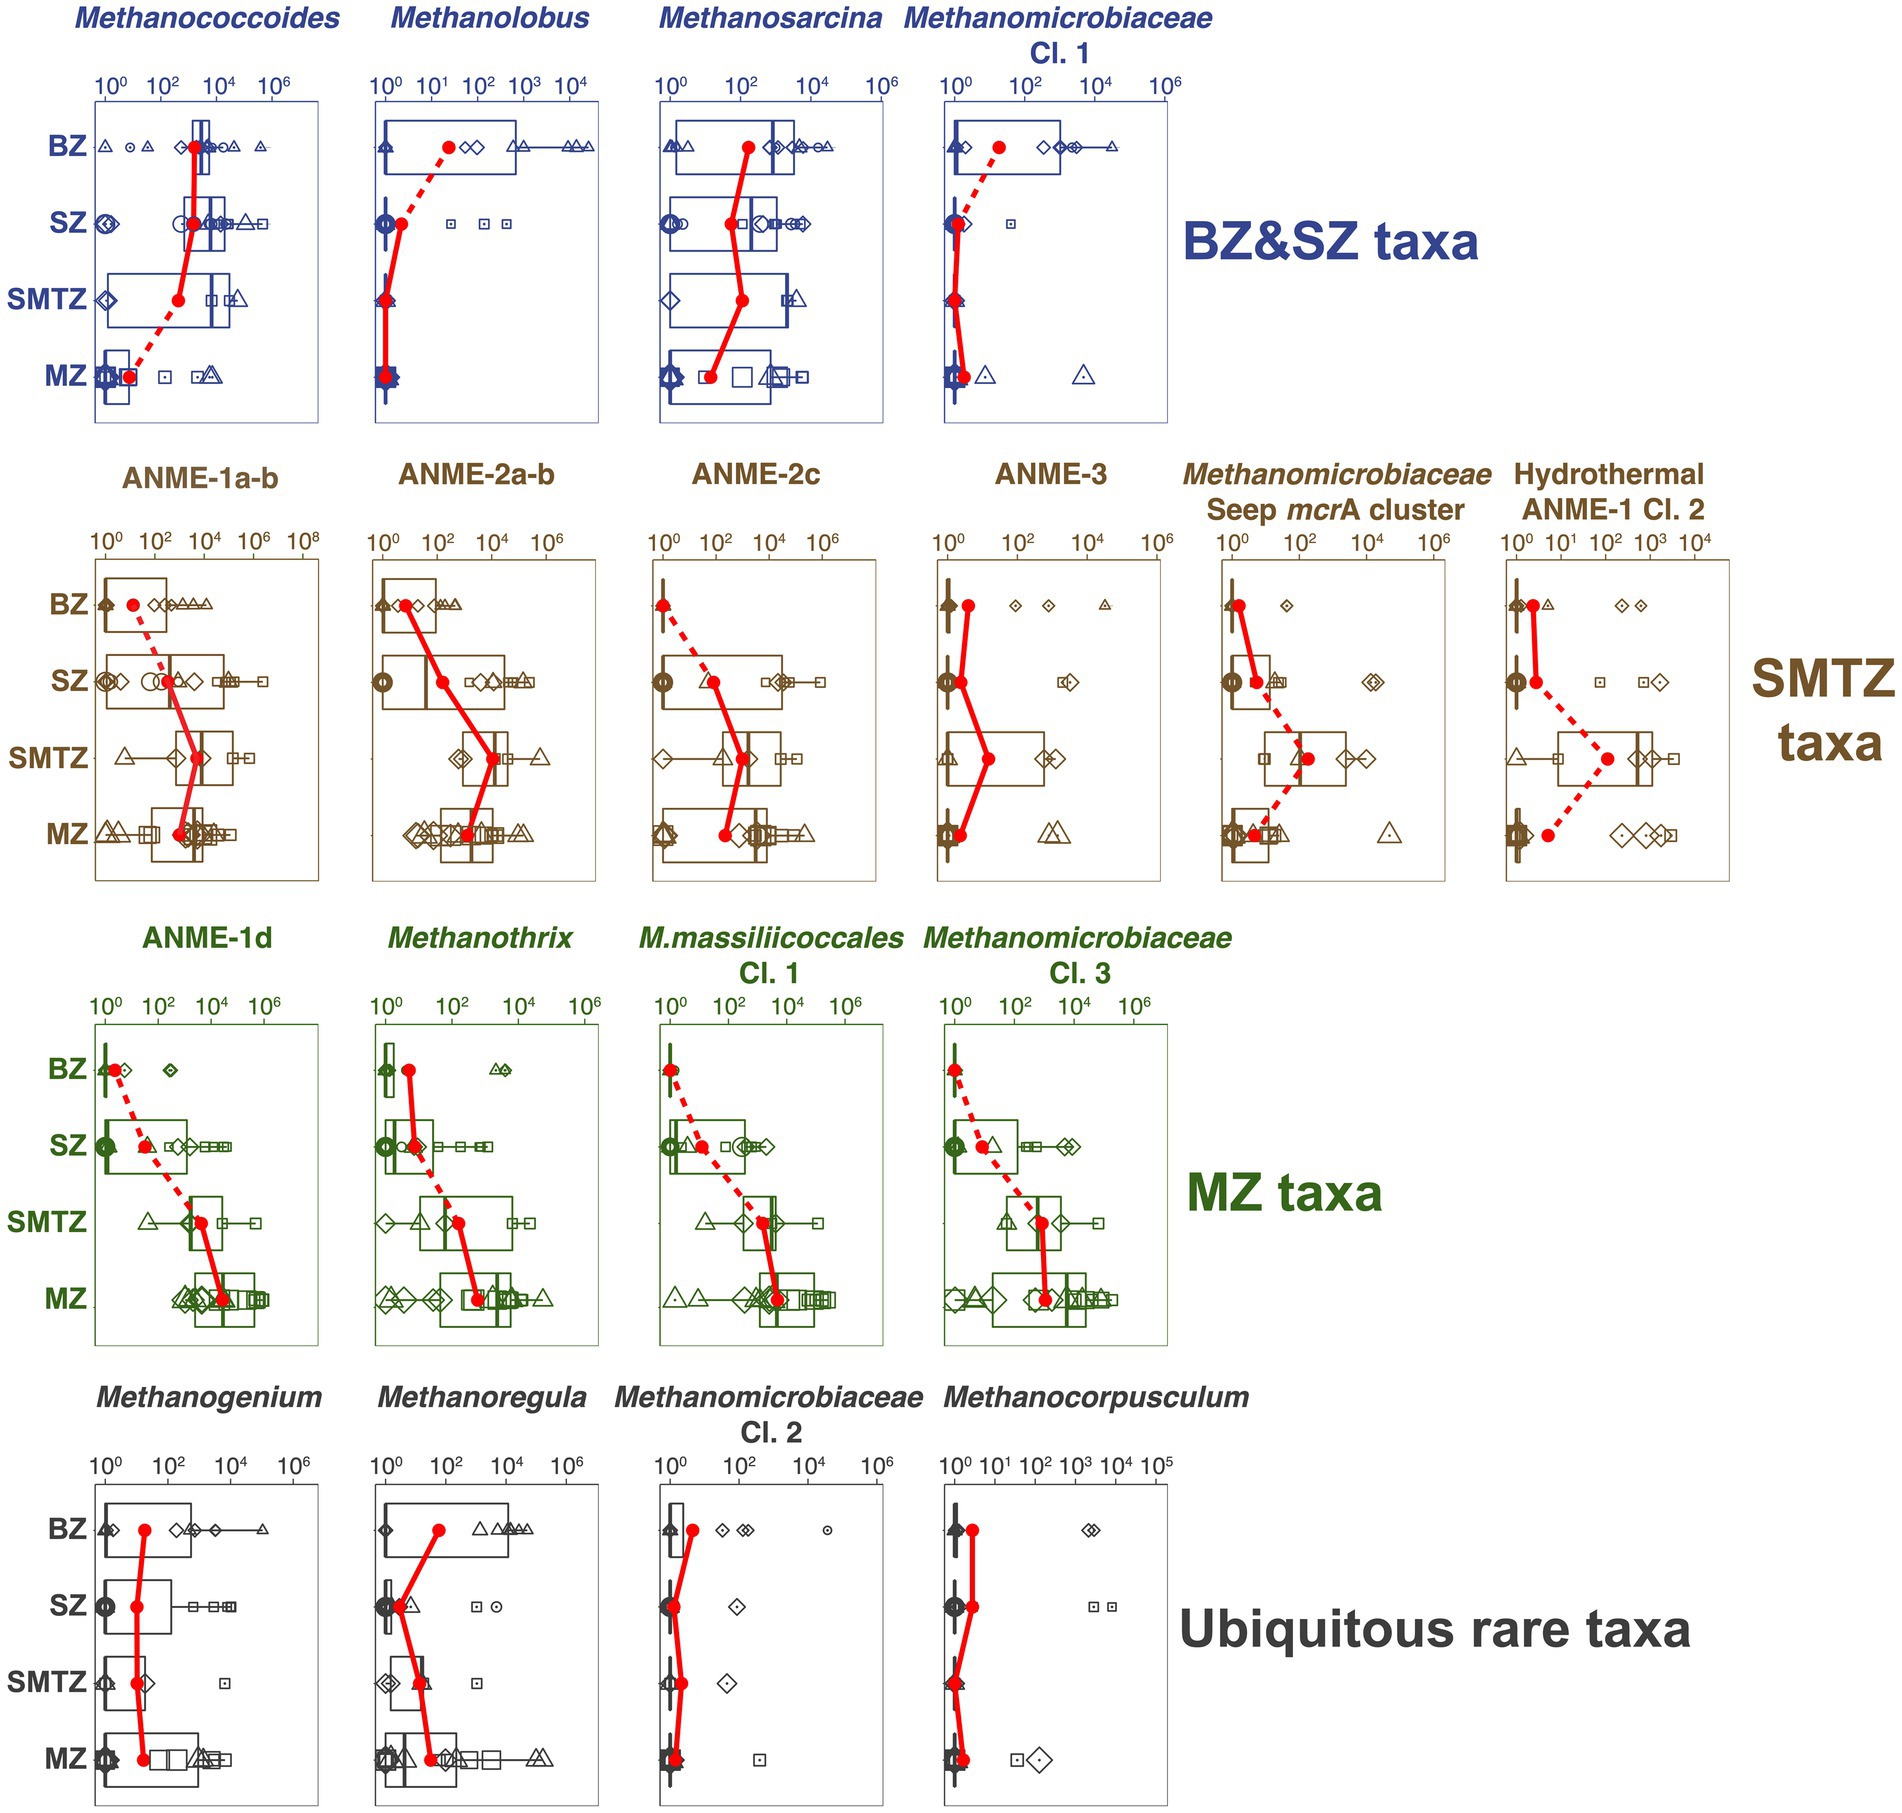
Figure 7. Vertical trends in absolute abundances of different methane-cycling archaeal groups in relation to geochemical zone. BZ, bioturbation zone; SZ, sulfatic zone; SMTZ, sulfate–methane transition zone; MZ, methanic zone. Sample-specific absolute abundances of mcrA genes (copies g−1 dry sediment) for each group were calculated by multiplying total mcrA copy numbers by the fraction of total mcrA reads contributed by that group. We observe four distinct trends: BZ&SZ taxa, SMTZ taxa, and MZ taxa refer to methane-cycling archaea with highest average abundances in the BZ and SZ, the SMTZ, and the MZ. A fourth category (ubiquitous rare taxa), with no clear depth trend and only low average abundances, is not further discussed. The average mcrA gene copy numbers within each geochemical zone are indicated by the red dots, whereas boxes indicate a 50% confidence interval. Dashed lines connecting adjacent points indicate significant differences of mean values (Wilcoxon test).
A striking phylogenetic trend across the study sites is the shift from high percentages of Methanosarcinales in BZ, SZ, and SMTZ layers to much lower contributions in MZs. This indicates that elevated sulfate concentrations lead to higher contributions of Methanosarcinales. The reasons are offered by the vertical zonation of individual Methanosarcinales taxa. Specialized, methyl-disproportionating Methanococcoides and Methanolobus and generalistic Methanosarcina dominate both the BZ and SZ and decrease in relative and absolute abundances with depth (Figures 3C, 7). The fact that these taxa, which share the metabolic potential for methyl-disproportionation, dominate methanogenic communities in sulfate-rich sediments matches the notion that methylated compounds, such as methanol, methyl sulfides, and methylamines, are not utilized by most competing respiring organisms. This enables methylotrophic methanogens to thrive in sediments where sulfate or metal reduction dominate respiration (Maltby et al., 2015; Xiao et al., 2018; Zhuang et al., 2018).
In addition to Methanosarcinales, Methanomicrobiales account for a significant, in some places dominant, fraction of the methane-cycling archaeal community in sulfate-rich layers, with the highest percentages found in the BZ (Figure 3C). All cultivated members of this order, which includes the genera Methanogenium, Methanocorpusculum, and Methanoregula at AU2 through AU4, are obligate CO2-reducing methanogens (Garcia et al., 2006). Presumably, the novel genus-level lineages Methanomicrobiaceae Clusters 1 and 2, which were mostly found from AU1 to AU3, and which had their highest absolute abundances in BZs (Figure 7), are no exception. These significant percentages of Methanomicrobiales, and of Methanosarcina which also include facultative CO2 reducers, are in line with δ13C-CH4 and δ13C-DIC trends that suggest CO2 reduction in the BZ and SZ, but go against the notion that CO2-reducing methanogens are outcompeted by sulfate and metal reducers for H2 in these sediments (Lovley and Goodwin, 1988; Hoehler et al., 1998). We propose redox oscillations due to macrofaunal ventilation and episodic import of labile organic matter by macrofaunal reworking as potential reasons for the presence of CO2-reducing methanogens in BZs. The resulting fluctuations in redox conditions and electron donor supplies may prevent sulfate and metal reducers from drawing H2 concentrations down to steady-state levels that are too low to energetically support methanogenic CO2 reduction. Alternatively, CO2 reducers may not rely on H2, but instead use electrons from DIET, supplied by syntrophic partner organisms, to reduce CO2. CO2 reduction via DIET has been shown in laboratory studies with Methanosarcina (Holmes et al., 2018) and was recently proposed to dominate CO2 reduction by Methanomicrobiales in lakes (Meier et al., 2024).
Despite the upward decrease in methane concentrations from the SMTZ to the seafloor (Figure 2) and isotopic and genetic evidence for an active methane cycle in the BZ and/or SZ, only small subpopulations of putatively methanotrophic archaea were detected (0 to 20% of mcrA reads) at AU1-AU3 (mainly ANME-1a-b; Figure 3C). Potential reasons include the low net energy gains from sulfate-dependent AOM, which in many cases involves energy partitioning between methanotrophic archaea and sulfate-reducing partner organisms and may only support very small populations of methanotrophs. In addition, it is possible that in the BZs of AU1 through AU3, which receive episodic input of O2 and nitrate due to macrofaunal ventilation (Deng et al., 2020), physiologically more resilient methane-oxidizing bacteria (MOB) outcompete ANMEs for methane. This possibility, which has also been proposed for lake sediments (van Grinsven et al., 2022), is underscored by clear outnumbering of ANMEs by MOBs based on functional gene copy numbers. Copy numbers of the alpha subunit of partial methane monooxygenase (pmoA), a key gene of aerobic methane oxidation, are in the range of 105 to 107 copies g−1 sediment in the BZs (Supplementary Data File 1), and thus orders of magnitude higher than mcrA copy numbers (Figure 7). An exception is the non-bioturbated, mostly sulfidic surface sediment of AU4. Here ANME-1a-b and ANME-2 collectively account for >50% of mcrA reads in the SZ. We propose that due to the high methane flux and shallow depth of the SMTZ (5–20 cm) at AU4, significant amounts of methane escape oxidation in the SMTZ and are (partially), consumed by ANMEs in the overlying, only 5 cm thick SZ.
Methane-cycling archaeal communities of sulfate–methane transition zones
We detect all known ANMEs, except Methanoperedenaceae, in the sediments studied. While there are taxonomic overlaps, each of the three SMTZs is dominated by a different ANME group. AU2 is dominated by ANME-2a-b (Candidatus Methanocomedenaceae), AU3 by ANME-2c (Candidatus Methanogasteraceae; both Methanosarcinales), and AU4 by the ANME-1a-b family (Candidatus Methanophagaceae, Candidatus Methanophagales). Moreover, while ≥80% of mcrA read percentages at AU2 and AU4 belong to ANMEs, only about half of the reads in the SMTZ of AU3 belong to ANMEs. The other half consist largely of uncultured Methanomicrobiales (seep mcrA cluster, Methanomicrobiaceae Cl. 3).
The dominance of anaerobic methanotrophs in SMTZs is expected, and the preference of these groups for SMTZs is supported by the fact that absolute abundances of all ANME groups except ANME-1d (discussed in next section) were highest in SMTZ (Figure 7). Yet, the reasons for the differences in dominant groups between locations are unclear. The fact that ANME-2a-b, ANME-2c, and ANME-1a-b co-occur in significant percentages in each location (Figure 3C) argues against dispersal limitation or competitive exclusion over a limiting resource. Instead, niche differences that reflect location-specific environmental variables may result in the dominance of different groups. While previous studies have suggested that ANME-2 thrive at higher sulfate concentrations than ANME-1 (Knittel and Boetius, 2009; Yanagawa et al., 2011), we observe significant contributions of ANME-1a-b at high sulfate concentrations in the SZ of AU4 and BZ of AU2 (Figure 2). Given that iron and manganese reduction are dominant respiratory reactions at AU2 and AU3 (Kristensen et al., 2018), AOM coupled to metal reduction may also take place and locally select for ANME-2a-b and ANME-2c taxa. This would be consistent with past research suggesting at least the involvement of ANME-2a in iron-dependent AOM (Aromokeye et al., 2020; Slobodkin et al., 2023). While ANME-1 and ANME-2 strongly overlap in distributions within SMTZs, and even in SZs, only ANME-1a-b and its sister clades ANME-1d and Hydrothermal ANME-1 Cluster 2 were detected at high abundances in sulfate-depleted MZs (AU3 and AU4). This matches the notions that ANME-1 are less dependent than ANME-2 on sulfate as an electron acceptor (Yanagawa et al., 2011) and include facultative methanogens (Lloyd et al., 2010; Beulig et al., 2018; Lever et al., 2023).
Even though the sulfate–methane concentration gradients indicate that almost all (AU2 and AU3) or at least a significant portion (AU4) of the methane that is produced in the MZs is consumed in the overlying SMTZs, there are several inconsistencies between our isotopic and genetic data. For instance, while AU3 has C isotopic profiles in the SMTZ that indicate AOM as by far the dominant methane-cycling process, we also detect high abundances of putatively CO2-reducing Methanomicrobiales. One possible explanation is that cell-specific activities of ANMEs are far higher than those of CO2-reducing Methanomicrobiales, but that only small populations of ANMEs are supported due to the low energy yields of AOM. Alternatively, Seep mcrA cluster, which is often detected in hydrocarbon and methane seeps with AOM (Joye et al., 2010; Lazar et al., 2012; Lever and Teske, 2015), could engage in AOM. Lastly, Methanomicrobiales within the SMTZ might be dormant. While the first explanation is plausible, and the second difficult to rule out but at odds with known physiologies of Methanomicrobiales, the notion of dormancy contradicts the average absolute abundance of Seep mcrA cluster, which is highest within SMTZs, suggesting growth stimulation within sulfate–methane transitions (Figure 7).
Remarkably, the isotopic data at AU4, with parallel gradients in δ13C-CH4 and δ13C-DIC across the SMTZ, indicate that CO2 reduction occurs at significant rates in parallel to AOM at this site, even overriding the isotopic imprint of AOM. This CO2 reduction could be performed, at least in part, by ANME-1a-b, consistent with previous radiotracer-based evidence for CO2 reduction by this group in SMTZs (Beulig et al., 2019). In addition, or alternatively, the less studied ANME-1d group (also known as ANME-1-related group; Lever and Teske, 2015), which is also abundant in the SMTZ of AU4, could be involved in CO2 reduction. This would match the generally deeper distribution of this group compared to ANME-1a-b (Figure 3C), and the fact that ANME-1d dominate methanogenic subsurface sediments in other locations (Aromokeye et al., 2020; Lever et al., 2023).
Methane-cycling archaeal communities of methanic zones
While δ13C-CH4 and δ13C-DIC profiles suggest CO2 reduction as the dominant methanogenic pathway in the MZs of AU2 through AU4, taxonomic compositions paint a confusing picture (Figure 3C). Known CO2-reducing methanogens (Methanoregula) dominate in only a single sample from AU2, while all other samples are dominated by uncultured Methanomicrobiales, putative methane oxidizers of the ANME-1 group (ANME-1a-b, ANME-1d, Hydrothermal ANME-1 Cl. 2) and a new family-level Methanomassiliicoccales cluster. When absolute abundances are considered, then at least ANME-1d, Methanomassiliicoccales, Methanomicrobiaceae Cl. 3, and the less abundant aceticlastic genus Methanothrix are likely methane producers (Figure 7). mcrA copy numbers of these groups increase ~100 to 10,000-fold from the BZ and SZ to more methane-rich layers of the SMTZ and MZ and are highly correlated with methane concentrations (Supplementary Figure S1; all with Spearman’s Rho>0.6, p < 0.001).
The fact that MZs are dominated by uncultured taxa highlights the need for more cultivation research on marine methanogens. Even within the Methanomicrobiales, which include 24 published isolated species, only 5 isolates (Methanogenium cariaci, Methanogenium marisnigri, Methanogenium organophilum, Methanolacinia paynteri, Methanoculleus thermophilicum) are from marine environments – with all being CO2 reducers of the family Methanomicrobiaceae (Garcia et al., 2006). Nevertheless, given that the dominant Methanomicrobiales taxon in the MZ, Methanomicrobiaceae Cl. 3, also falls within the Methanomicrobiaceae, a CO2 reducing methanogenic metabolism seems likely.
The uncertainty increases when the dominant groups of ANME-1 are examined. While, for ANME-1a-b, the mcrA copy number peak in the SMTZ is consistent with methanotrophy (Figure 7), the high copy numbers and read contributions of this group in the MZ support the notion that this group includes facultative CO2-reducing methanogens (Beulig et al., 2019; Lever et al., 2023). A similar case could be made for the Hydrothermal ANME-1 Cl. 2. This group, which was first classified in hydrothermal sediment of Guaymas Basin (Lever and Teske, 2015), despite also having an mcrA copy number peak in the SMTZ, shows an increase in read contributions from the SMTZ to the MZ of AU3. The conditions under which either group might switch to a methanogenic lifestyle are unclear and may not always be strictly controlled by biogeochemical zone, e.g., radiotracer experiments have indicated ‘cryptic’ methanogenesis by CO2 reduction by ANME-1a-b in an SMTZ with net methane oxidation (Beulig et al., 2019).
While the distributions of ANME-1a-b and Hydrothermal ANME-1 Cl. 2 support the idea of these groups being facultative methanogens, the ANME-1d group shows distributions that indicate a primarily, if not solely, methanogenic lifestyle. This group not only increases in read percentages within the MZs of AU2-AU4 and dominates mcrA reads in the MZ of AU4 (Figure 3C). Its mcrA copy numbers furthermore increase 103-fold from the BZ to the SMTZ and by an additional factor of ~10 in the MZ (Figure 7). While any inferences regarding methanogenic pathway deserve caution in the absence of cultivation or genomic data, C isotopic signatures indicative of CO2 reduction as the dominant methanogenic pathway at AU4, where ANME-1d account for 60% of mcrA reads, are in line with this group being a methanogenic CO2 reducer at the sites studied. Our interpretation matches results from deep subseafloor sediments in which ANME-1d dominated methane-cycling archaeal communities in layers that were > 100 m below the SMTZ and had been buried below the depth of sulfate-depletion for at least 400,000 years (Lever and Teske, 2015). Notably, CO2 reduction was inferred to also be the dominant methanogenic pathway in these deep subseafloor sediments
Another striking observation is the strong mcrA copy number increase of an unclassified Methanomassiliicoccales cluster in MZs. This group was below detection in the majority of BZ samples, increased ~1,000-fold from the SZ to the SMTZ, and again 10-fold from the SMTZ to the MZ from the SMTZ into the MZ (Figure 7). While this novel group remains physiologically uncharacterized, phylogenetic clustering within the Methanomassiliicoccales suggests methanogenic methyl group reduction with H2 as a likely metabolism (Lang et al., 2015; Kröninger et al., 2017). Remarkably, the increase in absolute abundances correlates negatively with that of methyl-disproportionating taxa (Methanococcoides, Methanolobus, Methanosarcina; all p < 0.05). This suggests a switch from methyl disproportionation as the prime methylotrophic methanogenic pathway in sulfate-rich surface sediments to methyl-reduction in deeper, sulfate-depleted layers (also see next section). With mcrA copy numbers in the MZ that are only second to ANME-1d, and with mcrA read percentages exceeding 20% in many of the deeper methanogenic layers, we propose that methyl group reduction is an important, widely overlooked methanogenic pathway in deep methanogenic marine sediments.
While the overall dominance of CO2 reduction over other methanogenic reactions is in line with isotopic data from a wide range of marine sediments (Whiticar et al., 1986; Whiticar, 1999), the generally low contribution of aceticlastic methanogens of the family Methanotrichaceae (Methanosaetaceae) is surprising given that acetate can be expected to be a major end product of microbial fermentation also in methanogenic sediments (Conrad, 1999, 2020). However, low contributions of acetate to methane production were previously reported for other marine MZs (Heuer et al., 2009). Moreover, past research has revealed that even in methanogenic marine sediments with high rates of acetate production, methanogens are not the dominant acetate-utilizing microorganisms. Instead, syntrophic acetate-oxidizing microorganisms convert acetate to an end product (e.g., H2) that is then used by CO2-reducing methanogens (Beulig et al., 2018). Notably, we observe highly significant absolute and relative abundance correlations between ANME-1d, Methanomassiliicoccales, and Methanomicrobiaceae Cl. 3 with Atribacteria (Atribacterota; Supplementary Figure S2, in all cases, Rho >0.6, p < 0.001). Members of this bacterial phylum, which dominates MZs of AU3 and AU4 and was also detected in significant percentages (to 10%) in the MZ of AU2 (Deng et al., 2020), have been linked to syntrophic acetate oxidation with H2 and CO2 as end products (Webster et al., 2011; Gies et al., 2014; Jiao et al., 2024). It is thus possible that syntrophic associations between acetate-oxidizing Atribacteria and CO2-reducing (e.g., ANME-1d, Methanomicrobiaceae Cl. 3) and methanol-reducing methanogens (Methanomassiliicoccales) play a key role in driving methane production in MZs of the Skagerrak-Kattegat region, and perhaps elsewhere.
Drivers of methanogenic pathway distributions
The observed taxa distributions suggest environmental variations in the distributions of methanogenesis and anaerobic oxidation of methane (Figures 3, 4) that are not always visible within measured chemical concentration profiles and isotopic compositions (Figure 2). To explore potential drivers behind this cryptic cycling of methane, we next take a thermodynamic approach with a focus on in situ energy yields of various reactions.
Given that H2 concentrations were not determined as part of this project, we test two H2 concentration scenarios. These H2 concentrations are in the range of the lowest ones found in anoxic sediments (0.1 nM) and in the typical range of methanogenic sediment (10 nM) (Lovley and Goodwin, 1988; Hoehler et al., 1998). We calculate that CO2 reduction is never exergonic at H2 concentrations of 0.1 nM, but always exergonic at concentrations of 10 nM, with Gibbs energies in the range of −40 to −12 kJ mol−1 (Figure 8A). Herein the most negative (exergonic) values were calculated for BZs and SZ, while the least negative (lowest energy yielding) values (−20 to −12 kJ mol−1 reaction) were calculated for MZs. These Gibbs energy values are close to the minimum biological energy quantum (BEQ) (−10 kJ mol−1; Hoehler et al., 2001) in a range previously determined for methanogens in methanogenic samples (Hoehler, 2004). The scenario is different in sulfate-rich sediments where, due to much lower concentrations of the end product methane, Gibbs energies are more negative. We estimate that H2 concentrations around 1 nM, i.e., halfway between Gibbs energies for [H2] = 0.1 nM and [H2] = 10 nM in Figure 8A, would be required to support methanogenic CO2 reduction via H2 in these sediments. Notably also, the Gibbs energies of CO2 reduction are in the same range in SMTZs as in MZs, suggesting that at 10 nM H2 methanogenic CO2 reduction is thermodynamically favorable in SMTZs. This could explain the isotopic evidence for CO2 reduction in the SMTZ of AU4 (Figure 2) and suggests that CO2 reduction by ANME-1a-b in SMTZs deserves consideration within the SMTZs of AU2 and AU3, despite sulfate-dependent AOM also being exergonic in these layers (Figure 8B). If CO2 reduction with H2 is indeed taking place in the SMTZs of these sites, then this makes the reversal of this reaction during AOM unlikely, and the H2-independent oxidation of methane via DIET a more likely scenario for AOM. The latter scenario is supported by genomic analyses of all three ANME groups, which lack genes for hydrogenases that would expectedly be needed for H2 production, but instead have the genomic potential for DIET (Chadwick et al., 2022).
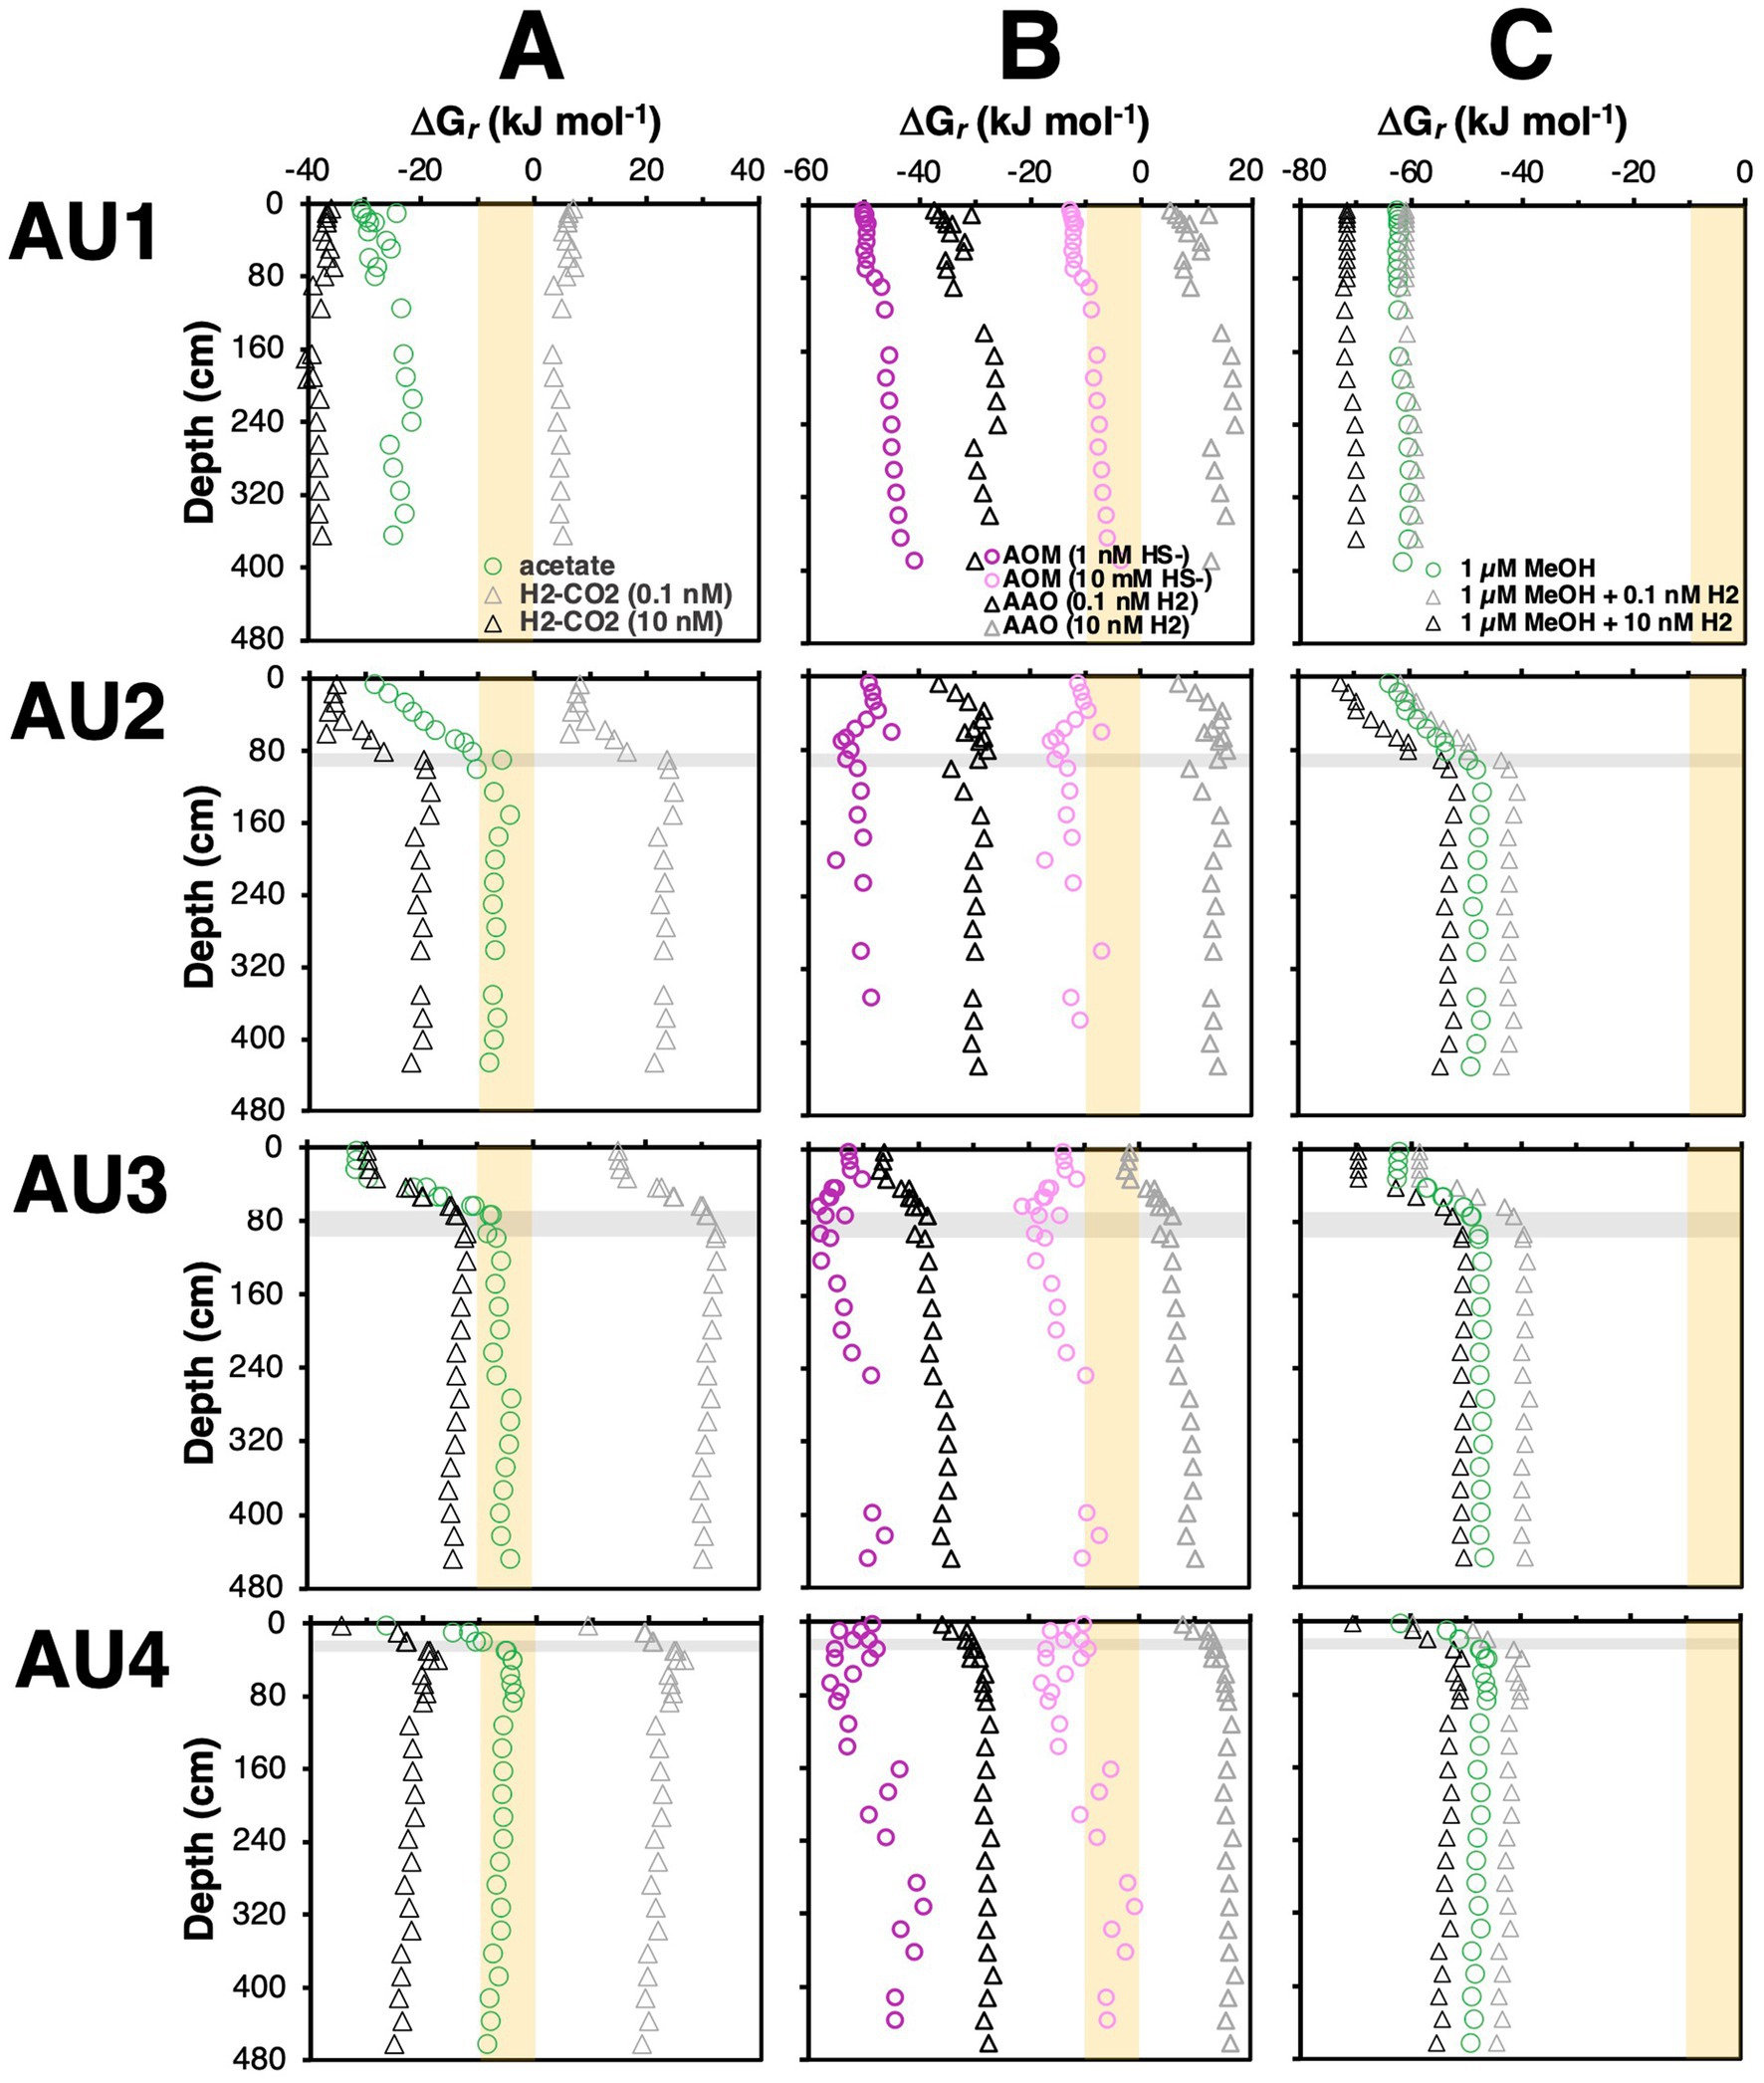
Figure 8. Calculated in situ Gibbs energies of (A) methanogenesis reactions involving hydrogenotrophic CO2 reduction (4 H2 + HCO3− + H+ ➔ CH4 + 3 H2O) and aceticlastic methanogenesis (CH3COO− + H2O ➔ CH4 + HCO3−), (B) sulfate-dependent AOM (AOM) (CH4 + SO42− ➔ HCO3- + HS− + H2O) and anaerobic acetate oxidation (AAO) (CH3COO− + 4 H2O ➔ 4 H2 + 2 HCO3− + H+), and (C) methylotrophic methanogenesis via methanol disproportionation (4 CH3OH ➔ 3 CH4 + HCO3− + H2O + H+) and methanol reduction (CH3OH + H2 ➔ CH4 + H2O). For reactions involving H2, we tested two scenarios ([H2] = 0.1 nM; [H2] = 10 nM). Gibbs energies for reactions involving methanol are per mol of methanol. Shaded beige areas indicate Gibbs energies that are exergonic but more positive (less energy-yielding) than the assumed biological energy quantum (ΔGr = −10 kJ mol−1 of reaction).
We observe similar overall trends, i.e., higher free energy yields in BZs and SZs, and lower free energy yields in SMTZs and MZs, for aceticlastic methanogenesis. Acetate is often considered the most important energy substrate of sulfate-reducing bacteria in marine sediments (e.g., Parkes et al., 1989), and it is generally believed that sulfate reducers outcompete methanogens for acetate in the presence of high sulfate concentrations (King, 1984; Shaw et al., 1984; though also see Sela-Adler et al., 2017). Yet, calculated Gibbs energies of −30 to −10 kJ mol−1 reaction in SZs suggest that even in sulfate-rich sediments, aceticlastic methanogenesis is energetically feasible, with – perhaps surprisingly – higher free energy gains than in underlying MZs (Figures 8A, 9A), where buildup of methane results in less negative Gibbs energy values (Figure 9B). While the measured, micromolar acetate concentrations are too low for Methanosarcina based on previous physiological studies, due to the low-affinity acetate uptake system of the latter (Jetten et al., 1991; Berger et al., 2012), Methanothrix, which are known to thrive at acetate concentrations in the low micromolar range, occurred mainly in the SMTZs and MZs (Figure 7).
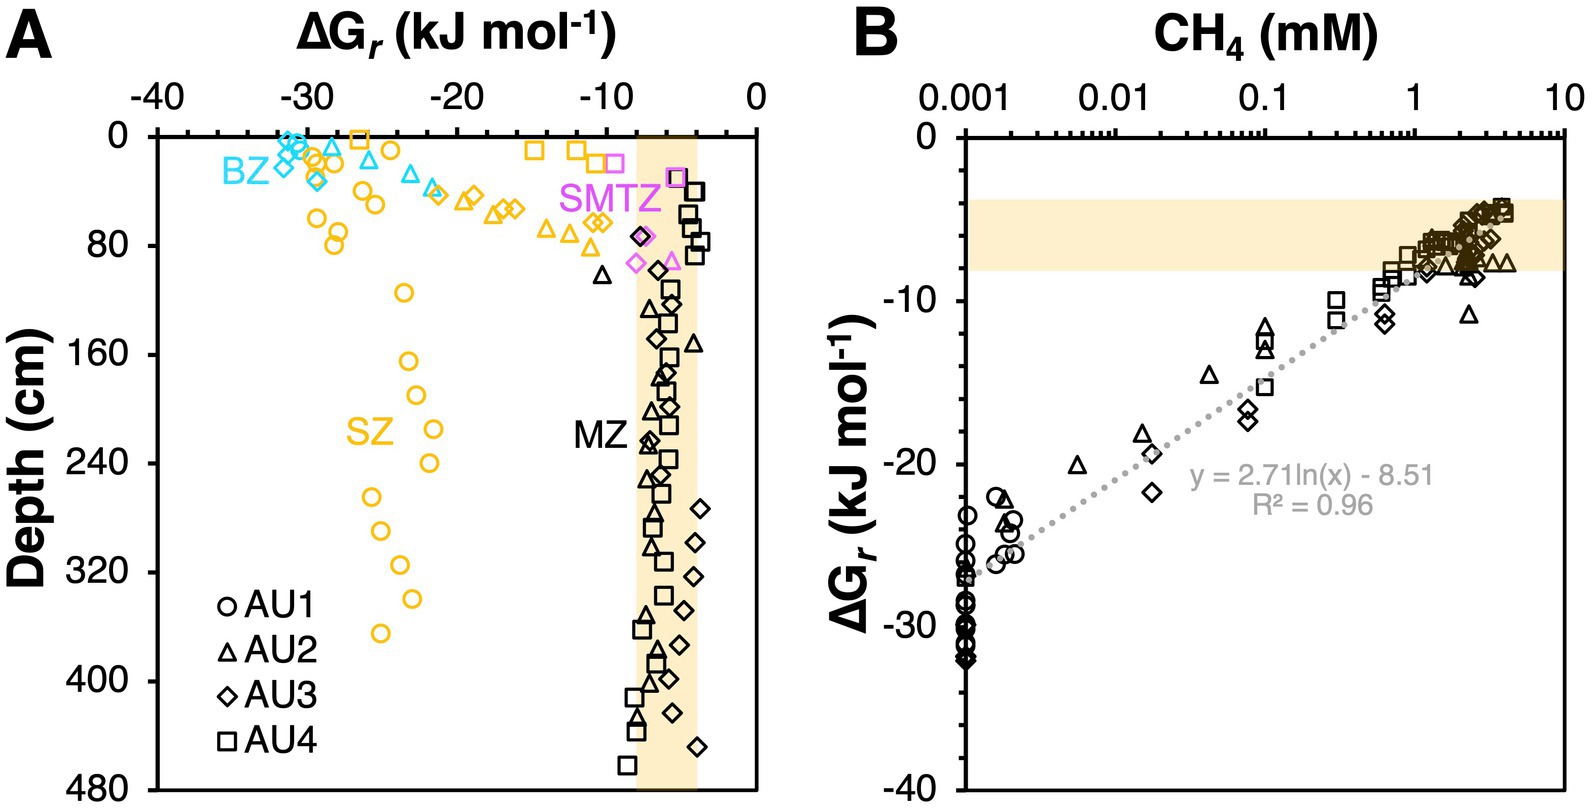
Figure 9. Observed relationship between Gibbs energies of aceticlastic methanogenesis versus (A) biogeochemical zone, and (B) measured methane concentrations. In (A) the color code is cyan for bioturbation zone (BZ), orange for sulfatic zone (SZ), magenta for sulfate–methane transition zone (SMTZ), and black for methanic zone (MZ). Note: measured methane concentrations in the MZ are likely to be underestimates due to supersaturation and resulting outgassing of methane during sampling at atmospheric pressure. Thus, actual Gibbs energies of aceticlastic methanogenesis in the MZ are likely to be less negative (less exergonic). Shaded beige areas indicate Gibbs energies in the range of −8 to −4 kJ mol−1, which included the vast majority of values.
So why is aceticlastic methanogenesis not more strongly represented in the BZs and SZs given that this reaction is thermodynamically favorable? A potential explanation is the even higher energy yield (more negative Gibbs energy) associated with acetate oxidation coupled to sulfate reduction. The resultingly higher thermodynamic drive may benefit sulfate reducers via faster reaction rates. This, however, does not explain why acetate concentrations are not drawn down to lower concentrations, where Gibbs energies are closer to BEQ values of sulfate reduction or methanogenesis. Other factors, such as the energetic cost of acetate uptake could play a role. Unlike gases or its conjugate acid (acetic acid) – acetate anions cannot freely diffuse across the microbial cell membrane but require energetically costly active transport inside the cell (Casal et al., 2008). To be a viable energy source to sulfate reducers or methanogens, acetate catabolic reactions would need to provide sufficient energy not only to cover energetic costs, but also to produce a net energy gain. Expressed in protons (H+), average Gibbs energies may need to be sufficiently high to translocate two H+ per acetate anion, one for acetate uptake and another to contribute to ATP synthesis. The same reasoning could apply to sodium cations (Na+), assuming the use of a sodium motive force to conserve energy.
Things change in the underlying MZ, where aceticlastic methanogens (Methanotrichaceae) increase in numbers (Figure 7) despite Gibbs energies of aceticlastic methanogenesis that are barely exergonic (mostly −8 to −4 kJ mol−1) – even with measured methane concentrations that are underestimates due to outgassing during sampling (Figures 8A, 9A). These values suggest that aceticlastic methanogens are operating close to thermodynamic equilibrium at free energy yields lower than the BEQ (i.e., > −10 kJ mol−1). Alternatively, Methanotrichacea may not perform aceticlastic methanogenesis, but instead engage in CO2 reduction via DIET, as recently shown for Methanothrix harundinacea (Gao and Lu, 2021), a close relative of the Methanotrichaceae detected in our study (Figure 4). In the latter case, anaerobic acetate oxidation (reverse homoacetogenesis), which frequently occurs in methanogenic environments (Hattori, 2008; Dyksma et al., 2020), and was proposed to control acetate turnover in MZs further east in the Baltic Sea (Beulig et al., 2018), could also control acetate concentrations. Notably, our thermodynamic calculations suggest that at H2 concentrations of 10 nM, which may be required for methanogenic CO2 reduction with H2 to provide sufficient free energy for energy conservation (H+ translocation), anaerobic acetate oxidation is endergonic (Figure 8B). For syntrophic reactions involving anaerobic acetate oxidation to CO2 + H2 followed by CO2 reduction with H2 to both be exergonic and have similar Gibbs energies, a narrow window of H2 concentrations is necessary (AU2 and AU4: 1–2 nM; AU3: 1–4 nM; Figure 10). Within this window, Gibbs energies of both reactions provide free energy yields below BEQ values. Given that both pathways of acetate conversion to methane appear to only be minimally exergonic, our calculations cannot address which is more likely to be important in the MZs studied.
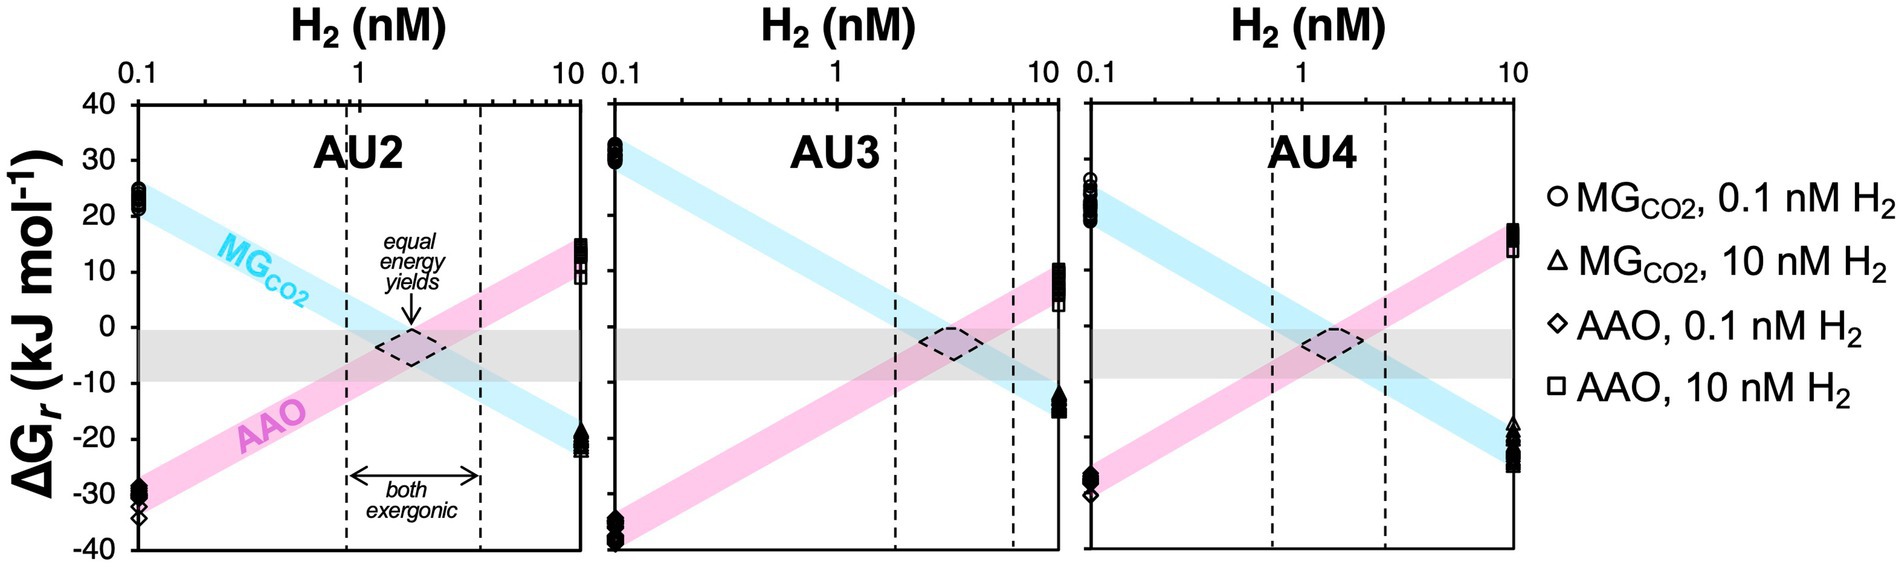
Figure 10. Calculated Gibbs energies of methanogenic CO2 reduction with H2 (MGCO2; 4 H2 + HCO3− + H+ ➔ CH4 + 3 H2O) and anaerobic acetate oxidation (AAO; CH3COO− + 4 H2O ➔ 4 H2 + 2 HCO3− + H+) in relation to H2 concentrations for samples from the methanic zones from AU2 to AU4. Gray horizontal bars indicate reaction Gibbs energies (Gr) that are minimally exergonic, in a range between thermodynamic equilibrium (Gr = 0 kJ mol−1 of reaction) and the proposed BEQ value (Gr = −10 kJ mol−1 of reaction). H2 concentrations in which both reactions are exergonic are indicated by the areas between the dashed black lines. H2 concentrations with similar energy yields for both reactions, as would be expected under equal energies of both reactions, are indicated by the areas enclosed by dashed lines. Data points shown are the values for both reactions in Figure 8.
With respect to the observed shift from methyl disproportionation to methyl reduction as the dominant methylotrophic reaction from sulfate-rich to sulfate-depleted sediments, we explore the potential for in situ H2 concentrations to be the underlying driver (Figure 8C). This is, again, based on previous observations that H2 concentrations increase from metal and sulfate reduction-dominated sediments to methanic sediments (Lovley and Goodwin, 1988; Hoehler et al., 1998). Assuming that methanol is the substrate and present at 1 μM concentrations, both reactions are always highly exergonic in the sediments studied (−73 to −40 kJ mol−1 methanol). Yet, which reaction has higher free energy yields depends on H2 concentrations. Under “methanogenic H2 concentrations” (10 nM), methyl reduction always has higher free energy yields (more negative Gibbs energies) than methyl disproportionation. The opposite is the case at low H2 concentrations (0.1 nM), which are closer to values expected for sulfate and metal oxide reducing sediments. Even if H2 concentrations are at 1 nM, where Gibbs energy values are halfway between those for 10 nM and 0.1 nM on the x-axis of Figure 8C, methyl disproportionation yields higher free energy gains than methyl reduction. Our thermodynamic calculations thus offer an energetic explanation for the widely observed dominance of methyl disproportionating methanogens as the main methylotrophic methanogens in sulfate-rich surface sediments. By the same token, shifts to methyl reduction as the dominant methylotrophic pathway in deeper layers, which to our knowledge have never been documented, are potentially driven by higher H2 concentrations in deeper layers (for a conceptual diagram, see Figure 11).
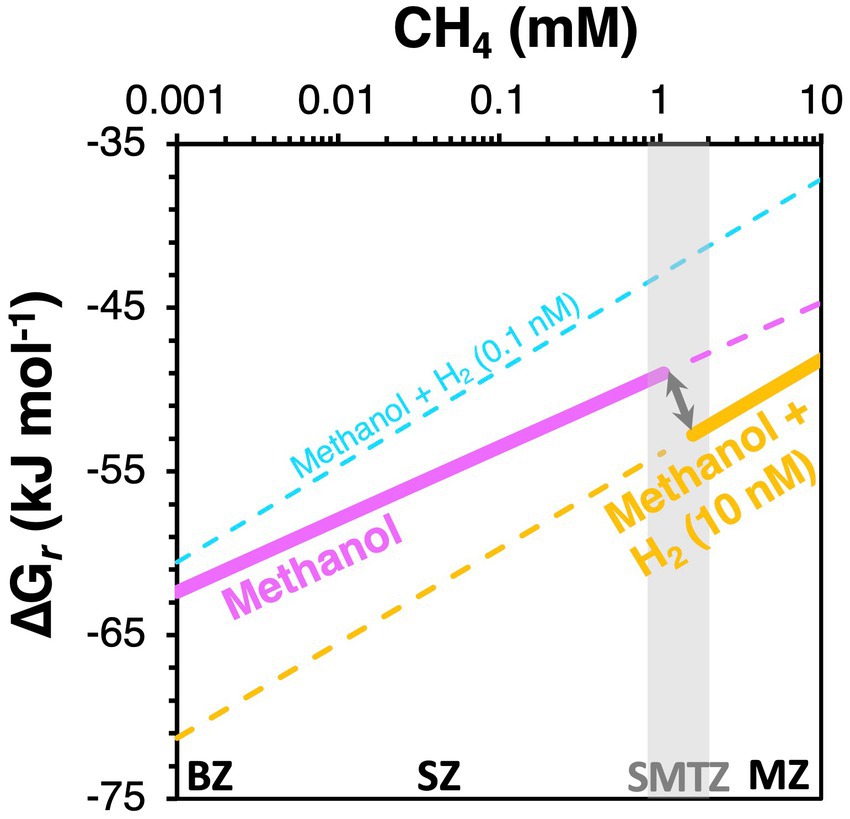
Figure 11. Proposed scenario for a switch in dominant methylotrophic pathway from methanol disproportionation (magenta) in the BZ and SZ to methanol reduction with H2 in the SMTZ and MZ (orange). We postulate that an increase in H2 concentrations from the BZ and SZ (cyan) to the MZ (orange) makes methanol reduction with H2 more energetically favorable than methanol disproportionation in the MZ and explains the observed vertical switch in dominant methylotrophic methanogens. Gibbs energies were calculated per mol of methanol. Calculations were done for two [H2] scenarios (0.1 nM, 10 nM). The shaded vertical bar indicates the SMTZ.
Conclusion
Our study indicates that methane-cycling archaeal communities in continental margin sediments generally follow two “axes of variation.” The first axis reflects the vertical biogeochemical zonation (i.e., BZ, SZ, SMTZ, and MZ), with sulfate concentrations as a likely key driver, while the second axis primarily reflects site-specific differences, e.g., in organic matter contents and reactivity. We, moreover, show that methane-cycling archaea undergo strong vertical shifts in community structure over time. As sediment horizons are buried to greater depths over time by seafloor sediment deposition, communities go through three successional stages – each characterized by different dominant taxa. The first successional stage is dominated by methyl disproportionating and specific CO2 reducing taxa (BZ & SZ taxa). These taxa decline in population size once they are buried to depths where methane concentrations become elevated (SMTZ). In these layers, SMTZ taxa that are largely linked to methanotrophic metabolism become dominant, showing clear evidence of net growth in response to increased methane availability. As sediment layers are buried further over time, to depths where sulfate concentrations become minimal, SMTZ taxa show population declines. In this methanic zone, a third successional stage emerges that is dominated by taxa involved in methanogenesis via CO2 and methyl group reduction. These MZ taxa already increase in population size once buried to the SMTZ – where sulfate concentrations become limiting and methanogenesis presumably becomes increasingly competitive with sulfate reduction for shared substrates – but only become dominant and reach their peak abundances once sulfate is depleted in the methanic zone. The three proposed successional stages are generally consistent with existing physiological knowledge on methane-cycling archaea and previous data on their distributions in marine sediments. Yet, the clear indication of net population growth based on vertical increases in gene copy numbers of major groups is novel. We propose that – following burial-related geochemical changes – periods of net population growth and proliferation of certain microbial taxa can occur in the cold sedimentary deep biosphere.
While the observed turnover and growth of specific methane-cycling archaeal taxa over time appears to be strongly influenced by sulfate concentrations and resulting competition of methanogens or cooperation of methanotrophs with sulfate reducers, our study also raises many new questions. Why do distinct taxa that share the same methanogenic pathway (e.g., CO2 reduction) or carbon substrate (methanol) dominate different successional stages? How is acetate converted to methane in methanogenesis zones? The answers to these questions are surprisingly unclear, despite decades of research on the marine sedimentary methane cycle. By outlining different thermodynamic scenarios, our study offers a theoretical framework for future investigations on the detailed mechanisms of methane-cycling in marine sediments.
Data availability statement
The datasets presented in this study can be found in online repositories. The names of the repository/repositories and accession number(s) can be found in the article/Supplementary material.
Author contributions
LD: Formal analysis, Funding acquisition, Investigation, Methodology, Writing – original draft. DB: Formal analysis, Methodology, Writing – review & editing. CG: Data curation, Formal analysis, Methodology, Writing – review & editing. BJ: Funding acquisition, Investigation, Resources, Validation, Writing – review & editing. HR: Formal analysis, Methodology, Project administration, Writing – review & editing. ML: Conceptualization, Data curation, Formal analysis, Funding acquisition, Investigation, Methodology, Project administration, Resources, Supervision, Validation, Visualization, Writing – original draft, Writing – review & editing.
Funding
The author(s) declare financial support was received for the research, authorship, and/or publication of this article. This study was funded by the Swiss National Science Foundation Project 205321_163371 (to ML), the Danish National Research Foundation (Grant 294200), the ERC Advanced Grant (MICROENERGY) and the Research Fund Denmark (Grant 1026-00159B) (to BJ), and the Science and Technology Commission of Shanghai Municipality (Shanghai Pujiang Program 22PJ1404800 and General Program 23R1428500 to LD). The Aurora expedition was funded by the Danish Center for Marine Research.
Acknowledgments
We thank the captain, crew, and scientific party of the expedition, as well as Laura Piepgras (MPI Bremen) and Kasper Urup Kjeldsen (Aarhus University) for sampling assistance, and Jean-Claude Walser (ETH Zürich) for bioinformatic assistance.
Conflict of interest
The authors declare that the research was conducted in the absence of any commercial or financial relationships that could be construed as a potential conflict of interest.
The author(s) declared that they were an editorial board member of Frontiers, at the time of submission. This had no impact on the peer review process and the final decision.
Generative AI statement
The authors declare that no Gen AI was used in the creation of this manuscript.
Publisher’s note
All claims expressed in this article are solely those of the authors and do not necessarily represent those of their affiliated organizations, or those of the publisher, the editors and the reviewers. Any product that may be evaluated in this article, or claim that may be made by its manufacturer, is not guaranteed or endorsed by the publisher.
Supplementary material
The Supplementary material for this article can be found online at: https://www.frontiersin.org/articles/10.3389/fmicb.2025.1550762/full#supplementary-material
Footnotes
1. ^http://www.bioinformatics.babraham.ac.uk/projects/fastqc
2. ^https://github.com/lh3/seqtk
4. ^https://drive.google.com/drive/folders/1G8GeJuYsIX4MLv5-LaUQHD9f9F9rfIAu
References
Alperin, M. J., and Hoehler, T. M. (2009). Anaerobic methane oxidation by archaea/sulfate-reducing bacteria aggregates: 2 isotopic constraints. Am. J. Sci. 309, 958–984. doi: 10.2475/10.2009.02
Aromokeye, D. A., Kulkarni, A. C., Elvert, M., Wegener, G., Henkel, S., Coffinet, S., et al. (2020). Rates and microbial players of iron-driven anaerobic oxidation of methane in methanic marine sediments. Front. Microbiol. 10:3041. doi: 10.3389/fmicb.2019.03041
Berger, S., Welte, C., and Deppenmeier, U. (2012). Acetate activation in Methanosaeta thermophila: characterization of the key enzymes pyrophosphatase and acetyl-CoA Synthetase. Archaea 2012:315153. doi: 10.1155/2012/315153
Beulig, F., Røy, H., Glombitza, C., and Jørgensen, B. B. (2018). Control on rate and pathway of anaerobic organic carbon degradation in the seabed. Proc. Natl. Acad. Sci. U. S. A. 115, 367–372. doi: 10.1073/pnas.1715789115
Beulig, F., Røy, H., McGlynn, S. E., and Jørgensen, B. B. (2019). Cryptic CH4 cycling in the sulfate-methane transition of marine sediments apparently mediated by ANME-1 archaea. ISME J. 13, 250–262. doi: 10.1038/s41396-018-0273-z
Bhattarai, S., Cassarini, C., and Lens, P. N. L. (2019). Physiology and distribution of archaeal methanotrophs that couple anaerobic oxidation of methane with sulfate reduction. Microbiol. Mol. Biol. Rev. 83:e00074-18. doi: 10.1128/MMBR.00074-18
Bianchi, T. S., Aller, R. C., Atwood, T. B., Brown, C. J., Buatois, L. A., Levin, L. A., et al. (2021). What global biogeochemical consequences will marine animal–sediment interactions have during climate change? Elem. Sci. Anth. 9:00180. doi: 10.1525/elementa.2020.00180
Boetius, A., Ravenschlag, K., Schubert, C. J., Rickert, D., Widdel, F., Gieseke, A., et al. (2000). A marine microbial consortium apparently mediating anaerobic oxidation of methane. Nature 407, 623–626. doi: 10.1038/35036572
Casal, M., Paiva, S., Queirós, O., and Soares-Silva, I. (2008). Transport of carboxylic acids in yeasts. FEMS Microbiol. Rev. 32, 974–994. doi: 10.1111/j.1574-6976.2008.00128.x
Chadwick, G. L., Skennerton, C. T., Laso-Pérez, R., Leu, A. O., Speth, D. R., Yu, H., et al. (2022). Comparative genomics reveals electron transfer and syntrophic mechanisms differentiating methanotrophic and methanogenic archaea. PLoS Biol. 20:e3001508. doi: 10.1371/journal.pbio.3001508
Clegg, S. L., and Whitfield, M. (1991). “Activity coefficients in natural waters” in Activity coefficients in electrolyte solutions. ed. K. S. Pitzer (Boca Raton: CRC Press), 279–434.
Conrad, R. (1999). Contribution of hydrogen to methane production and control of hydrogen concentrations in methanogenic soils and sediments. FEMS Microbiol. Ecol. 28, 193–202. doi: 10.1111/j.1574-6941.1999.tb00575.x
Conrad, R. (2005). Quantification of methanogenic pathways using stable carbon isotopic signatures: a review and a proposal. Org. Geochem. 36, 739–752. doi: 10.1016/j.orggeochem.2004.09.006
Conrad, R. (2020). Importance of hydrogenotrophic, aceticlastic and methylotrophic methanogenesis for methane production in terrestrial, aquatic and other anoxic environments: a mini review. Pedosphere 30, 25–39. doi: 10.1016/S1002-0160(18)60052-9
Dean, J. F., Middelburg, J. J., Röckmann, T., Aerts, R., Blauw, L. G., Egger, M., et al. (2018). Methane feedbacks to the global climate system in a warmer world. Rev. Geophys. 56, 207–250. doi: 10.1002/2017RG000559
Deng, L., Bölsterli, D., Kristensen, E., Meile, C., Su, C.-C., Bernasconi, S. M., et al. (2020). Macrofaunal control of microbial community structure in continental margin sediments. Proc. Natl. Acad. Sci. U. S. A. 117, 15911–15922. doi: 10.1073/pnas.1917494117
Dyksma, S., Jansen, L., and Gallert, C. (2020). Syntrophic acetate oxidation replaces acetoclastic methanogenesis during thermophilic digestion of biowaste. Microbiome 8:105. doi: 10.1186/s40168-020-00862-5
Edgar, R. C. (2016). UNOISE2: improved error-correction for Illumina 16S and ITS amplicon sequencing. bioRxiv [Preprint]. doi: 10.1101/081257
Egger, M., Riedinger, N., Mogollón, J. M., and Jørgensen, B. B. (2018). Global diffusive fluxes of methane in marine sediments. Nat. Geosci. 11, 421–425. doi: 10.1038/s41561-018-0122-8
Ettwig, K. F., Zhu, B., Speth, D., Keltjens, J. T., Jetten, M. S., and Kartal, B. (2016). Archaea catalyze iron-dependent anaerobic oxidation of methane. Proc. Natl. Acad. Sci. U. S. A. 113, 12792–12796. doi: 10.1073/pnas.1609534113
Fry, J. C., Horsfield, B., Sykes, R., Cragg, B. A., Heywood, C., Kim, G. T., et al. (2009). Prokaryotic populations and activities in an interbedded coal deposit, including a previously deeply buried section (1.6–2.3 km) above ∼ 150 Ma basement rock. Geomicrobiol J. 26, 163–178. doi: 10.1080/01490450902724832
Fry, B., and Sherr, E. B. (1989). “δ13C measurements as indicators of carbon flow in marine and freshwater ecosystems” in stable isotopes in ecological research” in Ecological studies. eds. P. W. Rundel, J. R. Ehleringer, and K. A. Nagy, vol. 68 (New York: Springer), 196–269.
Gao, K., and Lu, Y. (2021). Putative extracellular electron transfer in methanogenic archaea. Front. Microbiol. 12:611739. doi: 10.3389/fmicb.2021.611739
Garcia, J. L., Ollivier, B., and Whitman, W. B. (2006). “The order Methanomicrobiales” in The prokaryotes. eds. M. Dworkin, S. Falkow, E. Rosenberg, K. H. Schleifer, and E. Stackebrandt (New York, NY: Springer).
Gies, E. A., Konwar, K. M., Beatty, J. T., and Hallam, S. J. (2014). Illuminating microbial dark matter in meromictic sakinaw lake. Appl. Environ. Microbiol. 80, 6807–6818. doi: 10.1128/AEM.01774-14
Glombitza, C., Pedersen, J., Røy, H., and Jørgensen, B. B. (2014). Direct analysis of volatile fatty acids in marine sediment porewater by two-dimensional ion chromatography-mass spectrometry. Limnol. Oceanogr. Meth. 12, 455–468. doi: 10.4319/lom.2014.12.455
Grasshoff, K., Ehrhardt, M., and Kremling, K. (1983). Methods of sea water analysis. 2nd Edn. Weinheim, New York: Verlag Chemie, 419.
Hallam, S. J., Girguis, P. R., Preston, C. M., Richardson, P. M., and DeLong, E. F. (2003). Identification of methyl coenzyme M reductase A (mcrA) genes associated with methane-oxidizing Archaea. Appl. Environ. Microbiol. 69, 5483–5491. doi: 10.1128/AEM.69.9.5483-5491.2003
Haroon, M. F., Hu, S., Shi, Y., Imelfort, M., Keller, J., Hugenholtz, P., et al. (2013). Anaerobic oxidation of methane coupled to nitrate reduction in a novel archaeal lineage. Nature 500, 567–570. doi: 10.1038/nature12375
Harrison, B. K., Zhang, H., Berelson, W., and Orphan, V. J. (2009). Variations in archaeal and bacterial diversity associated with the sulfate-methane transition zone in continental margin sediments (Santa Barbara Basin, California). Appl. Environ. Microbiol. 75, 1487–1499. doi: 10.1128/AEM.01812-08
Hattori, S. (2008). Syntrophic acetate-oxidizing microbes in methanogenic environments. Microbes Environ. 23, 118–127. doi: 10.1264/jsme2.23.118
Heip, C. H. R., Herman, P. M. J., and Soetaert, K. (1998). Indices of diversity and evenness. Océanis 24, 61–87.
Hermans, M., Stranne, C., Broman, E., Sokolov, A., Roth, F., Nascimento, F. J. A., et al. (2024). Ebullition dominates methane emissions in stratified coastal waters. Sci. Total Environ. 945:174183. doi: 10.1016/j.scitotenv.2024.174183
Heuer, V. B., Pohlman, J. W., Torres, M. E., Elvert, M., and Hinrichs, K.-U. (2009). The stable carbon isotope biogeochemistry of acetate and other dissolved carbon species in deep subseafloor sediments at the northern Cascadia margin. Geochim. Cosmochim. Acta 73, 3323–3336. doi: 10.1016/j.gca.2009.03.001
Hoehler, T. M. (2004). Biological energy requirements as quantitative boundary conditions for life in the subsurface. Geobiology 2, 205–215. doi: 10.1111/j.1472-4677.2004.00033.x
Hoehler, T. M., Alperin, M. J., Albert, D. B., and Martens, C. S. (1998). Thermodynamic control on hydrogen concentrations in anoxic sediments. Geochim. Cosmochim. Acta 62, 1745–1756. doi: 10.1016/S0016-7037(98)00106-9
Hoehler, T. M., Alperin, M. J., Albert, D. B., and Martens, C. S. (2001). Apparent minimum free energy requirements for methanogenic Archaea and sulfate-reducing bacteria in an anoxic marine sediment. FEMS Microbiol. Ecol. 38, 33–41. doi: 10.1111/j.1574-6941.2001.tb00879.x
Holmes, D. E., Rotaru, A.-E., Ueki, T., Shrestha, P. M., Ferry, J. G., and Lovley, D. R. (2018). Electron and proton flux for carbon dioxide reduction in Methanosarcina barkeri during direct interspecies electron transfer. Front. Microbiol. 9:3109. doi: 10.3389/fmicb.2018.03109
James, R. H., Bousquet, P., Bussmann, I., Haeckel, M., Kipfer, R., Leifer, I., et al. (2016). Effects of climate change on methane emissions from seafloor sediments in the Arctic Ocean: a review. Limnol. Oceanogr. 61, S283–S299. doi: 10.1002/lno.10307
Jetten, M. S. M., Hagen, W. R., Pierik, A. J., Stams, A. J. M., and Zehnder, A. J. B. (1991). Paramagnetic centers and acetyl-coenzyme A/CO exchange activity of carbon monoxide dehydrogenase from Methanothrix soehngenii. Eur. J. Biochem. 195, 385–391. doi: 10.1111/j.1432-1033.1991.tb15717.x
Jiao, J.-Y., Ma, S.-C., Salam, N., Zhou, Z., Lian, Z.-H., Fu, L., et al. (2024). Cultivation of novel Atribacterota from oil well provides new insight into their diversity, ecology, and evolution in anoxic, carbon-rich environments. Microbiome 12:123. doi: 10.1186/s40168-024-01836-7
Jørgensen, B. B. (2021). Sulfur biogeochemical cycle of marine sediments. Geochem. Perspect. 10, 145–307. doi: 10.7185/geochempersp.10.2
Jørgensen, B. B., and Kasten, S. (2006). “Sulfur cycling and methane oxidation” in Marine Geochemistry. eds. H. D. Schulz and M. Zabel. 2nd ed (Berlin: Springer), 271–309.
Joye, S. B., Samarkin, V. A., Orcutt, B. N., MacDonald, I. R., Hinrichs, K.-U., Elvert, M., et al. (2010). Metabolic variability in seafloor brines revealed by carbon and Sulphur dynamics. Nat. Geosci. 2, 349–354. doi: 10.1038/ngeo475
Kelley, D. S., Karson, J. A., Früh-Green, G. L., Yoerger, D. R., Shank, T. M., Butterfield, D. A., et al. (2005). A Serpentinite-hosted ecosystem: the lost city hydrothermal field. Science 307, 1428–1434. doi: 10.1126/science.1102556
King, G. M. (1984). Utilization of hydrogen, acetate, and noncompetitive; substrates by methanogenic bacteria in marine sediments. Geomicrobiol J. 3, 275–306. doi: 10.1080/01490458409377807
Knittel, K., and Boetius, A. (2009). Anaerobic oxidation of methane: progress with an unknown process. Ann. Rev. Microbiol. 63, 311–334. doi: 10.1146/annurev.micro.61.080706.093130
Knittel, K., Lösekann, T., Boetius, A., Kort, R., and Amann, R. (2005). Diversity and distribution of methanotrophic archaea at cold seeps. Appl. Environ. Microbiol. 71, 467–479. doi: 10.1128/AEM.71.1.467-479.2005
Kormas, K. A., Meziti, A., Dählmann, A., de Lange, G. J., and Lykousis, V. (2008). Characterization of methanogenic and prokaryotic assemblages based on mcrA and 16S rRNA gene diversity in sediments of the Kazan mud volcano (Mediterranean Sea). Geobiology 6, 450–460. doi: 10.1111/j.1472-4669.2008.00172.x
Kristensen, E., Røy, H., Debrabant, K., and Valdemarsen, T. (2018). Carbon oxidation and bioirrigation in sediments along a Skagerrak-Kattegat-Belt sea depth transect. Mar. Ecol. Prog. Ser. 604, 33–50. doi: 10.3354/meps12734
Kröninger, L., Gottschling, J., and Deppenmeier, U. (2017). Growth characteristics of Methanomassiliicoccus luminyensis and expression of methyltransferase encoding genes. Archaea 2017. doi: 10.1155/2017/2756573
Lang, K., Schuldes, J., Klingl, A., Poehlein, A., Daniel, R., and Brune, A. (2015). New mode of energy metabolism in the seventh order of methanogens as revealed by comparative genome analysis of Candidatus Methanoplasma termitum. Appl. Environ. Microbiol. 81, 1338–1352. doi: 10.1128/AEM.03389-14
Lapham, L., Fossing, H., Flury McGinnis, S., Jensen, J. B., Alperin, M. J., Rehder, G., et al. (2024). Leaky diffusion barrier of anaerobic methane oxidation in organic-rich marine sediments. Nat. Geosci. 17, 1277–1283. doi: 10.1038/s41561-024-01594-z
Lazar, C. S., Parkes, R. J., Cragg, B. A., L’Haridon, S., and Toffin, L. (2012). Methanogenic activity and diversity in the Centre of the Amsterdam mud volcano, Eastern Mediterranean Sea. FEMS Microbiol. Ecol. 81, 243–254. doi: 10.1111/j.1574-6941.2012.01375.x
Lever, M. A. (2013). Functional gene surveys from ocean drilling expeditions - a review and perspective. FEMS Microbiol. Ecol. 84, 1–23. doi: 10.1111/1574-6941.12051
Lever, M. A., Alperin, M. J., Hinrichs, K.-U., and Teske, A. (2023). Zonation of the active methane-cycling community in deep subsurface sediments of the Peru trench. Front. Microbiol. 14:1192029. doi: 10.3389/fmicb.2023.1192029
Lever, M. A., and Teske, A. P. (2015). Diversity of methane-cycling archaea in hydrothermal sediment investigated by general and group-specific PCR primers. Appl. Environ. Microbiol. 81, 1426–1441. doi: 10.1128/AEM.03588-14
Lever, M. A., Torti, A., Eickenbusch, P., Michaud, A. B., Săntl-Temkiv, T., and Jørgensen, B. B. (2015). A modular method for the extraction of DNA and RNA, and the separation of DNA pools from diverse environmental sample types. Front. Microbiol. 6:476. doi: 10.3389/fmicb.2015.00476
Liang, L., Sun, Y., Dong, Y., Ahmad, T., Chen, Y., Wang, J., et al. (2022). Methanococcoides orientis sp. nov., a methylotrophic methanogen isolated from sediment of the East China Sea. Int. J. Syst. Evol. Microbiol. 72. doi: 10.1099/ijsem.0.005384
Liu, Y., and Whitman, W. B. (2008). Metabolic, phylogenetic, and ecological diversity of the methanogenic archaea. Ann. N. Y. Acad. Sci. 1125, 171–189. doi: 10.1196/annals.1419.019
Lloyd, K. G., Albert, D. B., Biddle, J. F., Chanton, J. P., Pizarro, O., and Teske, A. (2010). Spatial structure and activity of sedimentary microbial communities underlying a Beggiatoa spp. mat in a Gulf of Mexico hydrocarbon seep. PLoS One 5:e8738. doi: 10.1371/journal.pone.0008738
Lloyd, K. G., Lapham, L., and Teske, A. (2006). An anaerobic methane-oxidizing community of ANME-1b Archaea in hypersaline Gulf of Mexico sediments. Appl. Environ. Microbiol. 72, 7218–7230. doi: 10.1128/AEM.00886-06
Lovley, D. R., and Goodwin, S. (1988). Hydrogen concentrations as an indicator of the predominant terminal electron-accepting reactions in aquatic sediments. Geochim. Cosmochim. Acta 52, 2993–3003. doi: 10.1016/0016-7037(88)90163-9
Magoč, T., and Salzberg, S. L. (2011). FLASH, fast length adjustment of short reads to improve genome assemblies. Bioinformatics 27, 2957–2963. doi: 10.1093/bioinformatics/btr507
Maltby, J., Sommer, S., Dale, A. W., and Treude, T. (2015). Microbial methanogenesis in the sulfate-reducing zone of surface sediments traversing the Peru margin. Biogeosciences 13, 283–299. doi: 10.5194/bg-13-283-2016
Marshall, I. P. G., Ren, G., Jaussi, M., Lomstein, B. A., Jørgensen, B. B., Røy, H., et al. (2019). Environmental filtering determines family-level structure of sulfate-reducing microbial communities in subsurface marine sediments. ISME J. 13, 1920–1932. doi: 10.1038/s41396-019-0387-y
Martin, M. (2011). Cutadapt removes adapter sequences from high-throughput sequencing reads. EMBnet J. 17:3. doi: 10.14806/ej.17.1.200
Mayumi, D., Mochimaru, H., Tamaki, H., Yamamoto, K., Yoshioka, H., Suzuki, Y., et al. (2016). Methane production from coal by a single methanogen. Science 354, 222–225. doi: 10.1126/science.aaf8821
McMurdie, P. J., and Holmes, S. (2013). Phyloseq: an R package for reproducible interactive analysis and graphics of microbiome census data. PLoS One 8:e61217. doi: 10.1371/journal.pone.0061217
Meier, D., van Grinsven, S., Michel, A., Eickenbusch, P., Glombitza, C., Han, X., et al. (2024). Hydrogen–independent CO2 reduction dominates methanogenesis in five temperate lakes that differ in trophic states. ISME Comms. 4:ycae089. doi: 10.1093/ismeco/ycae089
Millero, F. J. (2000). The activity coefficients of non-electrolytes in seawater. Mar. Chem. 70, 5–22. doi: 10.1016/S0304-4203(00)00011-6
Millero, F. J., and Schreiber, D. R. (1982). Use of the ion pairing model to estimate activity coefficients of the ionic components of natural waters. Am. J. Sci. 282, 1508–1540. doi: 10.2475/ajs.282.9.1508
Niu, M., Deng, L., Su, L., Ruff, S. E., Yang, N., Luo, M., et al. (2022). Methane supply drives prokaryotic community assembly and networks at cold seeps of the South China Sea. Mol. Ecol. 32, 660–679. doi: 10.1111/mec.16786
Orcutt, B. N., Joye, S. B., Kleindienst, S., Knittel, K., Ramette, A., Reitz, A., et al. (2010). Impact of natural oil and higher hydrocarbons on microbial diversity, distribution, and activity in Gulf of Mexico cold-seep sediments. Deep Sea Res. II 57, 2008–2021. doi: 10.1016/j.dsr2.2010.05.014
Oremland, R. S., and Boone, D. R. (1994). Methanolobus taylorii sp. nov., a new methylotrophic, estuarine methanogen. Int. J. Syst. Evol. Microbiol. 44, 573–575. doi: 10.1099/00207713-44-3-573
Oremland, R. S., Marsh, L. M., and Polcin, S. (1982). Methane production and simultaneous sulphate reduction in anoxic, salt marsh sediments. Nature 296, 143–145. doi: 10.1038/296143a0
Oren, A. (2014). The family Methanotrichaceae. The Prokaryotes – Other Major Lineages of Bacteria and the Archaea.
Parkes, R. J., Gibson, G. R., Mueller-Harvey, I., Buckingham, W. J., and Herbert, R. A. (1989). Determination of the substrates for sulphate-reducing bacteria within marine and estuarine sediments with different rates of sulphate reduction. J. Gen. Microbiol. 135, 175–187.
Reeburgh, W. S. (2007). Oceanic methane biogeochemistry. Chem. Rev. 107, 486–513. doi: 10.1021/cr050362v
Rotaru, A.-E., Shrestha, P. M., Liu, F., Markovaite, B., Chen, S., Nevin, K. P., et al. (2014). Direct interspecies electron transfer between Geobacter metallireducens and Methanosarcina barkeri. Appl. Environ. Microbiol. 80, 4599–4605. doi: 10.1128/AEM.00895-14
Ruff, S. E., Biddle, J. F., Teske, A. P., Knittel, K., Boetius, A., and Ramette, A. (2015). Global dispersion and local diversification of the methane seep microbiome. Proc. Natl. Acad. Sci. U. S. A. 112, 4015–4020. doi: 10.1073/pnas.1421865112
Schink, B. (1997). Energetics of syntrophic cooperation in methanogenic degradation. Microbiol. Mol. Biol. Rev. 61, 262–280.
Schmieder, R., and Edwards, R. (2011). Quality control and preprocessing of metagenomic datasets. Bioinformatics 27, 863–864. doi: 10.1093/bioinformatics/btr026
Sela-Adler, M., Ronen, Z., Herut, B., Antler, G., Vigderovich, H., Eckert, W., et al. (2017). Co-existence of methanogenesis and sulfate reduction with common substrates in sulfate-rich estuarine sediments. Front. Microbiol. 8:766. doi: 10.3389/fmicb.2017.00766
Shaw, D. G., Alperin, M. J., Reeburgh, W. S., and McIntosh, D. J. (1984). Biogeochemistry of acetate in anoxic sediments of Skan Bay, Alaska. Geochim. Cosmochim. Acta 48, 1819–1825. doi: 10.1016/0016-7037(84)90035-8
Slobodkin, A. I., Ratnikova, N. M., Slobodkina, G. B., Klyukina, A. A., Chernyh, N. A., and Merkel, A. Y. (2023). Composition and metabolic potential of Fe(III)-reducing enrichment cultures of Methanotrophic ANME-2a Archaea and associated Bacteria. Microorganisms 11:555. doi: 10.3390/microorganisms11030555
Steinberg, L. M., and Regan, J. M. (2009). mcrA-targeted real-time quantitative PCR method to examine methanogen communities. Appl. Environ. Microbiol. 75, 4435–4442. doi: 10.1128/AEM.02858-08
Stumm, W., and Morgan, J. J. (1996). Aquatic chemistry, chemical equilibria and rates in natural waters. 3rd Edn. New York: John Wiley & Sons, Inc.
Takano, Y., Chikaraishi, Y., Imachi, H., Miyairi, Y., Ogawa, N. O., Kaneko, M., et al. (2018). Insight into anaerobic methanotrophy from 13C/12C- amino acids and 14C/12C-ANME cells in seafloor microbial ecology. Sci. Rep. 8:14070. doi: 10.1038/s41598-018-31004-5
van Grinsven, S., Meier, D., Michel, A., Han, X., Schubert, C. J., and Lever, M. A. (2022). Role of redox zone and trophic history as drivers of methanotrophic bacterial abundance and community structure in lake sediments. Front. Environ. Sci. 10:857358. doi: 10.3389/fenvs.2022.857358
Weber, T., Wiseman, N. A., and Kock, A. (2019). Global Ocean methane emissions dominated by shallow coastal waters. Nat. Commun. 10:4584. doi: 10.1038/s41467-019-12541-7
Webster, G., Sass, H., Cragg, B. A., Gorra, R., Knab, N. J., Green, C. J., et al. (2011). Enrichment and cultivation of prokaryotes associated with the sulphate-methane transition zone of diffusion-controlled sediments of Aarhus Bay, Denmark, under heterotrophic conditions. FEMS Microbiol. Ecol. 77, 248–263. doi: 10.1111/j.1574-6941.2011.01109.x
Wei, T., Simko, V., Levy, M., Xie, Y., Jin, Y., and Zemla, J. (2017). Package ‘corrplot’. Statistician 56:e24.
Wen, X., Yang, S., Horn, F., Winkel, M., Wagner, D., and Liebner, S. (2017). Global biogeographic analysis of methanogenic archaea identifies community-shaping environmental factors of natural environments. Front. Microbiol. 8:1339. doi: 10.3389/fmicb.2017.01339
Whiticar, M. J. (1999). Carbon and hydrogen isotope systematics of bacterial formation and oxidation of methane. Chem. Geol. 161, 291–314. doi: 10.1016/S0009-2541(99)00092-3
Whiticar, M. J., Faber, E., and Schoell, M. (1986). Biogenic methane formation in marine and freshwater environments, CO2 reduction vs. acetate fermentation—isotope evidence. Geochim. Cosmochim. Acta 50, 693–709. doi: 10.1016/0016-7037(86)90346-7
Whitman, W. B., Bowen, T. L., and Boone, D. R. (2014). The methanogenic bacteria. Prokaryotes 3, 123–163. doi: 10.1007/978-3-642-38954-2_407
Xiao, K.-Q., Beulig, F., Røy, H., Jørgensen, B. B., and Risgaard-Petersen, N. (2018). Methylotrophic methanogenesis fuels cryptic methane cycling in marine surface sediment. Limnol. Oceanogr. 63, 1519–1527. doi: 10.1002/lno.10788
Yanagawa, K., Sunamura, M., Lever, M. A., Morono, Y., Hiruta, A., Matsumoto, R., et al. (2011). Niche separation of methanotrophic Archaea (ANME-1 and -2) in cold seep sediments off of Joetsu, Japan Sea. Geomicrobiol J. 28, 118–129. doi: 10.1080/01490451003709334
Zhou, Z., Chen, J., Cao, H., Han, P., and Gu, J.-D. (2015). Analysis of methane-producing and metabolizing archaeal and bacterial communities in sediments of the northern South China Sea and coastal Mai Po nature reserve revealed by PCR amplification of mcrA and pmoA genes. Front. Microbiol. 5:789. doi: 10.3389/fmicb.2014.00789
Keywords: methanogens, ANMEs, methanogenesis, Anaerobic Oxidation of Methane (AOM), Gibbs energy, stable isotopes, redox gradients, anoxic marine sediment
Citation: Deng L, Bölsterli D, Glombitza C, Jørgensen BB, Røy H and Lever MA (2025) Drivers of methane-cycling archaeal abundances, community structure, and catabolic pathways in continental margin sediments. Front. Microbiol. 16:1550762. doi: 10.3389/fmicb.2025.1550762
Edited by:
D’Arcy Renee Meyer-Dombard, University of Illinois Chicago, United StatesReviewed by:
James F. Holden, University of Massachusetts Amherst, United StatesJulia Kurth, University of Marburg, Germany
Copyright © 2025 Deng, Bölsterli, Glombitza, Jørgensen, Røy and Lever. This is an open-access article distributed under the terms of the Creative Commons Attribution License (CC BY). The use, distribution or reproduction in other forums is permitted, provided the original author(s) and the copyright owner(s) are credited and that the original publication in this journal is cited, in accordance with accepted academic practice. No use, distribution or reproduction is permitted which does not comply with these terms.
*Correspondence: Mark Alexander Lever, bWFyay5sZXZlckBhdXN0aW4udXRleGFzLmVkdQ==
†Present Addresses: Clemens Glombitza, Swiss Federal Nuclear Safety Inspectorate (ENSI), Swiss Federal Nuclear Safety Inspectorate, Brugg, Switzerland
Bo Barker Jørgensen, Section for Microbiology, Department of Biology, Aarhus University, Aarhus, Denmark
Hans Røy, Section for Microbiology, Department of Biology, Aarhus University, Aarhus, Denmark