 Shenghong Chen
 Zhen Tan
 Xiaobo Wen
- Hainan Key Lab of Tropical Animal Reproduction and Breeding and Epidemic Disease Research, Department of Animal Science and Technology, School of Tropical Agriculture and Forestry (School of Agricultural and Rural Affairs, School of Rural Revitalization), Hainan University, Haikou, China
Salmonella infections can lead to intestinal inflammation and metabolic disorders in birds. However, whether arachidonic acid (ARA) metabolism is involved in Salmonella-induced intestinal inflammation remains unclear. This experiment investigated the changes in cecal flora and ARA metabolism in Hainan Wenchang chickens infected with S. Typhimurium using 16s rDNA sequencing and targeted metabolomics. The results showed that the levels of ARA metabolites were increased in the cecum tissue of Wenchang chickens after infection with S. Typhimurium, including prostaglandin E2 (PGE2), prostaglandin F2α (PGF2α), lipoxin A4 (LXA4), ± 8(9)-EET, ± 11(12)-EET, and ± 8,9-DiHETrE. The content of key enzymes for ARA production and metabolism (Phospholipase A2 PLA2 and Cyclooxygenase-2 COX-2) in chicken cecum tissues was increased after S. Typhimurium infection. The relative mRNA levels of inflammatory factors were also increased after infection, including Interferon-γ (IFN-γ), Transforming growth factor-β1 (TGF-β1), Interleukin-4 (IL-4), and Interleukin-6 (IL-6). In HD11 cells, the use of a cyclooxygenase (COX) inhibitor reduced the increased levels of COX-2 and PGF2α induced by S. Typhimurium infection and effectively reduced the inflammatory response. In addition, the number of beneficial genera (e.g., Bifidobacterium, Lactobacillus, and Odorobacterium) in the cecum of Wenchang chickens was significantly reduced after infection with S. Typhimurium. The present study revealed the structure of cecal flora in S. Typhimurium-infected Wenchang chickens. In addition, this study demonstrated that S. Typhimurium activates the ARA cyclooxygenase metabolic pathway, which in turn mediates the development of intestinal inflammation in Wenchang chickens. The results can provide data support and theoretical support for the prevention and control of avian salmonellosis.
1 Introduction
Salmonella is one of the most common intestinal pathogens in animals and humans. In poultry, Salmonella enteritidis (S. Enteritidis) and Salmonella Typhimurium (S. Typhimurium) infections are insidious and usually asymptomatic or cause intestinal inflammation (Shaji et al., 2023). Moreover, Salmonella spp. can compete with the normal microbiota in various ways, disrupting its balance and causing a decline in the immunity of livestock and poultry, which, in severe cases, can cause high mortality (Winter et al., 2010; Fàbrega and Vila, 2013). Salmonellosis reduces the body weight of broilers and the egg production of laying hens, as well as reduces the fertility of chickens and the hatchability of chicks, all of which can have a significant impact on the poultry industry and cause economic losses (El-Saadony et al., 2022).
The ability of Campylobacter to infect chickens is influenced by gut flora (Han et al., 2017), suggesting that gut microbial communities play an important role in avian health. Available studies have shown that expression of the pro-inflammatory cytokine interleukin 6 (IL-6) is positively correlated with Shigella, Parasuttterella, and Vampirovibrio and negatively correlated with Fecalibacterium (Oakley and Kogut, 2016), which shows that the immune response of the host is strongly correlated with changes in the abundance of intestinal bacteria. Therefore, it is essential to have a comprehensive understanding of the effects of Salmonella infection on the intestinal flora of poultry, which can help control the disease’s occurrence and development. Wenchang chickens are the most economically valuable indigenous livestock species in Hainan Province (Gu et al., 2022). However, little is known about the changes in their intestinal flora after Salmonella infection.
The ability of S. Typhimurium to use the respiratory electron acceptor tetrathionate, which is produced during inflammation, provides it with a growth advantage over other flora in the inflamed gut environment (Winter et al., 2010). Thus, controlling the development of intestinal inflammation might help enhance resistance to intestinal colonization by Salmonella (Winter et al., 2010). The arachidonic acid (ARA) metabolic pathway is major pathway for the production of inflammatory mediators (Monk et al., 2012; Monk et al., 2014). And inflammatory mediators are involved in the onset and development of inflammatory responses. ARA and its metabolic derivatives (ARA-like) are involved in physiological processes such as blood leukocyte chemotaxis, platelet aggregation, and the promotion of intestinal inflammation by mediating Th17 and Th1 cells (Monk et al., 2014; Isse et al., 2022). This suggests that ARA-like is nvolved in pathophysiological processes related to cell injury, inflammation, and apoptosis. Infection of human intestinal epithelial cell lines (Caco2 and HT29) by entero-invasive Escherichia coli and Salmonella significantly increased cyclooxygenase-2 expression and prostaglandin E2 (PGE2) production (Resta-Lenert and Barrett, 2002). Increased prostaglandin F2α (PGF2α) release was also observed in intestinal epithelial cells following Salmonella infection (Eckmann et al., 1997). PGE2, 5-HETE, 8-HETE, 12-HETE, and 15-HETE syntheses were increased in Caco2 cells after lipopolysaccharide (10 μg/mL) treatment (Le Faouder et al., 2013). However, the question of whether ARA metabolites mediate enteritis caused by Salmonella infection in poultry has not been reported. Therefore, given the critical role of ARA and its metabolites in mediating the inflammatory response, it is essential to elucidate the metabolic changes of ARA in intestinal tissues following Salmonella infection. The metabolic changes of ARA in the intestinal tissues of Wenchang chickens after S. Typhimurium infection were detected by ultra-high performance liquid chromatography-tandem mass spectrometry (UHPLC-MS/MS). This study further explored the potential link between ARA metabolic pathways and enteritis caused by Salmonella infections in poultry, which might contribute to the prevention and treatment of the disease.
2 Materials and methods
2.1 Ethics statement
The sampling method and all subsequent methods were approved by the Ethics Committee of Hainan University (Haikou, China, Permit No. HNUAUCC-2023-00080). This experiment did not involve endangered or protected species.
2.2 Animal experiments
A total of 36 14 day old Wenchang chickens (purchased from Hainan Taniu Wenchang Chicken Co.) were randomly divided into three groups (n = 12). The experiment started on day 0 (14 days of age) and ended on day 30 (44 days of age), with a duration of 30 days. Grouping programs: The CON group was the healthy control group. The SAL group was infected with Salmonella Typhimurium (S. Typhimurium) on day 23. The ABX group was administered a cocktail of antibiotics containing ampicillin (1 g/L), neomycin sulfate (1 g/L), metronidazole (1 g/L), and vancomycin (0.5 g/L) via drinking water from days 7 to 21; on day 22, this group was given regular drinking water and infected with S. Typhimurium on day 23 (Figure 1). Infection was by gavage and the infection measure was 1 × 10⁹ CFU of S. Typhimurium per chicken. The strain was Salmonella enterica serovar Typhimurium (strain no. ATCC14028). Chicken sera were collected from all groups on the 24th day after the start of the experiment and checked for successful infection using a Chicken Salmonella ELISA KIT (Shanghai Yaji Biotechnology Co., Ltd., shanghai, China). If the OD450 reading was greater than the Cut-off value of 0.2, then the chicken was infected with S. Typhimurium (Supplementary Figure S1). The three groups of chickens were kept in three separate rooms with the same temperature, humidity, and other conditions to avoid cross-infection. Room information: At 3–4 weeks of age, the temperature was 28–30°C, the relative humidity was 55–60%, and the illumination time was 16 h; at 5–6 weeks of age, the temperature was 24–26°C, the relative humidity was 50–55%, and the light time was 12 h. Chickens were fed in cages with dimensions of 120 cm × 60 cm × 45 cm. Feeding management: all the chickens were fed the same diet and had free access to food and water. On day 30, 6 chickens per group were randomly selected for cervical dislocation euthanasia, and cecum contents and cecum intestinal tissues were aseptically collected on ice for 16s rDNA sequencing analysis and targeted metabolomics analysis.
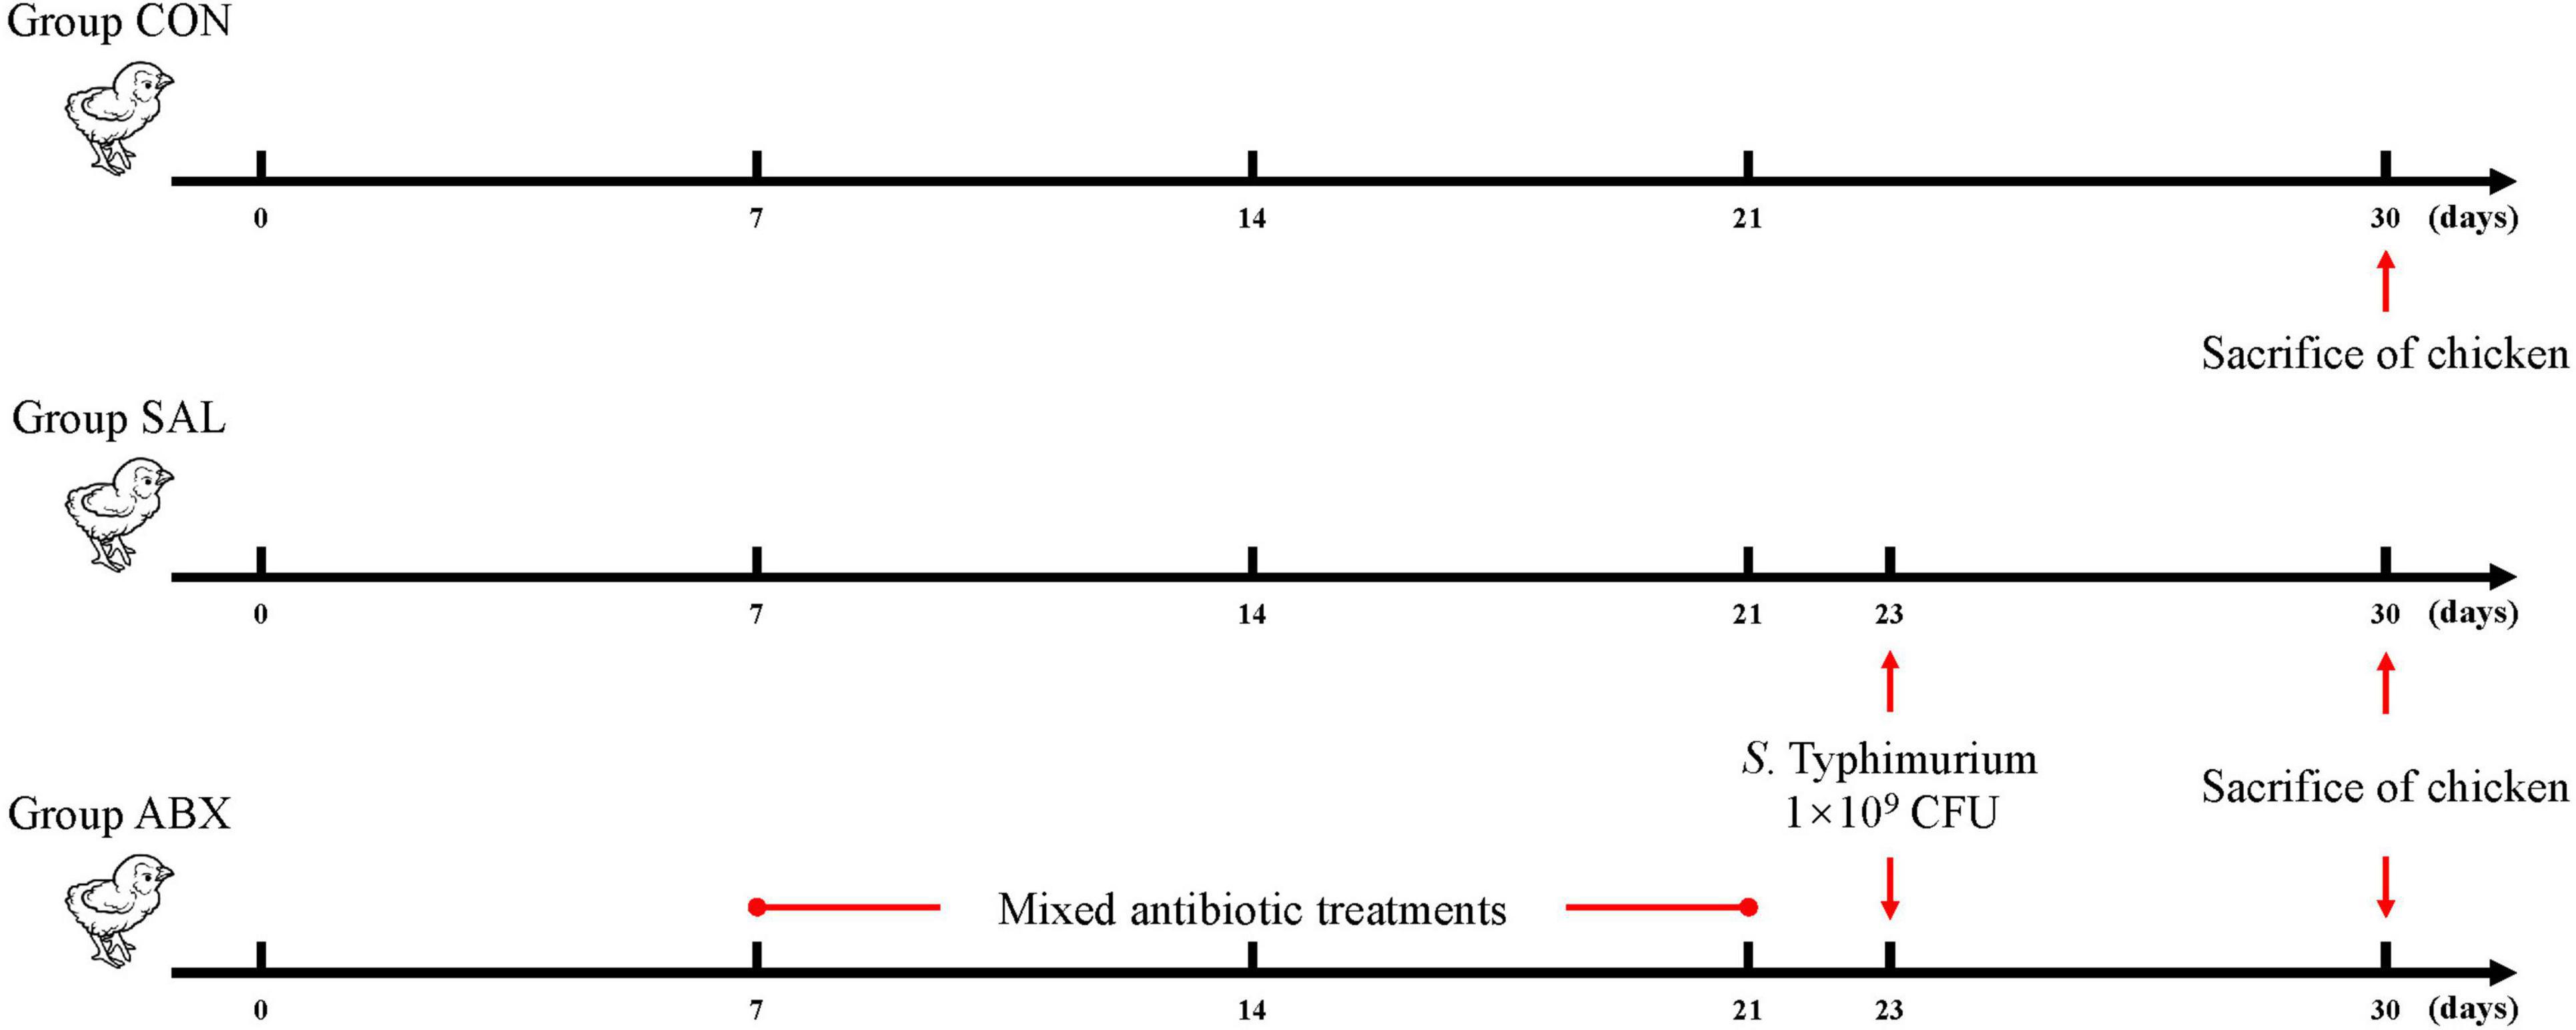
Figure 1. Schematic diagram of chicken grouping and experimental procedure.
2.3 16s rDNA sequencing and data analysis
The DNA was extracted using the CTAB (hexadecyl trimethyl ammonium bromide) method according to the manufacturer’s instructions. PCR amplification was used to construct libraries for sequencing. Briefly, amplification was performed using the specific primers listed in Table 1, and the PCR products were confirmed using 2% agarose gel electrophoresis, purified with AMPure XT beads (Beckman Coulter Genomics, Danvers, MA, United States), and quantified with Qubit (Invitrogen, United States) to obtain libraries for sequencing. The size and number of libraries were evaluated using Agilent 2100 Bioanalyzer (Agilent, United States) and Illumina (Kapa Biosciences, Woburn, MA, United States) library quantification kits, respectively. The libraries were sequenced on the NovaSeq PE250 platform. Quality raw reads were filtered under specific filtering conditions to obtain high-quality clean tags according to fqtrim (v0.94). Chimeric sequences were filtered using Vsearch software (v2.3.4) (Rognes et al., 2016). After dereplication using DADA2 (Callahan et al., 2016), we obtained the feature table and sequence. Alpha and beta diversities were randomly calculated by normalizing to identical sequences. Then, according to the SILVA (Release 138) classifier (Pruesse et al., 2012), feature abundance was normalized using the relative abundance of each sample. QIIME2 was used to calculate beta diversity and alpha diversity (Chao1, observed species, Good’s coverage index, Shannon, and Simpson) (Bolyen et al., 2019), and the R package was used to prepare the graphs. BLAST was used for sequence alignment, and the feature sequences were annotated using the SILVA database for each representative sequence. Other diagrams were drawn using the R package (v3.5.2).1 This study’s raw data were uploaded to the NCBI database under the number PRJNA1027078. Sequencing and data analysis were entrusted to Shanghai Biotree Biotech Co.
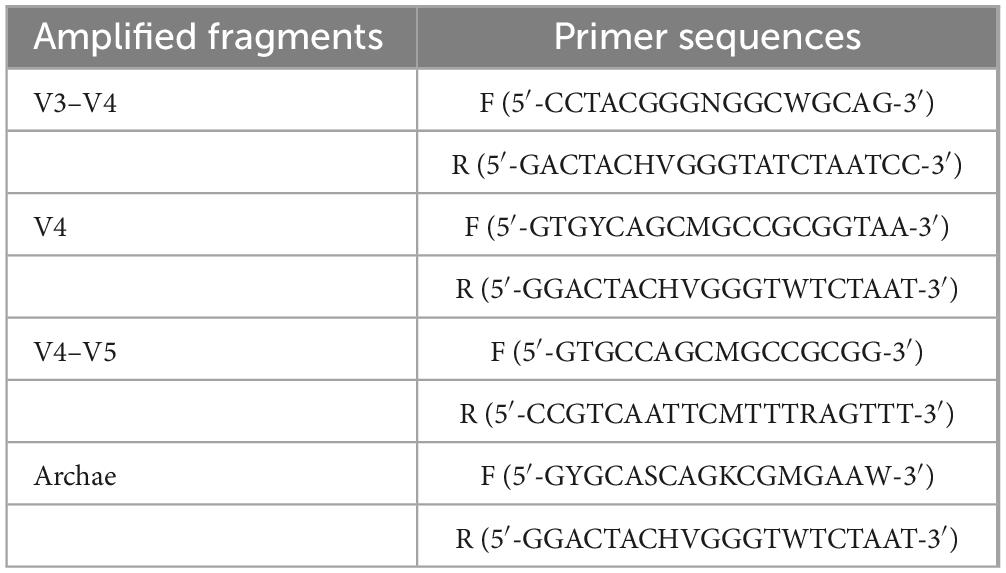
Table 1. PCR-specific amplification primer sequences.
LDA effect size (LEfSe) analysis was used to find species that differed significantly in abundance between groups. First, the Kruskal-Wallis rank sum test was utilized to detect all characterized species, and significantly different species were identified by detecting differences in species abundance between different groups. Then, the Wilcoxon rank sum test was utilized to test whether all subspecies of the significantly different species obtained in the previous step converged to the same taxonomic level. Finally, linear discriminant analysis (LDA) was used to estimate the magnitude of the effect of species abundance on the differential effect to obtain the final differential species. The screening conditions for LDA were LDA > 4 and P < 0.05.
2.4 Metabolite extraction and standard solution preparation
Briefly, the intestinal tissues were treated with extract (80% methanol/H2O (V/V), precooled at −40°C, containing isotopically labeled internal standard mixture), purified via solid-phase extraction, dried through nitrogen blowing, re-solubilized with 30% acetonitrile, and then centrifuged at 4°C and 12,000 rpm for 15 min to obtain the supernatant, which was subjected to UHPLC-MS/MS analysis.
Stock solutions were prepared by dissolving or diluting each standard substance to a final concentration of 1 μg/mL. An aliquot of each stock solution was transferred to an Eppendorf tube to obtain a mixed working standard solution. A series of traditional calibration solutions were then prepared through stepwise dilution of this mixed standard solution (containing the isotopically labeled internal standard mixture at identical concentrations to the samples). Supplementary Table S2 lists the standards used in this assay.
2.5 UHPLC-MRM-MS analysis
UHPLC separation was performed using an EXIONLC System (Sciex) equipped with a Waters ACQUITY UPLC BEH C18 column (150 × 2.1 mm, 1.7 μm, Waters). A SCIEX 6500 QTRAP+ triple quadrupole mass spectrometer (Sciex) equipped with an IonDrive Turbo V electrospray ionization interface was used for assay development. The MRM parameters for each target analyte were optimized using flow injection analysis by injecting standard solutions of individual analytes into the API source of the mass spectrometer. Several of the most sensitive transitions were used in MRM scan mode to optimize the collision energy for each Q1/Q3 pair (Supplementary Table S3). Among the optimized MRM transitions per analyte, the Q1/Q3 pairs with the highest sensitivity and selectivity were selected as “quantifiers” for quantitative monitoring. The additional transitions acted as qualifiers to verify the identity of the target analyte. The SCIEX Analyst WorkStation Software (Version 1.6.3) and the Multiquant 3.03 software were used for MRM data acquisition and processing. Metabolite assays and data analysis were entrusted to Shanghai Biotree Biotech Co.
2.6 Metabolite assay results and quality control
The calibration solutions were sequentially diluted 2-fold and analyzed using UHPLC-MRM-MS. The lower limits of detection (LLODs) and quantification (LLOQs) of the methods were calculated using their signal-to-noise ratios. According to the United States Food and Drug Administration guidelines for bioanalytical method validation, the LLODs of a method are defined as the concentration of a compound with a signal-to-noise ratio of 3, and the LLOQs of a method are defined as the concentration of a compound with a signal-to-noise ratio of 10. Supplementary Table S4 lists the resulting LLODs and LLOQs. The LLODs for the targeted metabolites ranged from 0.0195 to 1.2500 ng/mL, and the LLOQs ranged from 0.0390 to 2.5000 ng/mL. The correlation coefficients (R2) of regression fitting were above 0.9959 for the analytes, indicating a good quantitative relationship between the MS responses and analyte concentrations, satisfying the target metabolomics analysis. Supplementary Table S5 lists the analytical recoveries and relative standard deviations of the QC samples with five technical replicates. The recoveries were 85.07–111.47% for all analytes, with all RSDs below 14.09% (n = 5). The analysis metrics indicated that the method allowed for the accurate quantitation of the targeted metabolites in the biological samples in the above concentration range.
The quantification results are presented in Supplementary Table S6. The final concentration (cF, ng/mL) was equal to the calculated concentration (cC, ng/mL) multiplied by the dilution factor (Dil). For solid samples, the metabolite concentration (cM, ng/g) was equal to the final concentration (cF, ng/mL) multiplied by the final volume (VF, μL) and equal to the sample experiment concentration factor (CF) divided by the mass (m, mg) of the sample. N/A indicates that the targeted metabolites were not detectable in the corresponding samples.
2.7 Cell experiments
2.7.1 Establishment of HD11 cell model infected by S. Typhimurium
First, the lowest concentration of cyclooxygenase inhibitor (aspirin) that inhibited the growth of S. Typhimurium in vitro was determined. S. Typhimurium was cultured in an LB (Luria-Bertani) sterile liquid medium containing different aspirin concentrations for 6–8 h, and the bacteria growth in each group was counted by the plate count method.
Varied concentrations of aspirin (0, 31.25, 62.5, 125, 200, 500, and 1000 μg/mL) were then applied to HD11 cells for different times (0, 12, and 24 h). Cell viability was measured by MTT to determine the maximal aspirin concentration and treatment time.
Finally, HD11 cells were infected with S. Typhimurium at selected MOIs (1, 5, 10, 20, and 50). The relative expression levels of iNOS, IL-1β, IL-6, and IL-10 mRNA in the cells were measured to determine the appropriate MOIs and time of infection.
2.7.2 Chicken grouping and cell experiments
HD11 cells were infected with S. Typhimurium for 2 h (MOI = 20) after being pretreated with a medium with aspirin concentrations of 30, 60, and 120 μg/mL for 12 h.
2.8 Quantitative real-time polymerase chain reactionanalysis and ELISA assay
Changes in specific cytokine mRNAs and ARA metabolites in cecum in vivo and HD11 cells in vitro following S. Typhimurium infection were assessed by qRT-PCR and ELISA. The cecum tissue was homogenized using an automated sample rapid grinder (Tissuelyser-24L, Shanghai Jingxin Industrial Development Co., Ltd., Shanghai, China), and total RNA was extracted from the cecum tissue using the TRIzol method. Total RNA was extracted from HD11 cells by the TRIzol method. cDNA was prepared by the TIANGEN cDNA synthesis kit. The qRT-PCR analysis was performed using SYBR Green Master Mix, and glyceraldehyde-3-phosphate dehydrogenase (GAPDH) was used as a housekeeping gene. The mRNA concentration of all samples was adjusted to 1,000 ng/mL during reverse transcription. The primers used are listed in Supplementary Table S1. The relative gene expression was calculated using the 2–ΔΔCt method. GraphPad Prism (version 8.0c) and SPSS 17.0 were used for statistical analysis. Data were analyzed using the 2–ΔΔCt method and expressed as mean ± standard error (SEM). The statistical significance of the data was assessed using a one-way analysis of variance (ANOVA) followed by Duncan’s and Tukey’s tests.
The ELISA kits (Xiamen Lunchangshuo Biotech Co., Ltd., Xiamen, China) were used to detect COX-2, PGF2α, PLA2, and ARA in the samples according to the instructions.
2.9 Statistical analysis of data
Metabolites from each group were normalized using the Z-score normalization method, which is indicated by the value of (x-μ)/σ. “μ” denotes the mean of the overall data, “σ” denotes the standard deviation of the overall data, and “x” denotes the individual observation. The Z-score values were calculated using MedCalc 222 software. R (3.4.4)3 was used to create a plot of the Z-scores.
Spearman’s correlation analysis was used to assess the correlation between three data types: oxidized fats, inflammatory factors, and intestinal flora. The Spearman correlation analysis was carried out using the Stats package (2.5.4)4 for R (3.4.4).
Multivariate statistical analysis was used to calculate the variable importance in the projection (VIP) values and orthogonal projections to latent structure discriminant analysis (OPLS-DA). The Mann–Whitney U test was used to compare differences between two groups of samples with biological replicates; the Kruskal–Wallis test was used to compare differences between multiple groups of samples with biological replicates. Adonis and ANOSIM were used to test whether the differences between groups were significantly greater than those within groups and to determine whether the subgroups were significant. The Vegan package (2.5.4)5 for R (3.4.4) was used for the above data analysis.
The datasets were evaluated for normal distribution using the D’Agostino–Pearson test, and presented as mean ± standard error of the mean (SEM). Statistical significance was determined with either a two-tailed unpaired Student’s t-test (for two groups) or one-way ANOVA (for grouped comparisons). In datasets analyzed using ANOVA, the Bonferroni post hoc test was adopted. A p-value less than 0.05 was considered statistically significant. All statistical analysis was performed with Prism version 8.0 (GraphPad, La Jolla, CA, United States) and SPSS 17.0.
3 Results
3.1 DNA sequence and microbial diversity index analysis
The number of Amplicon Sequence Variants (ASVs) was 4172, 3366, and 2242 in the CON, SAL, and ABX groups, respectively (Supplementary Figure S2A). The average number of ASVs in each group was 695, 561, and 374, respectively (n = 6). The Good’s coverage index values of all samples in the CON, SAL, and ABX groups exceeded 99% (Supplementary Figure S2B), which indicates that this sequencing result was representative of the real situation of the samples. When the number of valid sequences exceeded 40,000, the dilution curve (rarefaction curve) tended to flatten, indicating that the amount of sequencing data was saturated and that the depth and quantity of sequencing met the requirements for analysis (Supplementary Figure S2C). In addition, the rank abundance curves for each group of samples had a large span in the horizontal direction. They were relatively flat in the vertical direction, indicating good species richness and good homogeneity of the samples (Supplementary Figure S2D). The above results suggest that the quality of the sequencing data obtained in this study was reliable and sufficient, and the results are authentic.
The results of the α-diversity analysis showed that the Shannon, Simpson, and Chao1 indices were lower in the SAL and ABX groups than in the CON group (Figures 2A–C). The principal coordinate analysis (PCoA) results among the three groups showed that the groups were distinct (P < 0.001) from each other and that there were differences in the structure of colony composition between the groups (Figure 2D).
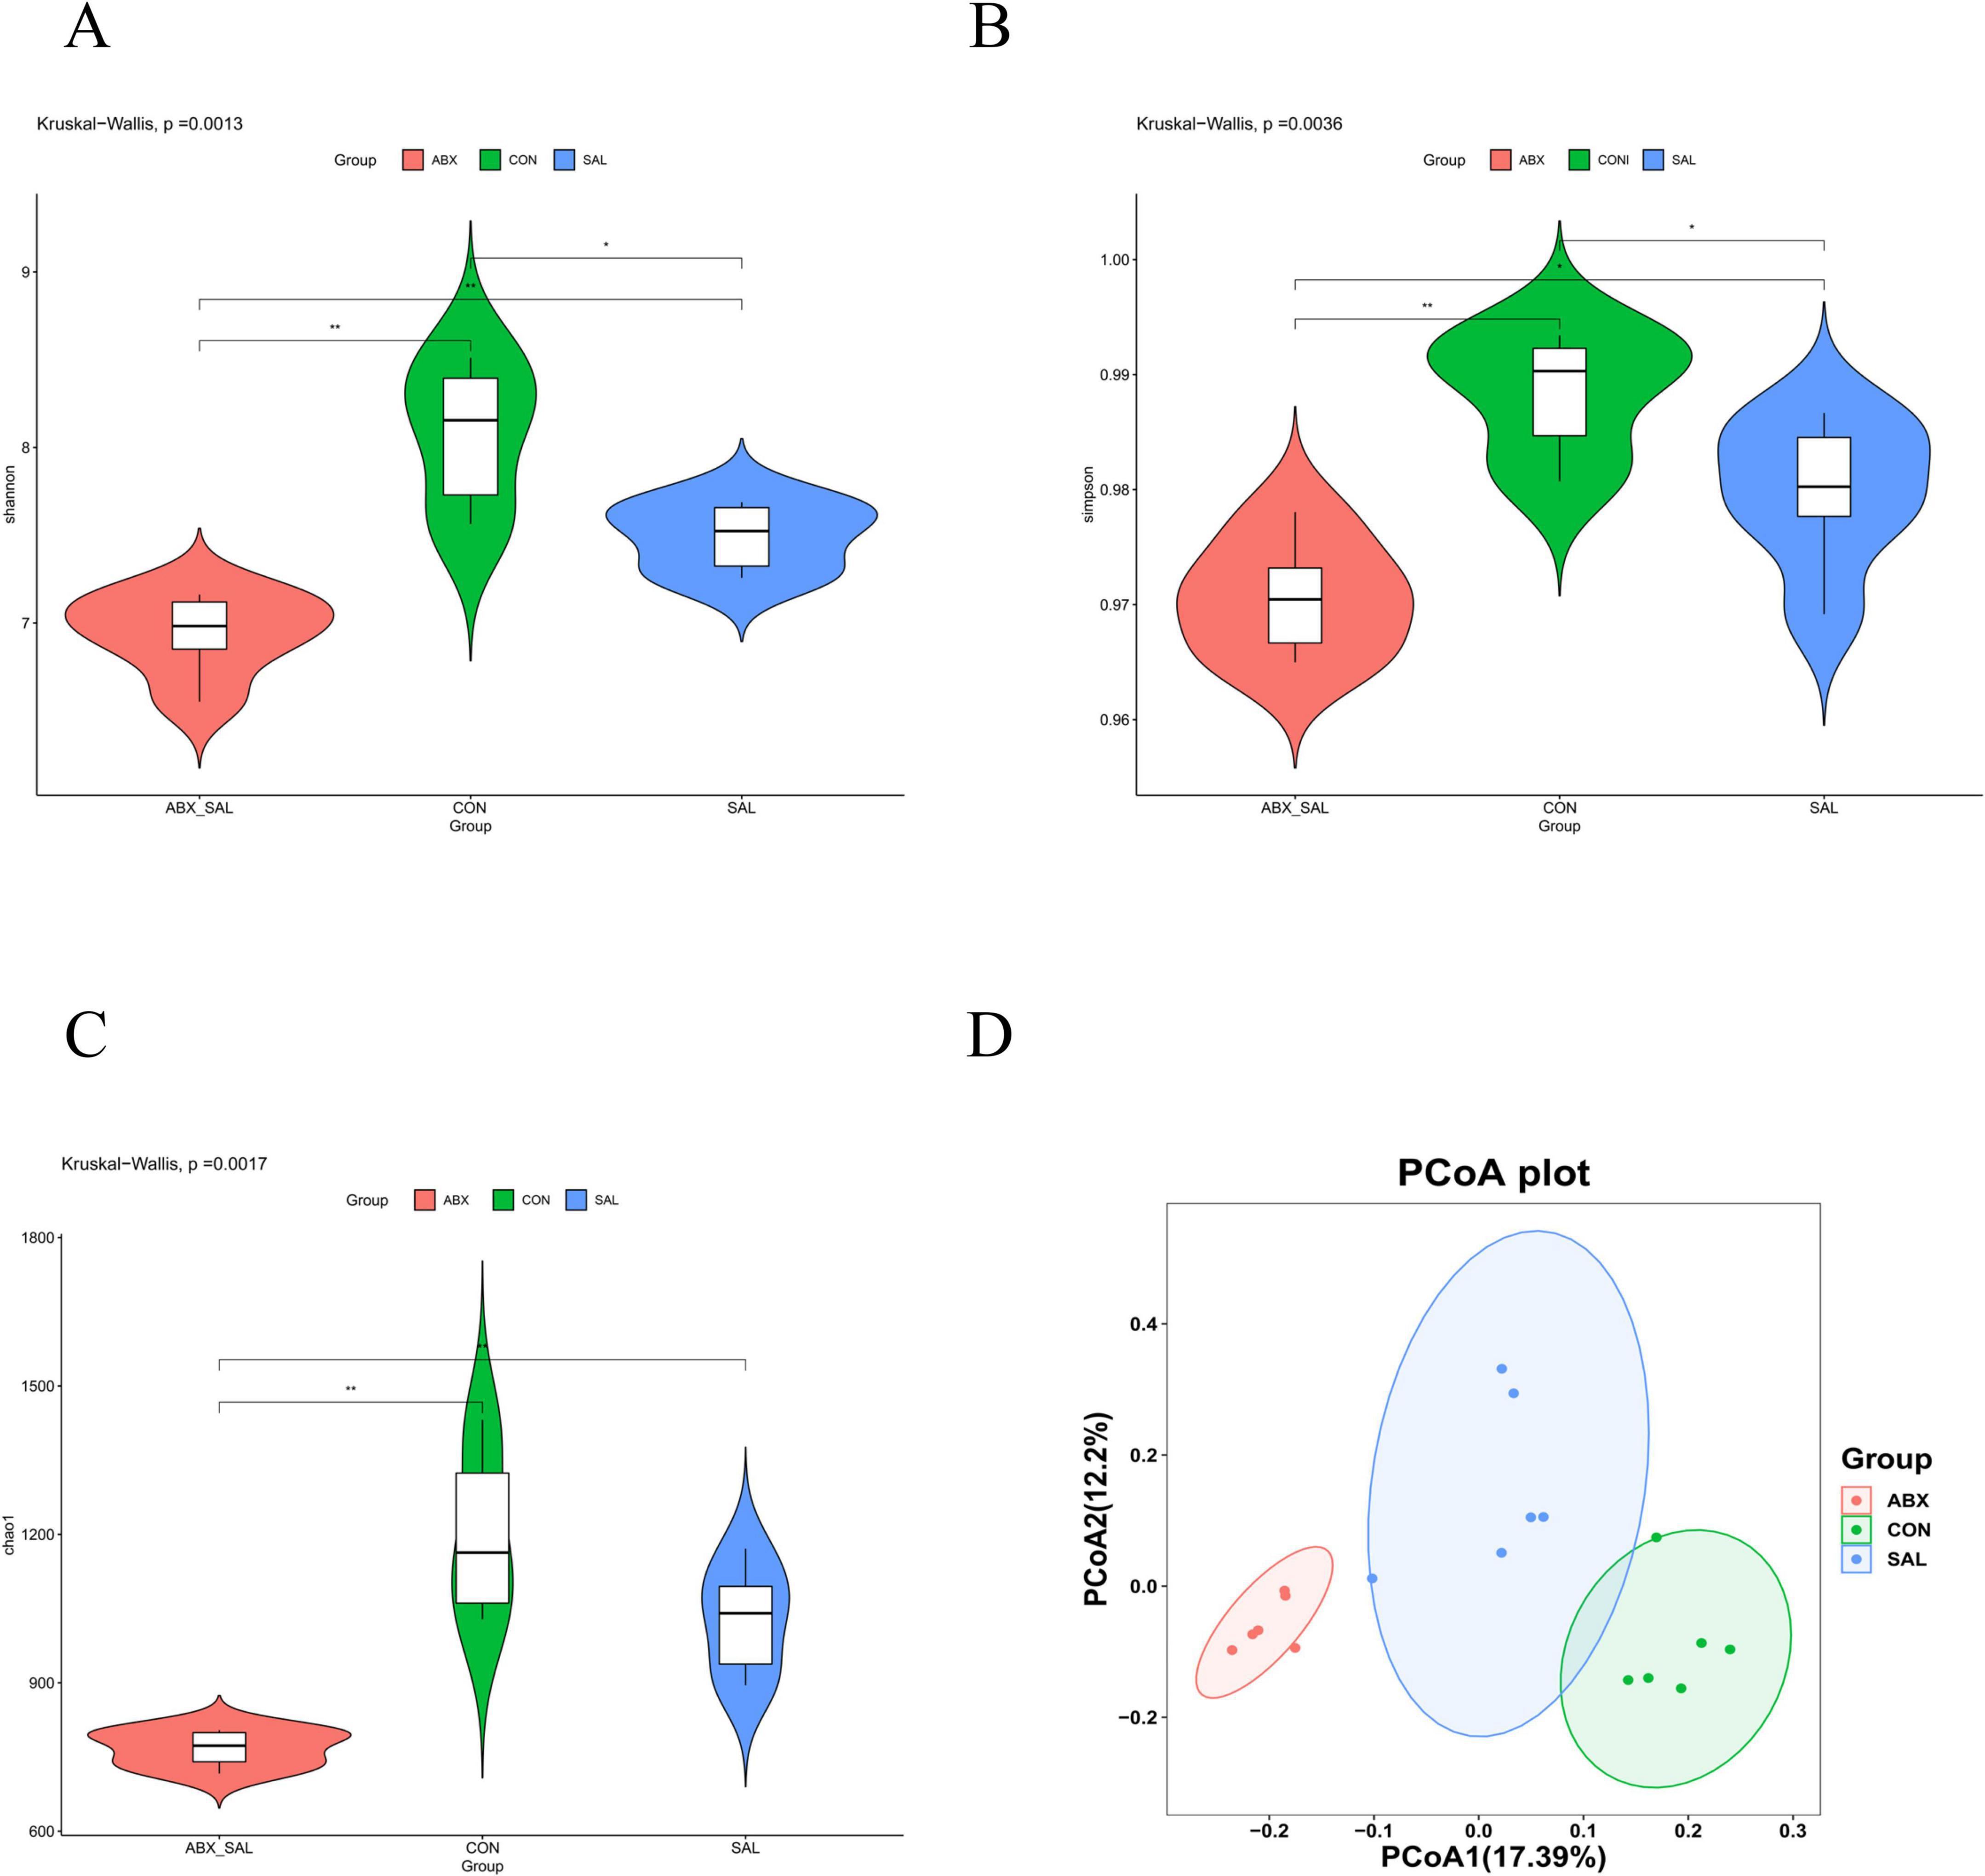
Figure 2. Results of difference analysis of cecum microbial communities between groups. (A) Shannon index. (B) Simpson’s index (C) Chao 1 index. (D) PCoA analysis results. Different colors represent different groups. The closer the samples are, the more similar the microbial composition is between the samples.
3.2 Analysis of the composition of the intestinal microbial community
At the phylum level (Figures 3A,B), the relative abundance of Cyanobacteria (0.11%) and Planctomycetota (0.002%) decreased (P < 0.05), while the relative abundance of Bacteroidota (28.61%) and Desulfobacterota (1.04%) increased (P < 0.05) in the SAL group compared to the CON group. Relative abundance of Proteobacteria (2.12%), Actinobacteria (1.45%), and Cyanobacteria (0.06%) decreased (P < 0.05), while the relative abundance of Desulfobacterota (2.51%) increased (P < 0.05) in the ABX group compared to the CON group. For information on the abundance of the top 30 species at the level of phylum, order, family, and genus, refer to Supplementary Table S7. For information on differential species at the phylum and genus levels, refer to Supplementary Table S8.
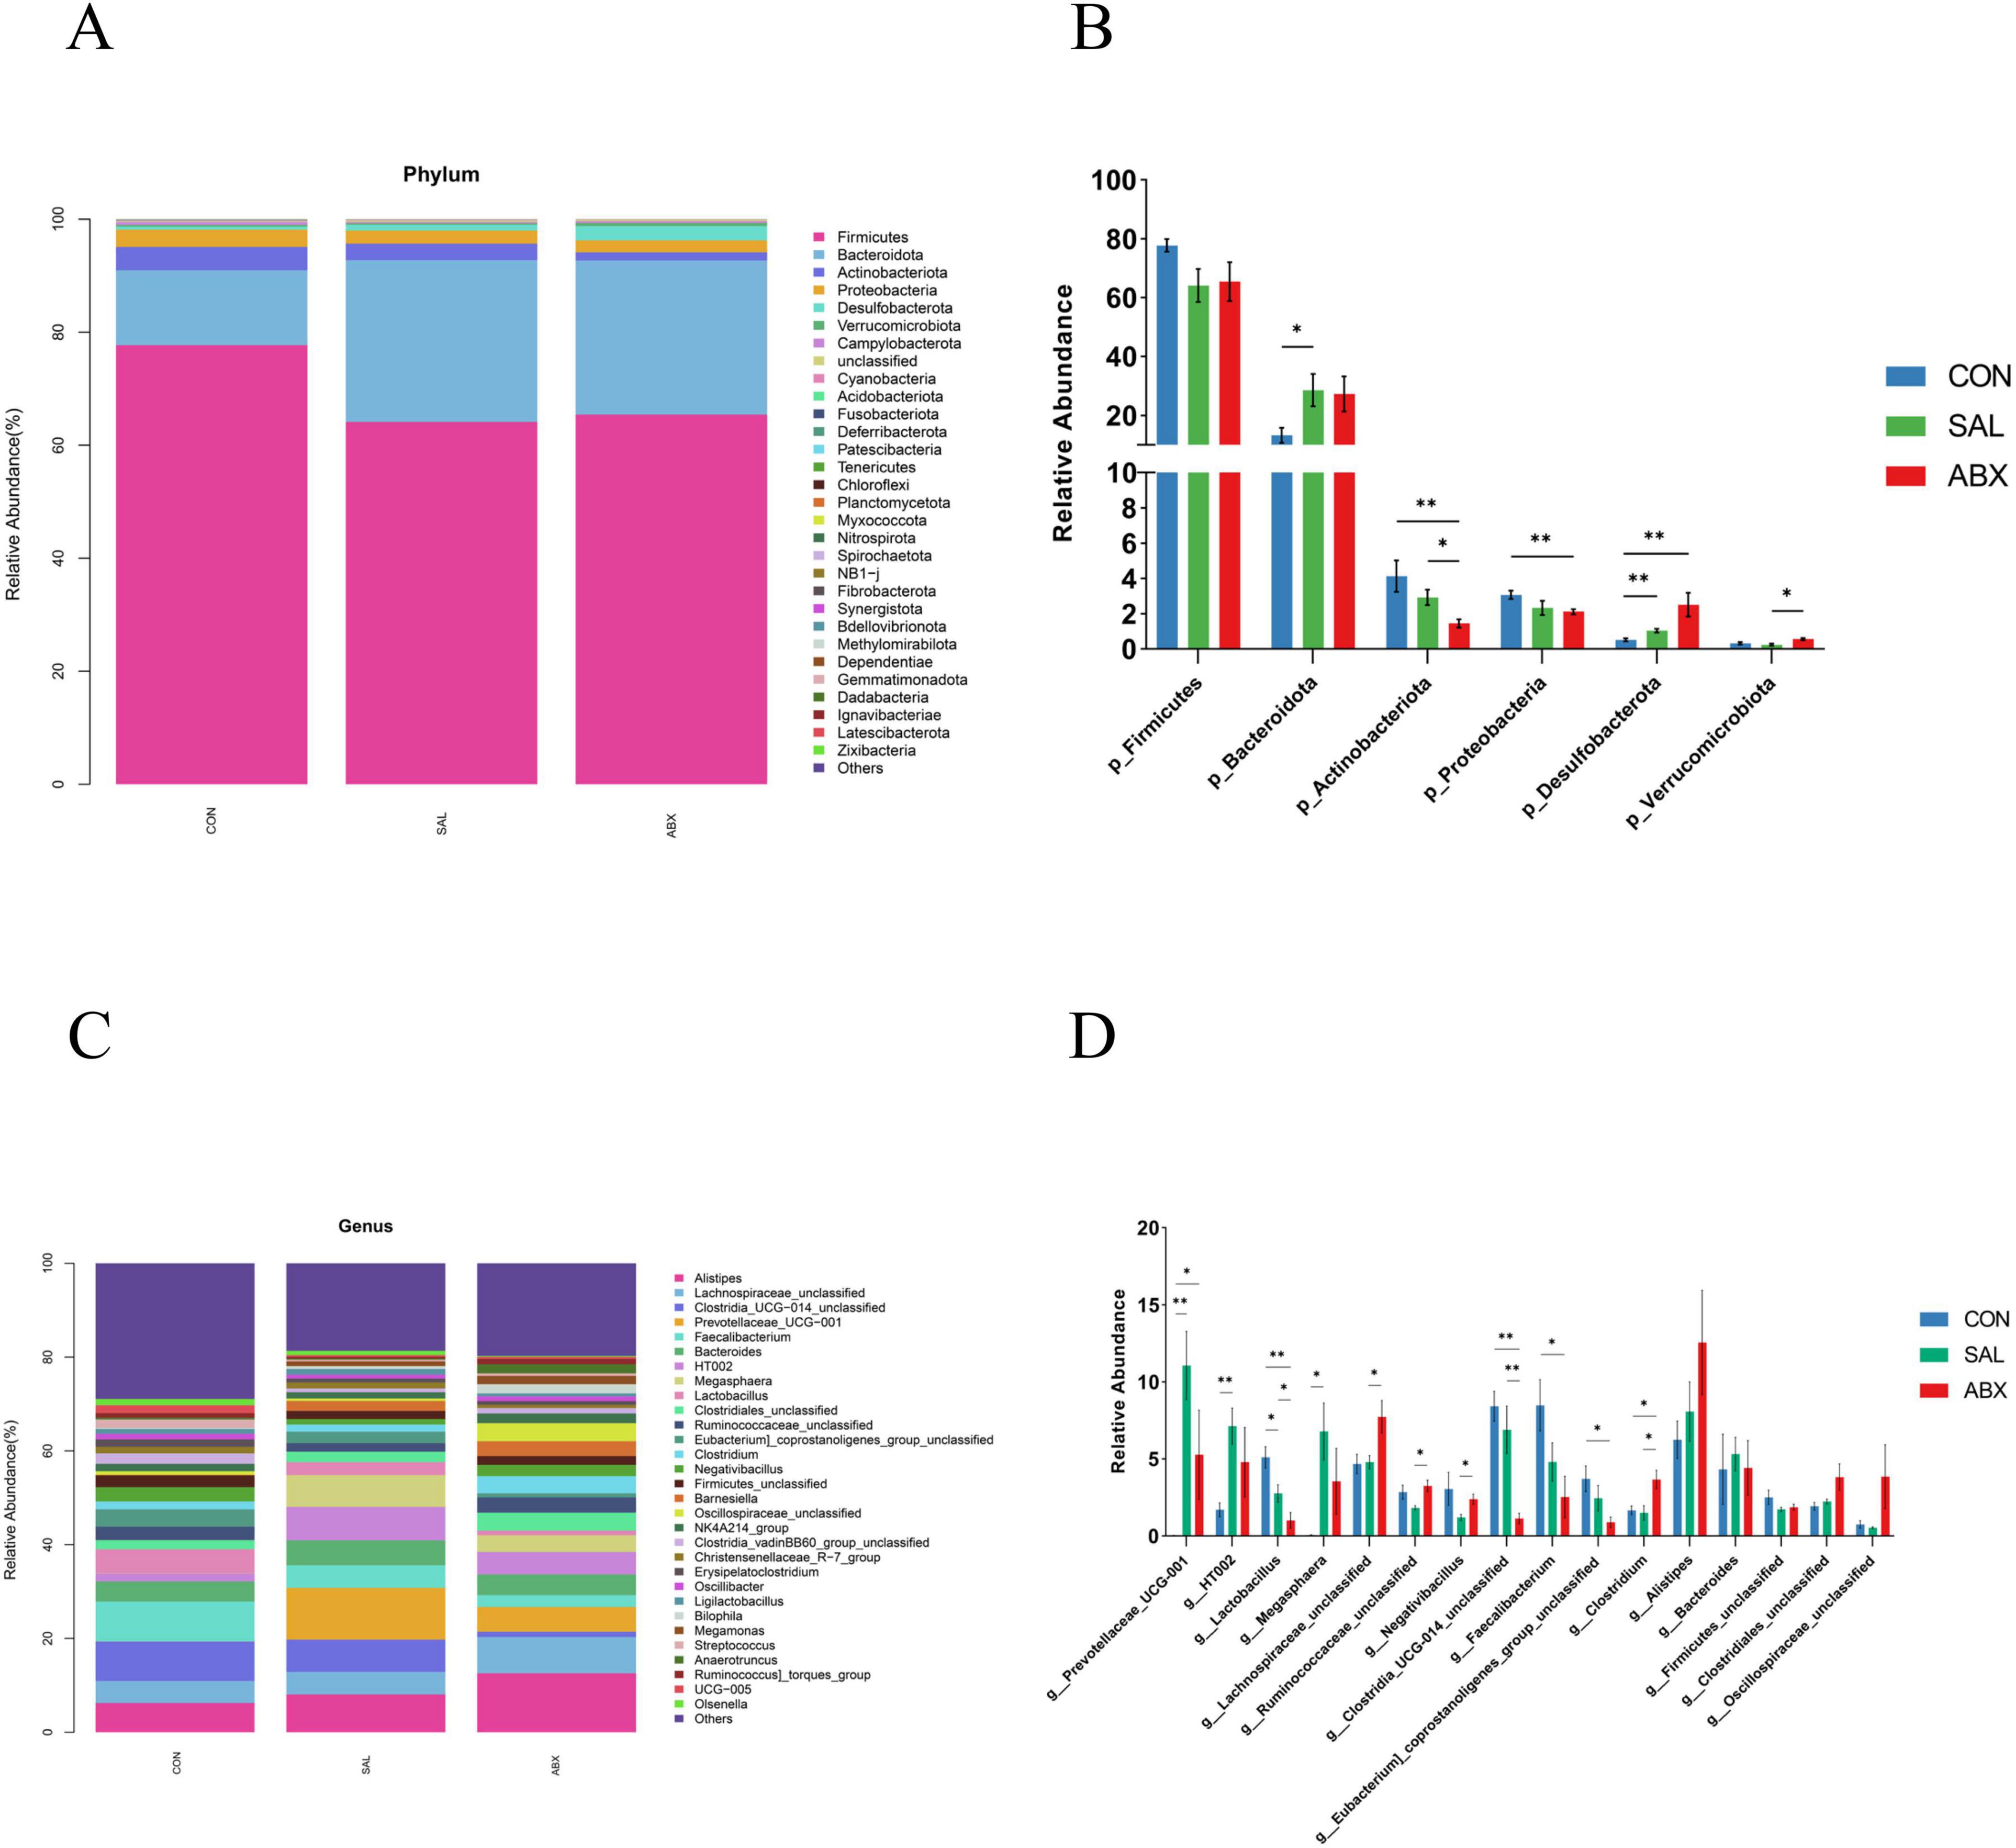
Figure 3. Taxonomic distribution of the CON, SAL, and ABX groups. (A) At the phylum level (top 30). (B) Differences in the partially dominant bacterial flora at the phylum level among the groups. (C) At the genus level (top 30). (D) Differences in the partially dominant bacterial flora at the genus level among the groups. “*” indicates a significant difference in statistics (*P < 0.05, **P < 0.01, and ***P < 0.001).
At the genus level (Figures 3C,D), the relative abundance of 26 genera significantly increased and 40 genera significantly decreased in the SAL group compared to the CON group. The relative abundance of 24 genera significantly increased and 79 genera significantly decreased in the ABX group compared to the CON group. The relative abundance of 26 genera significantly increased and 35 genera significantly decreased in the ABX group compared to the SAL group. Compared to the CON group, 9 identical genera had significantly higher relative abundance in both the SAL and ABX groups, accounting for 34.62% of the SAL group and 37.50% of the ABX group, respectively. Compared to the CON group, 25 identical genera had significantly lower relative abundance in both the SAL and ABX groups, accounting for 62.50% of the SAL group and 31.65% of the ABX group, respectively.
The linear discriminant analysis (LDA) showed that three phyla (e.g., Actinobacteriota, Bacteroidota, and Desulfobacterota) and nine genera (e.g., Clostridia_UCG_014_unclassified, Faecalibacterium, Lactobacillus, Eubacterium_coprostanoligenes_group_unclassified, Prevotellaceae_UCG_001, Megasphaera, HT002, Barnesiella, and Clostridium) were significantly different between groups (P < 0.05) (Supplementary Figure S3). The phylum Bacteroidota and the genus Prevotellaceae_UCG_001 had the highest LDA scores at the phylum and genus level, respectively, suggesting that they had a greater influence on the differences between groups.
3.3 Salmonella Typhimurium infection affects polyunsaturated fatty acid metabolism in intestinal tissues
A total of 130 oxidized lipid metabolites were detected from 18 cecum tissue samples, and 71 metabolites were retained after preprocessing (Supplementary Table S9). These included thirty-seven mid-ARA metabolites, eight docosahexaenoic acid (DHA) metabolites, eight linoleic acid (LA) metabolites, five dihomo-γ-linolenic acid (DGLA) metabolites, five eicosapentaenoic acid (EPA) metabolites, two α-linolenic acid (ALA) metabolites, one docosatetraenoic acid (DTA) metabolite, and one gamma-linolenic acid (GLA) metabolite.
The results of principal component analysis (PCA) for the 71 metabolites showed that the samples from the ABX and SAL groups were distinct from the samples from the CON group, and the samples from the ABX and SAL groups were not completely separated (Figure 4; Supplementary Figure S4). The multiplicity of differences between the top 20 metabolites that were increased and the top 20 metabolites that were decreased in each comparison group (SAL vs. CON, ABX vs. CON, and ABX vs. SAL) are shown in Figures 5A–C. The Z-score for each comparison group is shown in Supplementary Figure S5. The results of the cluster analysis of metabolites in each group are shown in Supplementary Figure S6. The above results visually indicated that the content of multiple oxidized lipid metabolites was altered in the cecum tissues of the SAL group.
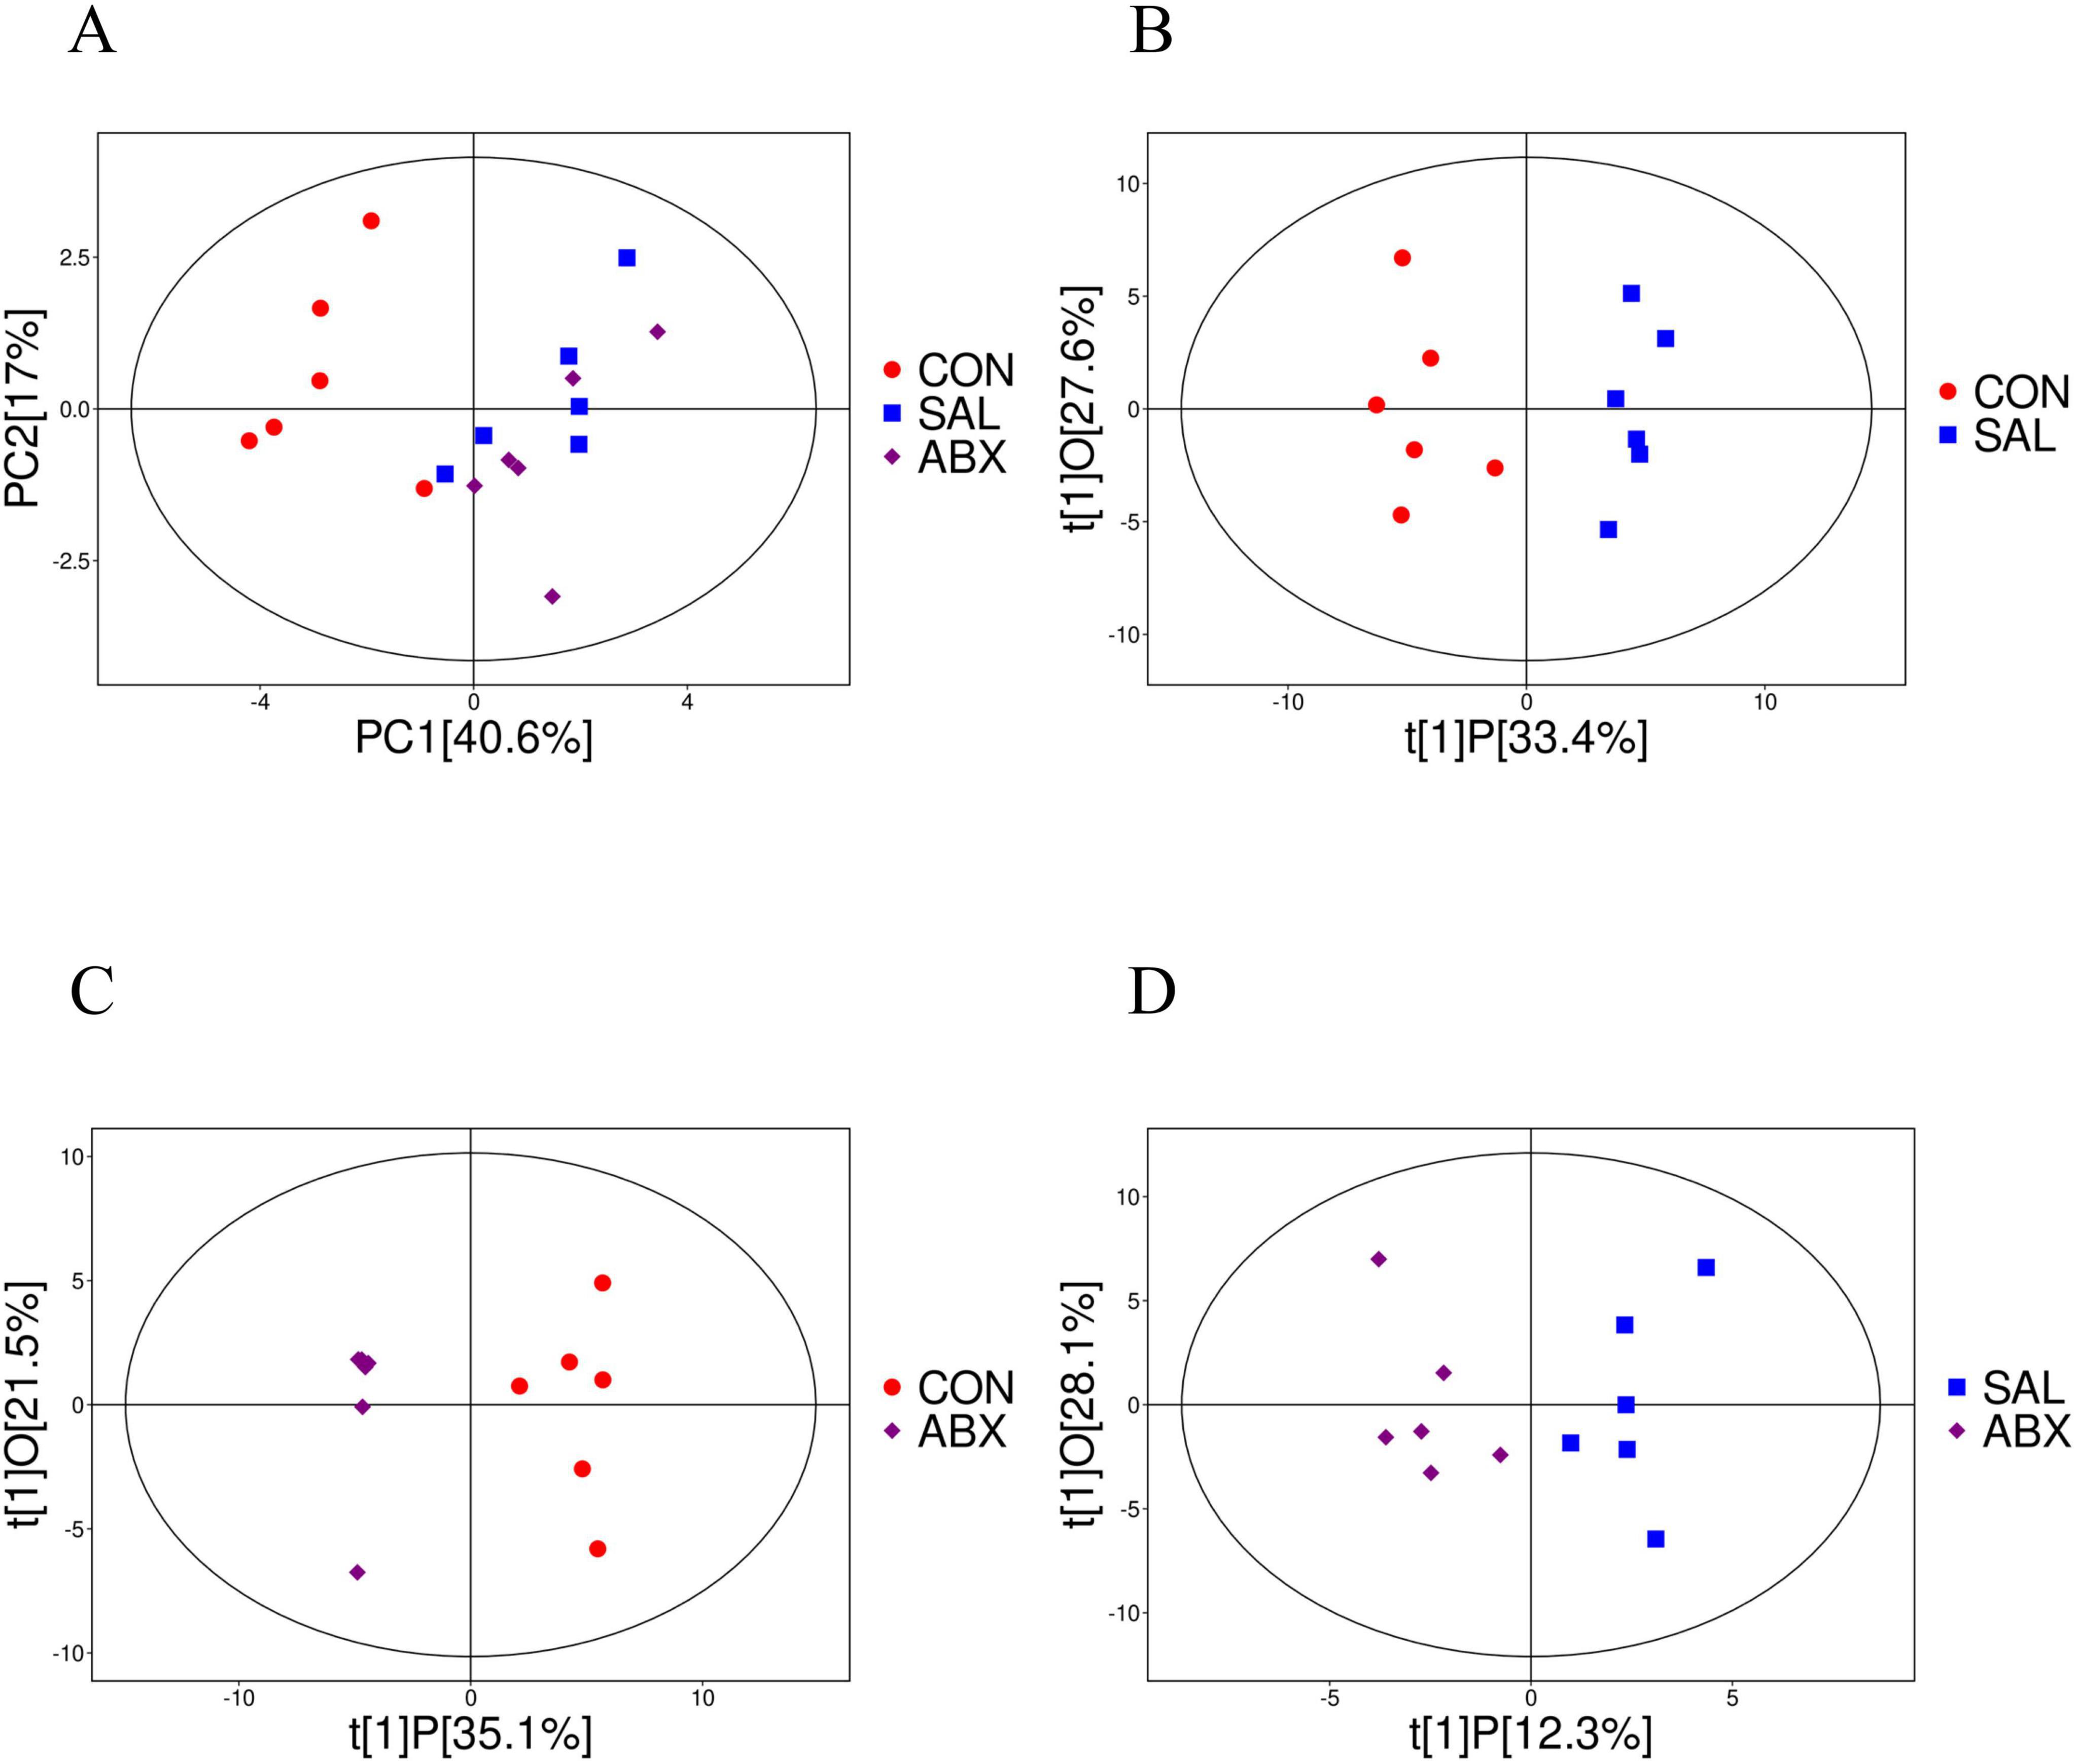
Figure 4. Analysis of PCoA and OPLS-DA between the CON, SAL, and ABX groups. (A) Scatterplot of principal component analysis (PCA) scores for the full sample in each group. (B–D) Scatterplot of OPLS-DA model scores between groups. The horizontal coordinate represents the predicted principal component scores of the first principal component, demonstrating the differences between sample groups, whereas the vertical coordinate represents the orthogonal principal component scores, demonstrating the differences within the sample groups, where each scatter represents one sample and the scatter shapes and colors indicate the different experimental groups.
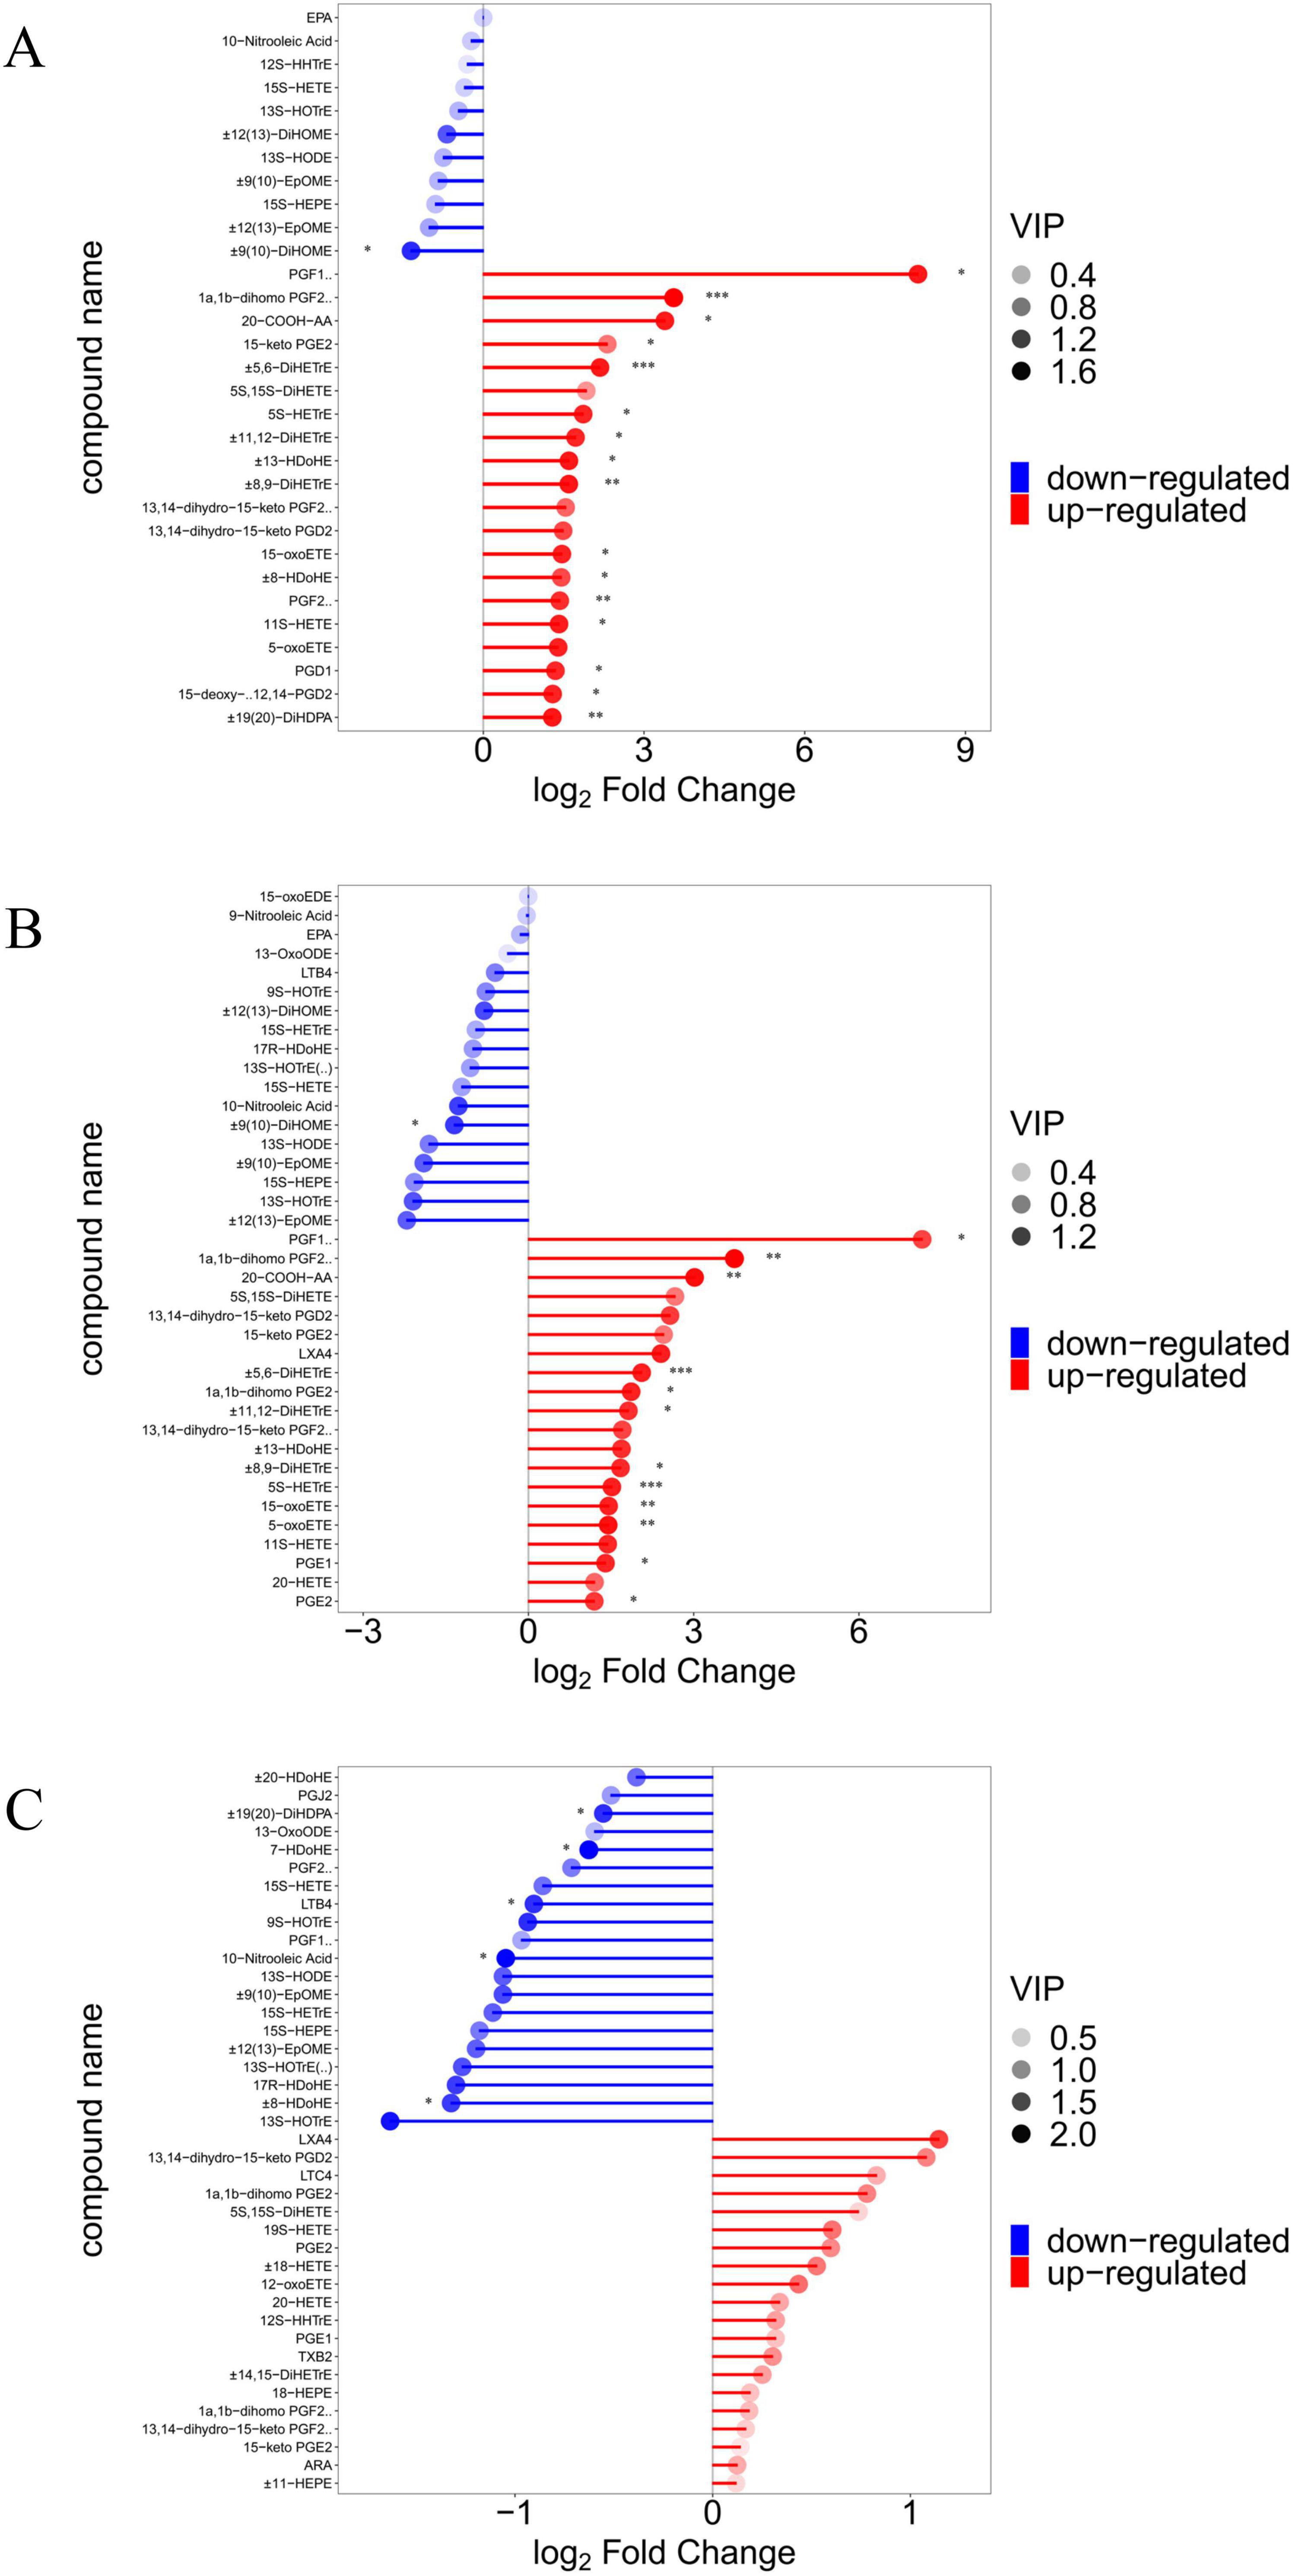
Figure 5. Demonstration of differences in oxygenated lipid metabolites between groups. (A–C) Matchstick analysis for three comparison groups (SAL vs. CON, ABX vs. CON, and ABX vs. SAL). Horizontal coordinates show logarithmically converted multiples of change, with point color shades representing the size of the variable importance in the projection (VIP) value. “*” indicates a significant difference in statistics (*P < 0.05, **P < 0.01, and ***P < 0.001).
3.4 Overall enhancement of arachidonic acid metabolism in chicken cecum tissue caused by Salmonella Typhimurium infection
In this experiment, the groups were screened for differential metabolites with a p-value of less than 0.05 (Supplementary Table S10). The results showed that 26 metabolites were significantly higher (P < 0.05) and one significantly lower ( ± 9(10)-DiHOME) in the SAL group compared to the CON group (P < 0.05), for a total of 27 metabolites that were significantly changed. These included fifteen ARA metabolites, three DGLA metabolites, six DHA metabolites, one LA metabolite, and one DTA metabolite. Of the fifteen ARA differential metabolites in the SAL group, two were COX metabolic pathway products (e.g., PGF2α and 15-keto-PGE2), two belonged to the LOX pathway (e.g., LXA4 and 15-OxoETE), and six belonged to the CYP metabolic pathway (e.g., ± 11(12)-EET, ± 8(9)-EET, ± 14,15-DiHETrE, ± 11,12-DiHETrE, ± 8,9-DiHETrE, and ± 5,6-DiHETrE). The results are displayed in the Kyoto Encyclopedia of Genes and Genomes (KEGG) pathway enrichment analysis plot (Supplementary Figure S7A).
There were 22 metabolites with significantly higher levels (P < 0.05) and one with a significantly lower level ( ± 9(10)-DiHOME) in the ABX group compared to the CON group (P < 0.05), for a total of 23 metabolites that were significantly changed. These included 15 ARA metabolites, three DGLA metabolites, one DHA, one LA metabolite, and one DTA metabolite. Of the 15 ARA differential metabolites in the ABX group, one was a product of the COX metabolic pathway product (e.g., PGE2), three belonged to the LOX pathway (e.g., 5S-HETE, 5-oxoETE, and 15-OxoETE), and six belonged to the CYP metabolic pathway (e.g., ± 11(12)-EET, ± 8(9)-EET, ± 14,15-DiHETrE, ± 11,12-DiHETrE, ± 8,9-DiHETrE, and ± 5,6-DiHETrE). The results are displayed in the KEGG pathway enrichment analysis (Supplementary Figure S7B). Fifteen of the differential metabolites were found to be identical in the SAL and ABX groups, accounting for 55.56 and 68.2% of these groups, respectively. Differences in ARA metabolites between groups are presented as bar graphs (Figure 6).
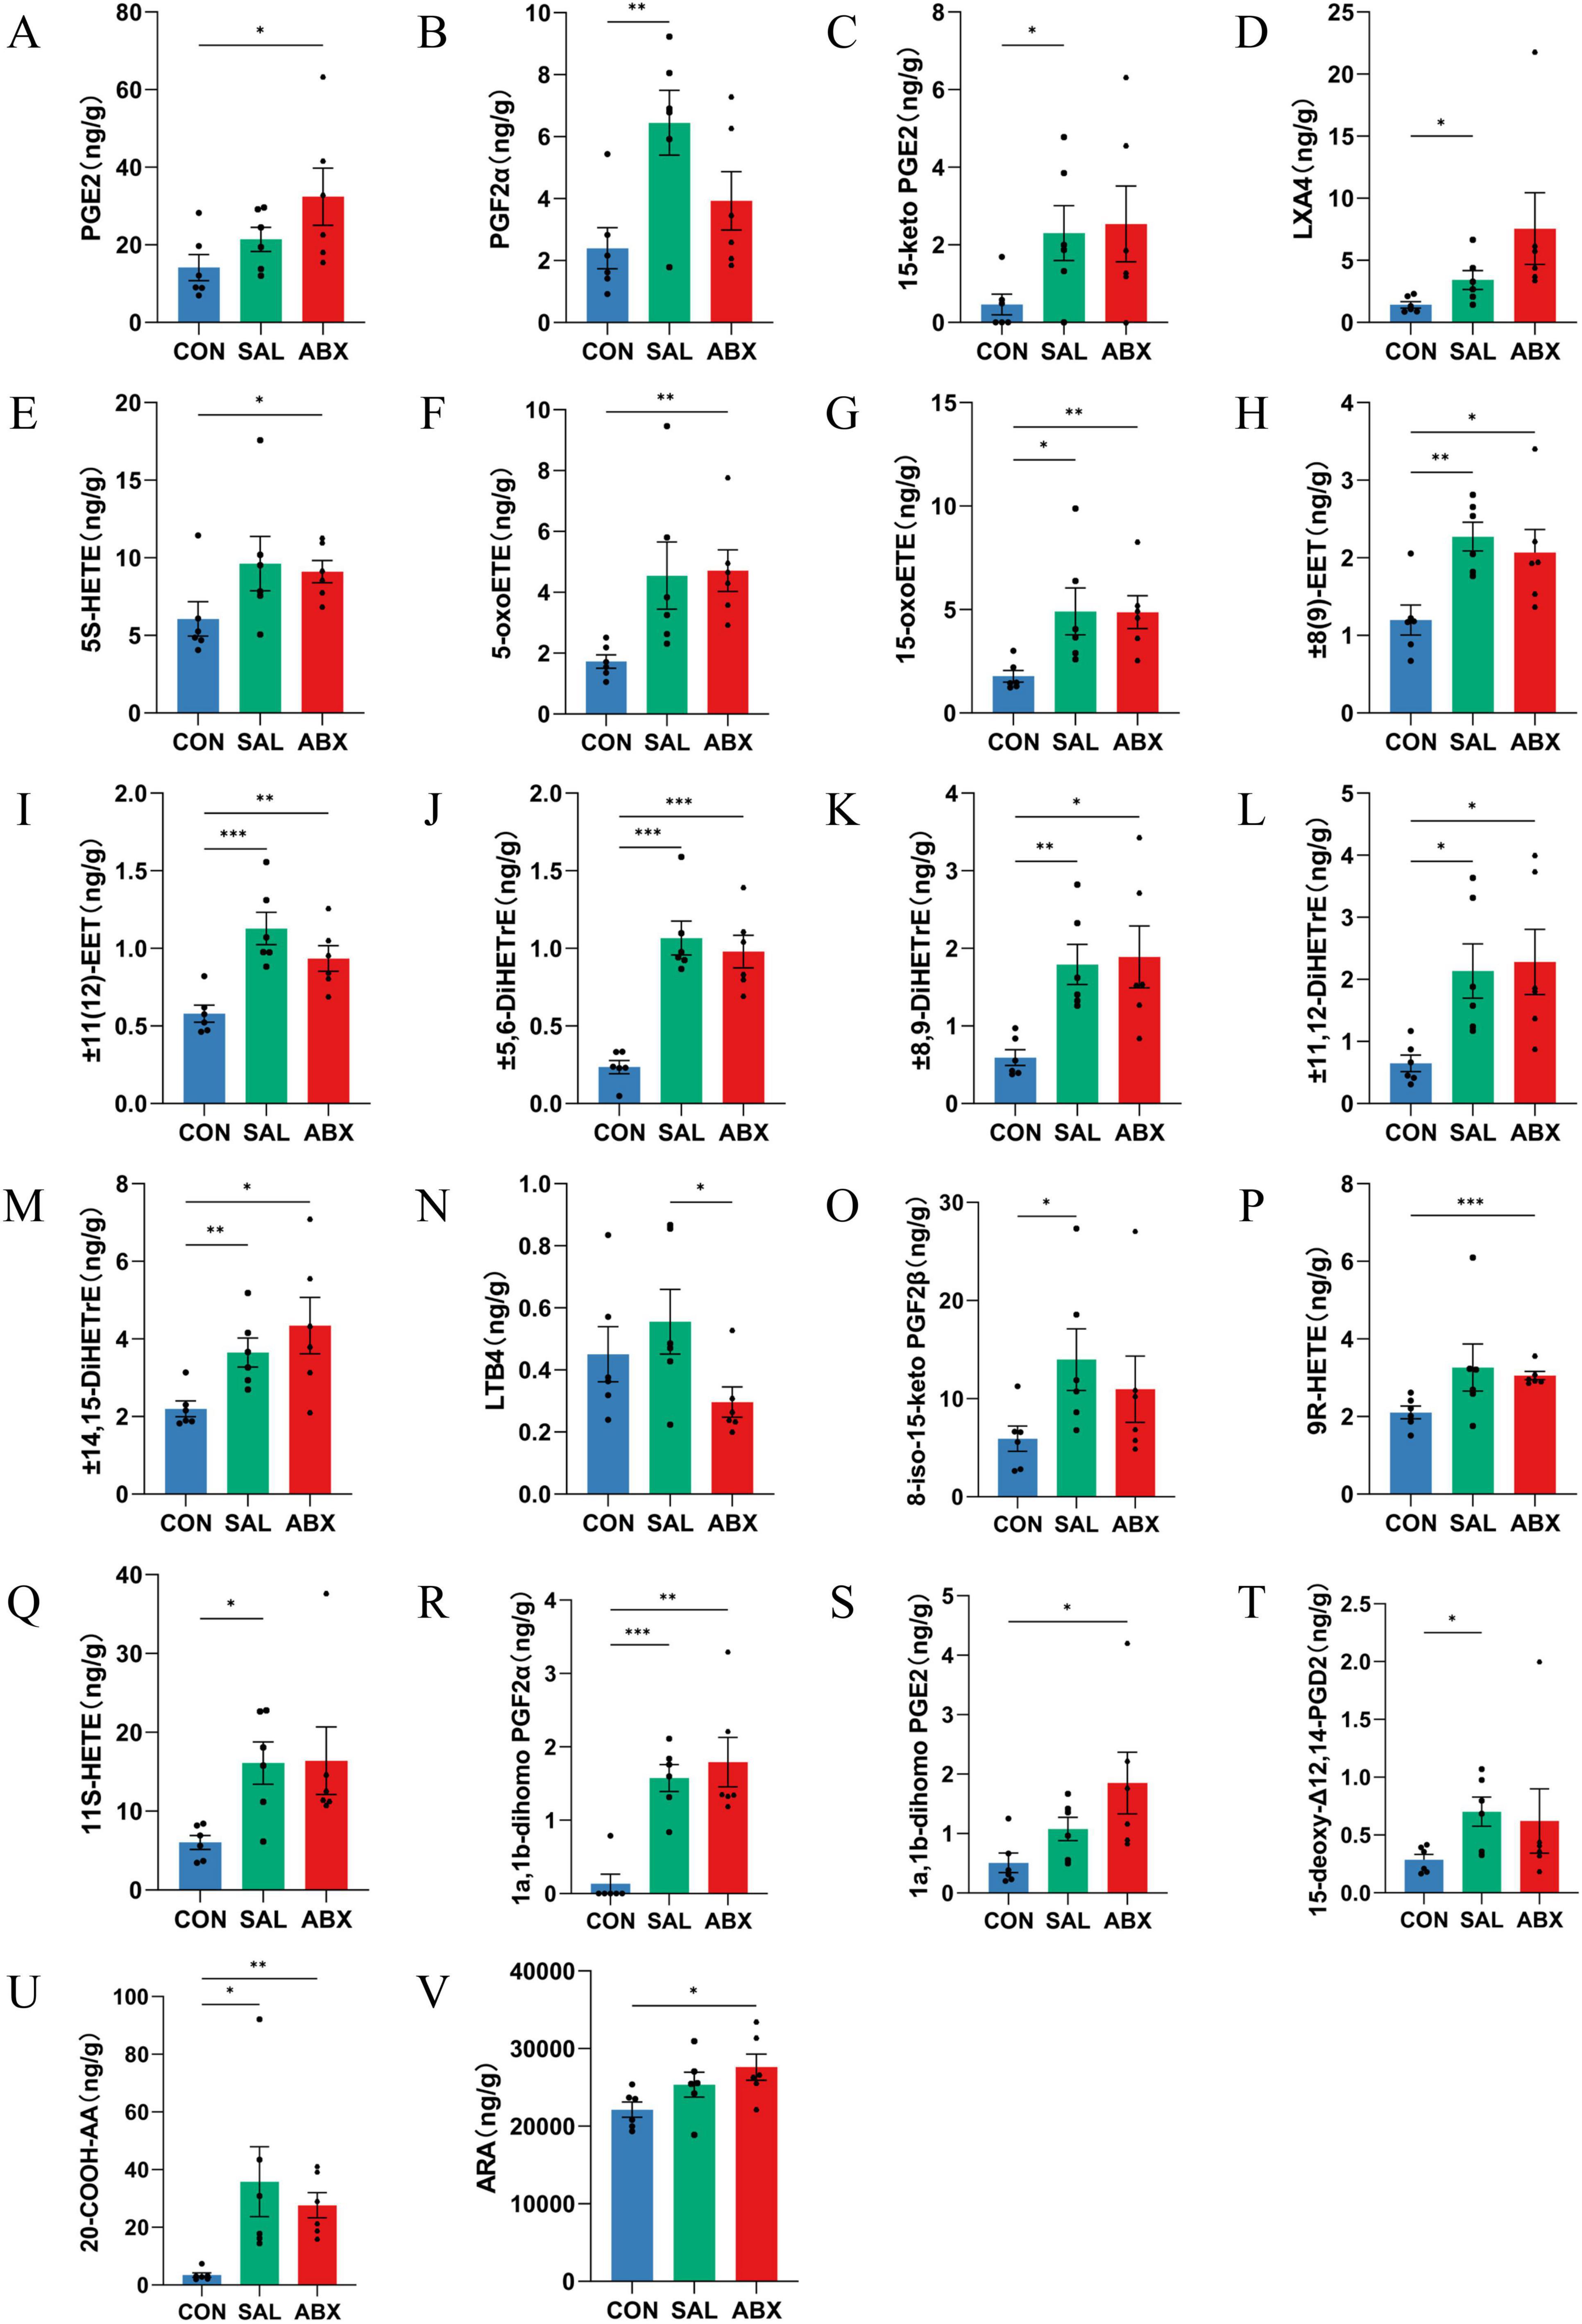
Figure 6. Analysis of between-group differences in ARA metabolites. (A–V) Metabolites of ARA. “*” indicates a significant difference in statistics (*P < 0.05, **P < 0.01, and ***P < 0.001).
3.5 Spearman analysis results between oxidized lipid metabolites, intestinal flora, and inflammatory factors
The relative mRNA levels of IL-4 and transforming growth factor-beta 1 (TGF-β1) were increased in the SAL group compared with the CON group (P < 0.05), and there was a trend toward higher levels of IL-6 (P > 0.05) (Supplementary Figure S8). Relative mRNA levels of interferon-gamma (IFN-γ), IL-4, TGF-β1, and IL-6 were increased (P < 0.05), and IL-2 levels were decreased (P < 0.05) in the ABX group compared with the CON group (Supplementary Figure S8). Tumor necrosis factor-alpha (TNF-α), IL-4, TGF-β1, IFN-γ, and IL-6 levels were higher (P < 0.05) in the ABX group than in the SAL group, and IL-2 and interleukin 1β (IL-1β) levels were lower (P < 0.05) in the ABX group than in the SAL group (Supplementary Figure S8). The results of the “Spearman” analysis between oxidized lipid metabolites, intestinal flora, and inflammatory factors are shown in Figure 7 and Supplementary Tables S11, S12.
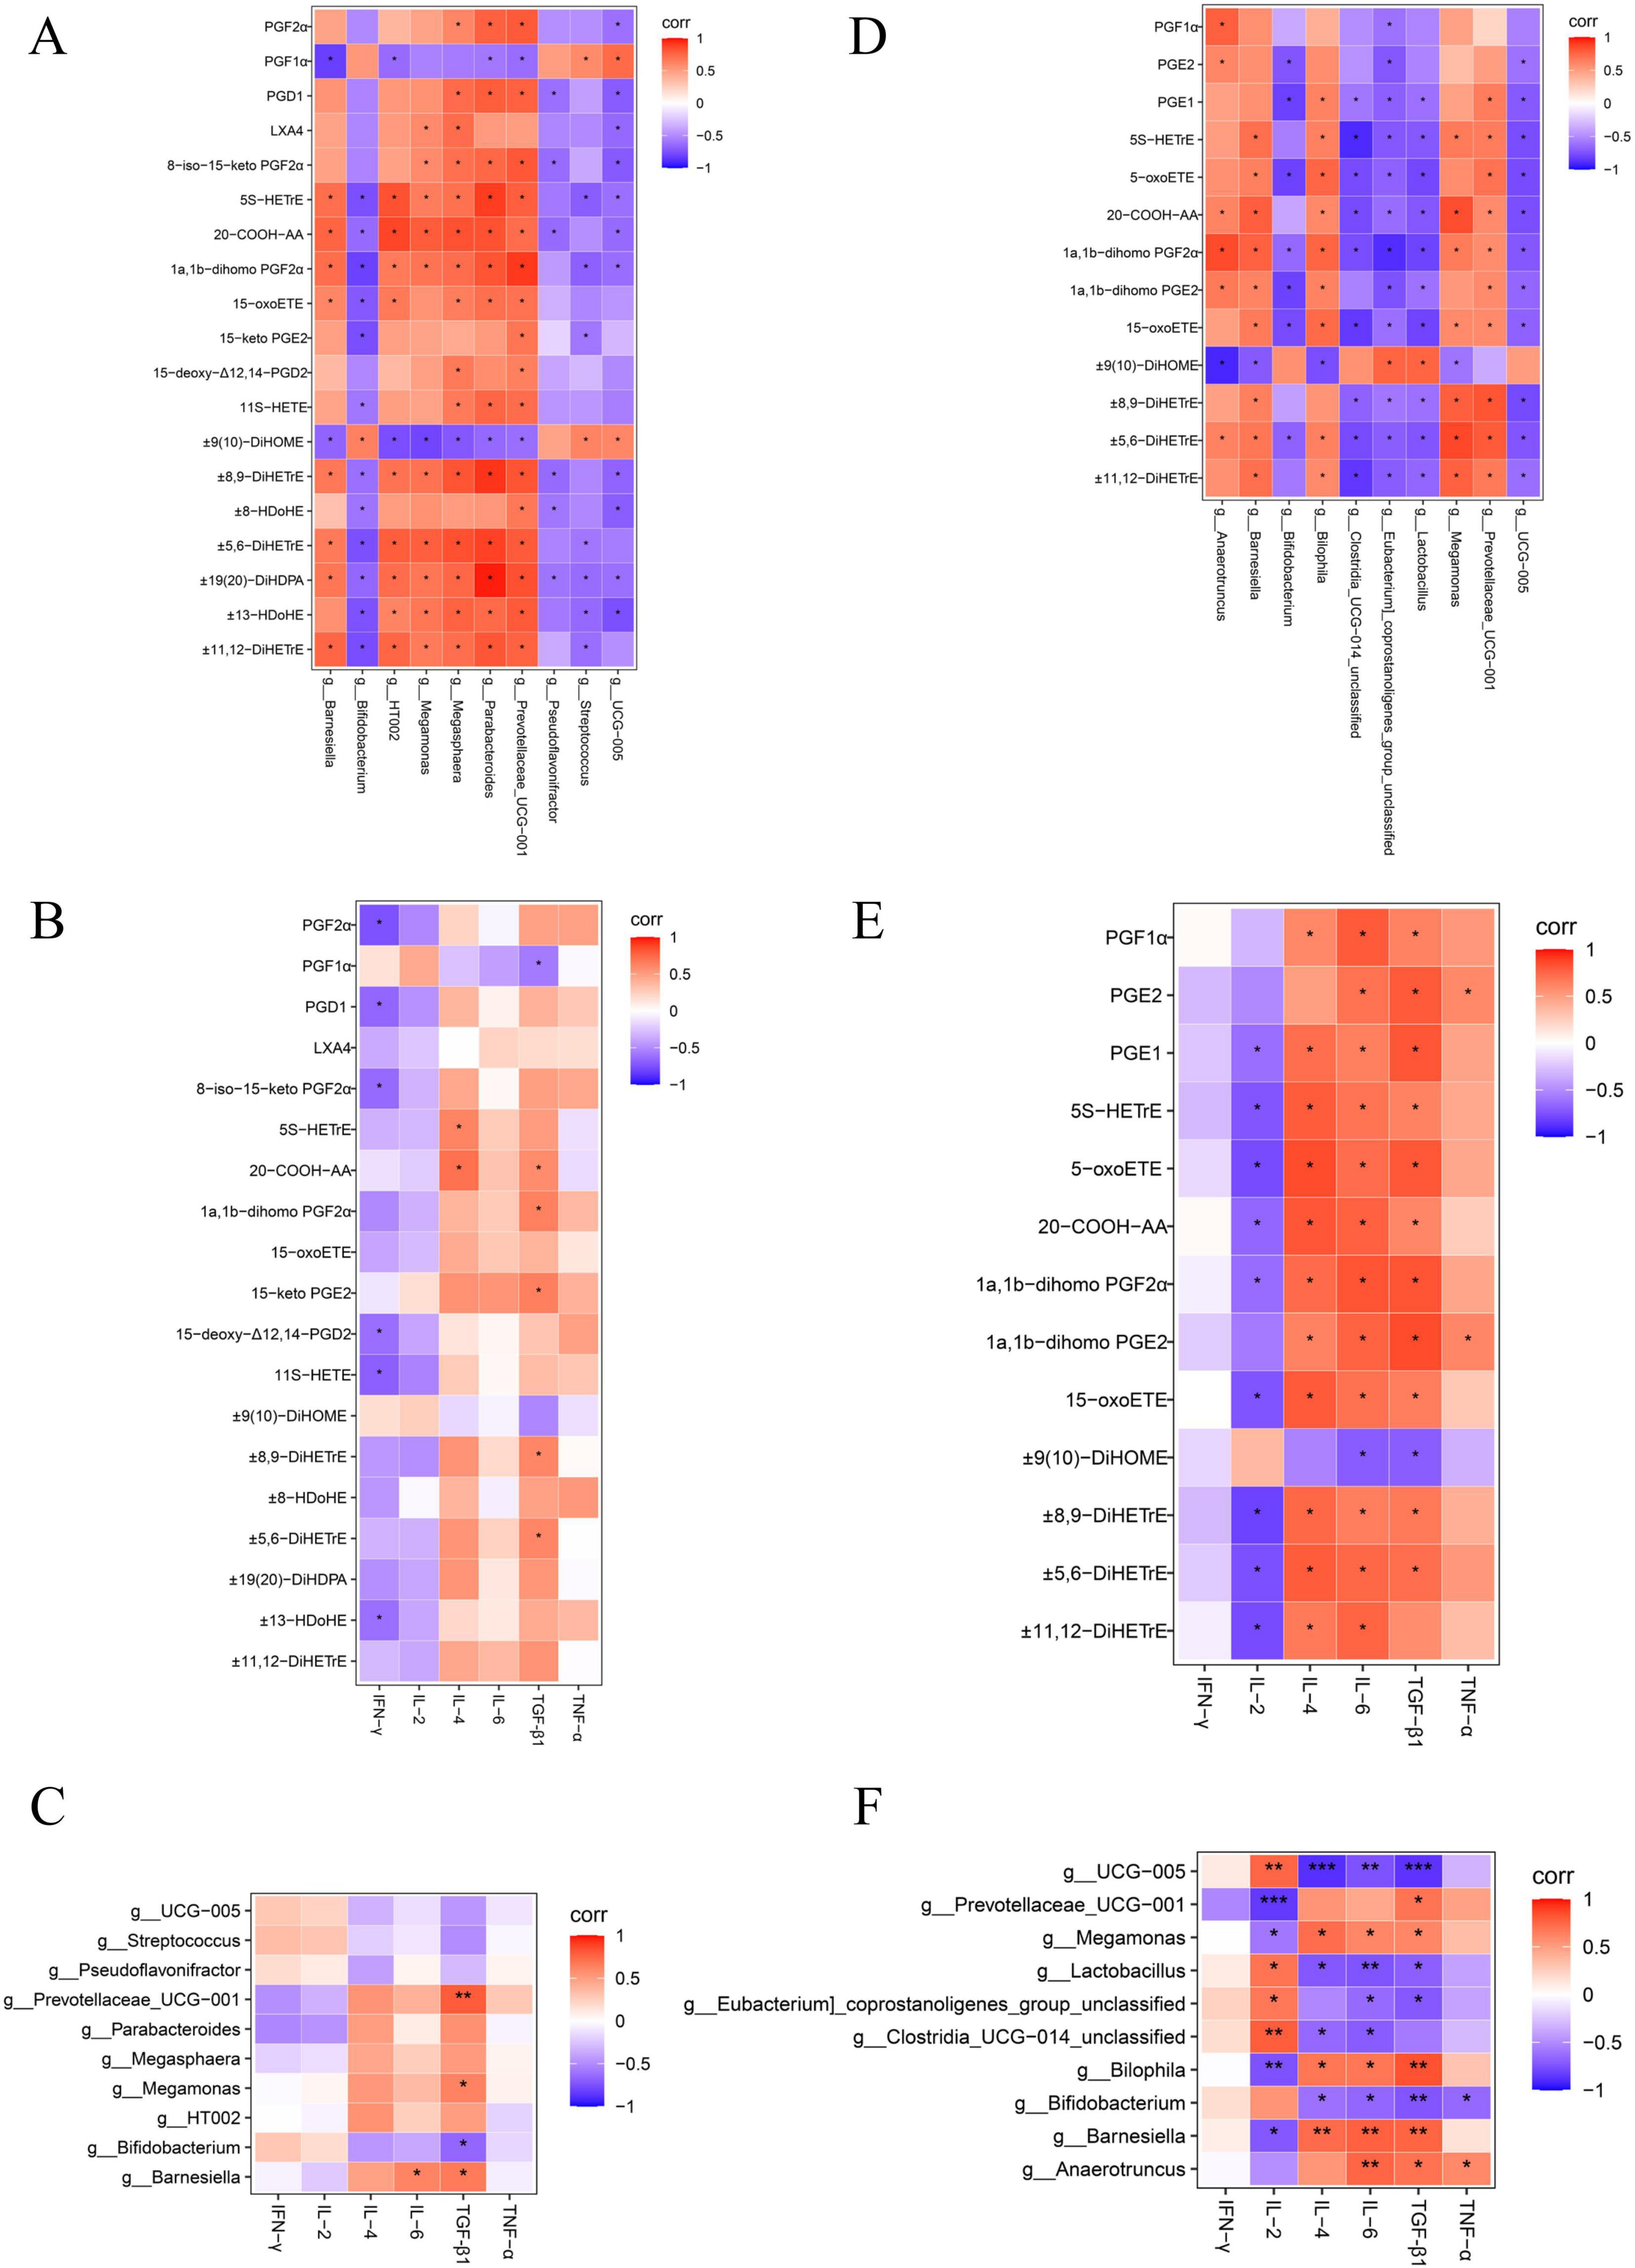
Figure 7. Heatmap of correlation coefficient matrix for the SAL and ABX groups. (A–C) Analysis of Spearman’s correlation between oxidized lipid metabolites, gut microbes, and inflammatory factors in the SAL group. (D–F) Analysis of Spearman’s correlation between oxidized lipid metabolites, gut microbes, and inflammatory factors in the ABX group. Red indicates a positive correlation, and purple indicates a negative correlation. “*” indicates a significant difference in statistics (*P < 0.05, **P < 0.01, and ***P < 0.001).
3.6 Salmonella Typhimurium infection activates the cyclooxygenase metabolic pathway of arachidonic acid
The results of cellular experiments showed that aspirin pretreatment did not significantly affect the relative expression levels of IL-1β, IL-6, and IL-10 mRNA in HD11 cells compared with the untreated group (Figures 8A–C). However, the iNOs were significantly increased in HD11 cells after treatment with 60 and 120 μg/mL aspirin and strengthened with the increase of aspirin concentration (Figure 8D). Compared to the untreated group, relative mRNA levels of IL-1β, IL-6, IL-10, and iNOs were increased in HD11 cells after S. Typhimurium infection (P < 0.001). Whereas aspirin pretreatment reduced this effect in a dose-dependent manner. The results of cellular experimental modeling and drug concentration screening are shown in Supplementary Figures S9, S10.
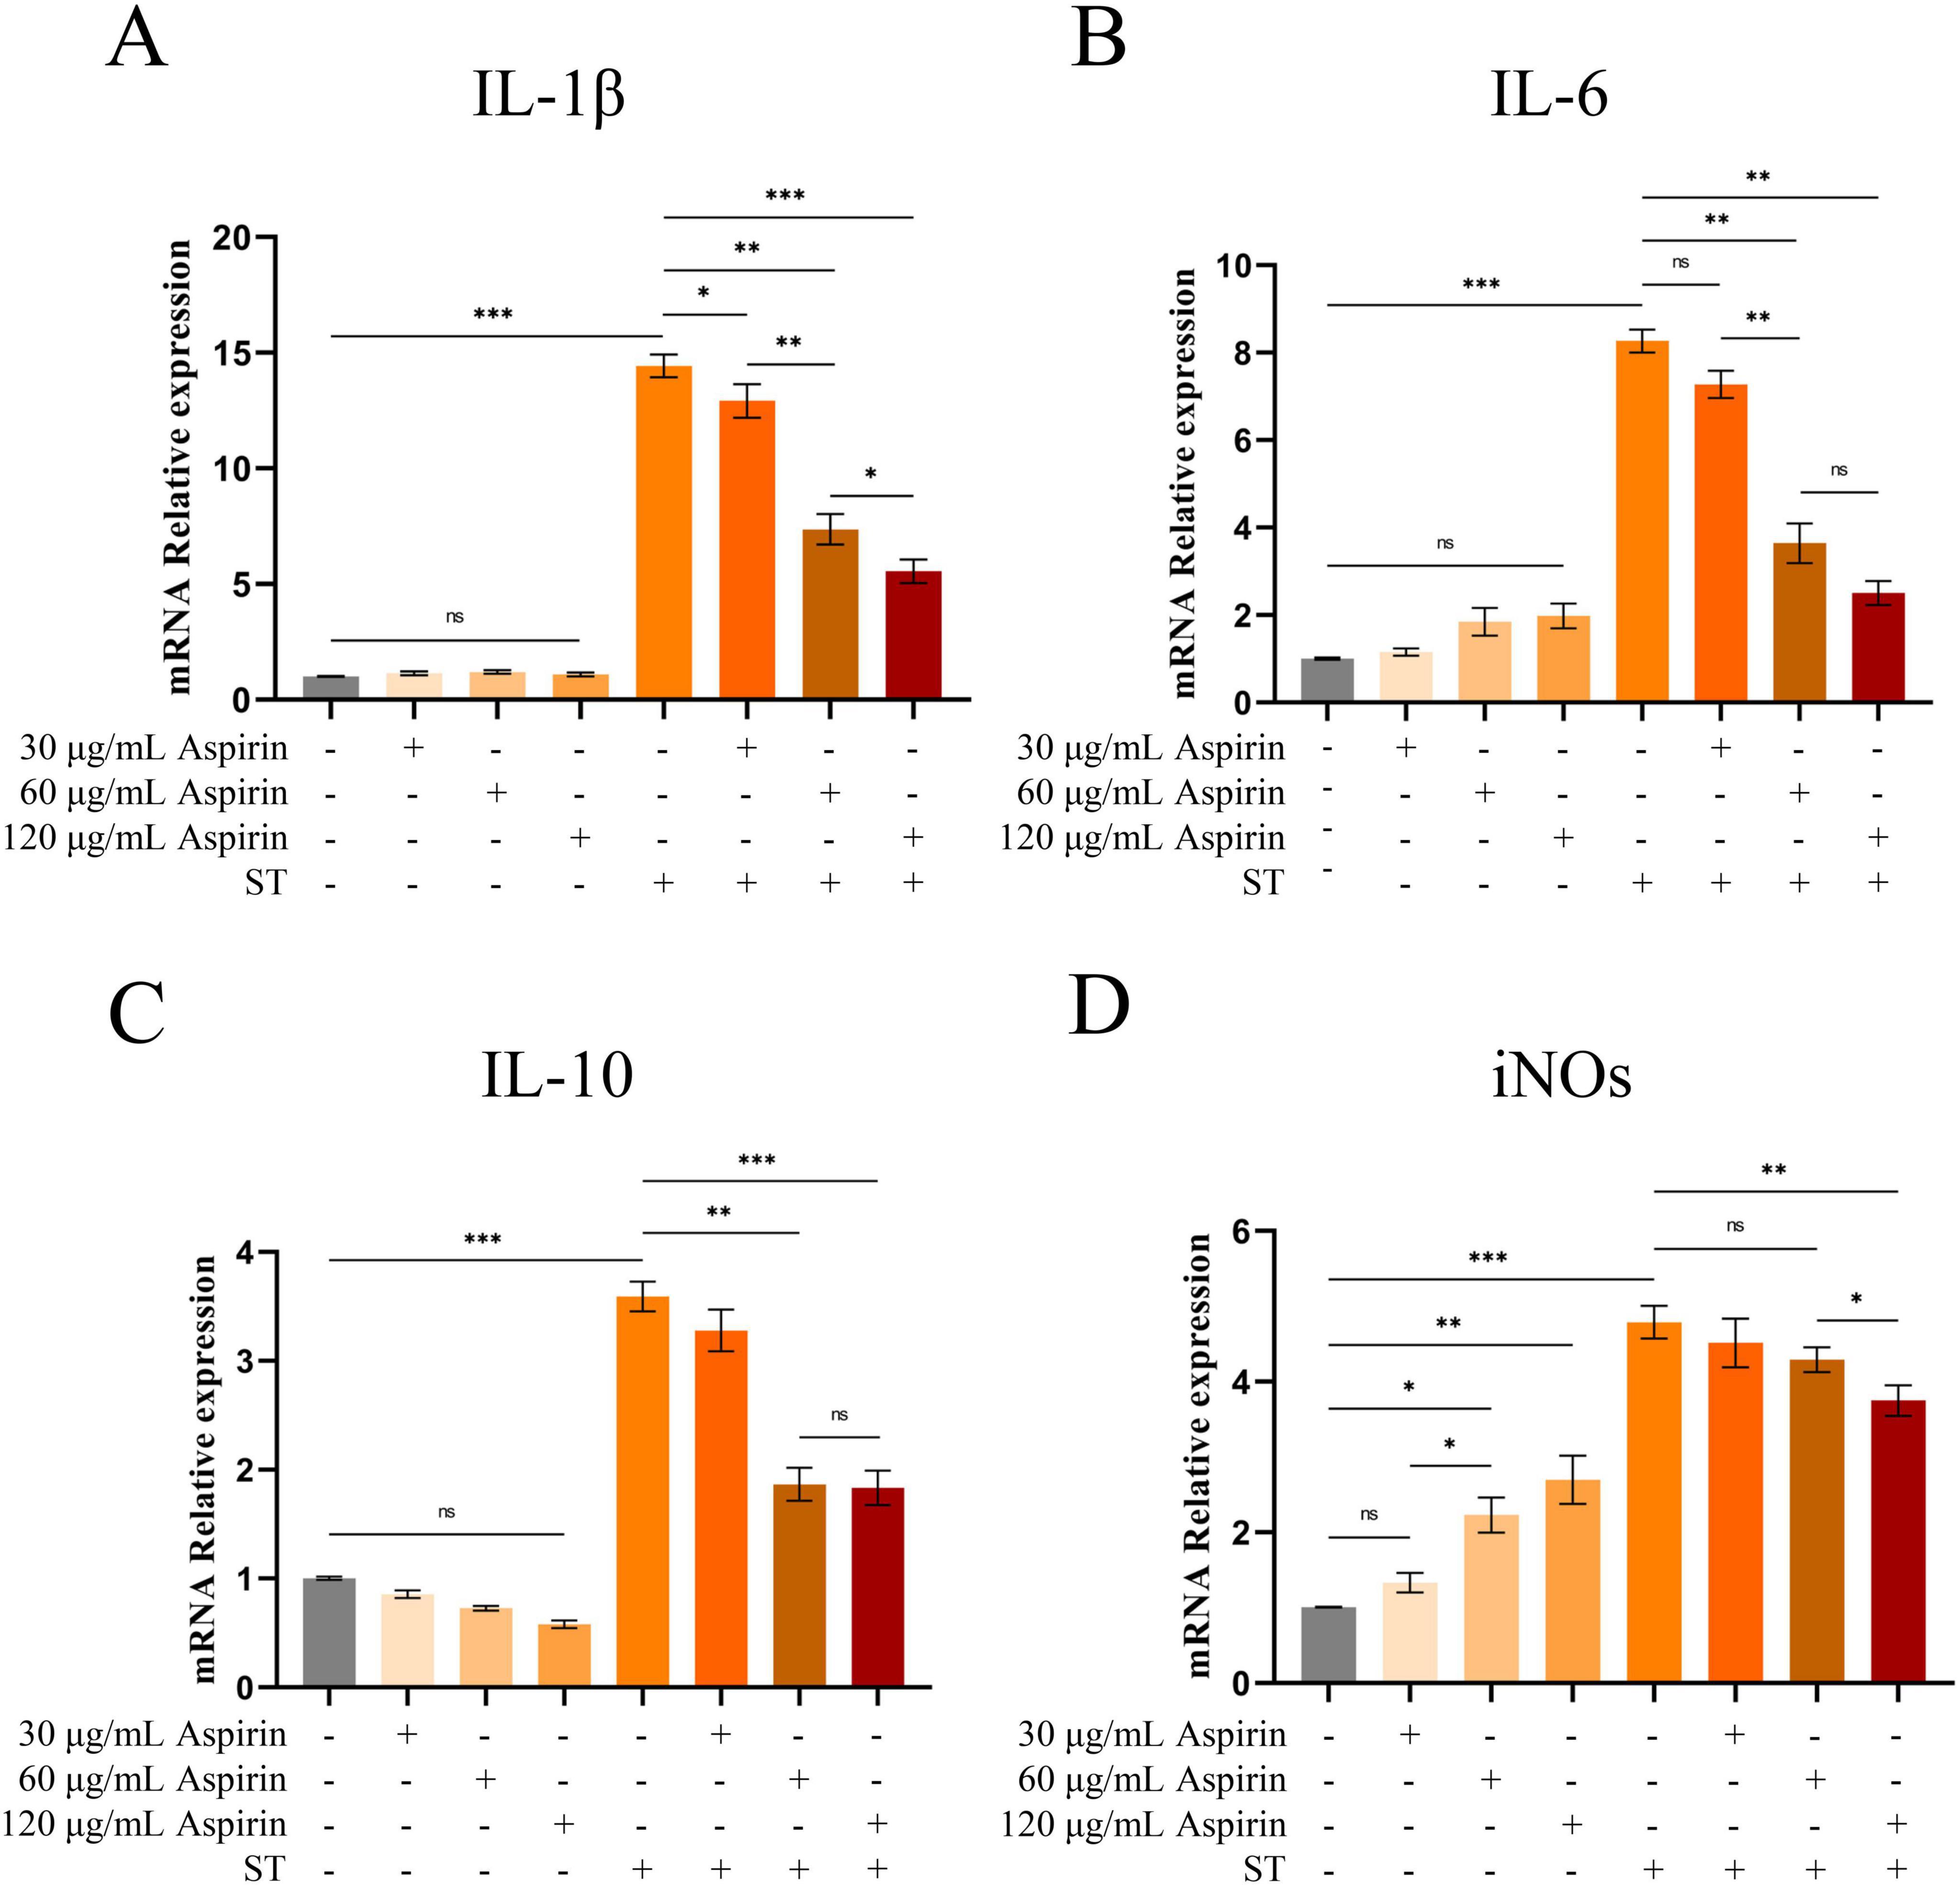
Figure 8. Changes in IL-1, IL-6, IL-10 and iNOs in HD11 cells. (A–D) The relative mRNA expression levels of IL-1β, IL-6, IL-10 and iNOs in HD11 cells are indicated, respectively. “*” indicates a significant difference in statistics (*P < 0.05, **P < 0.01, and ***P < 0.001).
3.7 Salmonella Typhimurium infection activates the cyclooxygenase metabolic pathway of arachidonic acid
The levels of COdX-2 and PLA2 in cecum tissues were increased in both the SAL and ABX groups after S. Typhimurium infection compared to the CON group (P < 0.05 or P < 0.01) and did not differ between either the SAL and ABX groups (Figures 9A–D). Compared to the CON group, the levels of ARA in cecum tissues and cecum contents were increased in both the SAL and ABX groups after S. Typhimurium infection (P < 0.05), and there was no difference between the SAL and ABX groups (Figures 9E,F).
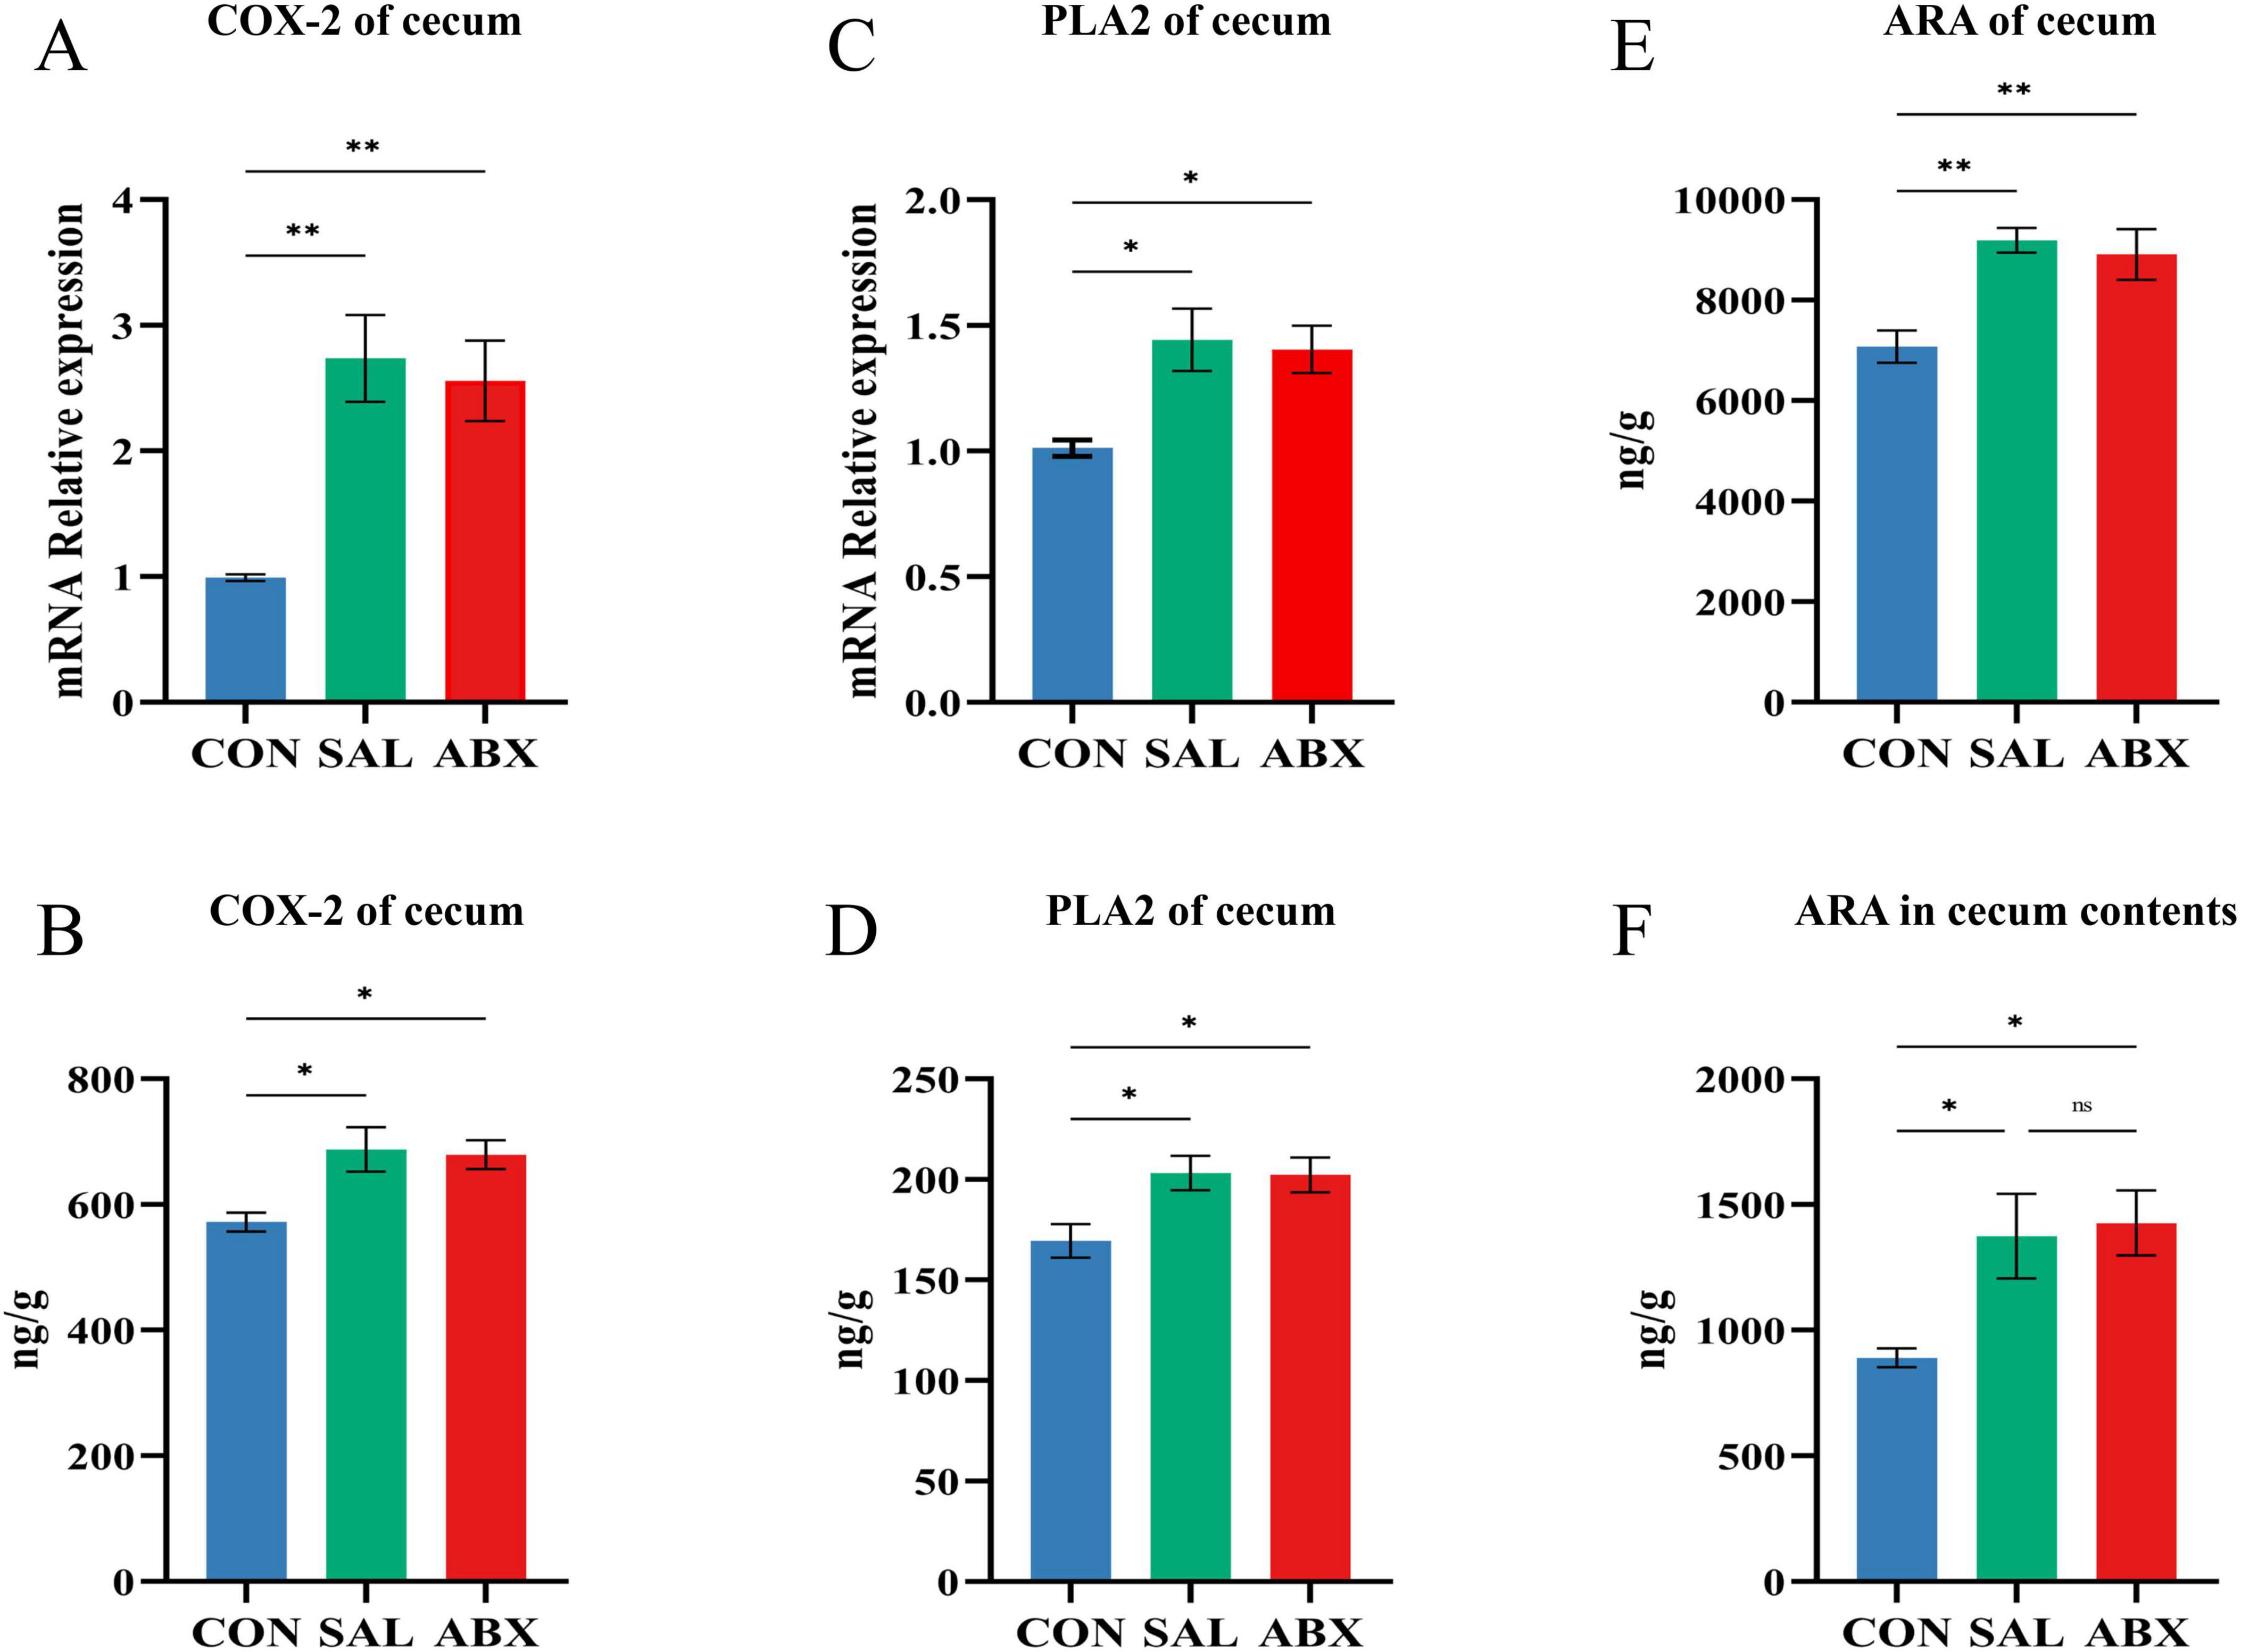
Figure 9. Changes of arachidonic acid and its key enzymes of metabolic pathway in the cecum. (A–D) COX-2 and PLA2 content and relative mRNA expression levels in cecum tissues. (E,F) ARA content in cecum tissues and cecum contents. “*” indicates a significant difference in statistics (*P < 0.05, **P < 0.01, and ***P < 0.001).
Compared to the untreated group, aspirin pretreatment had no significant effect on the levels of COX-2 in HD11 cells (Figures 10A,B), but the relative mRNA expression level of PLA2 was significantly increased when the concentration reached 60 and 120 μg/mL (P < 0.05) with a dose-dependent trend (Figure 10D). Compared to the untreated group, aspirin pretreatment had no significant effect on the levels of PLA2, PGF2α, and ARA in HD11 cells (Figures 10C,E,F).
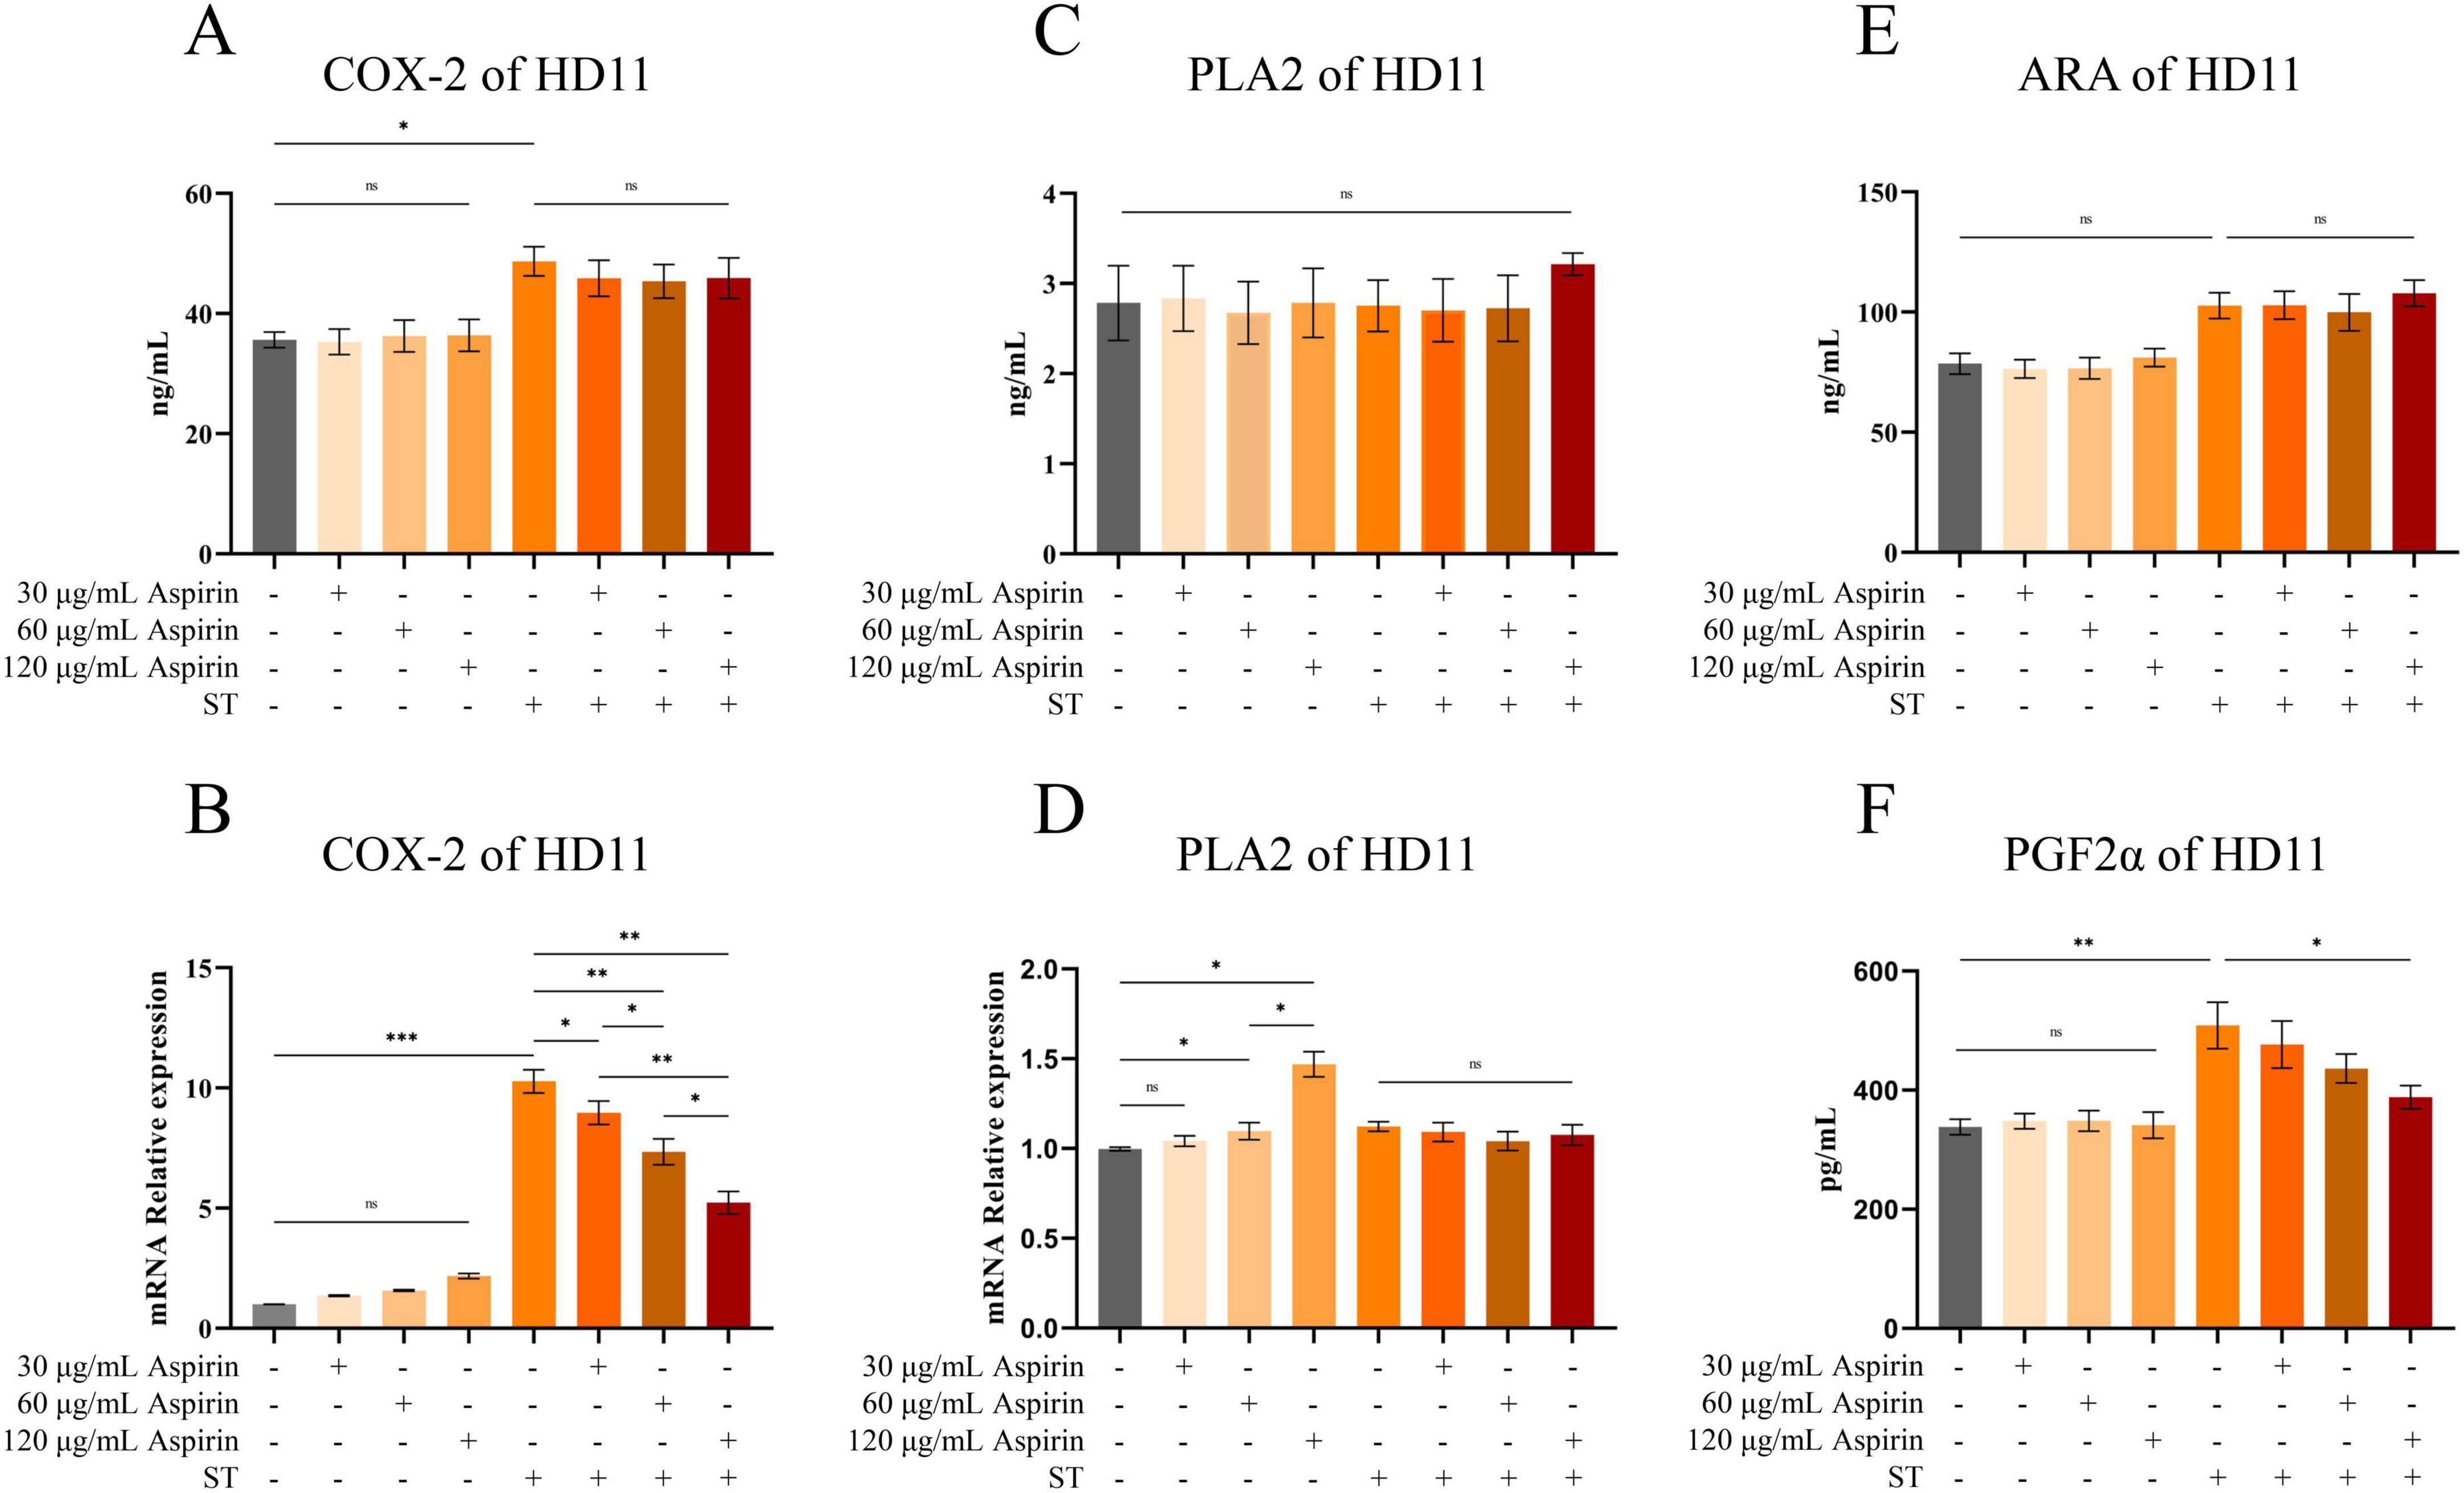
Figure 10. Changes of arachidonic acid and its key enzymes of metabolic pathway in HD11 cells. (A,C,E,F) The contents of COX-2, PLA2, ARA, and PGF2α in HD11 cells are indicated, respectively. (B,D) The relative mRNA expression levels of COX-2 and PLA2 in HD11 cells are indicated, respectively. “*” indicates a significant difference in statistics (*P < 0.05, **P < 0.01, and ***P < 0.001).
Compared to the untreated group, the relative mRNA expression level of COX-2 in HD11 cells was increased after S. Typhimurium infection (P < 0.001), whereas aspirin pretreatment significantly reduced this effect (Figure 10B) (P < 0.05 or P < 0.01). Meanwhile, Elisa’s results showed that COX-2 content in HD11 cells was increased after S. Typhimurium infection (P < 0.05). However, aspirin pretreatment could not inhibit the increased COX-2 content induced by infection (Figure 10A). Compared to the untreated group, PGF2α content in HD11 cells was increased after S. Typhimurium infection (P < 0.05). However, aspirin pretreatment (120 μg/mL) reduced the infection-induced increases in PGF2α content (Figure 10F) (P < 0.05). Compared to the untreated group, the levels of ARA and PLA2 in HD11 cells did not change significantly after S. Typhimurium (Figures 10C,E).
4 Discussion
Intestinal inflammation caused by avian salmonellosis is necessary for Salmonella colonization and survival (Winter et al., 2010). Arachidonic acid (ARA) metabolites are an important and widely acting class of inflammatory mediators (Huang et al., 2021). Therefore, the relationship between arachidonic acid metabolites and enteritis caused by Salmonella infection in poultry, which is for the prevention and treatment of the disease.
PLA2 and COX-2 are key enzymes for ARA production and metabolism (Murakami et al., 2017; Pang et al., 2022), respectively. S. Typhimurium infection caused increased levels of PLA2 and COX-2 in the intestinal tissues of Wenchang chickens, which may be the direct cause of the increased levels of arachidonic acid and its metabolites in the cecum tissues. A number of studies have shown that ARA metabolites (e.g., prostaglandins, leukotrienes, and lipoxins) mediate inflammatory responses in the intestine via different types of G-protein-coupled receptors (Stenson, 2014; Kawahara et al., 2015; Yokomizo et al., 2018; Nagatake and Kunisawa, 2019). For example, PGE2 signals through prostaglandin E receptor 2 (EP2) on neutrophils and tumor-associated fibroblasts, which promotes inflammation through multiple steps to form the tumor microenvironment in colorectal cancer (Aoki and Narumiya, 2017) and induces mast cell activation through the EP3 receptor signaling pathway, which enhances vascular permeability and promotes acute inflammation (Morimoto et al., 2014). PGF2α levels are significantly increased in patients with ulcerative enteritis, which is alleviated by the use of PLA2 inhibitors (Lauritsen et al., 1987). 5-OxoETE (precursor of 5(S)-HETE) promotes the basophil migratory response (Iikura et al., 2005), and is involved in neuroinflammatory activities (Wang et al., 2023). LXA4 facilitates the reduction in chronic inflammation, inhibits the production of PGE2 and LTs, and suppresses the production of pro-inflammatory factors IL-6 and TNF-α (Das, 2021). 15-OxoETE can activate anti-inflammatory Nrf2 signaling and inhibit the NF-κB-mediated pro-inflammatory pathway (Snyder et al., 2015). EETs (e.g., 8,9-EET, 11,12-EET) prevent leukocyte adherence to the vascular wall through inhibition of the transcription factors NF-κB and IκB kinase and play an important non-vasodilatory role in vascular inflammation (Node et al., 1999). EETs can also inhibit the activation of NOD-like receptor thermal protein domain associated protein three inflammatory vesicles by suppressing calcium overload and reactive oxygen species production in macrophages, thereby facilitating the treatment of acute lung injury (Luo et al., 2020). It is thus evident that arachidonic acid metabolites have both anti-inflammatory and pro-inflammatory effects. We speculate that arachidonic acid metabolites are key substances mediating enteritis caused by Salmonella infection.
Prostaglandins such as PGE2 and PGF2α are metabolized by ARA by the COX-2 pathway (Li et al., 2024). We found that S. Typhimurium infection significantly increased the levels of COX-2 and PGF2α in HD11 cells and promoted the mRNA expression of inflammatory factors (IL-1β, IL-6, and iNOs). Furthermore, a cyclooxygenase inhibitor (aspirin) significantly inhibited the inflammatory response induced by S. Typhimurium infection. This validates our conjecture, suggesting that the ARA cyclooxygenase metabolic pathway mediates the inflammatory response upon S. Typhimurium infection. Unfortunately, this study did not examine how ARA metabolites mediate the development and progression of enteritis infected by Salmonella in chickens. This is because many of the metabolites have not been studied in vivo or in vitro in poultry, and some of the metabolites (e.g., EETs and PGE2) are rapidly degraded to low effectors in the organism, making it difficult to control the experimental variables (Zhou et al., 2017). Therefore, it is necessary to explore the research conditions further, find suitable experimental methods for validation, and gradually explore the mechanism of action of the ARA metabolites in Salmonella-induced intestinal inflammation in the future.
Gut microbiota composition is one of the most important factors affecting animal intestinal immunity and serves as a barrier against invasion by pathogenic microorganisms. To explore the resistance of chickens’ intestinal flora to Salmonella infection, we used antibiotic treatments in the ABX group to simulate a state of intestinal flora dysbiosis. Infection with S. Typhimurium significantly reduced the number of microorganisms, the flora abundance, and the species diversity in the cecum of Wenchang chickens. This is similar to the changes in the intestinal flora of laying hens after Salmonella infection (Mon et al., 2020). In addition, the relative contents of cytokines such as IL-4, IL-6, TGF-β1, and IFN-γ were significantly higher in the ABX group than in the SAL group. The above results suggest that Salmonella infection leads to intestinal flora dysbiosis, while the lack of intestinal flora further exacerbates the inflammatory response caused by Salmonella infection. Notably, the abundance of many beneficial bacteria (Bifidobacterium, Lactobacillus, and Odoribacter) was significantly reduced in the SAL and ABX groups. Many studies have confirmed the beneficial effects of Bifidobacterium in animals. It prevents diarrhea (Videlock and Cremonini, 2012), alleviates the symptoms of irritable bowel syndrome (Lewis et al., 2020), prevents colorectal cancer (Bahmani et al., 2019), alleviates clinical signs in patients with ulcerative colitis (Ishikawa et al., 2011), and regulates and maintains the structure of the intestinal flora (Luo et al., 2018). Lactobacillus is a group of beneficial intestinal bacteria that can prevent Clostridium difficile-infection-associated diarrhea (Goldenberg et al., 2017), facilitate intestinal inflammation (Ahl et al., 2016), and regulate immune-related molecules to enhance intestinal barrier function (Schlee et al., 2008; Terada et al., 2020).
The Spearman analysis showed a significant positive correlation between the relative abundance of Bifidobacterium and Lactobacillus and the relative mRNA expression of IL-2 in intestinal tissues (P < 0.05). IL-2 is a cytokine essential for the growth and survival of regulatory T cells (Tregs) in peripheral lymphoid tissues. Tregs are essential for the maintenance of peripheral tolerance and for the control of persistent inflammation and autoimmunity (Graßhoff et al., 2021). However, the relative mRNA content of IL-2 in the intestinal tissues of Wenchang chickens tended to decrease after S. Typhimurium infection. This suggests that avian gut microbiota, especially beneficial bacteria, potentially regulate intestinal immunity. However, Salmonella infection reduces the abundance of beneficial flora, which in turn reduces the immune function of the intestine, leading to the overgrowth of certain inflammation-associated genera in the avian intestinal tract, further aggravating intestinal inflammation. In summary, probiotics or other beneficial substances can be appropriately added to feed to regulate the flora structure and improve resistance to harmful microorganisms (Al-Khalaifa et al., 2019; Khan et al., 2020; Neveling and Dicks, 2021). For example, Odoribacter has shown promise as a next-generation probiotic that improves glucose tolerance and obesity-associated inflammation (Huber-Ruano et al., 2022). Lactofructose attenuated colitis symptoms by upregulating Muribaculum abundance (Hiraishi et al., 2022). An inevitable problem in this study was that it was not possible to experimentally verify these results. This is because the gut microbial system is too complex to control these variables.
In summary, this study found that infection with S. Typhimurium resulted in disturbed intestinal flora and a significant activation of ARA metabolism in Wenchang chickens. It also reported some ARA metabolites to be involved in the induction of inflammation. Given that the inflammatory intestinal environment is conducive to colonization and invasion by Salmonella, it is suggested that modulating ARA metabolism in intestinal tissues may be a potential approach to control enteritis caused by Salmonella infection.
5 Conclusion
This study found that S. Typhimurium infection induced levels of several arachidonic acid metabolites in chicken cecum tissues. In HD11 cells, a cyclooxygenase inhibitor significantly reduced the inflammatory response induced by S. Typhimurium infection. In addition, we observed the presence of disturbed cecal intestinal flora in the infected group, but the effect of this phenomenon on ARA metabolism was not significant. The above results suggest that S. Typhimurium can mediate the onset and development of intestinal inflammation by activating the chicken ARA cyclooxygenase metabolic pathway. These findings may provide new insights into how Salmonella induces enteritis in chickens. Based on this study, potential new mechanisms for combating enteritis caused by Salmonella infection in poultry can be further explored.
Data availability statement
The datasets presented in this study can be found in online repositories. The names of the repository/repositories and accession number(s) can be found at: https://www.ncbi.nlm.nih.gov/, PRJNA1027078.
Ethics statement
The animal study was approved by the Ethics Committee of Hainan University. The study was conducted in accordance with the local legislation and institutional requirements.
Author contributions
SC: Conceptualization, Methodology, Writing – original draft. YX: Formal analysis, Investigation, Validation, Writing – review & editing. DG: Data curation, Project administration, Writing – review & editing. TL: Data curation, Project administration, Writing – review & editing. ZT: Data curation, Project administration, Writing – review & editing. XR: Conceptualization, Methodology, Resources, Supervision, Writing – review & editing. XW: Conceptualization, Methodology, Resources, Supervision, Writing – review & editing.
Funding
The author(s) declare that financial support was received for the research, authorship, and/or publication of this article. This research was funded by the National Natural Science Foundation of China (No. 32360878), the Natural Science Foundation of Hainan Province (No. 321RC1020), and the earmarked fund for the Hainan Agricultural Production Research System (No. HNARS-06-G05).
Acknowledgments
We thank Shanghai Biotree Biotech Co., Ltd., for providing technical support for 16S sequencing and targeted metabolomics.
Conflict of interest
The authors declare that the research was conducted in the absence of any commercial or financial relationships that could be construed as a potential conflict of interest.
Generative AI statement
The authors declare that no Generative AI was used in the creation of this manuscript.
Publisher’s note
All claims expressed in this article are solely those of the authors and do not necessarily represent those of their affiliated organizations, or those of the publisher, the editors and the reviewers. Any product that may be evaluated in this article, or claim that may be made by its manufacturer, is not guaranteed or endorsed by the publisher.
Supplementary material
The Supplementary Material for this article can be found online at: https://www.frontiersin.org/articles/10.3389/fmicb.2025.1514115/full#supplementary-material
Footnotes
- ^ https://cran.r-hub.io/bin/windows/base/
- ^ https://www.medcalc.org/
- ^ https://cran.r-hub.io/bin/windows/base/old/3.4.4/
- ^ https://search.r-project.org/R/refmans/stats/html/00Index.html
- ^ https://cran.r-project.org/web/packages/vegan/index.html
References
Ahl, D., Liu, H., Schreiber, O., Roos, S., Phillipson, M., and Holm, L. (2016). Lactobacillus reuteri increases mucus thickness and ameliorates dextran sulphate sodium-induced colitis in mice. Acta Physiol (Oxf). 217, 300–310. doi: 10.1111/apha.12695
Al-Khalaifa, H., Al-Nasser, A., Al-Surayee, T., Al-Kandari, S., Al-Enzi, N., Al-Sharrah, T., et al. (2019). Effect of dietary probiotics and prebiotics on the performance of broiler chickens. Poult. Sci. 98, 4465–4479. doi: 10.3382/ps/pez282
Aoki, T., and Narumiya, S. (2017). Prostaglandin E(2)-EP2 signaling as a node of chronic inflammation in the colon tumor microenvironment. Inflamm. Regen. 37:4. doi: 10.1186/s41232-017-0036-7
Bahmani, S., Azarpira, N., and Moazamian, E. (2019). Anti-colon cancer activity of Bifidobacterium metabolites on colon cancer cell line SW742. Turk. J. Gastroenterol. 30, 835–842. doi: 10.5152/tjg.2019.18451
Bolyen, E., Rideout, J. R., Dillon, M. R., Bokulich, N. A., Abnet, C. C., Al-Ghalith, G. A., et al. (2019). Reproducible, interactive, scalable and extensible microbiome data science using QIIME 2. Nat. Biotechnol. 37, 852–857. doi: 10.1038/s41587-019-0209-9
Callahan, B. J., McMurdie, P. J., Rosen, M. J., Han, A. W., Johnson, A. J., and Holmes, S. P. (2016). DADA2: High-resolution sample inference from Illumina amplicon data. Nat. Methods 13, 581–583. doi: 10.1038/nmeth.3869
Das, U. N. (2021). Essential fatty acids and their metabolites in the pathobiology of inflammation and its resolution. Biomolecules 11:1873. doi: 10.3390/biom11121873
Eckmann, L., Stenson, W. F., Savidge, T. C., Lowe, D. C., Barrett, K. E., Fierer, J., et al. (1997). Role of intestinal epithelial cells in the host secretory response to infection by invasive bacteria. Bacterial entry induces epithelial prostaglandin h synthase-2 expression and prostaglandin E2 and F2alpha production. J. Clin. Invest. 100, 296–309. doi: 10.1172/jci119535
El-Saadony, M. T., Salem, H. M., El-Tahan, A. M., Abd El-Mageed, T. A., Soliman, S. M., Khafaga, A. F., et al. (2022). The control of poultry salmonellosis using organic agents: An updated overview. Poult. Sci. 101:101716. doi: 10.1016/j.psj.2022.101716
Fàbrega, A., and Vila, J. (2013). Salmonella enterica serovar Typhimurium skills to succeed in the host: Virulence and regulation. Clin. Microbiol. Rev. 26, 308–341. doi: 10.1128/cmr.00066-12
Goldenberg, J. Z., Yap, C., Lytvyn, L., Lo, C. K., Beardsley, J., Mertz, D., et al. (2017). Probiotics for the prevention of Clostridium difficile-associated diarrhea in adults and children. Cochrane Database Syst. Rev. 12:Cd006095. doi: 10.1002/14651858.CD006095.pub4
Graßhoff, H., Comdühr, S., Monne, L. R., Müller, A., Lamprecht, P., Riemekasten, G., et al. (2021). Low-dose IL-2 therapy in autoimmune and rheumatic diseases. Front. Immunol. 12:648408. doi: 10.3389/fimmu.2021.648408
Gu, L., Jiang, Q., Chen, Y., Zheng, X., Zhou, H., and Xu, T. (2022). Transcriptome-wide study revealed m6A and miRNA regulation of embryonic breast muscle development in Wenchang chickens. Front. Vet. Sci. 9:934728. doi: 10.3389/fvets.2022.934728
Han, Z., Willer, T., Li, L., Pielsticker, C., Rychlik, I., Velge, P., et al. (2017). Influence of the gut microbiota composition on Campylobacter jejuni colonization in chickens. Infect. Immun. 85:e00380. doi: 10.1128/iai.00380-17
Hiraishi, K., Zhao, F., Kurahara, L. H., Li, X., Yamashita, T., Hashimoto, T., et al. (2022). Lactulose modulates the structure of gut microbiota and alleviates colitis-associated tumorigenesis. Nutrients 14:649. doi: 10.3390/nu14030649
Huang, N., Wang, M., Peng, J., and Wei, H. (2021). Role of arachidonic acid-derived eicosanoids in intestinal innate immunity. Crit Rev Food Sci Nutr 61, 2399–2410. doi: 10.1080/10408398.2020.1777932
Huber-Ruano, I., Calvo, E., Mayneris-Perxachs, J., Rodríguez-Peña, M. M., Ceperuelo-Mallafré, V., Cedó, L., et al. (2022). Orally administered Odoribacter laneus improves glucose control and inflammatory profile in obese mice by depleting circulating succinate. Microbiome 10:135. doi: 10.1186/s40168-022-01306-y
Iikura, M., Suzukawa, M., Yamaguchi, M., Sekiya, T., Komiya, A., Yoshimura-Uchiyama, C., et al. (2005). 5-Lipoxygenase products regulate basophil functions: 5-Oxo-ETE elicits migration, and leukotriene B(4) induces degranulation. J. Allergy Clin. Immunol. 116, 578–585. doi: 10.1016/j.jaci.2005.04.029
Ishikawa, H., Matsumoto, S., Ohashi, Y., Imaoka, A., Setoyama, H., Umesaki, Y., et al. (2011). Beneficial effects of probiotic bifidobacterium and galacto-oligosaccharide in patients with ulcerative colitis: A randomized controlled study. Digestion 84, 128–133. doi: 10.1159/000322977
Isse, F. A., El-Sherbeni, A. A., and El-Kadi, A. O. S. (2022). The multifaceted role of cytochrome P450-derived arachidonic acid metabolites in diabetes and diabetic cardiomyopathy. Drug Metab. Rev. 54, 141–160. doi: 10.1080/03602532.2022.2051045
Kawahara, K., Hohjoh, H., Inazumi, T., Tsuchiya, S., and Sugimoto, Y. (2015). Prostaglandin E2-induced inflammation: Relevance of prostaglandin E receptors. Biochim. Biophys. Acta 1851, 414–421. doi: 10.1016/j.bbalip.2014.07.008
Khan, S., Moore, R. J., Stanley, D., and Chousalkar, K. K. (2020). The gut microbiota of laying hens and its manipulation with prebiotics and probiotics to enhance gut health and food safety. Appl. Environ. Microbiol. 86:e00600. doi: 10.1128/aem.00600-20
Lauritsen, K., Laursen, L. S., Bukhave, K., and Rask-Madsen, J. (1987). In vivo effects of orally administered prednisolone on prostaglandin and leucotriene production in ulcerative colitis. Gut 28, 1095–1099. doi: 10.1136/gut.28.9.1095
Le Faouder, P., Baillif, V., Spreadbury, I., Motta, J. P., Rousset, P., Chêne, G., et al. (2013). LC-MS/MS method for rapid and concomitant quantification of pro-inflammatory and pro-resolving polyunsaturated fatty acid metabolites. J. Chromatogr. B Analyt. Technol. Biomed. Life Sci. 932, 123–133. doi: 10.1016/j.jchromb.2013.06.014
Lewis, E. D., Antony, J. M., Crowley, D. C., Piano, A., Bhardwaj, R., Tompkins, T. A., et al. (2020). Efficacy of Lactobacillus paracasei HA-196 and Bifidobacterium longum R0175 in alleviating symptoms of irritable bowel syndrome (IBS): A randomized. placebo-controlled study. Nutrients 12:1159. doi: 10.3390/nu12041159
Li, X. J., Suo, P., Wang, Y. N., Zou, L., Nie, X. L., Zhao, Y. Y., et al. (2024). Arachidonic acid metabolism as a therapeutic target in AKI-to-CKD transition. Front. Pharmacol. 15:1365802. doi: 10.3389/fphar.2024.1365802
Luo, J., Li, Y., Xie, J., Gao, L., Liu, L., Ou, S., et al. (2018). The primary biological network of Bifidobacterium in the gut. FEMS Microbiol. Lett. 365:10. doi: 10.1093/femsle/fny057
Luo, X. Q., Duan, J. X., Yang, H. H., Zhang, C. Y., Sun, C. C., Guan, X. X., et al. (2020). Epoxyeicosatrienoic acids inhibit the activation of NLRP3 inflammasome in murine macrophages. J. Cell Physiol. 235, 9910–9921. doi: 10.1002/jcp.29806
Mon, K. K. Z., Zhu, Y., Chanthavixay, G., Kern, C., and Zhou, H. (2020). Integrative analysis of gut microbiome and metabolites revealed novel mechanisms of intestinal Salmonella carriage in chicken. Sci. Rep. 10:4809. doi: 10.1038/s41598-020-60892-9
Monk, J. M., Hou, T. Y., Turk, H. F., Weeks, B., Wu, C., McMurray, D. N., et al. (2012). Dietary n-3 polyunsaturated fatty acids (PUFA) decrease obesity-associated Th17 cell-mediated inflammation during colitis. PLoS One 7:e49739. doi: 10.1371/journal.pone.0049739
Monk, J. M., Turk, H. F., Fan, Y. Y., Callaway, E., Weeks, B., Yang, P., et al. (2014). Antagonizing arachidonic acid-derived eicosanoids reduces inflammatory Th17 and Th1 cell-mediated inflammation and colitis severity. Mediators Inflamm. 2014:917149. doi: 10.1155/2014/917149
Morimoto, K., Shirata, N., Taketomi, Y., Tsuchiya, S., Segi-Nishida, E., Inazumi, T., et al. (2014). Prostaglandin E2-EP3 signaling induces inflammatory swelling by mast cell activation. J. Immunol. 192, 1130–1137. doi: 10.4049/jimmunol.1300290
Murakami, M., Nakatani, Y., Atsumi, G. I., Inoue, K., and Kudo, I. (2017). Regulatory functions of phospholipase A2. Crit Rev. Immunol. 37, 127–195. doi: 10.1615/CritRevImmunol.v37.i2-6.20
Nagatake, T., and Kunisawa, J. (2019). Emerging roles of metabolites of ω3 and ω6 essential fatty acids in the control of intestinal inflammation. Int. Immunol. 31, 569–577. doi: 10.1093/intimm/dxy086
Neveling, D. P., and Dicks, L. M. T. (2021). Probiotics: An antibiotic replacement strategy for healthy broilers and productive rearing. Probiotics Antimicrob. Proteins 13, 1–11. doi: 10.1007/s12602-020-09640-z
Node, K., Huo, Y., Ruan, X., Yang, B., Spiecker, M., Ley, K., et al. (1999). Anti-inflammatory properties of cytochrome P450 epoxygenase-derived eicosanoids. Science 285, 1276–1279. doi: 10.1126/science.285.5431.1276
Oakley, B. B., and Kogut, M. H. (2016). Spatial and temporal changes in the broiler chicken cecal and fecal microbiomes and correlations of bacterial taxa with cytokine gene expression. Front. Vet. Sci. 3:11. doi: 10.3389/fvets.2016.00011
Pang, Y., Liu, X., Zhao, C., Shi, X., Zhang, J., Zhou, T., et al. (2022). LC-MS/MS-based arachidonic acid metabolomics in acute spinal cord injury reveals the upregulation of 5-LOX and COX-2 products. Free Radic. Biol. Med. 193(Pt 1), 363–372. doi: 10.1016/j.freeradbiomed.2022.10.303
Pruesse, E., Peplies, J., and Glöckner, F. O. (2012). SINA: Accurate high-throughput multiple sequence alignment of ribosomal RNA genes. Bioinformatics 28, 1823–1829. doi: 10.1093/bioinformatics/bts252
Resta-Lenert, S., and Barrett, K. E. (2002). Enteroinvasive bacteria alter barrier and transport properties of human intestinal epithelium: Role of iNOS and COX-2. Gastroenterology 122, 1070–1087. doi: 10.1053/gast.2002.32372
Rognes, T., Flouri, T., Nichols, B., Quince, C., and Mahé, F. (2016). VSEARCH: A versatile open source tool for metagenomics. PeerJ 4:e2584. doi: 10.7717/peerj.2584
Schlee, M., Harder, J., Köten, B., Stange, E. F., Wehkamp, J., and Fellermann, K. (2008). Probiotic lactobacilli and VSL#3 induce enterocyte beta-defensin 2. Clin. Exp. Immunol. 151, 528–535. doi: 10.1111/j.1365-2249.2007.03587.x
Shaji, S., Selvaraj, R. K., and Shanmugasundaram, R. (2023). Salmonella infection in poultry: A review on the pathogen and control strategies. Microorganisms 11:2814. doi: 10.3390/microorganisms11112814
Snyder, N. W., Golin-Bisello, F., Gao, Y., Blair, I. A., Freeman, B. A., and Wendell, S. G. (2015). 15-Oxoeicosatetraenoic acid is a 15-hydroxyprostaglandin dehydrogenase-derived electrophilic mediator of inflammatory signaling pathways. Chem. Biol. Interact. 234, 144–153. doi: 10.1016/j.cbi.2014.10.029
Stenson, W. F. (2014). The universe of arachidonic acid metabolites in inflammatory bowel disease: Can we tell the good from the bad? Curr. Opin. Gastroenterol. 30, 347–351. doi: 10.1097/mog.0000000000000075
Terada, T., Nii, T., Isobe, N., and Yoshimura, Y. (2020). Effects of probiotics Lactobacillus reuteri and Clostridium butyricum on the expression of toll-like receptors, pro- and anti-inflammatory cytokines, and antimicrobial peptides in broiler chick intestine. J. Poult. Sci. 57, 310–318. doi: 10.2141/jpsa.0190098
Videlock, E. J., and Cremonini, F. (2012). Meta-analysis: Probiotics in antibiotic-associated diarrhoea. Aliment. Pharmacol. Ther. 35, 1355–1369. doi: 10.1111/j.1365-2036.2012.05104.x
Wang, A., Wan, X., Zhuang, P., Jia, W., Ao, Y., Liu, X., et al. (2023). High fried food consumption impacts anxiety and depression due to lipid metabolism disturbance and neuroinflammation. Proc. Natl. Acad. Sci. U S A. 120:e2221097120. doi: 10.1073/pnas.2221097120
Winter, S. E., Thiennimitr, P., Winter, M. G., Butler, B. P., Huseby, D. L., Crawford, R. W., et al. (2010). Gut inflammation provides a respiratory electron acceptor for Salmonella. Nature 467, 426–429. doi: 10.1038/nature09415
Yokomizo, T., Nakamura, M., and Shimizu, T. (2018). Leukotriene receptors as potential therapeutic targets. J. Clin. Invest. 128, 2691–2701. doi: 10.1172/jci97946
Keywords: Salmonella Typhimurium, gut microbiota, lipid oxidation, arachidonic acid, Wenchang chicken
Citation: Chen S, Xie Y, Guo D, Li T, Tan Z, Ran X and Wen X (2025) Effects of Salmonella Typhimurium infection on intestinal flora and intestinal tissue arachidonic acid metabolism in Wenchang chickens. Front. Microbiol. 16:1514115. doi: 10.3389/fmicb.2025.1514115
Received: 20 October 2024; Accepted: 06 January 2025;
Published: 24 January 2025.
Edited by:
George Grant, University of Aberdeen, United KingdomReviewed by:
Daniel Hernandez-Patlan, National Autonomous University of Mexico, MexicoSébastien Holbert, INRA Centre Val de Loire, France
Mohamed Shafey Elsharkawy, National Research Centre, Egypt
Copyright © 2025 Chen, Xie, Guo, Li, Tan, Ran and Wen. This is an open-access article distributed under the terms of the Creative Commons Attribution License (CC BY). The use, distribution or reproduction in other forums is permitted, provided the original author(s) and the copyright owner(s) are credited and that the original publication in this journal is cited, in accordance with accepted academic practice. No use, distribution or reproduction is permitted which does not comply with these terms.
*Correspondence: Xuhua Ran, cmFueHVodWFAaGFpbmFudS5lZHUuY24=; Xiaobo Wen, eGlhb2JvX3dlbkBoYWluYW51LmVkdS5jbg==