
94% of researchers rate our articles as excellent or good
Learn more about the work of our research integrity team to safeguard the quality of each article we publish.
Find out more
ORIGINAL RESEARCH article
Front. Microbiol. , 06 March 2025
Sec. Microbial Physiology and Metabolism
Volume 16 - 2025 | https://doi.org/10.3389/fmicb.2025.1512982
 Emiliano Salucci1,2†
 Fabrizio Cartenì1†
 Francesco Giannino1
 Elisabetta de Alteriis3
 Francesca Raganati4
 Stefano Mazzoleni1*
Introduction: Succinic acid is an important chemical compound for biotechnological productions, being used as a basic platform to produce many industrial products in major business applications. It can be produced as fermentation end-product of anaerobic metabolism of different bacterial species, among which Actinobacillus succinogenes is largely used. Modeling microbial metabolic processes in controlled bioreactor systems is recognized as a useful tool to optimize growth conditions aimed at maximizing yield.
Methods: A novel model is presented based on System Dynamics approach in which the maintenance of the ATP/ADP balance is introduced as a key regulatory process of A. succinogenes metabolism.
Results and discussion: Model simulations accurately reproduce microbial growth and succinic acid production in anaerobic batch cultures at different initial glucose concentrations. Results reveal that the main limitations to maximal succinic acid production are glucose uptake restrictions and energy homeostasis costs (ATP/ADP balance) of the microbial population. The process-based modeling approach effectively describes the main metabolic processes and their regulation, providing a useful tool to define working conditions and overcome the criticalities of the SA fermentation process.
Succinic acid (SA) is a C-4 dicarboxylic acid that has gained great interest because of its use as a precursor for several synthetic resins, chemical reagents, herbicides, fungicides, biodegradable polymers detergents and inks, among other products (Rigaki et al., 2020; Corona-González et al., 2008). Fermentative SA production has been accomplished by using several strains, among which the facultative anaerobes Actinobacillus succinogenes, Basfia succiniproducens, and Mannheiimia succiniciproducens are the most used. The potential for bio-SA market is in the replacement of existing petrol-based SA (Prabhu et al., 2020). Therefore, SA is considered as one of the chemical platforms for the future development at industrial scale, and one of the fastest growing markets (Ercole et al., 2021; Stylianou et al., 2020).
SA is a fermentation end-product of the anaerobic metabolism of A. succinogenes. Starting from a glucose-based substrate, A. succinogenes can split its metabolic flux into two branches: (i) C3 pathway leading to formate, acetate, ethanol, and lactate production, and (ii) C4 pathway for succinate production. Several studies reported that the cellular global demand for ATP and cofactors (NADH produced in the C3 route) controls the glycolytic flux (Almqvist et al., 2016; Bradfield and Nicol, 2014; Vemuri et al., 2002). In anaerobic systems, where glucose cannot be completely oxidized, the microorganisms accumulate metabolic intermediates to maintain the redox balance (Vemuri et al., 2002; McKinlay et al., 2007). The increase of NADH supports SA production, since SA is a highly reduced fermentation product (the production of 2 moles of SA requires 4 moles of NADH), with such glucose conversion to SA being maintained during fermentation, even if cell density achieves an early stationary phase (Corona-González et al., 2008). In some cases, the need of reducing equivalents is ensured by providing additional reduced carbohydrates (e.g., sorbitol) (Chatterjee et al., 2001) or increasing NADH availability (Sánchez et al., 2005; Zhu et al., 2014). Both growth and succinic acid production are limited by culture pH, which tends to decrease following acids accumulation (Corona-González et al., 2008). Another critical factor in the fermentation is the initial high glucose concentration which inhibits cell growth, an effect mainly attributed to osmotic stress causing cell damage (Pateraki et al., 2016b).
Several different models have been reported to describe the fermentative SA production by various microorganisms (wild type or genetically modified), from different carbon sources (in either pure forms or occurring in waste streams) (Song and Lee, 2006; Akhtar et al., 2014). In some cases, the substrate and product inhibition phenomena in the process have been considered in the models. Lin et al. (2008) reported an unstructured model that predicts SA production by A. succinogenes cultivated on glucose and wheat hydrolysates. The model succeeded in describing the inhibitory kinetics caused by both externally added chemicals and the same chemicals produced during fermentation. Corona-González et al. (2008) reported a kinetic study of glucose conversion to SA by A. succinogenes, where substrate and product inhibition phenomena were described by Jerusalimsky equations. Song et al. (2008) proposed a model for the SA production by M. succiniciproducens from glucose using a modified Monod model incorporating inhibition of both glucose and acids accumulated in the fermentation broth. Using another carbon source as glycerol, Li et al. (2010) presented the inhibitory effects by major products in the SA fermentation by E. coli mutants. They proposed a logistic model to describe the overall synergistic inhibitory effects. Vlysidis et al. (2011) reported a model of SA production by A. succinogenes, where a modified Monod equation considered both substrate and product inhibition. Pateraki et al. (2016a) developed unstructured models, including both substrate and product inhibition, that predicted the cultivation of A. succinogenes and Basfia succiniciproducens on a mixture of C5 and C6 sugars used to mime the sugar composition present in spent sulphite liquor. More recently, Rigaki et al. (2020) investigated the dissolved CO2 effect on SA production by A. succinogenes and proposed a double substrate model (glycerol and CO2) in batch reactors, which succeeded in effectively predicting the transient concentrations of glycerol and MgCO3.
In a more general context, a powerful modeling approach is based on System Dynamics tools (Forrester, 1961) allowing to develop process-based models of simplified metabolic pathways avoiding fully explicit fluxomic models' representations (de Falco et al., 2022), but still able to capture the main emergent dynamics of biomass and main metabolites production. Examples of applications of this type of modeling have been proposed to describe the main metabolic dynamics of the yeast S. cerevisiae (Mazzoleni et al., 2015), as well as of two bacterial species of biotechnological interest, such as E. coli and B. subtilis (Carteni et al., 2020). These works highlighted the relevance of self-produced growth inhibitors during cell proliferation that, in long runs of fed-batch cultures, may reduce the maximal achievable cell density. Very recently, de Alteriis et al. (2023) experimentally demonstrated in yeast fed-batch cultures that such inhibitory compound was self-DNA released by the live cells and accumulated in the culture medium.
Moreover, it is known that the production of target metabolic products can be either enhanced or worsened according to intracellular ATP content manipulation (Wisselink et al., 2007), so that ATP can be supplied to regulate the production (Zhou et al., 2009).
Considering the relevance of ATP availability in cell metabolism, it is noteworthy to recall another general effect associated to the cell energy balance. As discussed by de Alteriis et al. (2018), the ATP dynamics during the glycolytic process can lead to an energy crisis in the presence of excess of glucose. This may seem counter-intuitive, but it is explained by the different dynamics of glycolytic reactions, because the first irreversible glucose phosphorylation reaction may lead to a rapid ATP depletion when the glucose-6-phosphate accumulation is not sufficiently processed by the following ATP-forming reactions. This logically explained the occurrence of the metabolic shift between respiration and fermentation in Crabtree positive yeasts and other microbial species (De Deken, 1966; Wolfe, 2005; Paczia et al., 2012), as an avoidance of the conditions determining the ATP energy crisis at high sugar concentration (de Alteriis et al., 2018).
To the authors' knowledge, so far, no modeling studies of bacterial batch cultures have considered the role of the energy balance (in terms of ATP/ADP ratio) in regulating cell growth dynamics. Based on these considerations, in this work we propose a novel process-based kinetic model able to describe the dynamics of A. succinogenes DSM 22257 growth on glucose as substrate at five different concentrations [data from Ferone et al. (2017)], taking into account the crucial role of the ATP/ADP ratio in cell metabolism. Thus, the proposed System Dynamics model of A. succinogenes metabolism addressed the regulation of glucose uptake and its effect on growth, and the related energy demand for maintaining the intracellular pH, on the growth and fermentation performances in this biotechnologically important bacterial species.
The present model was developed to describe the growth of A. succinogenes and the consequent production of acetic, formic and succinic acid in a batch reactor focusing on the fine-tuned energy balance of the bacterial cell.
Figure 1 represents the simplified metabolism of A. succinogenes in anaerobic conditions on glucose as carbon and energy source leading to the production of succinic, acetic and formic acids, as well as microbial mass, with the explicit representation of the main chemical reactions related to energy production and consumption involved in the processes. Although it is known that other by-products can be formed during glucose fermentation, including ethanol and lactic acid (C3 pathway), the specific strain used in Ferone et al. (2017) (A. succinogenes DSM 22257) does not produce lactic acid under the anaerobic experimental conditions, differently from other succinic producer species such as Basfia succiniproducens (Pateraki et al., 2016a). Regarding ethanol, it cannot be excluded that some ethanol may be produced by A. succinogenes, but in the experiments performed by Ferone et al. (2017), ethanol was not detected (pers. commun. by the authors).
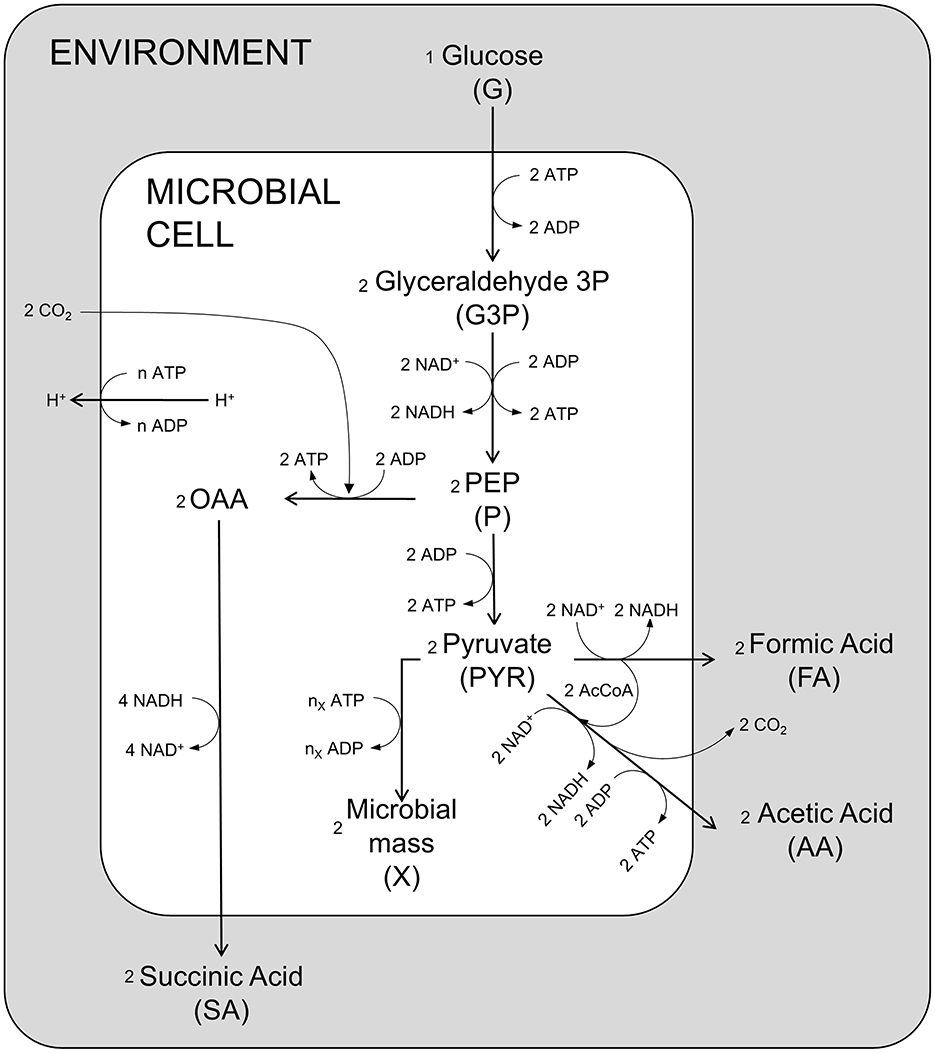
Figure 1. Schematic diagram of the main metabolic reactions of A. succinogenes. OAA oxaloacetate; PEP phosphoenolpyruvate; AcCoA acetyl coenzyme A.
Figure 2 shows a schematic diagram of the implemented processes in the model, providing a simplified representation of the complex network of the metabolism of A. succinogenes growing on glucose, producing the different acids, and where the influence of the different processes on the energy balance is taken into consideration affecting the ATP/ADP ratio inside the cell.
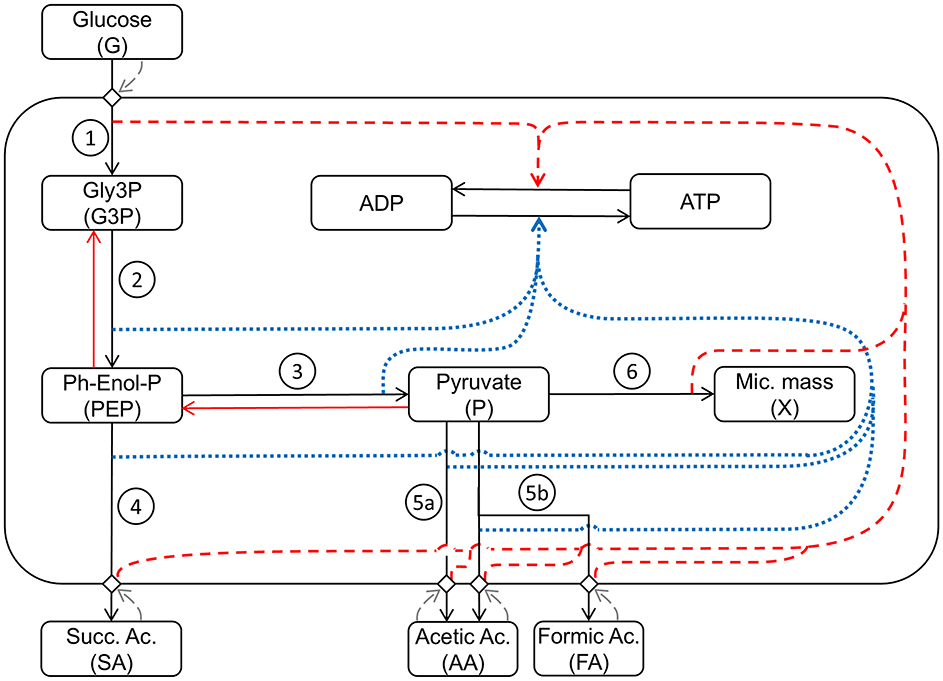
Figure 2. Schematic representation of the mathematical model structure and interactions between the considered metabolic pathways: (1) Glycolysis1: Glucose uptake/G3P production; (2) Glycolysis2: PEP production; (3) Glycolysis3: P production; (4) Production1: succinic acid production; (5a) Production2: acetic acid production; (5b) Production3: acetic and formic acid production; (6) Growth: microbial growth. Black arrows indicate direct metabolic reactions. Red arrows indicate reverse reactions. Blue dotted arrows indicate influence on ATP production. Red dashed arrows indicate influence on ATP consumption. Grey dashed arrows indicate response feedback effects.
The state variables explicitly represented in the model are:
• the carbon source, Glucose (G) in the growth medium;
• the glycolysis intermediates: Glyceraldehyde-3-phosphate (G3P), Phosphoenolpyruvate (PEP) and Pyruvate (P);
• the fermentation products, i.e., Succinic Acid (SA), Acetic Acid (AA) and Formic Acid (FA);
• the microbial mass (X);
• the energy molecules, ATP and ADP.
The key assumption of the model is that the A. succinogenes metabolism level is controlled by the ATP/ADP ratio; in particular, this ratio is assumed to be regulated by growth energy costs and the related costs associated to the production of acids and their secretion. Indeed, the acids produced by fermentation are rapidly released into the reaction environment, but their extrusion from the cell is slowed down over time because they are displaced against a concentration gradient (Fukuzaki et al., 1990; Corona-González et al., 2008).
Further, in the model, specific response curves (RC) of the modeled processes to controlling variables are defined by logistic functions with two parameters, k which defines the slope of the curve and mid which represents the value of the controlling variable for which the RC is half of its maximum (middle). The slope of the logistic curve represents how fast the system responds when the threshold conditions are reached. All response curves, with exception of RCv, assume values between 0 and 1, slowing down the metabolic processes when specific threshold concentrations of the involved state variables are reached.
In the model, seven main metabolic processes and the energetic balance ATP/ADP are taken into account (Figure 2). The first modeled process is the G uptake by the cell population. This is followed by the glycolytic process, which produces G3P in the first energy investment phase. The chemical reactions condensed in this first step are spontaneous, irreversible, and consume ATP, representing a fundamental regulatory point for glycolysis (Mor et al., 2011). The second set of reactions represents the production of PEP and P and the associated ATP production. These reactions are reversible (Boiteux and Hess, 1981) and produce the substrates used in the different fermentation routes leading to SA, AA, and FA. The step for producing SA in the presence of CO2, sees PEP as a reagent and oxaloacetate as starting intermediate product, with consequent production of energy leading to the final conversion into SA (Figure 1). Starting from P, two different fermentative pathways are available: the first promotes the release of CO2 with consequent production of ATP and AA; the second route allows the formation of FA and subsequently, passes through the intermediate AcetylCoA, which produces ATP and AA. Due to the anaerobic conditions, A. succinogenes cannot re-assimilate the produced acids through the respiratory processes; so, they accumulate in the medium.
In the model (Figure 2), the role of pyruvate is essential being assumed as the main building block for the biosynthesis of microbial mass (Wang et al., 2019). As in previous modeling work (Mazzoleni et al., 2015; Carteni et al., 2020), the model also considers the accumulation I in the medium inhibiting all metabolic processes.
The uptake of G and conversion to G3P is formulated as a Michaelis–Menten (MM) kinetics which, being an irreversible process, depends only on the substrate G with a first order dependency on the cell mass (X) that exerts the process. The process is formulated as follows:
where vGly1 is the maximum rate of the process, kGly1 is the half-saturation constant and MWX represents the molecular weight of A. succinogenes obtained from the composition of its biomass CH2O0.5N0.18 (Samuoelov et al., 1990). MWG3P is the molecular weight of G3P, while G3Pmax, represents its maximum concentration within the cell (McKinlay et al., 2007). RCv1 represents the response curve function to the external concentration of G. In the case of limiting glucose concentration, the cell maximizes the glucose uptake rate, upregulating the phosphotransferase system (ptsG) whereas, at high G concentration, the uptake rate is reduced (Plumbridge, 1998; Neumann et al., 2012). This G uptake regulation is then formulated by two RCs, the first, describing the increased uptake rate at low glucose concentrations, formulated as:
where a1 and k1 are, respectively, the response curve affinity coefficient and the slope affinity, MWG is the molecular weight of G, while Gmid1 is the G middle concentration.
A second response curve, RCv2, affects the uptake rate, slowing down the process in cases of high glucose availability, as defined by the following formulation:
where a2 and k2 represent, respectively, the response curve affinity coefficient or minimum value to which the response curve tends, and the slope affinity, while Rmid is the glucose/microbial mass ratio middle concentration. In this case, the logistic curve used is defined as a function of the logarithm of the G/X ratio due to the different orders of magnitude of this ratio assumes in different conditions.
The processes requiring ATP or ADP present a specific RCATP, which is a function of the ratio between the available chemical energy and the microbial mass X and it is formulated as:
where k3 is the energy slope affinity, while ATPmid is the ATP middle concentration. The ADP response curve (RCADP) is equivalent to 1 minus the RCATP.
The process leading to the production of PEP in the cell of A. succinogenes, formulated as the MM kinetics of a reversible process, is formulated as follows:
where vGly2 is the maximum rate of this process, kGly2 is the half-saturation constant, MWPEP is the molecular weight of PEP, while G3P is the reaction substrate. As this is a reversible step in the glycolysis process, it is limited by the saturation of the product (PEP), therefore PEPmax represents its maximum concentration.
The glycolytic pathway ends with the production of P described by an MM kinetics in which the only substrate is PEP. The process is formulated as follows:
where vGly3 is the maximum rate of the process, kGly3 is the half-saturation constant, MWP is the molecular weight of P, while Pmax represents the maximum concentration of the product, necessary in order to be able to define this process as reversible.
The processes that describe the different fermentation pathways always show MM kinetics, but change the substrate used in compliance with the reactive network. In particular, Production1 promotes the production of SA starting from PEP, Production2 allows to obtain only AA starting from P and finally, Production3 produces both AA and FA having P as substrate. These processes are defined in the following equations:
where vP1,2,3 and kP1,2,3 are the maximum rate and the half-saturation constant, respectively, of the fermentative process considered.
Cell duplication in the bioreactor is described by Growth process which exhibits P-dependent MM kinetics as a substrate. The process is described by the following equation:
where vG and kG are the maximum rate and the half-saturation constant, respectively. RCG is the growth metabolic response curve which is a function of the external concentration of G and which inhibits it in conditions of lack of nutrients. The response curve is then formulated as:
where k4 is the slope affinity, while Gmid2 is the G middle concentration at which the phenomenon begins to become more relevant to the point of inhibiting the growth process.
Based on the above model description, the following eleven mass balance equations are defined:
The state variables described in the mass balances are distinguished based on their location in the reaction environment. The microbial mass (X) and the extracellular chemical species (G, SA, AA, and FA) are expressed in moles while the intracellular chemical species (G3P, PEP, and P) are expressed in mol X−1. As for ATP and ADP, they are considered dimensionless due to their very low cell concentrations compared to all the other state variables (McKinlay et al., 2007).
The νi and ni coefficients, present in all mass balances, represent the different stoichiometric ratios of the chemical reactions considered for each process.
Furthermore, the energy cost of the production and secretion of acids is assumed to increase with the external concentration of such acids. This phenomenon was modeled with three metabolic response curves which are a function of the external concentrations of SA, AA, and FA and which dynamically simulate the increase in resistance to extrusion (concentration gradient) of the fermentation products, formulated as:
where k5, k6 and k7 are the slope affinity for each response curve; SAmid, AAmid and FAmid are the acid middle concentrations at which the phenomenon begins to be strongly inhibited; while MWSA, MWAA and MWFA are the molecular weight of the three acids.
As for the ATP and ADP balances, it was necessary to add a term that prevents the dilution over time of their cellular concentration due to microbial growth .
The model has been used to simulate the anaerobic batch culture of A. succinogenes growing on glucose as carbon source of the experiments reported by Ferone et al. (2017). Cell death was not considered because it was not experienced in the experimental tests (Ferone et al., 2017).
The set of initial values of the state variables for each experiment (G1, G2, G3, G4, and G5) is described in Table 1. The initial values of ATP and ADP were obtained assuming that the sum of their concentrations in the cell is approximately constant. Their initial dimensionless quantity has been obtained by using Equation 20 by making two assumptions: (i) their sum (sATP) = 1 mol X−1; (ii) their concentrations are perfectly equal at time t0:
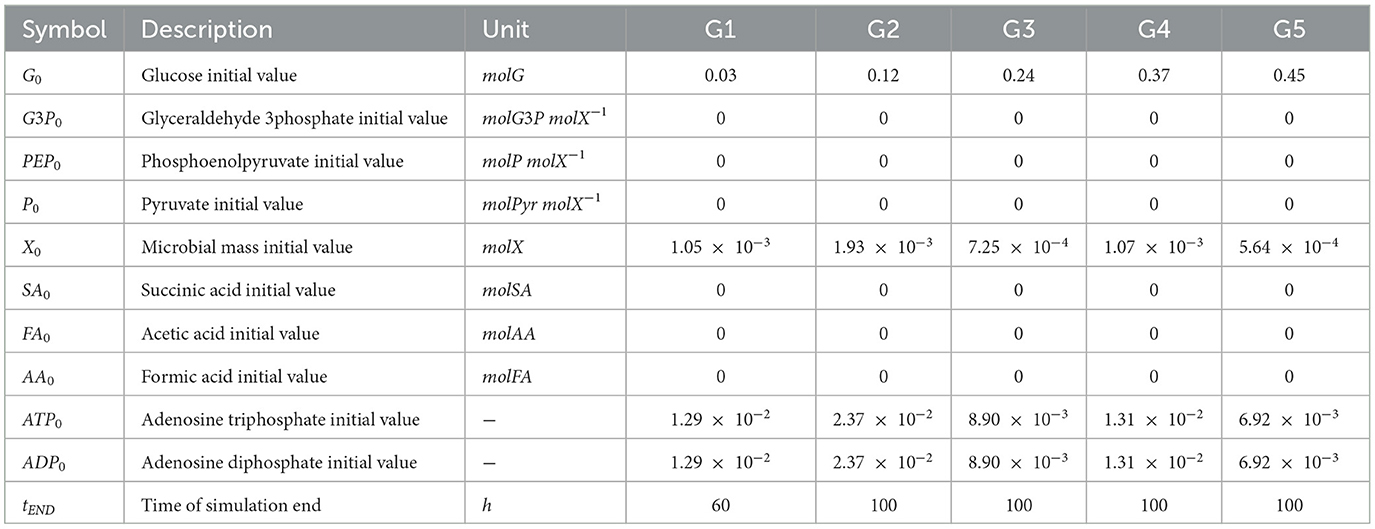
Table 1. State variables initial values and simulation setup parameters.
Fixed and calibrated parameters are described in Tables 2, 3, respectively.
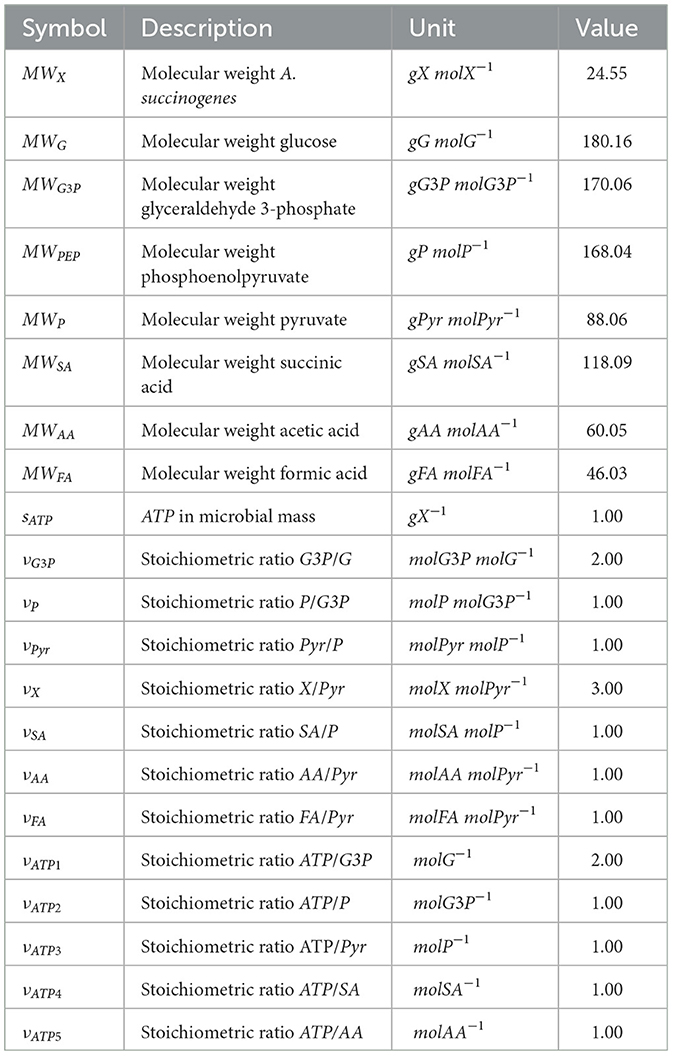
Table 2. Model's fixed parameters.
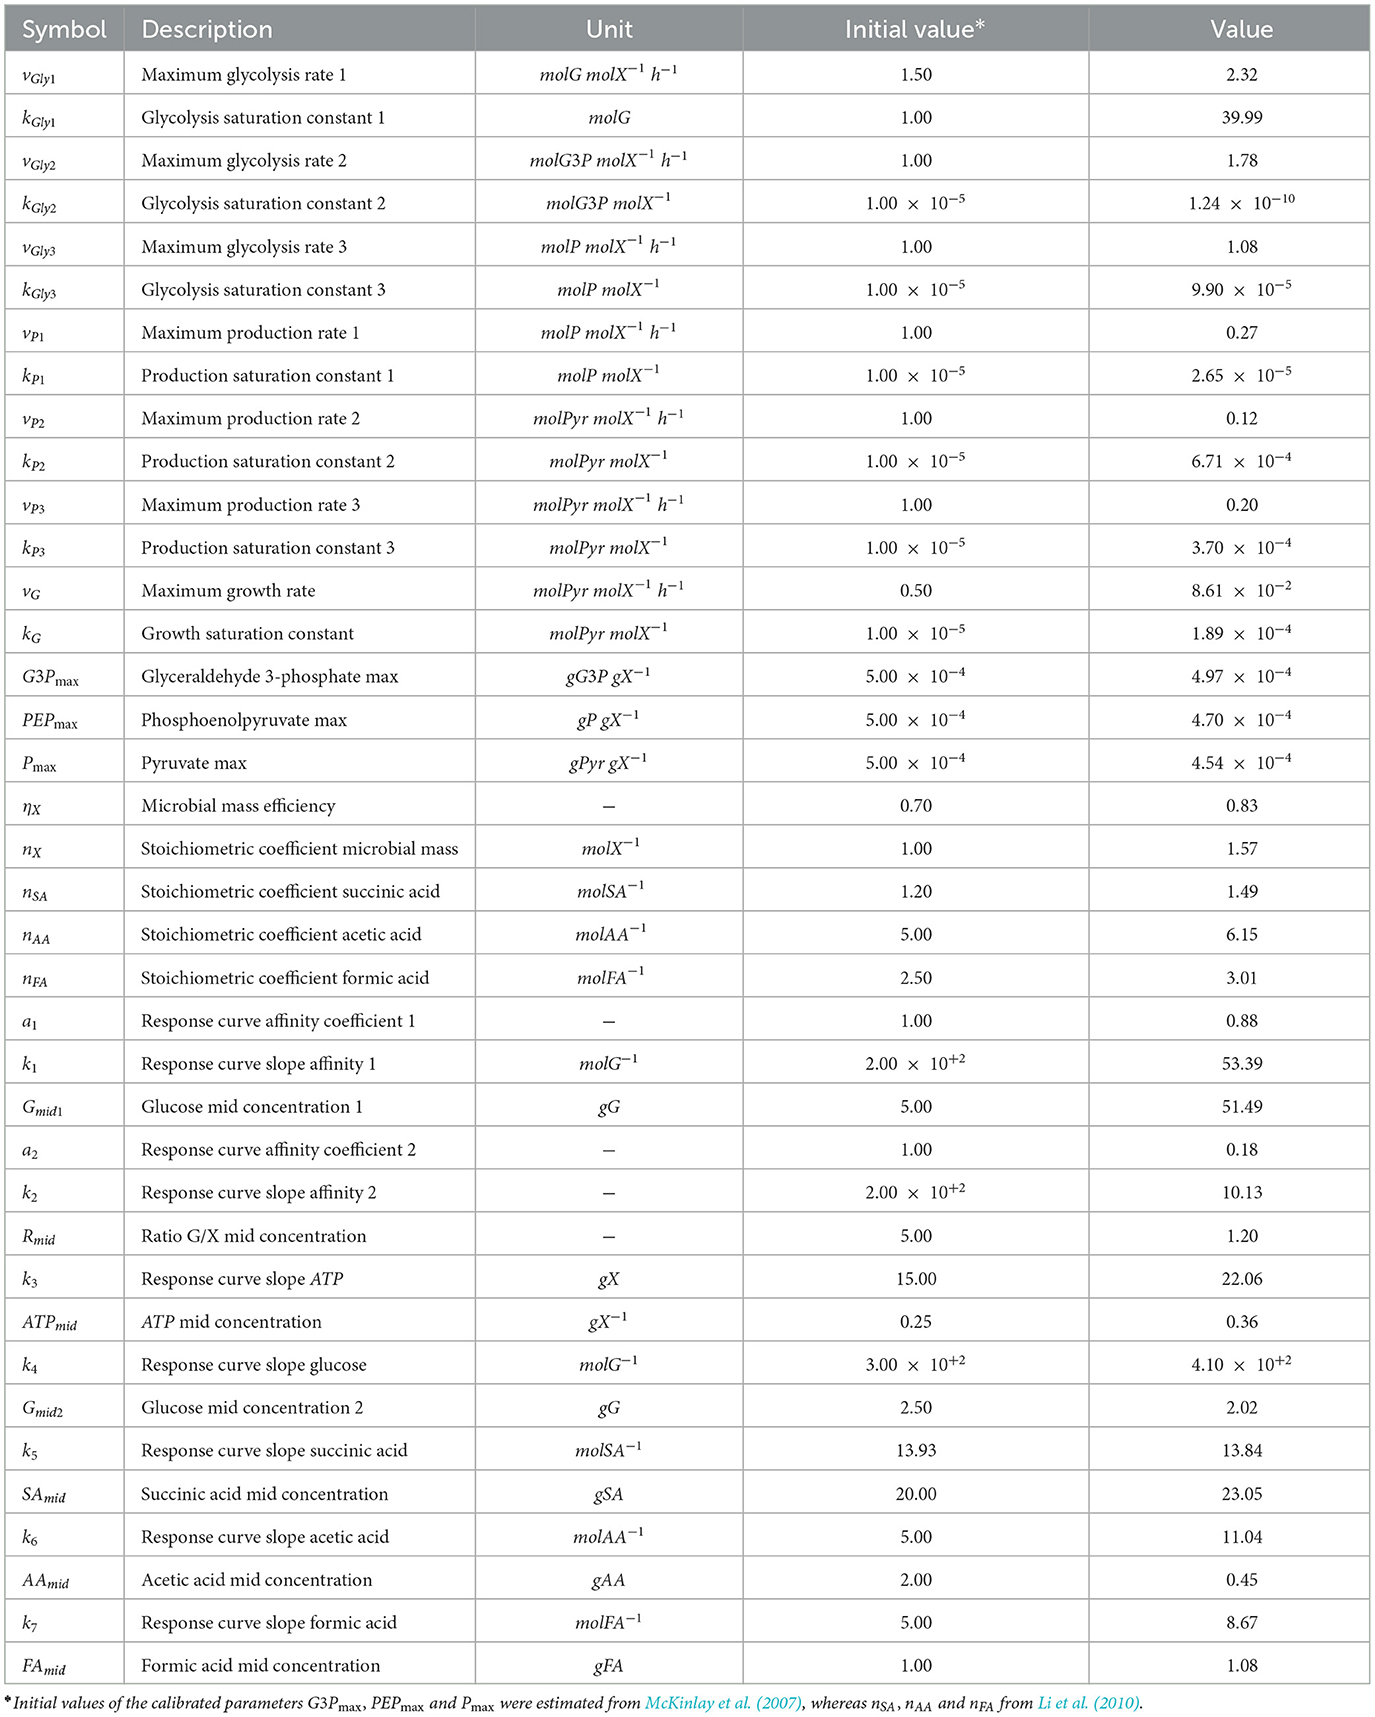
Table 3. Model calibrated parameters.
The mathematical equations were integrated using MATLAB R2023a (the MathWorks) with a variable order solver (ode15s). The model calibration was performed by minimizing the sum of the squared errors (SSE):
where C represents the generic state variable for which experimental data are available (G, X, SA, AA and FA), N is the number of outputs available per experiment, S is the number of state variables, finally T represents the total number of tests conducted. Minimization was performed using the MATLAB fminsearch routine, which implements a Nelder-Mead simplex algorithm (Lagarias et al., 1998).
A sensitivity analysis was also implemented to observe the behavior of the model when subjected to parametric perturbation. Using a local sensitivity analysis (Morris, 1991; Norton, 2015), the sensitivity index was calculated by varying, one at a time, each calibrated parameter by ± 5%:
SSEm, Δ, is the standardized elemental effect of the pm parameter, calculated with respect to biomass and succinic acid, perturbed by (± 5%), and calculated with respect to the value assumed by the state variable using the set of calibration parameters. Finally, n represents the number of parameters to be analyzed.
The model has been used to simulate the anaerobic batch culture of A. succinogenes DSM 22257 strain growing on glucose as carbon source, as reported in batch fermentation tests performed at five different initial glucose concentrations, 5.40, 21.75, 42.65, 67.45, and 80.70 g L−1 (from here we will refer to them as G1, G2, G3, G4, and G5) (Ferone et al., 2017). The cells were cultivated in Pyrex anaerobic bottles (100 mL) containing 75 mL medium, under a nitrogen atmosphere. The fermentation medium per liter included: 5 g of yeast extract, 1 g of NaCl, 0.3 g of Na2HPO4, 1.4 g of NaH2PO4, 1.5 g of K2HPO4, 0.2 g of MgCl2·6H2O, and 0.23 g of CaCl2·2H2O. To serve as an indirect CO2 source and help maintain pH stability during cell growth, MgCO3 was added in suspension at an initial concentration of 5–30 g/L. All the fermentation tests were stopped when the concentrations of cells, glucose, and metabolites were constant for more than 24 h (Ferone et al., 2017). Figure 3 shows the model simulations and the corresponding experimental data of residual glucose, microbial mass, and acids in the medium, monitored during the entire time course of the five batch tests performed.
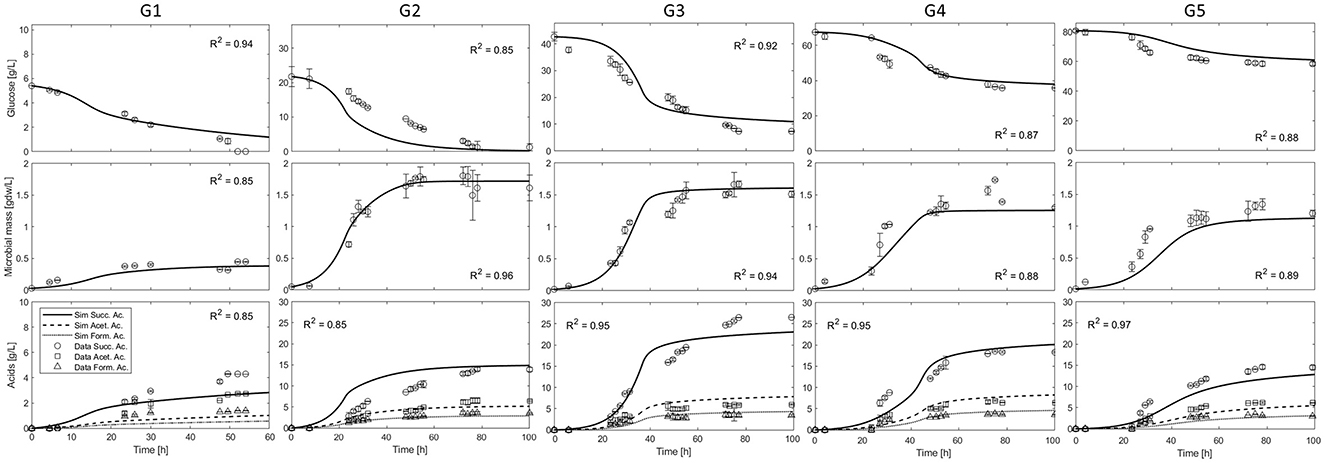
Figure 3. Simulations and experimental data of A. succinogenes growth and production of five batch experiments with different initial glucose concentrations: G1 = 5.40 g L−1; G2 = 21.75 g L−1; G3 = 42.65 g L−1; G4 = 67.45 g L−1; G5 = 80.70 g L−1 (Ferone et al., 2017).
The observed trends in Figure 3 show that no significant initial lag phase under the reported conditions, i.e., the exponential cell growth phase was coupled with fast glucose consumption and simultaneous acid (SA, AA, and FA) production in all cases. The maximum cell density (about 1.60 g/L) was obtained in the experiment G2; higher concentrations of initial glucose (G3-5) resulted in the production of less biomass, clearly indicating an inhibition phenomenon. In all experiments, after about 30–40 h cell growth stopped, with the glucose consumption rate slowing down, while FA and AA concentrations approached a constant value. Instead, the principal fermentation product SA was continuously produced up to a final constant concentration, with an apparent decoupling between growth and its production. The maximum observed SA concentration was about 30.0 g/L in the experiment G3. At higher concentrations of glucose (G4 and G5), the maximum SA concentration decreased to values below 20.0 g/L. As regards the formation of the other two acids (AA and FA), the maximum concentrations remained fairly constant between the different experiments with the exception of G1. Comparatively, the concentrations of these acids (AA and FA) were significantly lower than that of SA, whatever the initial glucose concentration.
An interesting observation is that the microorganism consumed all the available sugar up to the concentration of ≈20 g/L (G1 and G2), whereas it was not able to consume all the supplied glucose in the case of higher initial sugar concentrations (G3, G4, and G5).
As can be seen from the simulation curves calibrated over the entire experimental dataset (Figure 3), the microbial mass, glucose and acids dynamics are well described, both in the exponential growth and in the slowdown phases. As can also be observed in Figure 3 (G1), although the microbial growth is well described, the mathematical model does not fully capture the acid production for this case, which is apparently underestimated. This result is due to the lower glucose uptake, which leads to incomplete glucose consumption, resulting in a correct final mass balance. On the other hand, Figure 3 (G2) clearly shows that the transient data for glucose consumption and succinic acid production are overestimated. Nevertheless, the model successfully describes the steady state of the bioreactor and its achievement in the last 20 h.
Figure 4 provides a summary of the simulation results with the three parity plots showing a very good agreement between the measured and simulated values for all the experiments related to glucose, microbial mass and acids (Figures 4A–C, respectively).
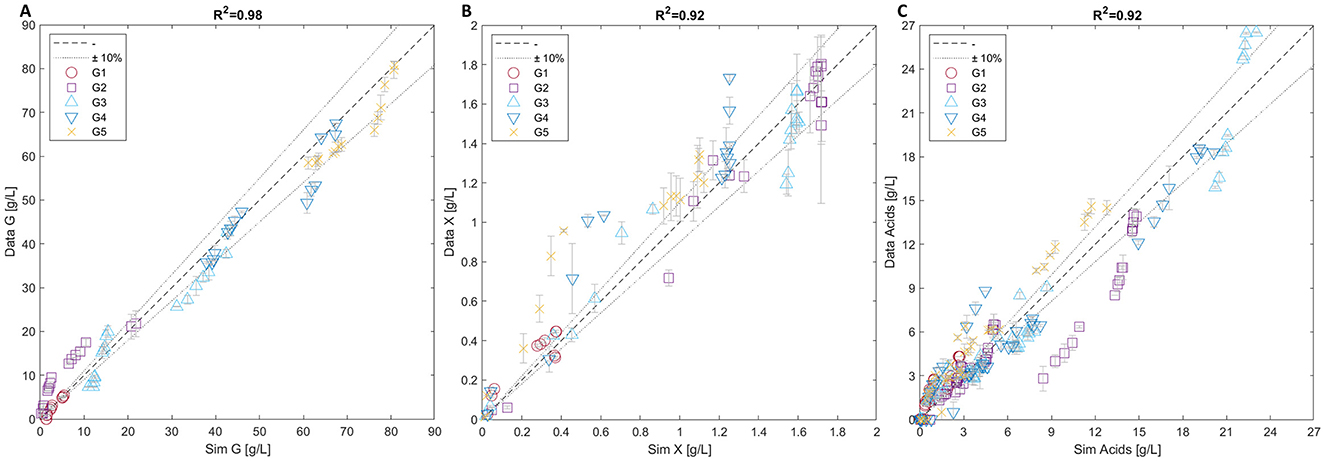
Figure 4. Parity plots of glucose (A), microbial mass (B), and acids (C). Each plot includes data from all five batch experiments (G1-5).
Figure 5 shows the results, in terms of maximum achieved microbial mass and SA production, of repeated simulations of the batch cultures with increasing initial glucose concentration. Regarding the achieved microbial mass, the absolute maximum is achieved between 20 and 30 g L−1 of initial glucose then slightly decreasing at higher concentrations. On the other hand, SA production increases more slowly, peaking between 50 and 60 g L−1 of initial glucose while significantly decreasing at higher values.
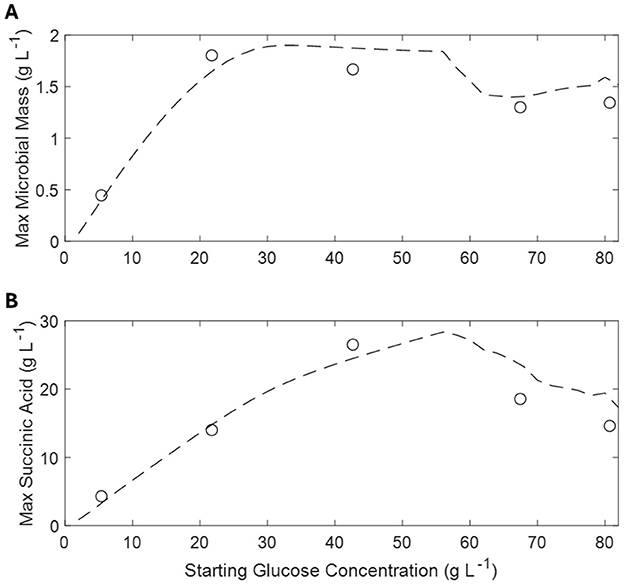
Figure 5. Simulated and observed maximum microbial mass (A) and corresponding succinic acid production at different glucose concentrations (B). Simulations are indicated by dashed lines and observations by open circles.
The results of the sensitivity analysis are presented in Figure 6. This purely mathematical analysis illustrates the responsiveness of the model to the variability of the parameters (±5%) in the evaluation of the state variables, using the estimated coefficients of the fit as a reference.
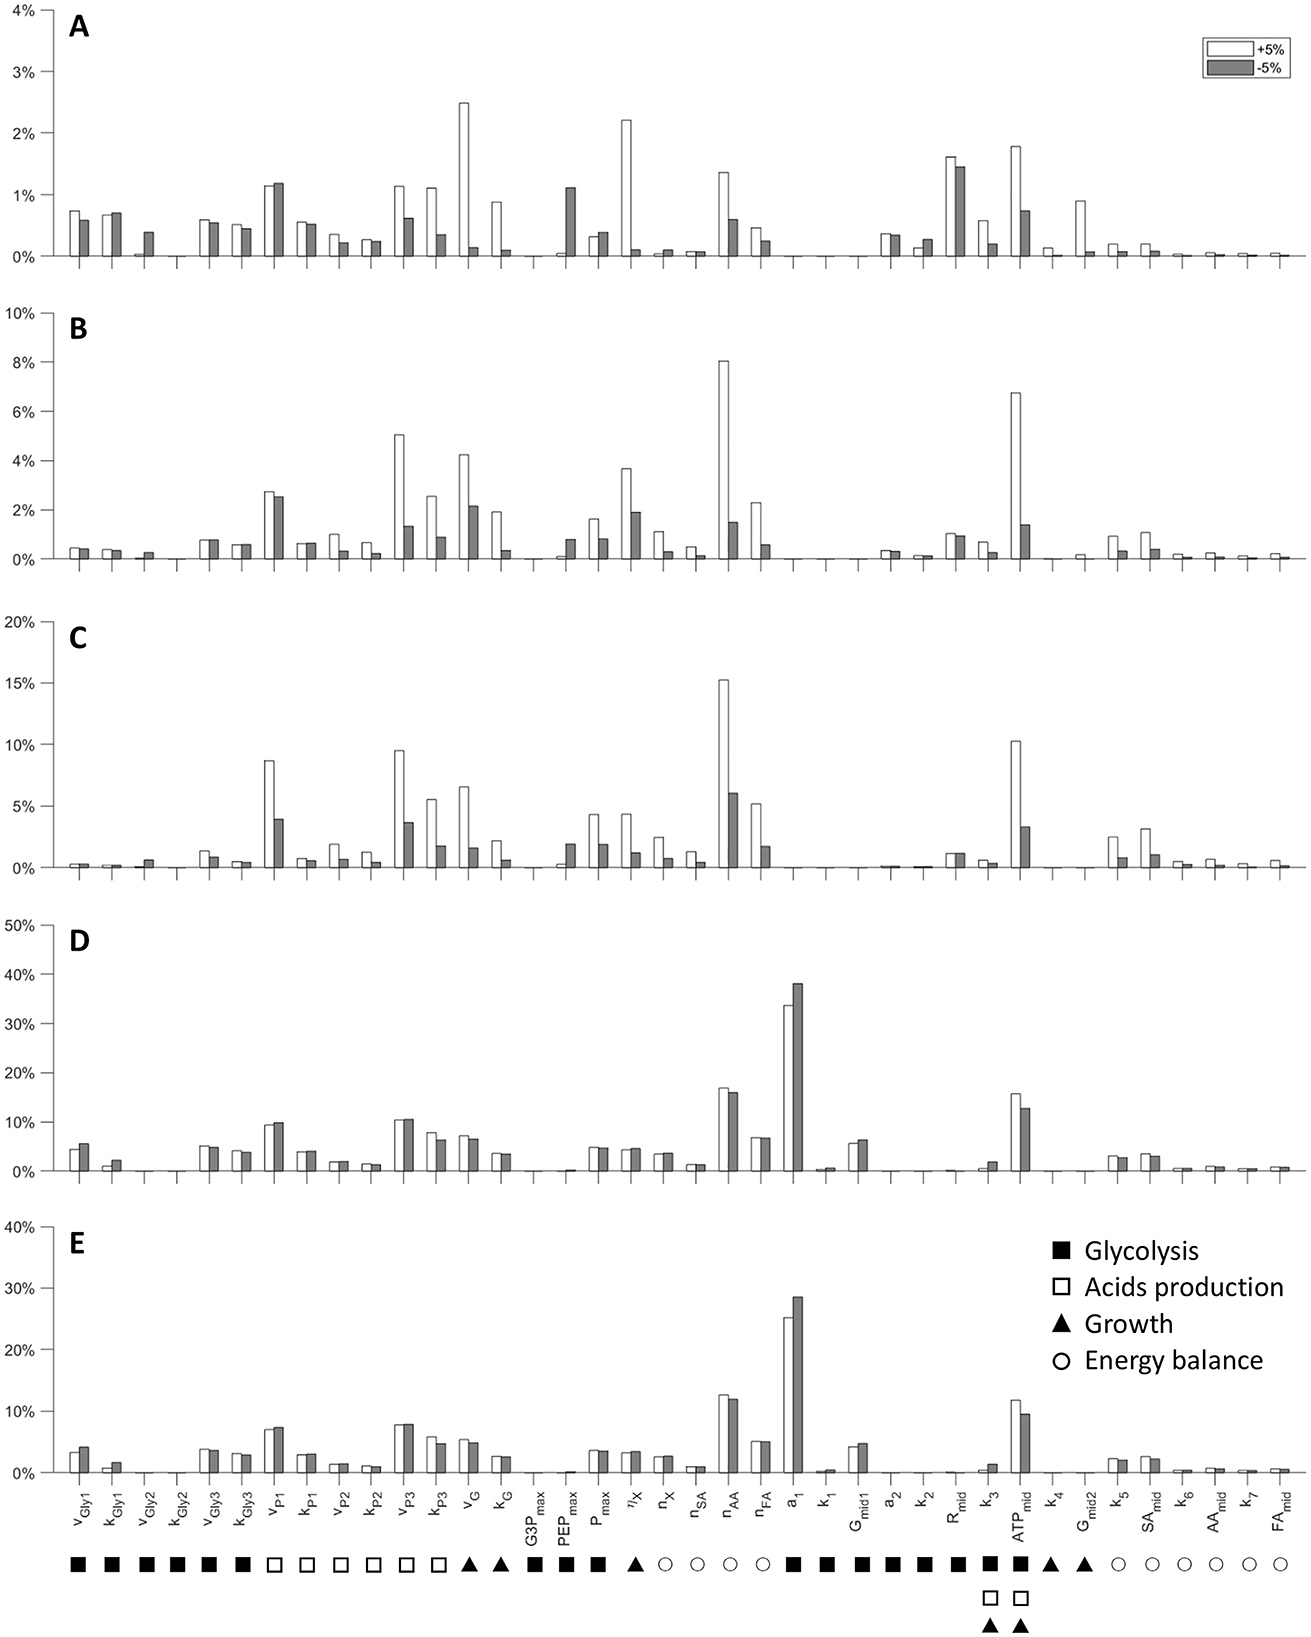
Figure 6. Model parameters local sensitivity analysis. Variation of the model outcome for changes (±5%) in the values of each parameter for all the experiment (see Material and methods for details). (A) G1 = 5.40 g L−1; (B) G2 = 21.75 g L−1; (C) G3 = 42.65 g L−1; (D) G4 = 67.45 g L−1; (E) G5 = 80.70 g L−1. Parameters are grouped in relation to the main processes they influence (symbols under each parameter name).
It is interesting to note that the model has the lowest sensitivity to parameters when simulating low initial concentration of glucose (G1) compared to other experiments (from G2 to G5). For instance, the mathematical analysis of case G1, in which both the acids produced, and the glucose consumed are underestimated, shows that the microbial growth parameters (vG, ηG) have the greatest influence, with a total variation between 2% and 2.5%. The parameters related to glucose uptake (vGly1, kGly1, Rmid) are the second most significant, which shows that even a 5 % increase in these parameters can lead to higher sugar consumption. This in turn promotes conversion to acids, which could improve the suitability of the model to describe the experimental data. In the latter cases (high initial glucose concentrations) the model shows a very marked dependence toward some parameters: a1, vP3, nAA, and ATPmid. As regards a1, its considerable sensitivity arises from the nature of the response curve to which it is linked. Indeed, a1 is the minimum value at which the logistic function tends in the presence of high concentrations of G, therefore, increasing the parameter means canceling the uptake while decreasing it means speeding it up. The variables vP3 and nAA are related to the maximum rate of secondary acid production and to the amount of ATP consumed for the extrusion of AA. Finally, ATPmid represents the concentration of ATP at which the logistics of the energy response curve assumes a value of 0.5. Clearly it is an extremely sensitive parameter since it intervenes in a crucial way on the beginning of the energy crisis.
Recently, a report was published by Nova Institut, which highlighted the key drivers and inhibitors for bio-based SA production growth and market success (Chinthapalli et al., 2019). The industrial development of bio-based SA production processes mainly depends on the following key actions: (i) the selection of a proper SA-producing microorganism (Choi et al., 2016); (ii) the selection of a cost-effective and abundant biomass to produce hexose and pentose sugars via thermochemical or enzymatic treatments (Stylianou et al., 2020; Ferone et al., 2019a); (iii) the development of a reliable bioreactor characterized by high throughput (Ferone et al., 2019b); (iv) the determination of optimal operating conditions for SA production (Meynial-Salles et al., 2008); (v) the development of an effective recovery process (De Wever and Dennewald, 2018; Salma et al., 2021). As regards the key issue iv, kinetic modeling is considered a necessary step in developing a fermentation process since the models can be used to determine optimal operating conditions to produce a target metabolite.
In our view, system dynamics modeling approach represents a relevant tool to understand interactions underlying metabolic processes. In previous modeling works on yeast and bacteria model organisms, we demonstrated how a very simplified process-based model could be used to represent with high robustness microbial growth, metabolic shift between fermentation and respiration, and the onset of inhibition in high cell density cultures due to the secretion and accumulation of an inhibitory compound in the culture medium (Carteni et al., 2020; Mazzoleni et al., 2015).
In this work, the presented process-based model is able to represent the complex interactions between the starting concentration levels of the carbon source (glucose) in the growth medium and the dynamic metabolic status of the cells. In the model a pivotal role for ATP/ADP balance inside the cell is assumed. The rationale behind this is that the acidity of the fermentation products accumulating during the process, affects the energy costs of the cell, due to the energy demand for the secretion of acids and the maintenance of the intracellular pH (Russell and Cook, 1995; van Bodegom, 2007). Thus, as glucose concentration increases, acid production increases, resulting in a higher ATP consumption up to provoking an energy crisis inside the cell. This critical condition determines the slowing down of the physiological processes leading to growth so that less microbial mass is produced. However, glycolysis (Gly1) is still active and continues to deplete intracellular ATP. Finally, to avoid a complete energy crisis leading to cell death, the uptake of glucose is stopped, so that glucose remains unconsumed in the culture medium. The model takes into account this behavior, assuming that A. succinogenes is able to finely regulate the uptake of glucose. Such regulation is typical of the so-called Crabtree negative species (Shimizu and Matsuoka, 2019), which differ from the Crabtree positive ones, such as the yeast S. cerevisiae, in which the necessity to avoid sugar-induced cell death is addressed shifting metabolism from respiration to fermentation (de Alteriis et al., 2018).
On the basis of such assumptions, the proposed model well describes the observed experimental behavior of A. succinogenes in batch cultures as a function of initial glucose concentration, showing that a maximum of succinic acid is obtained between 50 and 60 g L−1 of initial glucose (Figure 5). This optimal initial glucose concentration matches the experimental evidence by other authors in batch cultures (Liu et al., 2008). The maintenance of residual glucose below a critical concentration, as the model suggests, can be easily achieved in a fed-batch reactor, by using a controlled glucose feeding. Indeed, this operative strategy has been reported to enhance SA concentration and productivity (Liu et al., 2008; Ferone et al., 2019a).
However, some significant deviations between simulated and measured acids productions were observed in specific culture conditions. In particular, regarding AA and FA the higher discrepancy between simulations and observations happens at the lowest glucose concentration conditions (G1) where all the productions are underestimated by the model. Regarding SA, the highest discrepancy is observed in the initial phases of the G2 experiment, although the final production of succinic acid is correctly simulated (Figure 3). This likely reflects the lack of an explicit NADH/NAD+ balance and its role in coupling the SA production (C4 pathway) with the FA and AA pathways (C3 pathway). The C3 pathway with formation of acetate and formate is indeed necessary for the production of the additional reducing power (NADH) needed for SA formation by the C4 pathway. In conclusion, the coupling between these different pathways through the NADH/NAD+ balance might further improve the dynamics of acids productions and, in particular, reduce the early overproduction of SA estimated by the model simulations.
The presented model was able to effectively reproduce the production of succinic acid and the corresponding dynamic trends of microbial growth and glucose consumption. In particular, it shows that the maximal production of succinic acid is achieved in conditions leading to glucose uptake limitation. The mechanism of metabolic regulation is assumed to be mainly associated with the ATP/ADP balance, dynamically explaining the effect of excess glucose on microbial growth and production. Further refinement of the model should also explicitly consider the role of NADH/NAD+ balance in the coupling of the metabolic pathways leading to acids production.
Additional investigation is necessary to validate the presented modeling assumptions, specifically the effect of the energy balance on metabolic regulation, by measuring the concentration of intracellular ATP and ADP in different stages of the population growth cycle.
In conclusion, the process-based modeling approach has revealed a strategic tool to effectively describe the main metabolic processes and their regulation, and consequently useful to better define working conditions and overcome the criticalities of the SA fermentation process.
The datasets analyzed for this study can be found in Ferone et al. (2017): https://doi.org/10.1007/s12010-017-2514-4.
ES: Conceptualization, Formal analysis, Software, Writing – original draft, Writing – review & editing. FC: Conceptualization, Formal analysis, Investigation, Methodology, Software, Supervision, Visualization, Writing – review & editing. FG: Conceptualization, Formal analysis, Funding acquisition, Writing – review & editing, Project administration. EA: Conceptualization, Writing – original draft, Writing – review & editing. FR: Data curation, Investigation, Visualization, Writing – review & editing. SM: Conceptualization, Supervision, Writing – original draft, Writing – review & editing.
The author(s) declare financial support was received for the research, authorship, and/or publication of this article. This work has been funded by the project MOD_DEV_CELL “System Dynamics modeling of microbial cell cultures: numerical methods, process optimization, and individual-based approach” financed by the University of Naples Federico II 2017-2019, managed by FG. The project also supported the work of ES.
The authors declare that the research was conducted in the absence of any commercial or financial relationships that could be construed as a potential conflict of interest.
The author(s) declared that they were an editorial board member of Frontiers, at the time of submission. This had no impact on the peer review process and the final decision.
The author(s) declare that no Gen AI was used in the creation of this manuscript.
All claims expressed in this article are solely those of the authors and do not necessarily represent those of their affiliated organizations, or those of the publisher, the editors and the reviewers. Any product that may be evaluated in this article, or claim that may be made by its manufacturer, is not guaranteed or endorsed by the publisher.
AA, Acetic Acid; ADP, Adenosine diphosphate; ATP, Adenosine triphosphate; FA, Formic Acid; G, Glucose; G3P, Glyceraldehyde-3-phosphate; MM, Michaelis–Menten; PEP, Phosphoenolpyruvate; P, Pyruvate; SA, Succinic Acid; X, Microbial mass.
Akhtar, J., Idris, A., and Abd. Aziz, R. (2014). Recent advances in production of succinic acid from lignocellulosic biomass. Appl. Microbiol. Biotechnol. 98, 987–1000. doi: 10.1007/s00253-013-5319-6
Almqvist, H., Pateraki, C., Alexandri, M., Koutinas, A., and Lidén, G. (2016). Succinic acid production by Actinobacillus succinogenes from batch fermentation of mixed sugars. J. Indus. Microbiol. Biotechnol. 43, 1117–1130. doi: 10.1007/s10295-016-1787-x
Boiteux, A., and Hess, B. (1981). Design of glycolysis. Philos. Transac. Royal Soc. Lond. B Biol. Sci. 293, 5–22. doi: 10.1098/rstb.1981.0056
Bradfield, M. F. A., and Nicol, W. (2014). Continuous succinic acid production by Actinobacillus succinogenes in a biofilm reactor: steady-state metabolic flux variation. Biochem. Eng. J. 85, 1–7. doi: 10.1016/j.bej.2014.01.009
Carteni, F., Occhicone, A., Giannino, F., Vincenot, C. E., de Alteriis, E., Palomba, E., et al. (2020). A general process-based model for describing the metabolic shift in microbial cell cultures. Front. Microbiol. 11:521368. doi: 10.3389/fmicb.2020.521368
Chatterjee, R., Millard, C. S., Champion, K., Clark, D. P., and Donnelly, M. I. (2001). Mutation of the ptsG Gene Results in Increased Production of Succinate in Fermentation of Glucose by Escherichia coli. Appl. Environ. Microbiol. 67, 148–154. doi: 10.1128/AEM.67.1.148-154.2001
Chinthapalli, R., Puente, Á., Skoczinski, P., Raschka, A., and Carus, M. (2019). Succinic Acid: From a Promising Building Block to a Slow Seller—What Will a Realistic Future Market Look Like? Available online at: http://www.bio-based.eu/reports/ (accessed October 15 2024).
Choi, S., Song, H., Lim, S. W., Kim, T. Y., Ahn, J. H., Lee, J. W., et al. (2016). Highly selective production of succinic acid by metabolically engineered Mannheimia succiniciproducens and its efficient purification. Biotechnol. Bioeng. 113, 2168–2177. doi: 10.1002/bit.25988
Corona-González, R. I., Bories, A., González-Álvarez, V., and Pelayo-Ortiz, C. (2008). Kinetic study of succinic acid production by Actinobacillus succinogenes ZT-130. Process Biochem. 43, 1047–1053. doi: 10.1016/j.procbio.2008.05.011
de Alteriis, E., Cartenì, F., Parascandola, P., Serpa, J., and Mazzoleni, S. (2018). Revisiting the Crabtree/Warburg effect in a dynamic perspective: a fitness advantage against sugar-induced cell death. Cell Cycle, 17, 688–701. doi: 10.1080/15384101.2018.1442622
de Alteriis, E., Incerti, G., Cartenì, F., Chiusano, M. L., Colantuono, C., Palomba, E., et al. (2023). Extracellular DNA secreted in yeast cultures is metabolism-specific and inhibits cell proliferation. Microbial Cell. 10, 277–295. doi: 10.15698/mic2023.12.810
De Deken, R. H. (1966). The crabtree effect: a regulatory system in yeast. J. Gen. Microbiol. 44, 149–156. doi: 10.1099/00221287-44-2-149
de Falco, B., Giannino, F., Carteni, F., Mazzoleni, S., and Kim, D.-H. (2022). Metabolic flux analysis: a comprehensive review on sample preparation, analytical techniques, data analysis, computational modelling, and main application areas. RSC Adv. 12, 25528–25548. doi: 10.1039/D2RA03326G
De Wever, H., and Dennewald, D. (2018). Screening of sorbents for recovery of succinic and itaconic acid from fermentation broths. J. Chem. Technol. Biotechnol. 93, 385–391. doi: 10.1002/jctb.5366
Ercole, A., Raganati, F., Salatino, P., and Marzocchella, A. (2021). Continuous succinic acid production by immobilized cells of Actinobacillus succinogenes in a fluidized bed reactor: entrapment in alginate beads. Biochem. Eng. J. 169:107968. doi: 10.1016/j.bej.2021.107968
Ferone, M., Ercole, A., Raganati, F., Olivieri, G., Salatino, P., Marzocchella, A., et al. (2019a). Efficient succinic acid production from high-sugar-content beverages by Actinobacillus succinogenes. Biotechnol. Prog. 35:e2863. doi: 10.1002/btpr.2863
Ferone, M., Raganati, F., Olivieri, G., and Marzocchella, A. (2019b). Bioreactors for succinic acid production processes. Crit. Rev. Biotechnol. 39, 571–586. doi: 10.1080/07388551.2019.1592105
Ferone, M., Raganati, F., Olivieri, G., Salatino, P., and Marzocchella, A. (2017). Biosuccinic acid from lignocellulosic-based hexoses and pentoses by Actinobacillus succinogenes: characterization of the conversion process. Appl. Biochem. Biotechnol. 183, 1465–1477. doi: 10.1007/s12010-017-2514-4
Fukuzaki, S., Nishio, N., Shobayashi, M., and Nagai, S. (1990). Inhibition of the fermentation of propionate to methane by hydrogen, acetate, and propionate. Appl. Environ. Microbiol. 56, 719–723. doi: 10.1128/aem.56.3.719-723.1990
Lagarias, J. C., Reeds, J. A., Wright, M. H., and Wright, P. E. (1998). Convergence properties of the nelder–mead simplex method in low dimensions. SIAM J. Optimiz. 9, 112–147. doi: 10.1137/S1052623496303470
Li, Q., Wang, D., Wu, Y., Yang, M., Li, W., Xing, J., et al. (2010). Kinetic evaluation of products inhibition to succinic acid producers Escherichia coli NZN111, AFP111, BL21, and Actinobacillus succinogenes 130ZT. J. Microbiol. 48, 290–296. doi: 10.1007/s12275-010-9262-2
Lin, S. K. C., Du, C., Koutinas, A., Wang, R., and Webb, C. (2008). Substrate and product inhibition kinetics in succinic acid production by Actinobacillus succinogenes. Biochem. Eng. J. 41, 128–135. doi: 10.1016/j.bej.2008.03.013
Liu, Y., Zheng, P., Sun, Z., Ni, Y., Dong, J., Wei, P., et al. (2008). Strategies of pH control and glucose-fed batch fermentation for production of succinic acid by Actinobacillus succinogenes CGMCC1593. J. Chem. Technol. Biotechnol. 83, 722–729. doi: 10.1002/jctb.1862
Mazzoleni, S., Landi, C., Cartenì, F., de Alteriis, E., Giannino, F., Paciello, L., et al. (2015). A novel process-based model of microbial growth: self-inhibition in Saccharomyces cerevisiae aerobic fed-batch cultures. Microb. Cell Fact. 14:109. doi: 10.1186/s12934-015-0295-4
McKinlay, J. B., Shachar-Hill, Y., Zeikus, J. G., and Vieille, C. (2007). Determining Actinobacillus succinogenes metabolic pathways and fluxes by NMR and GC-MS analyses of 13C-labeled metabolic product isotopomers. Metab. Eng. 9, 177–192. doi: 10.1016/j.ymben.2006.10.006
Meynial-Salles, I., Dorotyn, S., and Soucaille, P. (2008). A new process for the continuous production of succinic acid from glucose at high yield, titer, and productivity. Biotechnol. Bioeng. 99, 129–135. doi: 10.1002/bit.21521
Mor, I., Cheung, E. C., and Vousden, K. H. (2011). Control of glycolysis through regulation of PFK1: old friends and recent additions. Cold Spring Harb. Symp. Quant. Biol. 76, 211–216. doi: 10.1101/sqb.2011.76.010868
Morris, M. D. (1991). Factorial sampling plans for preliminary computational experiments. Technometrics. 33, 161–174. doi: 10.1080/00401706.1991.10484804
Neumann, S., Grosse, K., and Sourjik, V. (2012). Chemotactic signaling via carbohydrate phosphotransferase systems in Escherichia coli. Proc. Nat. Acad. Sci. 109, 12159–12164. doi: 10.1073/pnas.1205307109
Norton, J. (2015). An introduction to sensitivity assessment of simulation models. Environ. Modell. Softw. 69, 166–174. doi: 10.1016/j.envsoft.2015.03.020
Paczia, N., Nilgen, A., Lehmann, T., Gätgens, J., Wiechert, W., Noack, S., et al. (2012). Extensive exometabolome analysis reveals extended overflow metabolism in various microorganisms. Microb. Cell Fact. 11:122. doi: 10.1186/1475-2859-11-122
Pateraki, C., Almqvist, H., Ladakis, D., Lidén, G., Koutinas, A. A., Vlysidis, A., et al. (2016a). Modelling succinic acid fermentation using a xylose based substrate. Biochem. Eng. J. 114, 26–41. doi: 10.1016/j.bej.2016.06.011
Pateraki, C., Patsalou, M., Vlysidis, A., Kopsahelis, N., Webb, C., Koutinas, A. A., et al. (2016b). Actinobacillus succinogenes: advances on succinic acid production and prospects for development of integrated biorefineries. Biochem. Eng. J. 112, 285–303. doi: 10.1016/j.bej.2016.04.005
Plumbridge, J. (1998). Expression of ptsG, the gene for the major glucose PTS transporter in Escherichia coli, is repressed by Mlc and induced by growth on glucose. Mol. Microbiol. 29, 1053–1063. doi: 10.1046/j.1365-2958.1998.00991.x
Prabhu, A. A., Ledesma-Amaro, R., Lin, C. S. K., Coulon, F., Thakur, V. K., Kumar, V., et al. (2020). Bioproduction of succinic acid from xylose by engineered Yarrowia lipolytica without pH control. Biotechnol. Biofuels. 13:113. doi: 10.1186/s13068-020-01747-3
Rigaki, A., Webb, C., and Theodoropoulos, C. (2020). Double substrate limitation model for the bio-based production of succinic acid from glycerol. Biochem. Eng. J. 153:107391. doi: 10.1016/j.bej.2019.107391
Russell, J. B., and Cook, G. M. (1995). Energetics of bacterial growth: balance of anabolic and catabolic reactions. Microbiol. Rev. 59, 48–62. doi: 10.1128/mr.59.1.48-62.1995
Salma, A., Djelal, H., Abdallah, R., Fourcade, F., and Amrane, A. (2021). Platform molecule from sustainable raw materials; case study succinic acid. Braz. J. Chem. Eng. 38, 215–239. doi: 10.1007/s43153-021-00103-8
Samuoelov, N. S., Datta, R., Jain, M. K., and Zeikus, J. (1990). Microbial decarboxylation of succinate to propionate. Ann. N. Y. Acad. Sci. 589, 697–704. doi: 10.1111/j.1749-6632.1990.tb24282.x
Sánchez, A. M., Bennett, G. N., and San, K-. Y. (2005). Novel pathway engineering design of the anaerobic central metabolic pathway in Escherichia coli to increase succinate yield and productivity. Metab. Eng. 7, 229–239. doi: 10.1016/j.ymben.2005.03.001
Shimizu, K., and Matsuoka, Y. (2019). Regulation of glycolytic flux and overflow metabolism depending on the source of energy generation for energy demand. Biotechnol. Adv. 37, 284–305. doi: 10.1016/j.biotechadv.2018.12.007
Song, H., Jang, S. H., Park, J. M., and Lee, S. Y. (2008). Modeling of batch fermentation kinetics for succinic acid production by Mannheimia succiniciproducens. Biochem. Eng. J. 40, 107–115. doi: 10.1016/j.bej.2007.11.021
Song, H., and Lee, S. Y. (2006). Production of succinic acid by bacterial fermentation. Enzyme Microb. Technol. 39, 352–361. doi: 10.1016/j.enzmictec.2005.11.043
Stylianou, E., Pateraki, C., Ladakis, D., Cruz-Fernández, M., Latorre-Sánchez, M., Coll, C., et al. (2020). Evaluation of organic fractions of municipal solid waste as renewable feedstock for succinic acid production. Biotechnol. Biofuels. 13:72. doi: 10.1186/s13068-020-01708-w
van Bodegom, P. (2007). Microbial maintenance: a critical review on its quantification. Microb. Ecol. 53, 513–523. doi: 10.1007/s00248-006-9049-5
Vemuri, G. N., Eiteman, M. A., and Altman, E. (2002). Effects of growth mode and pyruvate carboxylase on succinic acid production by metabolically engineered strains of Escherichia coli. Appl. Environ. Microbiol. 68, 1715–1727. doi: 10.1128/AEM.68.4.1715-1727.2002
Vlysidis, A., Binns, M., Webb, C., and Theodoropoulos, C. (2011). Glycerol utilisation for the production of chemicals: Conversion to succinic acid, a combined experimental and computational study. Biochem. Eng. J. 58–59, 1–11. doi: 10.1016/j.bej.2011.07.004
Wang, J., Zhang, R., Zhang, Y., Yang, Y., Lin, Y., Yan, Y., et al. (2019). Developing a pyruvate-driven metabolic scenario for growth-coupled microbial production. Metab. Eng. 55, 191–200. doi: 10.1016/j.ymben.2019.07.011
Wisselink, H. W., Toirkens, M. J., del Rosario Franco Berriel, M., Winkler, A. A., van Dijken, J. P., Pronk, J. T., et al. (2007). Engineering of Saccharomyces cerevisiae for efficient anaerobic alcoholic fermentation of L-Arabinose. Appl. Environ. Microbiol. 73, 4881–4891. doi: 10.1128/AEM.00177-07
Wolfe, A. J. (2005). The acetate switch. Microbiol. Mol. Biol. Rev. 69, 12–50. doi: 10.1128/MMBR.69.1.12-50.2005
Zhou, J., Liu, L., Shi, Z., Du, G., and Chen, J. (2009). ATP in current biotechnology: regulation, applications and perspectives. Biotechnol. Adv. 27, 94–101. doi: 10.1016/j.biotechadv.2008.10.005
Keywords: fermentation, bioreactors, system dynamics modeling, microbial growth models, energy balance
Citation: Salucci E, Cartenì F, Giannino F, de Alteriis E, Raganati F and Mazzoleni S (2025) A process-based dynamic model for succinic acid production by Actinobacillus succinogenes: regulatory role of ATP/ADP balance. Front. Microbiol. 16:1512982. doi: 10.3389/fmicb.2025.1512982
Received: 17 October 2024; Accepted: 17 February 2025;
Published: 06 March 2025.
Edited by:
Marie-Joelle Virolle, Centre National de la Recherche Scientifique (CNRS), FranceReviewed by:
Sébastien Bontemps-Gallo, Université de Lille, FranceCopyright © 2025 Salucci, Cartenì, Giannino, de Alteriis, Raganati and Mazzoleni. This is an open-access article distributed under the terms of the Creative Commons Attribution License (CC BY). The use, distribution or reproduction in other forums is permitted, provided the original author(s) and the copyright owner(s) are credited and that the original publication in this journal is cited, in accordance with accepted academic practice. No use, distribution or reproduction is permitted which does not comply with these terms.
*Correspondence: Stefano Mazzoleni, c3RlZmFuby5tYXp6b2xlbmlAdW5pbmEuaXQ=
†These authors have contributed equally to this work and share first authorship
Disclaimer: All claims expressed in this article are solely those of the authors and do not necessarily represent those of their affiliated organizations, or those of the publisher, the editors and the reviewers. Any product that may be evaluated in this article or claim that may be made by its manufacturer is not guaranteed or endorsed by the publisher.
Research integrity at Frontiers
Learn more about the work of our research integrity team to safeguard the quality of each article we publish.