 Jueyu Hou
 Zhongping Lv
 Yujiao Wang
 Danian Chen
95% of researchers rate our articles as excellent or good
Learn more about the work of our research integrity team to safeguard the quality of each article we publish.
Find out more
ORIGINAL RESEARCH article
Front. Microbiol. , 29 January 2025
Sec. Microorganisms in Vertebrate Digestive Systems
Volume 16 - 2025 | https://doi.org/10.3389/fmicb.2025.1479792
This article is part of the Research Topic Rodent model organisms: Therapeutic treatments and drugs interaction with the gut microbiome View all 41 articles
Introduction: Diabetic retinopathy (DR) is the most common complication of diabetes. Neuronal apoptosis, activated microglia, and microvascular changes are early features of DR. The gut microbiota is critical for the maturation and activation of microglia in the brain, and DR patients exhibit gut dysbiosis. However, the effect of the gut microbiota on retinal microglia under normal or diabetic conditions is still unclear.
Methods: Type 2 diabetes (T2D) was established in male adult Brown Norway (BN) rats, and they were treated with gavage of broad-spectrum antibiotic (ABX) suspension. Retinal fundus fluorescein angiography was performed to observe the dynamic growth process and leakage of blood vessels. Retro-orbital injection of FITC-Dextran was performed to observe the changes in blood-retinal barriers. After treatment with ABX and diabetes lasting for more than 6 months, 16S RNA sequencing of stool samples was performed to determine changes in the gut microbiome and mass spectrometry was used to analyze metabolome changes. IBA1, IB4, and Brn3 staining were performed on adult rats’ retinal wholemount or sections to observe the changes in microglia, blood vessels and the number of ganglion cells.
Results: Long-term (6 months) T2D caused gut dysbiosis with increased average taxa numbers. We showed that broad-spectrum antibiotics (ABXs) gavage can reduce the average number of gut microbiota taxa and retinal microglia in adult male BN rats with or without T2D. Interestingly, adult male BN rats with T2D for more than 6 months showed a loss of retinal ganglion cells (RGCs) without significant changes in retinal microglia or retinal vascular vessels. However, ABX gavage reduced retinal microglia and alleviated RGC damage in these T2D rats.
Conclusion: Our data suggests that ABX gavage-induced gut dysbiosis can reduce retinal microglia in adult rats and alleviate RGC loss in long-term T2D rats. Targeting the gut microbiota may be a future therapeutic strategy for DR management.
Diabetic retinopathy (DR) is the most common complication of diabetes. It seriously affects the vision of diabetic patients and is the leading cause of blindness in the working-age population. DR was initially considered a microvascular disease; however, current views agree that early changes in DR also include retinal neurodegeneration and retinal inflammation (Wong et al., 2016). Retinal microglia are essential participants in retinal inflammation. Microglial activation is considered the earliest manifestation of DR inflammation and can occur before Müller cell activation (Zeng et al., 2008; Sorrentino et al., 2016).
Many microorganisms (commensal microbiota) inhabit the mucosal and epidermal surfaces of the human body. Notably, the intestinal tract serves as these microorganisms’ primary site of activity and habitation. The gut microbiota comprises approximately 1013 microbial cells. The main gut bacterial phyla include Firmicutes (60%), Bacteroidetes, and Actinobacteria (Szablewski, 2018). The commensal and their hosts are in a mutually beneficial situation in which the commensal microbiota depends on the host for nutrient acquisition and propagation; in turn, the gut microbiota also plays essential roles in host digestion, mineral uptake, vitamin synthesis, drug metabolism, and immune modulation (Li et al., 2019). Dysbiosis represents a prevalent imbalance in the gut microbiota composition (Robles Alonso and Guarner, 2013). Dysbiosis can alter immune regulatory signals, leading to pathological conditions in many organs (Gritz and Bhandari, 2015). Increasing evidence suggests dysbiosis is closely related to many ocular diseases, including DR (Fu et al., 2023). DR patients (Jayasudha et al., 2020; Das et al., 2021; Huang et al., 2021; Ye et al., 2021; Zhou et al., 2021) and DR animal model, such as db/db mice (Beli et al., 2018), all have gut dysbiosis. Interestingly, intermittent fasting (IF) can prevent DR by regulating the gut microbiota in db/db mice (Beli et al., 2018). The gut microbiota is crucial for the maturation and activation of microglia in the brain (Erny et al., 2015; Thion et al., 2018; Mossad et al., 2022). However, the effect of the gut microbiota on retinal microglia is not fully understood. Whether the gut microbiota plays the same role on normal retinal microglia or microglia under diabetic conditions, as well as whether the gut microbiota can modify DR phenotypes through microglia, are not yet clear.
This study aimed to investigate the effect of gut microbiota on retinal microglia, neurons, and blood vessels in adult diabetic rats and to explore new ideas for DR treatment. We first established a T2D rat model and characterized its gut microbiota changes. We then administered broad-spectrum antibiotics (ABX) by gavage to mimic germ-free (GF) conditions (Bayer et al., 2019; Kennedy et al., 2018). We found that ABX gavage-induced gut dysbiosis could reduce the number of retinal microglia in adult rats. ABX gavage alleviated RGC loss in long-term T2D animals by reducing the number of retinal microglia.
Specific pathogen-free (SPF)-grade male Brown Norway (BN) rats (8 weeks old, 200–250 g) were purchased from Beijing Vital River Laboratory Animal Technology Co., Ltd. The animals were raised and bred under SPF conditions. Access to water and standard rat chow was given ad libitum, and the animals were provided with a 12-h dark/12-h light cycle. All procedures used in the animal experiments followed the guidelines of the Association for Research in Vision and Ophthalmology (ARVO) Statement for the Use of Animals in Ophthalmic and Vision Research and by the regulations of the Experimental Animal Ethics Committee of West China Hospital of Sichuan University (AUP# 2018008A). After 2 weeks of acclimation to standard diets, male BN rats were randomly divided into the following four groups (Figure 1), including Group 1 (R1, control, n = 4), Group 2 (R2, ABX gavage, n = 4), Group 3 (R3, T2D modeling, n = 6), and Group 4 (R4, ABX gavage after T2D modeling, n = 6).
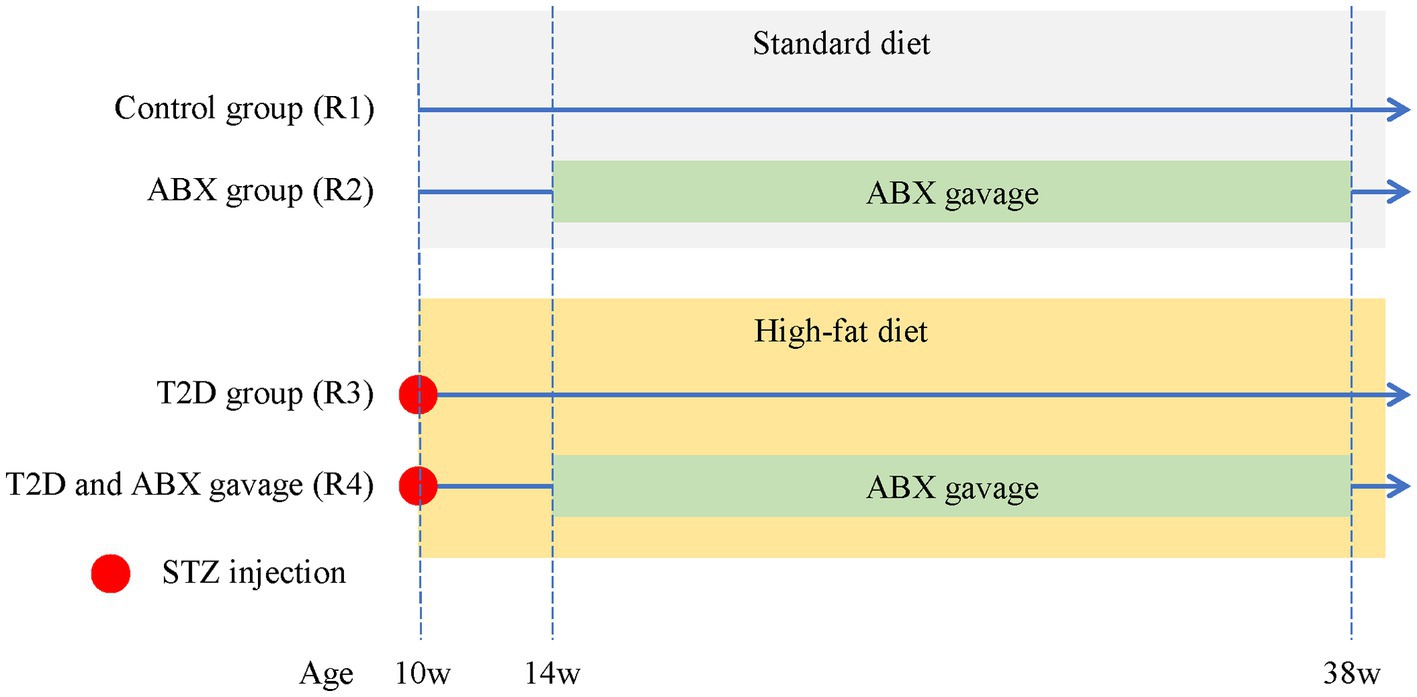
Figure 1. The experimental groups of adult BN male rats. The control group (R1) was fed a standard diet throughout the entire experiment. The ABX group (R2) was fed a standard diet throughout the whole experiment and received ABX via gavage from 14 weeks to 38 weeks of age. T2D rats (R3) received an i.p. injection of STZ at 10 weeks old and were fed a high-fat diet throughout the experiment. T2D/ABX gavage rats (R4) received an i.p. injection of STZ at 10 weeks old. They were also fed a high-fat diet throughout the entire experiment and received ABX via gavage from 14 weeks to 38 weeks of age. ABX, broad-spectrum antibiotics; T2D, type 2 diabetes; STZ, streptozotocin.
Streptozotocin (STZ, Sigma–Aldrich Chemical Co., Saint-Quentin Fallavier, France) was freshly prepared in citrate buffer (pH 4.5) (Solarbio, China) to a final concentration of 40 mg/mL. Group 3–4 rats received an i.p. injection of STZ (40 mg/kg body weight) and were subsequently fed a high-fat diet (Beijing Keao Xieli Feed Co., Ltd., D12451). The control group (R1) and ABX gavage group (R2) received equal citrate buffer and were fed standard diets (Figure 1). Animals were weighed, and tail blood was collected for glucose measurement using a standard glucometer (Contour™ Plus, Ascensia).
Broad-spectrum antibiotic (ABX) treatment is commonly used in gut microbiome research and is considered a standard microbiome depletion protocol. An antibiotic cocktail was delivered to the rats by gavage to deplete the gut microbiota. The antibiotic cocktail was freshly made every day and was composed of five antibiotics, namely, vancomycin (10 mg/mL, MeilunBio), metronidazole (20 mg/mL, MeilunBio), neomycin (20 mg/mL, Solarbio), ampicillin (2 mg/mL, MeilunBio), and amphotericin B (0.2 mg/mL, MeilunBio), based on previous reports (Reikvam et al., 2011; Johnson and Burnet, 2020). This specific mixture has been shown to reduce the fecal bacterial DNA load by 400-fold without causing morbidity (Reikvam et al., 2011; Johnson and Burnet, 2020). The dosage of the ABX cocktail for gavage was 7 mL/kg body weight per day.
Blood was collected from 14-week-old rats (4 weeks after STZ injection). Triglyceride (TG), total cholesterol (TC), high-density lipoprotein (HDL) cholesterol, and low-density lipoprotein (LDL) cholesterol levels were determined using a Cobas8000c702 analyzer (Roche).
The rats were fasting and water-free for more than 8 h. Fasting blood glucose was measured the next day. Then, the OGTT was performed using a previously described method. In brief, after overnight fasting, all rats received a gavage of 20% glucose solution (10 mL/kg of body weight), and blood samples were taken via the jugular vein 30, 60, 90, 120, 150, and 180 min later. A glucose meter measured blood glucose level (Accu-Check Performa, Roche Diagnostics, China).
For immunofluorescence, eyeballs were fixed for 60 min at 4°C in 4% paraformaldehyde, embedded in OCT (TissueTek 4583), frozen at −80°C and cut into 12 μm sections on Superfrost slides. Antigen retrieval was performed as previously described (Chen et al., 2007). The slides were incubated with blocking solution (1% donkey serum and 0.1% Triton X-100 in PBS) for 1 h and then with primary antibodies against Iba-1 (1:500, Wako, 019–19741) and Brn-3 (1:200, Santa Cruz, SC-6062) overnight at 4°C. Vascular endothelial cells were labeled with FITC-IB4 (Sigma, L2895). Primary antibodies or labeled cells were visualized using donkey anti-rabbit and donkey anti-goat antibodies conjugated with Alexa-488 and Alexa-568 (1:1,000; Molecular Probes). Nuclei were counterstained with DAPI (Sigma, D9542) and mounted with Mowiol medium. Finally, the slides were counterstained with 4′6-diamidino-2-phenylindole (DAPI; Sigma Aldrich Corp.) and mounted with Mowiol mounting medium. The negative control was generated by replacing the primary antibodies with PBS.
Eyeballs were enucleated and incubated for 45 min for whole-mount staining with 4% paraformaldehyde in PBS. A circumferential incision was made around the limbus to harvest the retina. The retinas were incubated at 4°C with primary antibodies against Brn3 (Santa Cruz, SC-6026), Iba-1 (1:500, Wako) and FITC-IB4 for 1 days and then with secondary antibodies (donkey anti-goat/rabbit Alexa Fluor 488) for 1 day at 4°C. After briefly washing with PBS, radial cuts were made to divide the retina into four quadrants to flatten the retina, and the flattened retinas were mounted with Mowiol.
Fecal pellets from the R1 (control) and R2 (ABX gavage) groups were collected at approximately 9 months of age, and fecal pellets from the R3–R4 groups were collected after 6 months of diabetic modeling (at approximately 9 months of age); all fecal pellets were immediately stored at −80°C until further analysis. DNA was extracted using the OMEGA Soil DNA Kit (M5635-02) (Omega Bio-Tek, Norcross, GA, USA) according to the manufacturer’s instructions. The V3–V4 region of 16S rRNA genes was amplified by PCR. The PCR amplicons were quantified using the Quant-iT PicoGreen dsDNA Assay Kit (Invitrogen, Carlsbad, CA, USA). Metagenomic sequencing was conducted utilizing the Illumina NovaSeq platform with paired-end 2 × 250 bp fragments, and subsequent bioinformatics analysis was performed mainly using the QIIME2 and R packages (v3.2.0) at Suzhou PANOMIX Biomedical Tech Co., Ltd.
An appropriate amount of fecal sample from the R1–R5 groups was taken and added to 0.6 mL of methanol containing 2-chlorophenyl alanine (4 ppm), vortexed, and ground. After centrifugation at 12,000 rpm at 4°C for 10 min, the supernatant was collected for liquid chromatography–tandem mass spectrometry detection by using an Ultimate 3,000 UHPLC System (Thermo Fisher Scientific, Waltham, MA, USA) at Suzhou PANOMIX Biomedical Tech Co., Ltd. The raw data was converted to mzXML format through MSConvert in the ProteoWizard software package (v3.0.8789). The metabolites were then identified with the HMDB, Massbank, LipidMaps, MzCloud, and KEGG databases. Subsequently, the multivariate data were analyzed and modeled using Ropels software. Differentially abundant metabolites were screened based on p values less than 0.05 and VIP values exceeding 1.
The animals were anesthetized via intravenous injection of soluble sodium pentobarbital (40 mg/kg). Tropicamide (5 mg/mL, Santen Pharmaceutical, Osaka, Japan) was used for pupil mydriasis. The Spectralis HRA + OCT imaging system (Heidelberg Engineering, Heidelberg, Germany) obtained FFA according to the manufacturer’s protocol, as previously reported (Querques et al., 2020; Arrigo et al., 2021). Then, FFA was performed by using 10% sodium fluorescein at 0.03 mL/kg at a rate of 1 mL/s from the tail vein. A series of images were taken at the early phase (30 s) and late phase (5–6 min) to identify retinal vessels.
FITC-dextran (FD2000S; Sigma) was dissolved in ultrapure water at 50 mg/mL. The rats were anesthetized via intravenous injection of soluble sodium pentobarbital (40 mg/kg) and placed in right lateral recumbency with their heads facing to the left. A 27-gauge needle was used at a 45° angle to produce a puncture of 3–4 mm in length into the rat’s orbital venous sinus, and 0.05 mL FITC-dextran was injected into the left orbit according to previous protocols for mouse (Li et al., 2011; Li et al., 2021). Three minutes after the injection, the animals were euthanized, and their eyeballs were enucleated. The enucleated eyeballs were fixed in 4% paraformaldehyde for 30 min at room temperature. Retinas were harvested, and four incisions were made to flatten them on slides. The retinal wholemounts were photographed using Zeiss Axio Imager Z2 fluorescence microscope.
The stained sections and slides were analyzed using a Zeiss Axio Imager Z2 fluorescence microscope and a Nikon A1RMP confocal microscope. ImageJ 1.50b with a cell counter plugin1 was used for cell counting following the online guide. The cells positive for Brn3 and Iba-1 were counted manually. At least 2 images per section, 2 sections per retina, and 3 retinas from each group were counted. For Brn3+ and Iba-1+ cell counting on the wholemount retina, three equivalent areas (each measuring 150 μm × 150 μm) from each quadrant of each retinal wholemount (a total of 12 regions per retina) were selected. All images for cell counting were captured under a fluorescence microscope using a 20× objective lens.
Representative images were analyzed using AngioTool software (NCI) for vascular blood vessel analysis. The data are expressed as the mean ± standard deviation (mean ± SD). All experiments were carried out with n = 3–6. The data were compared using Student’s t-test or one-way ANOVA and Bonferroni correction by SPSS 20.0 (IBM, USA) and PRISM 6 (GraphPad, USA). All p values were two-sided and considered statistically significant when the values were <0.05. Statistical analysis methods for microbiomes and metabolites are available upon request.
STZ was i.p. injected into male 10-week-old BN rats fed a high-fat diet (Figure 1). Four weeks after the STZ injection, the body weights of the rats in the T2D groups did not change (Figure 2A). The OGTT curves were generally comparable between the T2D (R3 group) and T2D/ABX (R4 group) groups. Still, both groups exhibited a slower glucose clearance rate than the control group, indicating reduced insulin release (Figure 2B). The blood glucose and HbA1c levels in 14-week-old to 38-week-old rats were much higher than those in control rats, indicating successful induction of T2D (Figures 2C,D). Four weeks after STZ injection, the plasma cholesterol and triglyceride (TG) levels were both increased (Figures 2E,F), while the HDL and LDL levels showed no changes (Figures 2G,H).
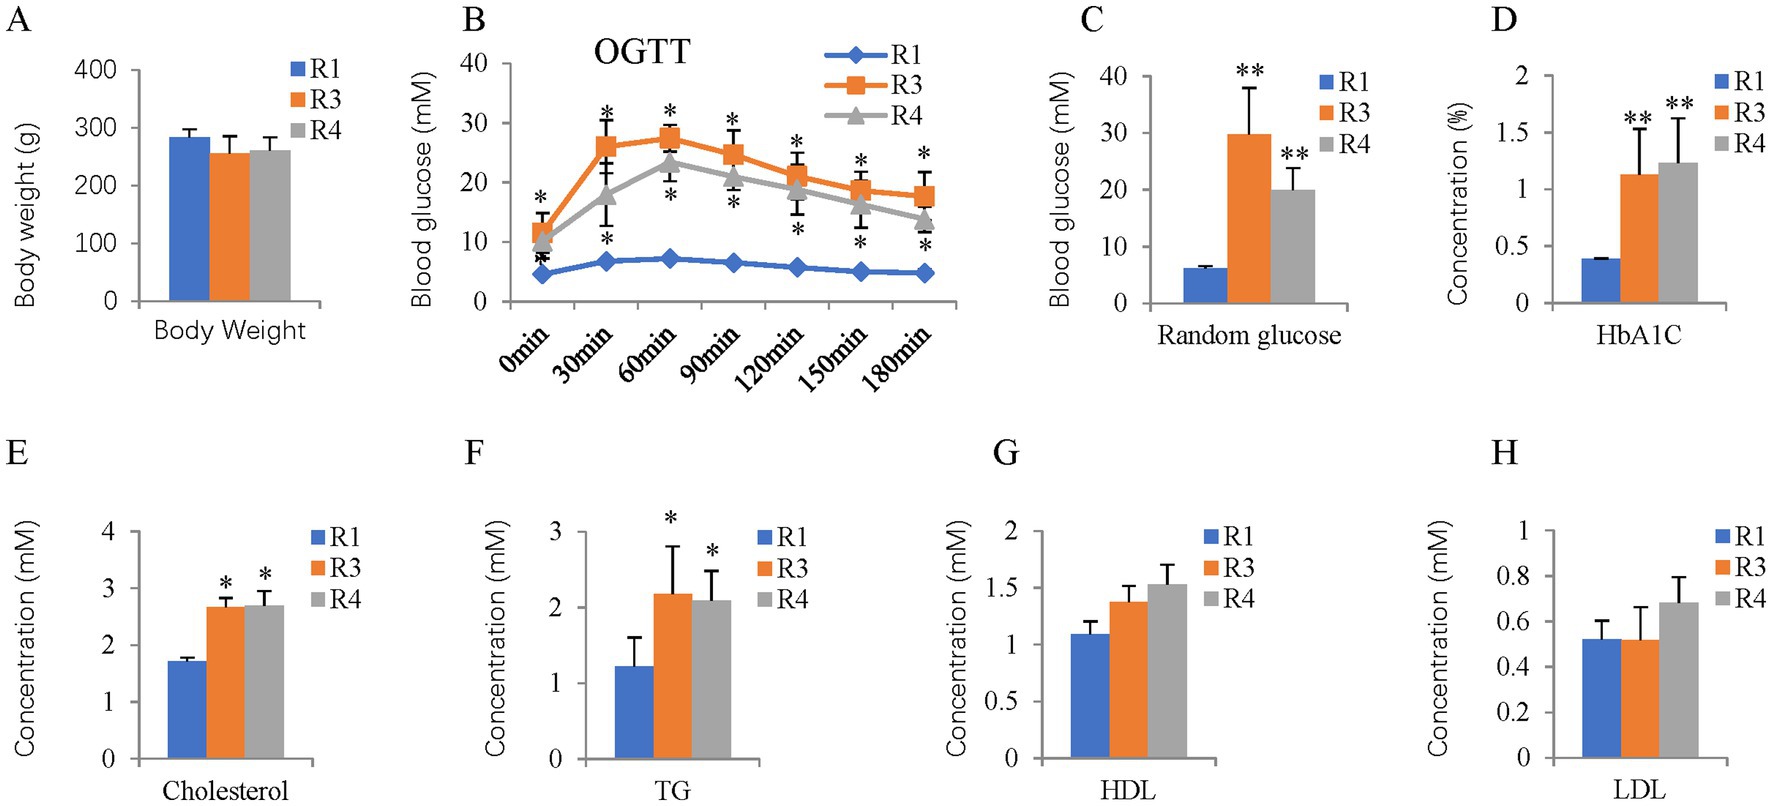
Figure 2. Body weight, OGTT, random glucose, HbA1c, and plasma lipid profiles of the T2D rats. (A) Body weight. (B) OGTT at 14 weeks of age. (C) Random glucose from 14 to 38-week-old mice. (D–H) HBA1C, blood cholesterol, TG, HDL, and LDL levels were measured at 14 weeks of age. OGTT, oral glucose tolerance test; TG, triglyceride; HDL, high-density lipoprotein; LDL, low-density lipoprotein. The error bars represent the SDs of the measurements, and the asterisks (*, **) indicate significant differences between control (R1 group) and T2D rats (R3 group) or T2D/ABX rats (R4 group) (*p < 0.05, **p < 0.01, one-way ANOVA followed by Bonferroni correction).
The gut microbiome was assessed by 16S rDNA sequencing 6 months after T2D induction. T2D for 6 months increased the average ASVs/OTUs (Figure 3A) and taxa (Figure 3B) of the gut microbes, especially at the genus and species levels. Alpha diversity analysis (Figure 3C) revealed no changes in species richness (Chao1 and Observed species indices), increased diversity (Simpson and Shannon indices), and increased evenness (Peilou_e index). Principal coordinate analysis (PCoA) suggested that T2D considerably altered the beta diversity. Both the unweighted (Figure 3D) and weighted (Figure 3E) UniFrac distances showed differences in the structure and composition of the gut bacterial community between the control and T2D groups, which was confirmed by the Permanova test (Figure 3F).
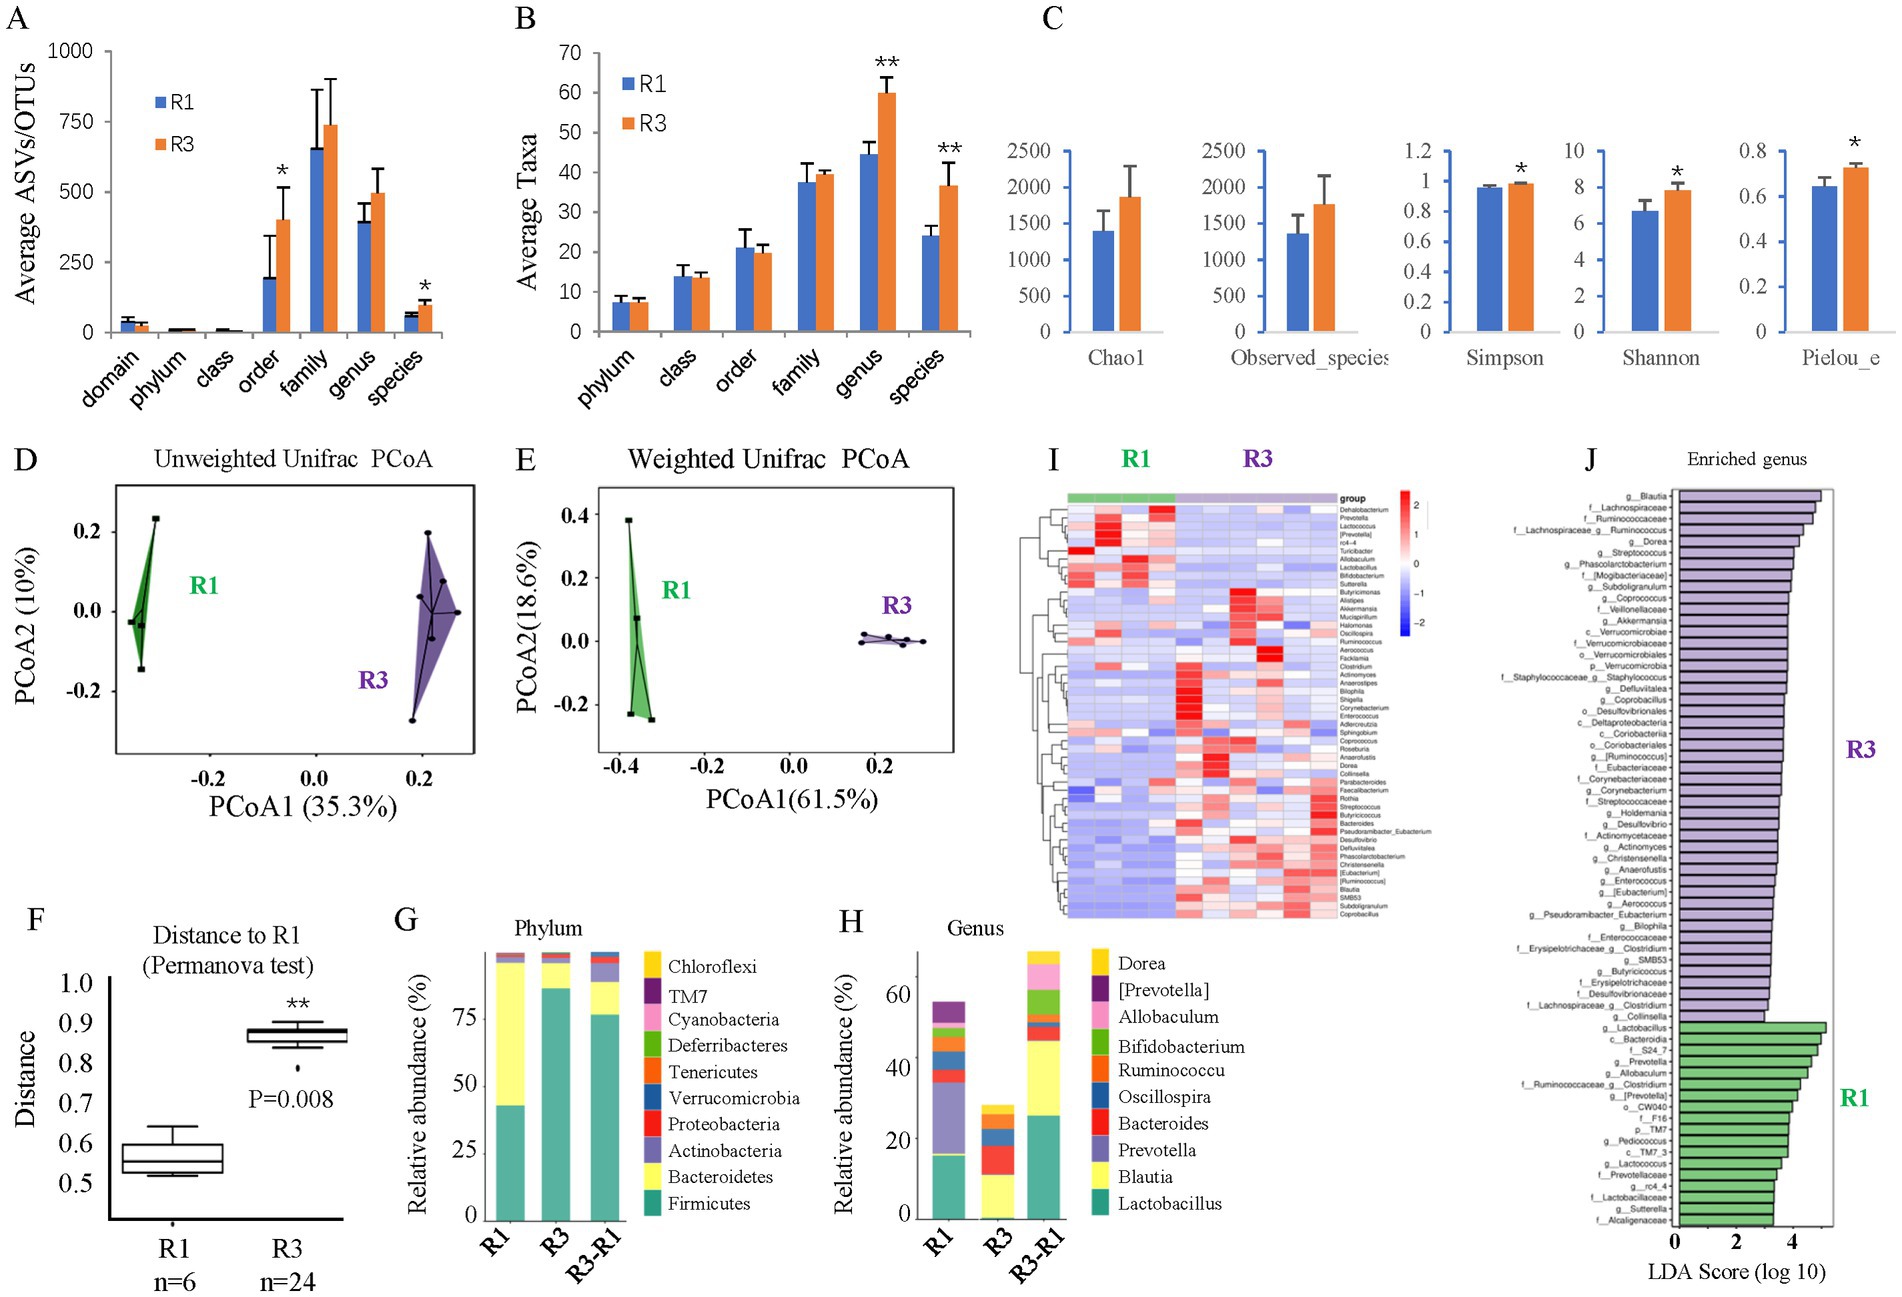
Figure 3. The effects of ABX gavage on the gut microbiota of adult rats. (A) The average ASVs/OTUs. (B) The average taxa in the control and gavage groups. (C) The alpha diversity (Chao1, Observed species, Simpson, Shannon, and Peilou_e indices). (D) Unweighted UniFrac PCoA. (E) Weighted UniFrac PCoA. (F) Permanova test. (G) The relative abundances at the phylum level. (H) The relative abundances at the genus level. (I) Heatmap of the dominant genera. (J) LEfSe (LDA effect size) analysis of the enriched genera. ASV, amplicon sequence variant; OTUs, operating taxonomic units. PCoA, principal coordinate analysis. Permanova, permutational multivariate analysis of variance. R1, control group; R2, ABX gavage group.
As such, the bacterial composition at the phylum and genus levels was also significantly changed. The abundance of Bacteroidetes was greatly reduced at the phylum level, but that of Firmicutes was significantly increased in the T2D group; thus, the F/B ratio was increased (Figure 3G). At the genus level, the abundances of Blautia and Bacteroides were increased, while those of Lactobacillus and Prevotella decreased in T2D rats (Figure 3H). A clustering heatmap using the abundance data of the top 50 genera showed significant differences between the control and ABX gavage groups (Figure 3I). Based on the LEfSe analysis (LDA), there were 47 dominant genera in the T2D group, while 18 dominant genera were in the control group (Figure 3J).
We also performed untargeted metabolomic analysis on fecal samples from these rats. PCA revealed significant differences between the control and T2D groups (Figure 4A) and identified 276 metabolite biomarkers (Supplementary Table S1), including 6 SCFAs (Supplementary Table S2). The top 10 increased metabolites and decreased metabolites are shown in Figure 4B.
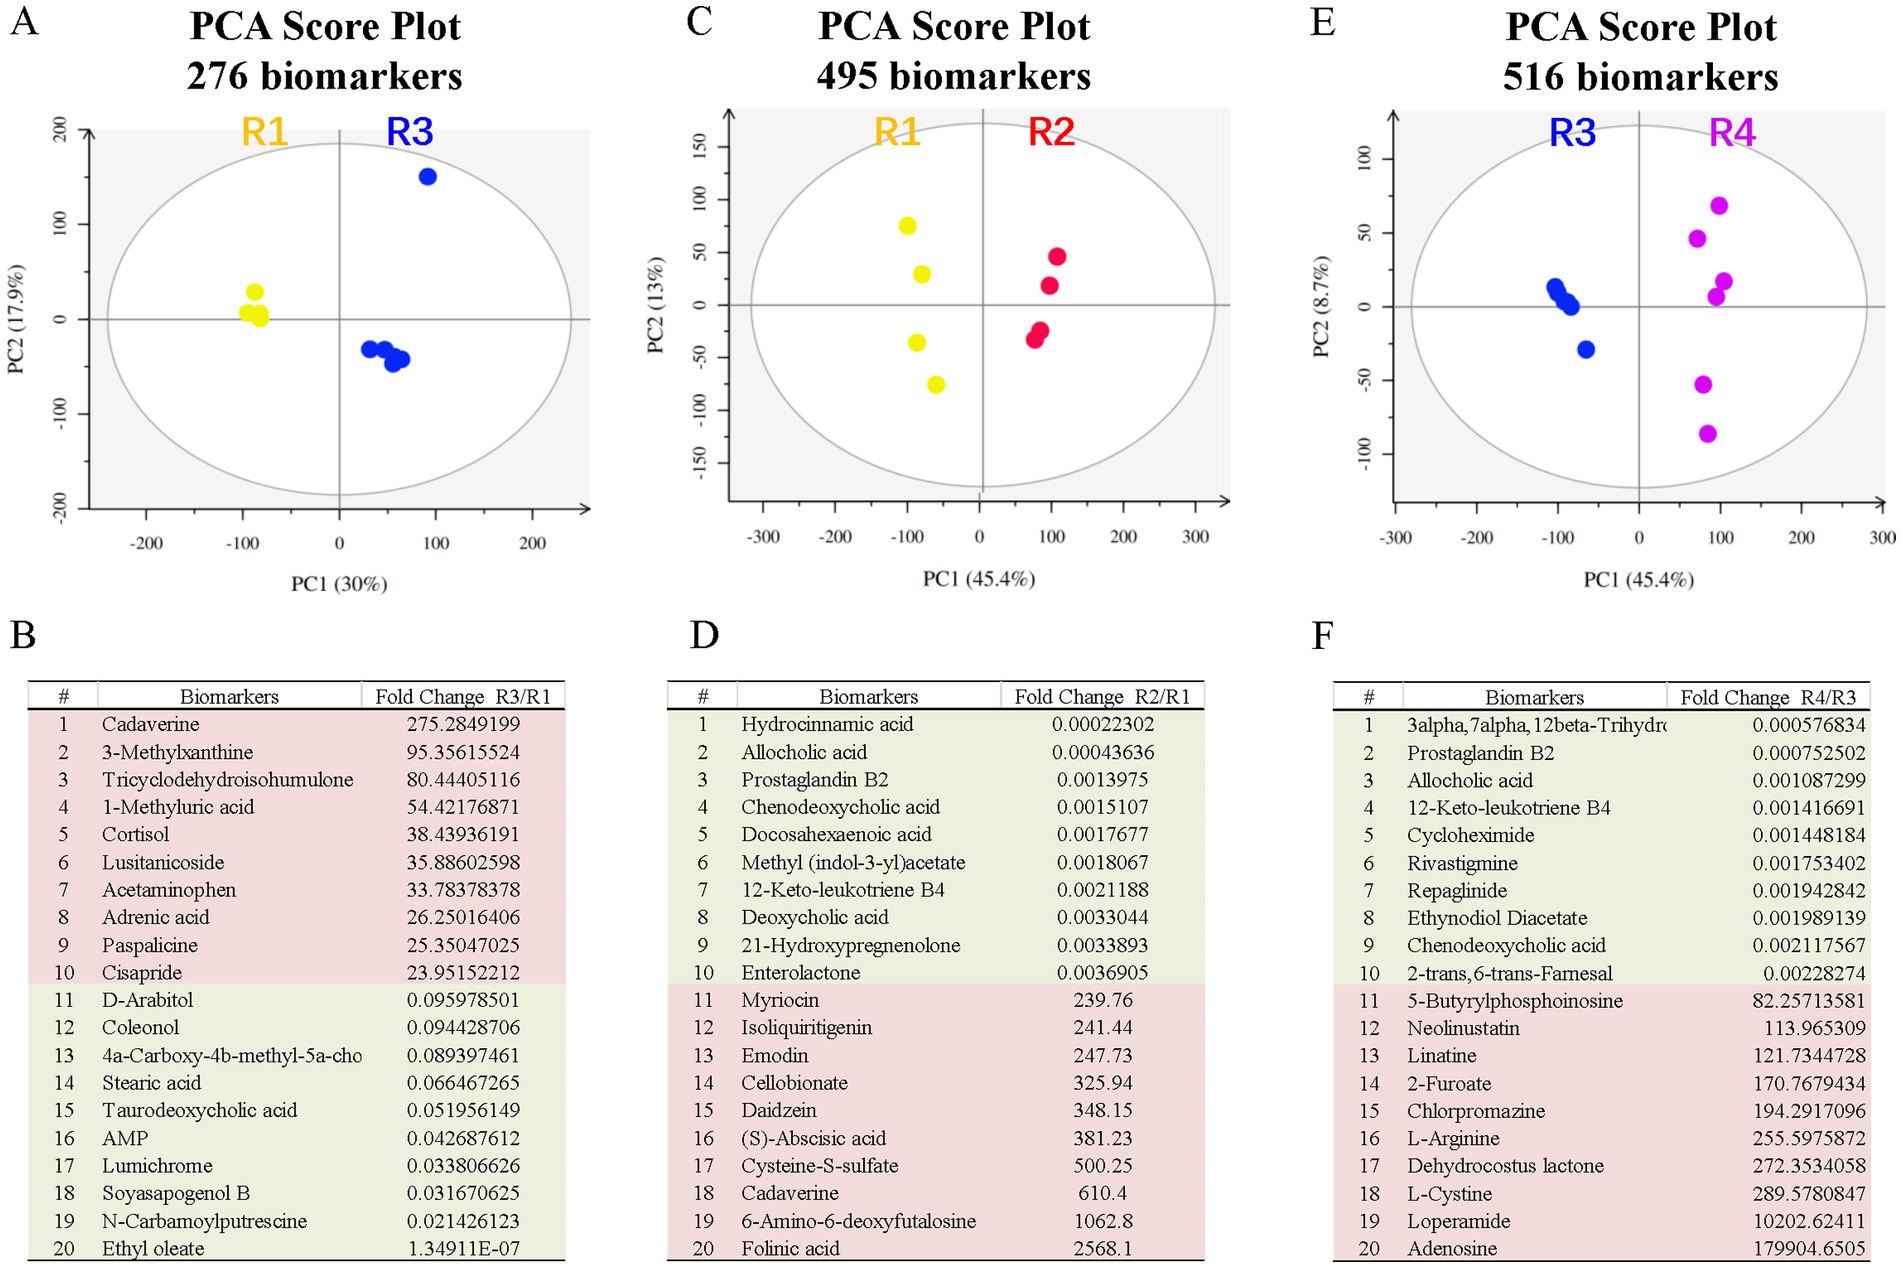
Figure 4. Fecal metabolite profiling of the R1-R5 groups. The PCA score plots and top metabolite biomarkers are shown for the R2/R1 (A,B), R3/R1 (C,D), and R4/R3 (E,F) groups. Downregulated biomarkers are shown in green blocks, and upregulated biomarkers are in pink blocks. PCA, principal component analysis.
It is known that long-term T2D can induce DR, including retinal degeneration, inflammation, and microvascular defects (Zeng et al., 2000). We looked at these features in our T2D rat model. Retinal wholemount and section staining showed that the number and retinal distribution of IBA1+ retinal microglia did not change in the T2D group (Figures 5A–C). However, T2D significantly reduced the number of retinal ganglion cells (Figures 5D,E). Even though T2D persisted for more than 6 months, fundus fluorescein angiography (FFA) and FITC-Dextran perfusion by retro-orbital injection did not reveal any vascular leakage (Figures 6A,B), and IB4 staining did not reveal significant changes in retinal blood vessels (Figures 6C–F). Thus, 6 months after the onset of T2D, the substantial change in the retina was ganglion cell loss, supporting the notion that retinal degeneration is the earliest change of DR (Sachdeva, 2021).
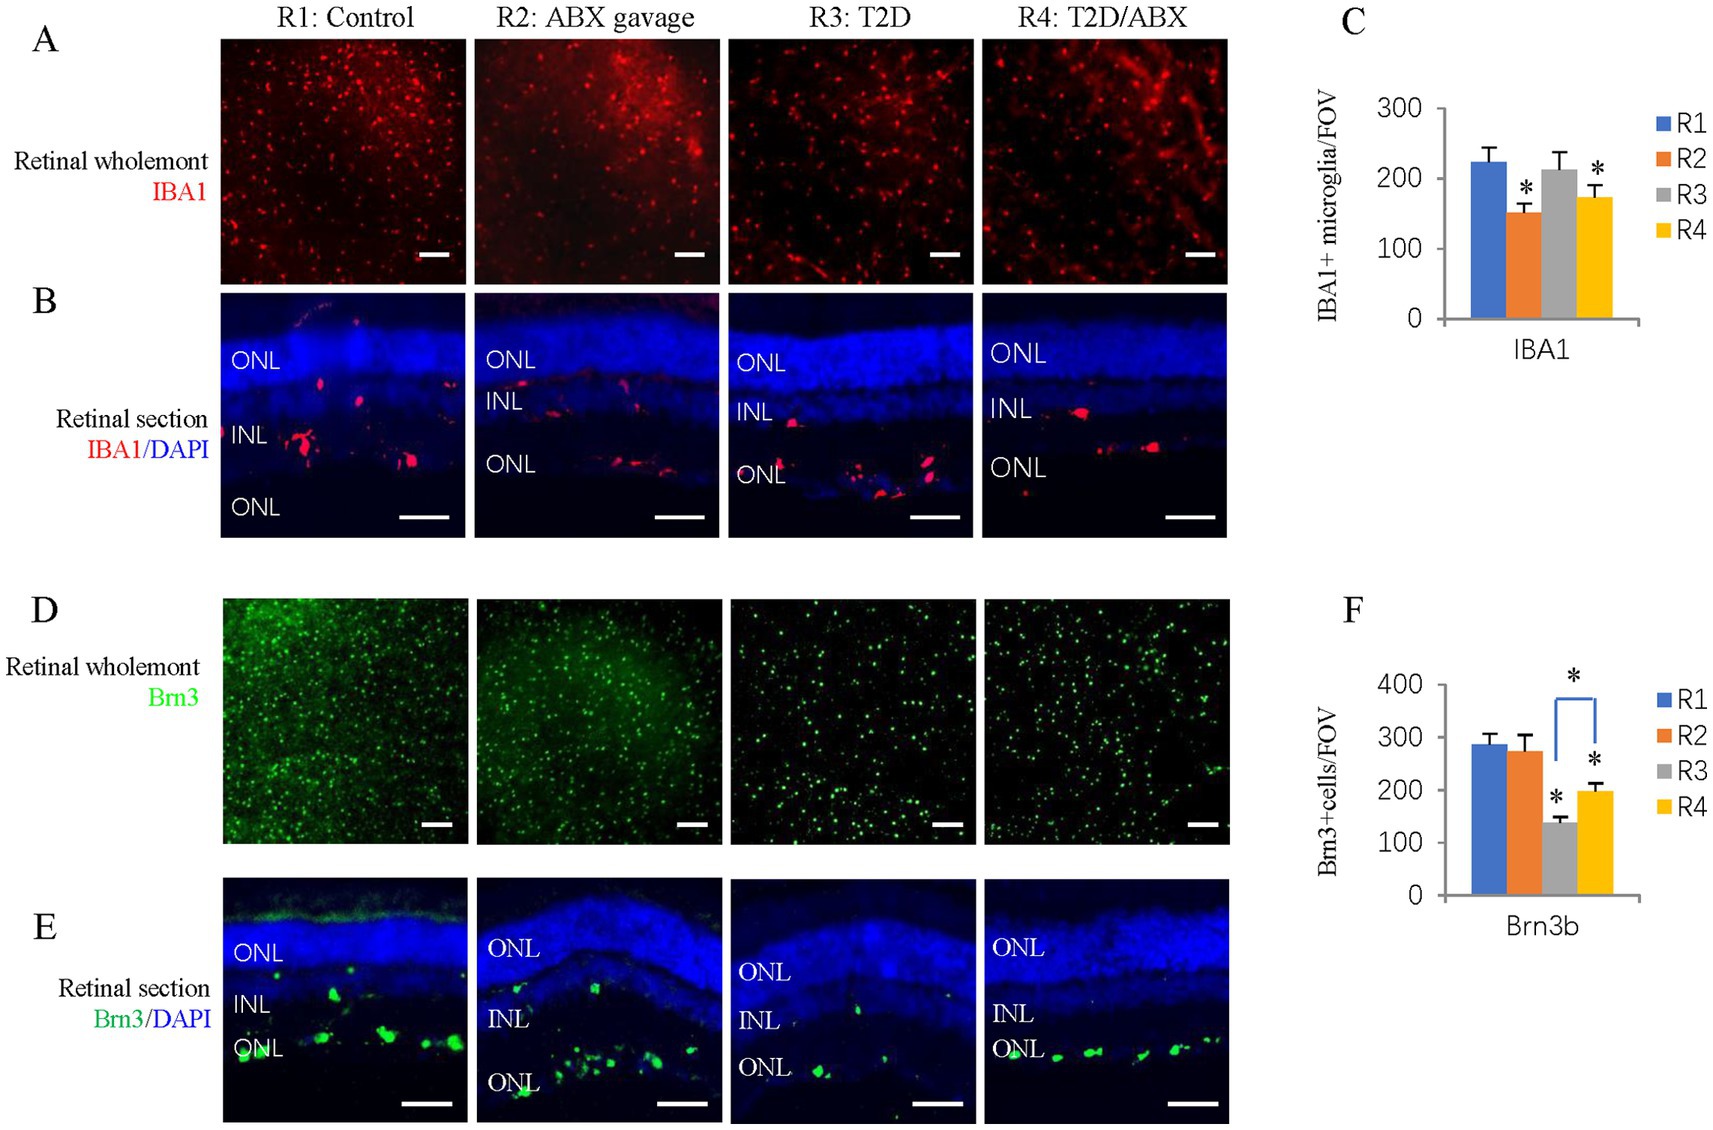
Figure 5. The effects of ABX gavage and long-term T2D on retinal microglia and ganglion cells. (A) Retinal wholemounts of 38-week-old rats from the indicated groups were stained for microglia (IBA1, red). (B) Horizontal retinal sections of 38-week-old rats from the indicated groups were stained for the nuclei (DAPI, blue) and microglia (IBA1, red). (C) Quantification of IBA1+ cells in the retinal wholemounts. (D) Retinal wholemounts of 38-week-old rats from the indicated groups were stained for ganglion cells (Brn3, green). (E) Horizontal retinal sections of 38-week-old rats from the indicated groups were stained for nuclei (DAPI, blue) and ganglion cells (Brn3, green). (F) Quantification of Brn3+ cells in the retinal wholemounts. The error bars represent the SDs of the measurements, and the asterisks (*, **) indicate significant differences between the control group (R1 group) and the other groups, including the ABX gavage group (R2), T2D group (R3), and T2D/ABX group (R4) (*p < 0.05, **p < 0.01; one-way ANOVA followed by Bonferroni correction). The scale bars are 200 μm (A,D) and 50 μm (B,E). ONL, outer nuclear layer; INL, inner nuclear layer; GCL, ganglion cell layer.
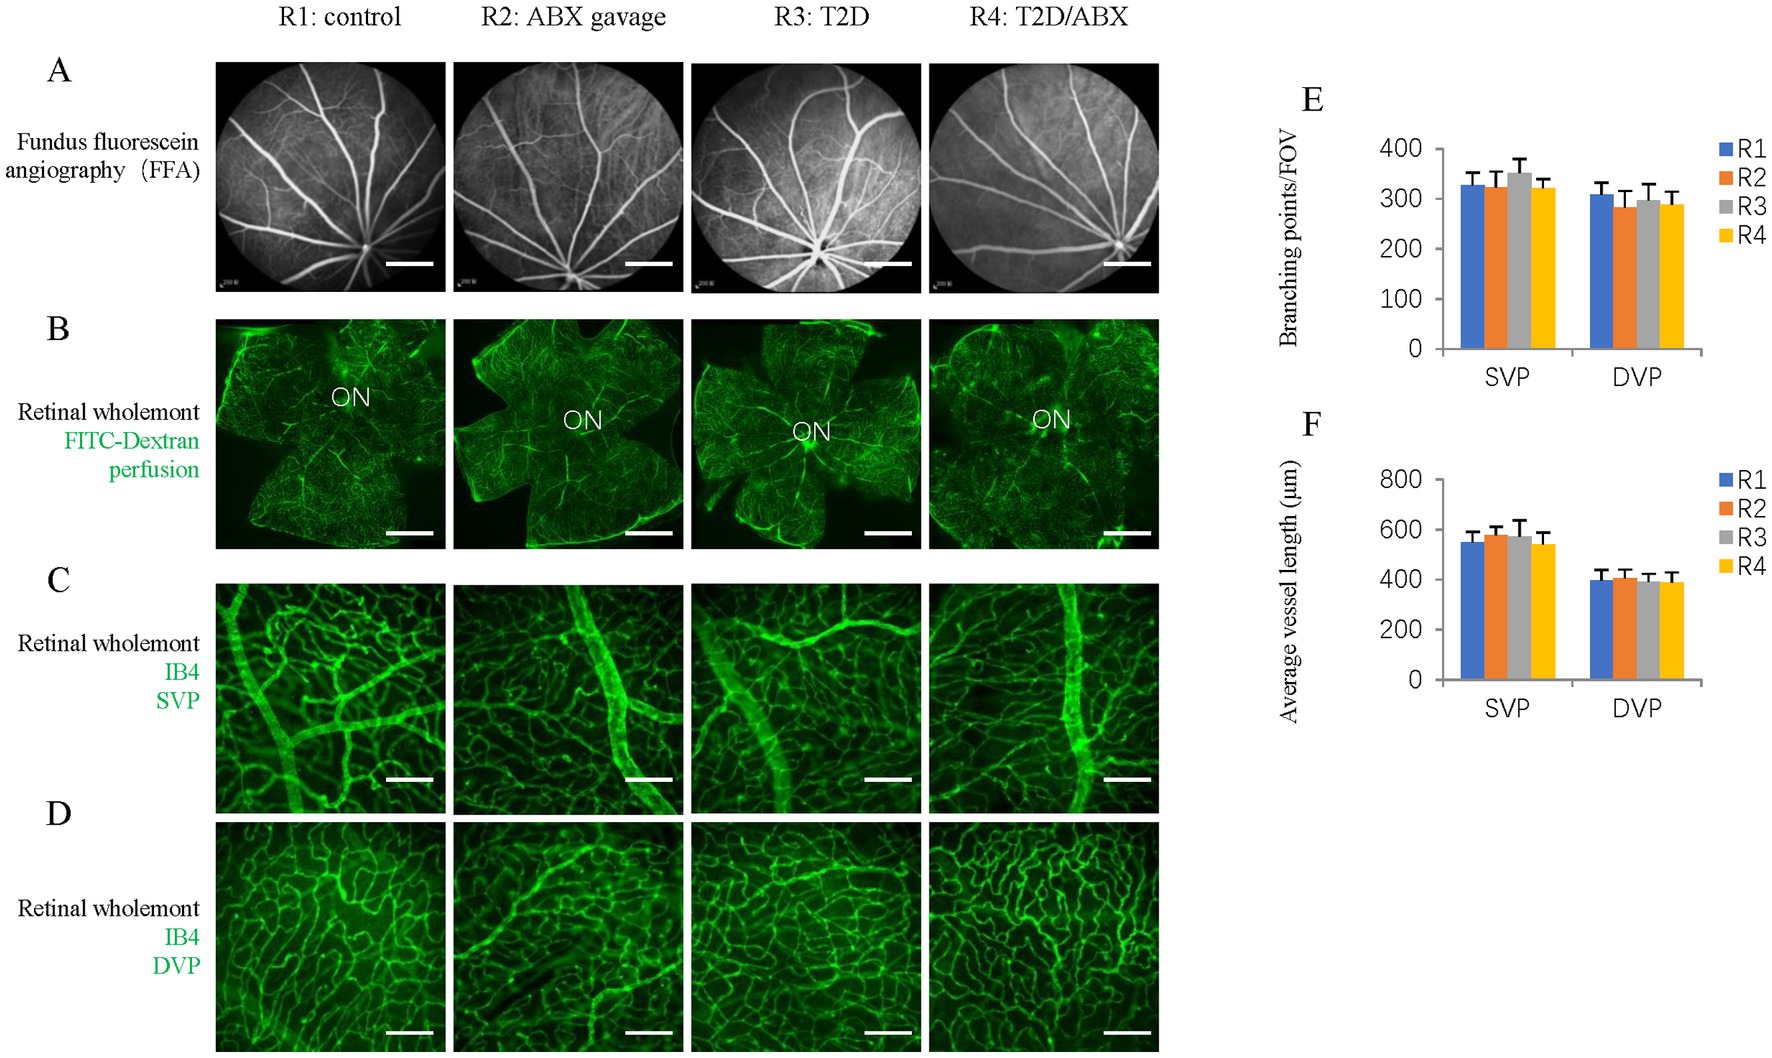
Figure 6. The effects of ABX gavage and long-term T2D on retinal blood vessels. (A) Images of ocular fundus from 38-week-old rats in the indicated groups in the late stage of FFA. (B) Retinal wholemounts of 38-week-old rats from the indicated groups received retro-orbital injection of FITC-Dextran (FITC-Dextran, green). (C) Retinal wholemounts of 38-week-old rats from the indicated groups were stained for vascular vessels (IB4, green). These are SVPs. (D) Retinal wholemounts of 38-week-old rats from the indicated groups were stained for vascular vessels (IB4, green). These are DVPs. (E) Quantification of the branching points of retinal blood vessels. (F) Quantification of the average vessel length of retinal blood vessels. The error bars represent the SDs of the measurements, and the asterisks (*, **) indicate significant differences between the control group (R1 group) and the other groups, including the ABX gavage group (R2), T2D group (R3), and T2D/ABX group (R4) (*p < 0.05, **p < 0.01; one-way ANOVA followed by Bonferroni correction). The scale bars are 600 μm (A,B) and 50 μm (C,D). FFA, fundus fluorescein angiography; ON, optic nerve; SVP, superficial vascular plexus; DVP, deep vascular plexus.
Gut dysbiosis and metabolite changes may contribute to the reduction in retinal ganglions. To test this hypothesis, we investigated if ABX (broad-spectrum antibiotics treatment) can affect rat microbiota and retinal phenotypes in control rats.
Like mice, gavage of the ABX cocktail depleted the gut microbiota of adult rats. 16S rDNA sequencing revealed that ABX gavage for 6 months significantly reduced the average ASVs/OTUs (Figure 7A) and taxa (Figure 7B) of the gut microbes, especially at the family, genus, and species levels. Alpha diversity analysis (Figure 7C) revealed significantly reduced richness (Chao1 and Observed species indices), reduced diversity (Simpson and Shannon indices), and reduced evenness (Peilou_e index). PCoA suggested that the beta diversity was significantly altered by ABX gavage. Both the unweighted (Figure 7D) and weighted (Figure 7E) UniFrac distances showed differences in the structure and composition of the gut bacterial community between the control and ABX gavage groups, which was confirmed by the Permanova test (Figure 7F).
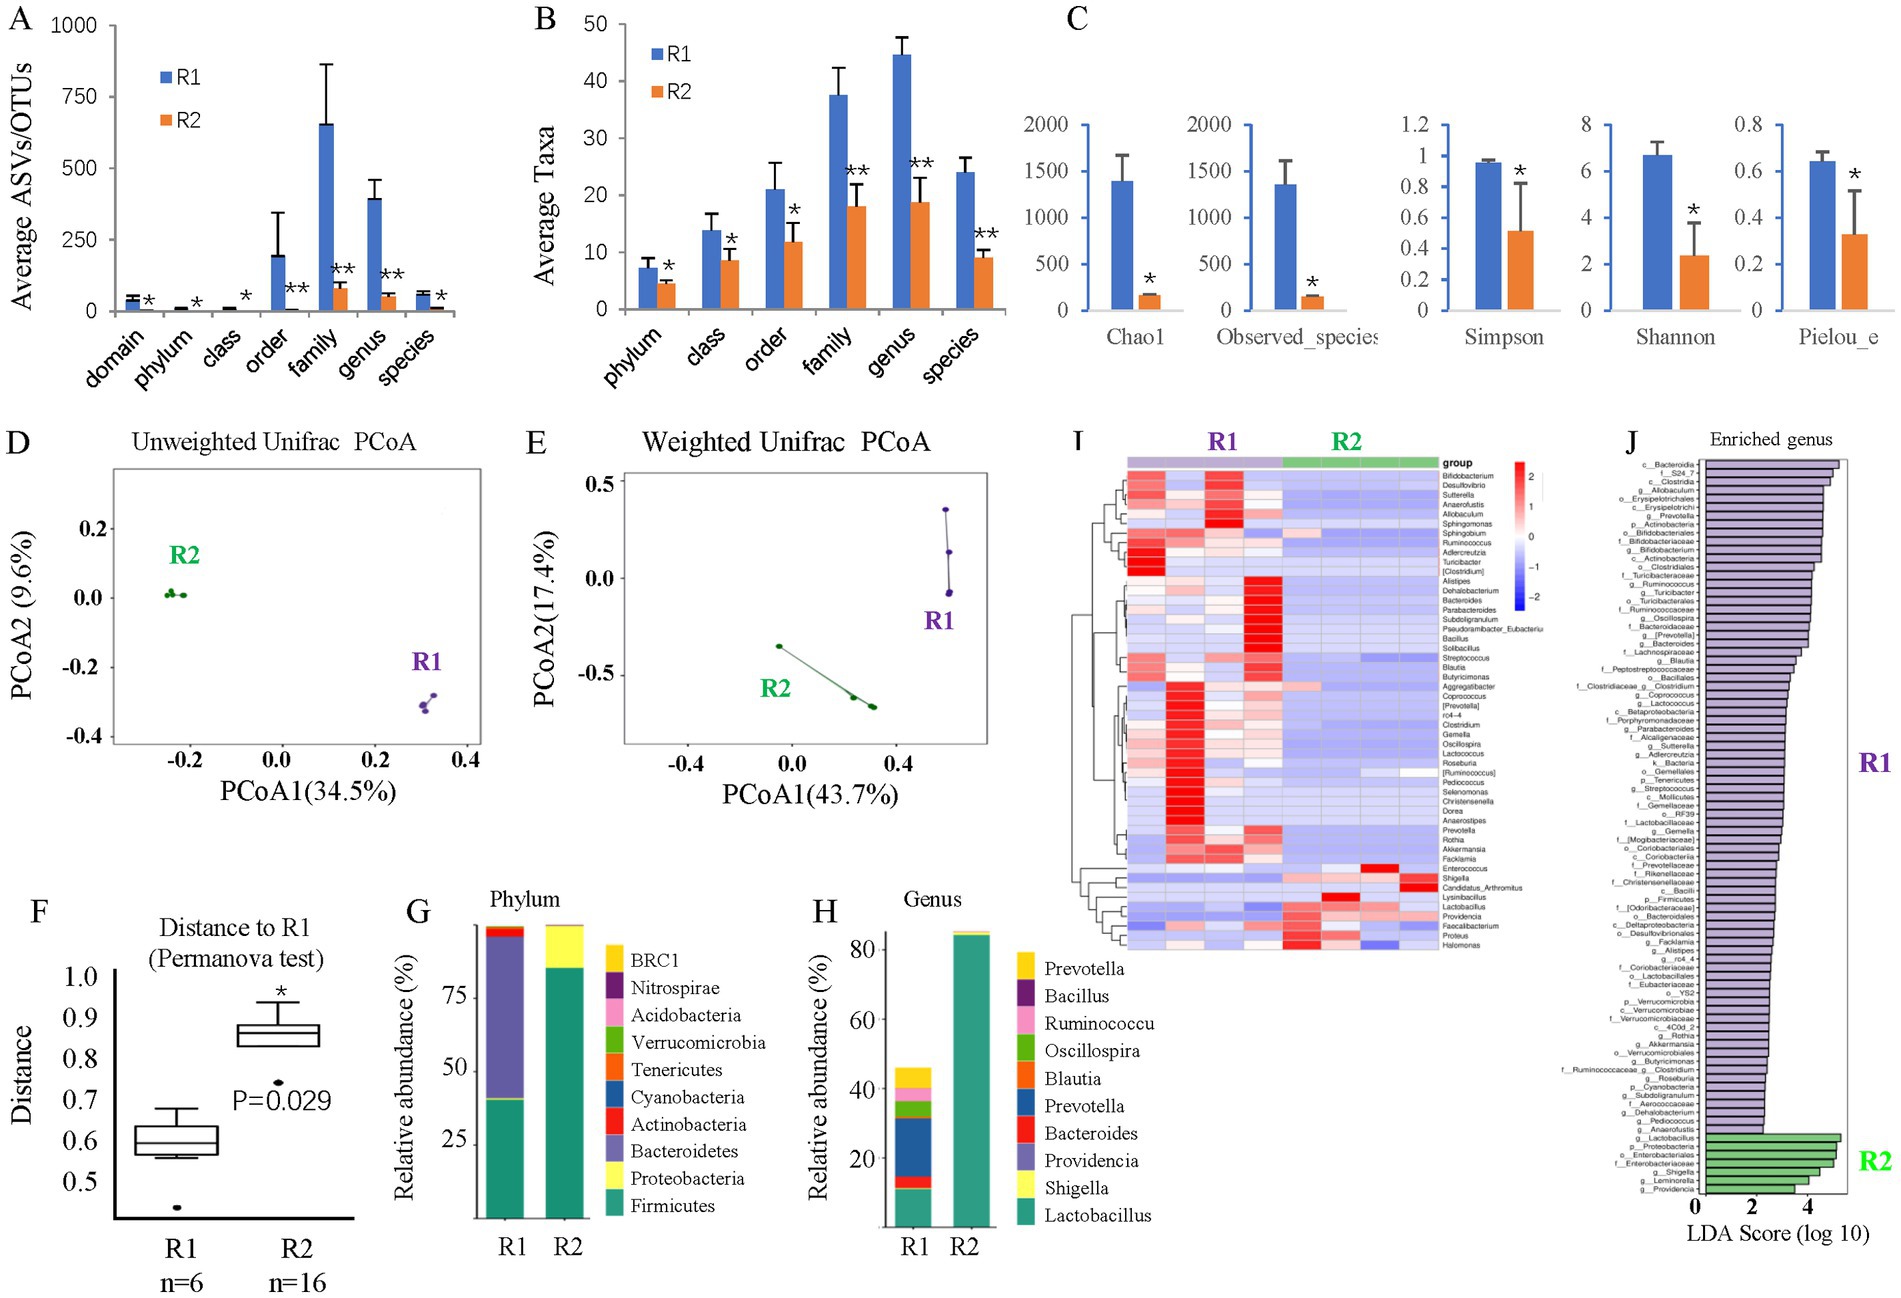
Figure 7. The effects of long-term T2D on the gut microbes of adult rats. (A) The average ASVs/IPs. (B) The average taxa in the control and gavage groups. (C) The alpha diversity (Chao1, Observed species, Simpson, Shannon, and Peilou_e indices). (D) Unweighted UniFrac PCoA. (E) Weighted UniFrac PCoA. (F) Permanova test. (G) The relative abundances at the phylum level. (H) The relative abundances at the genus level. (I) Heatmap of the dominant genera. (J) LEfSe (LDA effect size) analysis of the enriched genera. ASV, amplicon sequence variant; OTUs, operating taxonomic units. PCoA, principal coordinate analysis. Permanova, permutational multivariate analysis of variance. R1, control group; R3, T2D group.
The bacterial composition at the phylum and genus levels was significantly changed. At the phylum level, there were almost no Bacteroidetes but many more Firmicutes in the ABX gavage group; thus, the Firmicutes/Bacteroidetes (F/B) ratio increased (Figure 7G). At the genus level, Lactobacillus accounted for more than 80% of the bacteria in the ABX-treated group (Figure 7H). A clustering heatmap using the abundance data of the top 50 genera showed significant differences between the control and ABX gavage groups (Figure 7I). Linear discriminant analysis (LDA) effect size (LEfSe) revealed that there were only 7 dominant genera in the ABX gavage group, while there were 79 dominant genera in the control group (Figure 7J).
Because the gut microbiota can affect microglia in the brain, we examined the number and distribution of retinal microglia in these adult rats. Retinal wholemount and section staining revealed significantly reduced IBA1+ microglia in the ABX gavage group (Figures 5A–C). Section staining indicated that the distribution of retinal microglia had not been changed; they were in the ganglion cell layer, inner nuclear layer, and outer plexiform layers (Figure 5B). However, Retinal wholemount and section staining of Brn3 suggested that ABX gavage did not considerably affect ganglion cells (Figures 5D–F). Furthermore, FFA and FITC-Dextran perfusion did not detect vascular leakage in either group (Figures 6A,B), and retinal wholemount staining of IB4 found no changes in vessel branching points and vessel length between R1 and R2 groups (Figures 6C–F).
Principal component analysis (PCA) on untargeted metabolomic data revealed significant differences between the control and ABX gavage groups (Figure 4C), and 495 metabolite biomarkers were identified (Supplementary Table S1), including 12 SCFAs (Supplementary Table S2). The top 10 decreased and increased metabolites are shown in Figure 4D. These metabolites may contribute to the reduction in retinal microglia.
To test whether dysbiosis contributes to retinal ganglion cell loss in T2D rats, we gavaged T2D rats with ABX for approximately 6 months. 16S rDNA sequencing revealed that ABX gavage significantly reduced the gut microbes’ average ASVs/OTUs (Figure 8A) and taxa (Figure 8B), especially at the family, genus, and species levels. Alpha diversity analysis (Figure 8C) revealed significantly reduced species richness (Chao1 and Observed species indices), reduced diversity (Simpson and Shannon indices), and reduced evenness (Peilou_e index). PCoA suggested that the beta diversity was significantly altered by ABX gavage. Both the un-weighted (Figure 8D) and weighted (Figure 8E) UniFrac distances showed differences in the structure and composition of the gut bacterial community between the T2D and T2D/ABX gavage groups, which was confirmed by the Permanova test (Figure 8F).
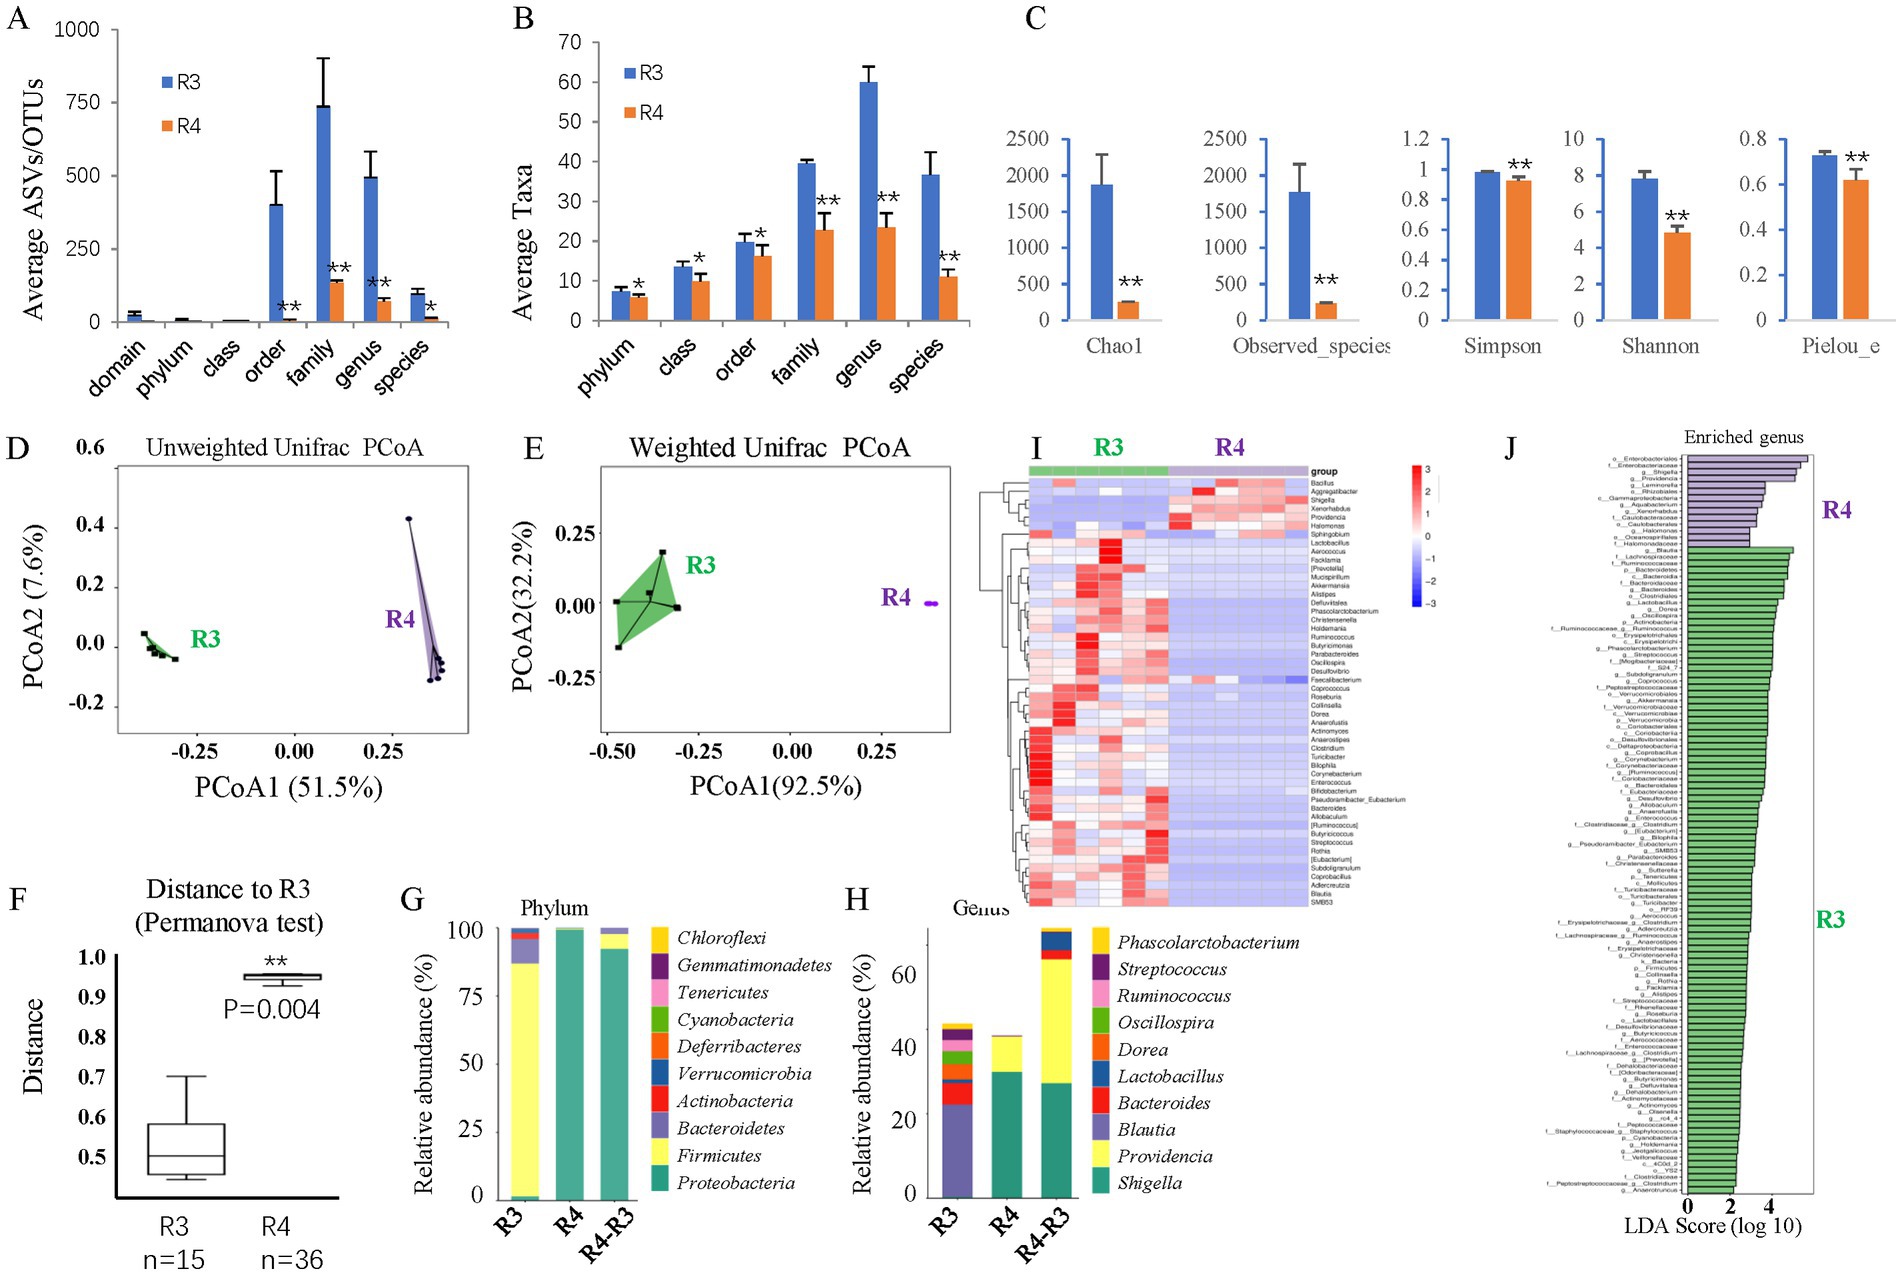
Figure 8. The effects of ABX gavage on the gut microbes of adult T2D rats. (A) The average ASVs/OTUs. (B) The average taxa in the control and gavage groups. (C) The alpha diversity (Chao1, Observed species, Simpson, Shannon, and Peilou_e indices). (D) Unweighted UniFrac PCoA. (E) Weighted UniFrac PCoA. (F) Permanova test. (G) The relative abundances at the phylum level. (H) The relative abundances at the genus level. (I) Heatmap of the dominant genera. (J) LEfSe (LDA effect size) analysis of the enriched genera. ASV, amplicon sequence variant; OTUs, operating taxonomic units. PCoA, principal coordinate analysis. Permanova, permutational multivariate analysis of variance. R3, T2D group; R4, T2D/ABX gavage group.
As such, the bacterial composition at the phylum and genus levels was also significantly changed. At the phylum level, the abundances of both Bacteroidetes and Firmicutes were decreased, and the F/B ratio was reduced (Figure 8G). Proteobacteria was the most dominant phylum in the T2D/ABX-treated rats (Figure 8G). At the genus level, the abundances of Shigella and Providencia were increased in the T2D/ABX-gavage rats (Figure 8H). A clustering heatmap using the abundance data of the top 50 genera showed significant differences between the T2D and T2D/ABX gavage groups (Figure 8I). LEfSe revealed only 14 dominant genera in the T2D/ABX gavage group, while 99 dominant genera in the T2D group (Figure 8J).
We examined whether ABX gavage affects retinal phenotypes in T2D rats. Retinal wholemount and section staining revealed substantially fewer IBA1+ microglia in the T2D/ABX gavage group than in the T2D group (Figures 5A–C). Interestingly, ABX gavage rescued the ganglion cell loss in the T2D group, but the number of retinal ganglion cells was still lower than that in the control group (Figures 5D,E). The T2D rats had no major vascular defects, so ABX gavage did not affect the retinal blood vessels of these T2D rats based on FFA, FITC-Dextran perfusion, and IB4 staining (Figures 6A–F).
We performed untargeted metabolomic analysis on fecal samples to understand how ABX gavage rescued the ganglion cell loss in T2D rats. PCA revealed significant differences between the T2D and T2D/ABX gavage groups (Figure 4E), and 516 metabolite biomarkers were identified (Supplementary Table S1), including 14 SCFAs (Supplementary Table S2). The top 10 decreased metabolites and increased metabolites are shown in Figure 4F. These metabolites may contribute to rescuing retinal ganglion cells in T2D rats.
Comparing these metabolites, we identified the top 10 metabolites common among R2/R1, R3/R1, and R4/R3 groups (Table 1). All these metabolites increased in T2D rats but decreased in the ABX gavage groups (R1 and R4), including Cycloheximide, Chenodeoxycholic acid (CDCA), Tricyclodehydroisohumulone (TCD), palmitoleic acid, and others. Some of these metabolites may activate retinal microglia and reduce retinal ganglion cells in T2D rats.
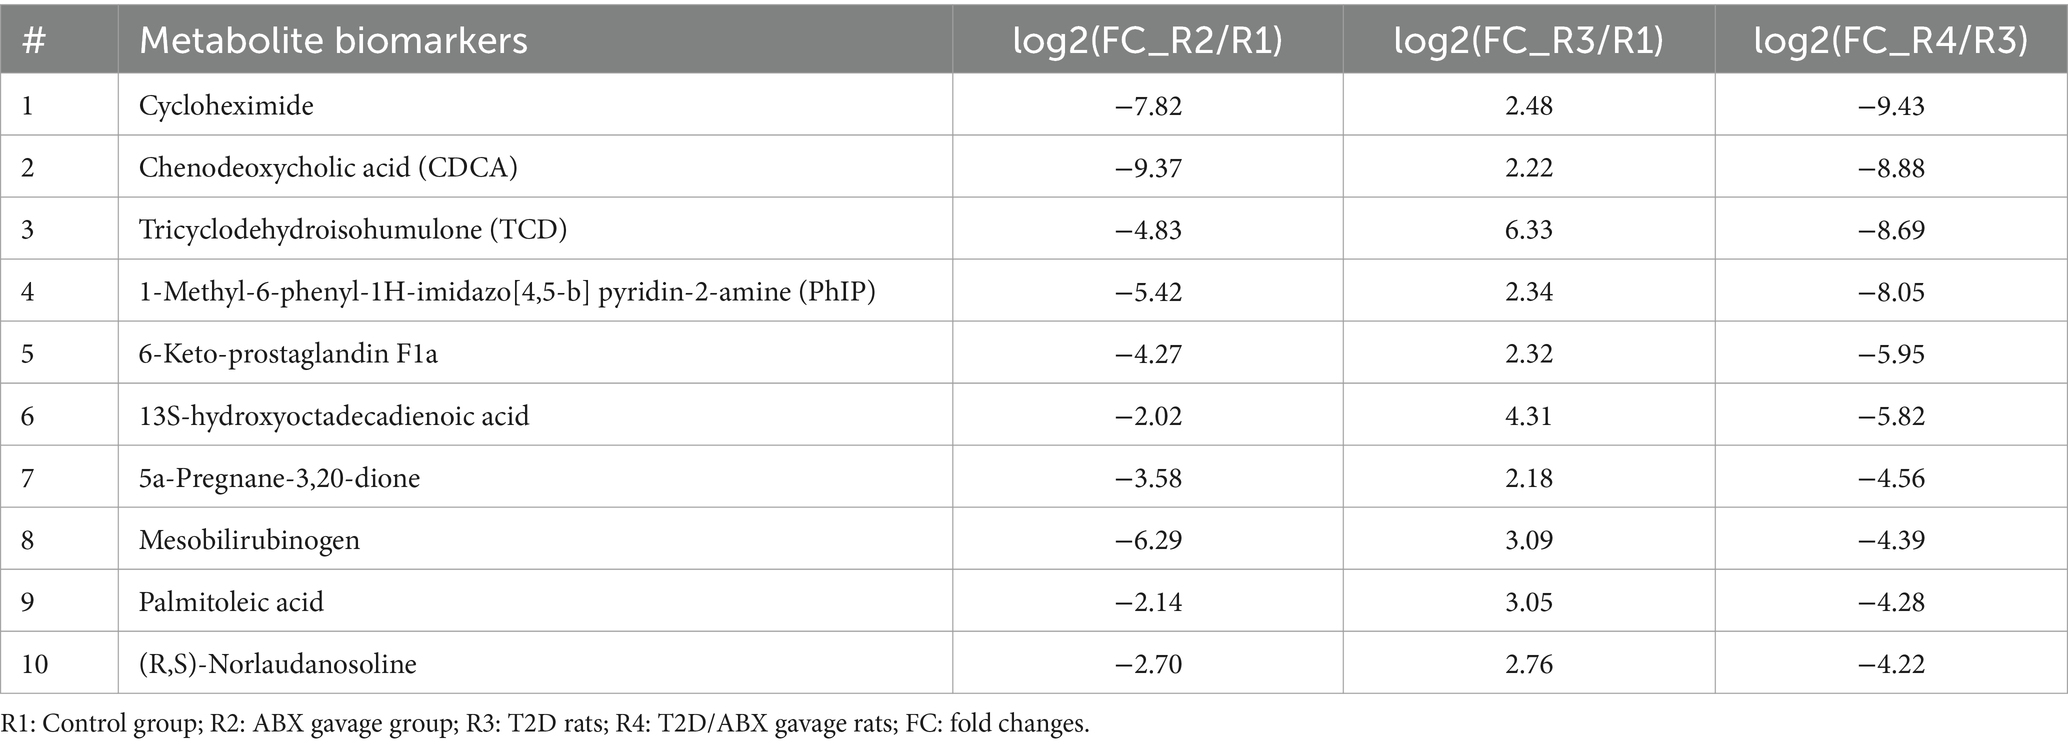
Table 1. Top 10 common metabolite markers among R1–R4 groups.
Diabetic retinopathy (DR) is the most common diabetes complication and the leading cause of blindness in the working-age population. Both DR patients (Jayasudha et al., 2020; Das et al., 2021; Huang et al., 2021; Ye et al., 2021; Zhou et al., 2021) and DR animal models, such as db/db mice (Beli et al., 2018) and Akita mice (Prasad et al., 2022), exhibit gut dysbiosis. Gut dysbiosis may be necessary for DR development (Fu et al., 2023). This study found that long-term T2D can induce gut dysbiosis, with increased taxa number, alpha diversity, and Firmicutes/Bacteroidetes (F/B) ratio. At the genus level, the abundances of Blautia and Bacteroides increased, while those of Lactobacillus and Prevotella decreased.
Our rat model is different from that of human T2D patients, as previous studies have shown reduced diversity of the gut microbiota in T2DM patients, with a decrease in the abundance of Firmicutes and the F/B ratio (Huang et al., 2021), similar to the gut microbiota in aged humans (Mäkivuokko et al., 2010; Fernandes et al., 2019). Thus, the gut microbiota in the male BN rat model of T2DM we established may differ from the gut microbiota of human T2DM patients due to the relatively young age of the rats (12 months old, analogous to 20- to 30-year-old humans) (Sengupta, 2013).
There are many studies regarding how gut microbiota influences retinal health or retinal diseases (Fu et al., 2021; Fu et al., 2023; Huang et al., 2023; Serban et al., 2023). Gut microbiota influences retinal health in multiple ways and may represent future therapeutic targets in DR (Serban et al., 2023), such as destruction of intestinal barrier (leaky gut) and microbial metabolites, including SCFAs, TUDCA and lactic acid.
Previous studies conducted using different rat strains have detected DR lesions at different durations of diabetes (Robinson et al., 2012). For instance, after 3 months of diabetes, inflammatory changes in the diabetic rat retina are highly strain dependent, which are detected only in Sprague–Dawley (SD) rats but not Brown Norway (BN), or Long-Evans rats (Kirwin et al., 2009). After 8 months of diabetes, Lewis rats showed the most accelerated loss of retinal vessels and RGCs, whereas Wistar rats showed degeneration of the retinal vascular vessels without significant neurodegeneration and SD rats showed no lesions at this time point (Kern et al., 2010). In this study, long-term (6 months) T2D induced retinal ganglion cell loss but did not increase the number of retinal microglia or alter the retinal vasculature. This may suggest that retinal degeneration is the earliest feature of DR, which is consistent with previous reports (Sachdeva, 2021). Metabolomic analysis revealed 276 differentially abundant metabolites in the T2D group, some of which can be regulated by ABX gavage, such as cycloheximide, chenodeoxycholic acid (CDCA), and palmitoleic acid. If these metabolites play a role in the development of DR, further investigation is needed.
Microglia is an immune cell in the brain that plays important roles in modulating inflammation and neurogenesis. The relationship between the gut microbiota and microglia has been a research hotspot in recent years (Mossad and Erny, 2020; Bettag et al., 2023). Several studies have investigated the correlation between the gut microbiota and brain microglia in embryonic, offspring, and adult mice, primarily utilizing germ-free (GF) mice (Erny et al., 2015; Mosher and Wyss-Coray, 2015; Thion et al., 2018). Microglia in GF mice exhibit increased cell density, likely due to the upregulation of Csf1r, Ddit4, and Tgf-ß1, which can promote cell survival and proliferation (Mossad and Erny, 2020). They also have a hyper-ramified morphology and defective function, as they fail to induce an immune response upon the lipopolysaccharide (LPS) challenge. These defects can be partially reversed by supplementation with short-chain fatty acids (SCFAs). Defective microglial morphology and functional phenotypes are also observed in mice treated with broad-spectrum antibiotics (ABXs) for 4 weeks, with an average microglial density of Erny et al. (2015).
In this study, we found that ABX gavage for 6 months can deplete the gut microbiota and reduce the density of retinal microglia, which is slightly different from previous observations in ABX-treated mice (Erny et al., 2015; Cordella et al., 2021). One possible explanation is that our treatment duration was much longer (6 months) than the 2 or 4-week duration used in previous studies.
In adult rats, the gut microbiota mainly affects the recruitment of retinal microglia through metabolites. Metabolomic analysis revealed 495 differentially abundant metabolites including 12 SCFAs in the ABX gavage group (Supplementary Tables S1, S2). The level of palmitoleic acid, which can promote the activation and proliferation of microglia (Wang et al., 2012; Urso and Zhou, 2021), was significantly decreased in ABX gavage-treated rats. This may partially explain ABX-induced microglia reduction.
Microglia cells are the resident immunocompetent cells in the retina. There are many studies regarding microglia function and retinal health (Guo et al., 2022; Murenu et al., 2022; Rathnasamy et al., 2019). In brief, retinal microglia contribute to the development and function of retina; In the developing retina, they are involved in the pruning of neuronal and vascular networks through the phagocytic removal of dead cell debris (Fernandes et al., 2014). In the adult retina, they reside in the plexiform layers and can secret neurotrophic factors to support retinal cell survival. They continuously monitor their environment and when activated, they shift toward an amoeboid morphology (Davis et al., 1994). Microglial activation is detrimental to normal functioning of the retina and indicative of a variety of retinal diseases. Microglia cells, with their highly motile processes extending into the capillary wall, are likely the first detector of metabolic changes in diabetes (Graeber et al., 2011). Once activated, microglia become mobile and migrate to the site of inflammation and will produce a wide range of pro-inflammatory cytokines, glutamate, ROS, nitrous oxide (NO) and proteases. Under chronic activation conditions, these products can be very toxic to RGCs, inducing retinal dysfunction (Zeng et al., 2008). Thus, activated retinal microglia are a therapeutic target in retinal diseases (Rathnasamy et al., 2019).
Using the same strategy in control rats, we treated T2D rats with ABX via gavage for 6 months. We found that ABX gavage reduced the density of retinal microglia and partially rescued ganglion cell loss in these T2D rats. The mechanism may be attributed to multiple factors, including a decline in the phagocytic function of microglia toward ganglion cells (Bodeutsch and Thanos, 2000; Schafer et al., 2012; Au and Ma, 2022), a reduction in the secretion of proinflammatory factors (Takeda et al., 2018), and potentially the influence of gut microbiota metabolites.
Metabolomic analysis revealed 516 differentially abundant metabolites including 14 SCFAs in the T2D/(T2D + ABX) group. Notably, microglia-activator palmitoleic acid increased in the T2D rats but greatly reduced in the ABX-treated T2D rats. Benzene-induced hematopoietic toxicity was mediated by the gut microbiota-palmitoleic acid axis (Zhang et al., 2024). If this axis mediates T2D-induced ganglion cell loss, it deserves further investigation.
Even though ABX gavage can partially rescue RGC loss in these T2D rats, it may be not practical to apply ABX to treat T2D patients, as known side effects (Wiens et al., 2018). Diabetes-induced dysbiosis can be treated by probiotics, or fecal microbiota transplantation (FMT) (Fu et al., 2023).
There are some limitations of this study. First, we only measured the density and distribution of retinal microglia but not their morphology and function in the T2D rat model. Second, even though we had determined some candidate metabolites, we had not measured their plasma concentration and tested whether they were responsible for the retinal phenotypes we observed.
For more than 6 months, T2D in adult male BN rats led to dysbiosis and a significant reduction in retinal ganglion cells but without major changes in retinal microglia or retinal vascular vessels. Broad-spectrum antibiotic (ABX) gavage for 6 months depleted gut microbes in adult rats, reduced retinal microglia and rescued the ganglion loss in T2D rats. The gut microbiota and retinal microglia are future targets for diabetic retinopathy therapy.
Initial 16S RNA sequences are available in the NCBI Genbank under BioProject PRJNA1208557 and accession numbers SRR31944784-31944803.
The animal study was approved by Experimental Animal Ethics Committee of West China Hospital of Sichuan University (AUP# 2018008A). The study was conducted in accordance with the local legislation and institutional requirements.
JH: Data curation, Formal analysis, Investigation, Methodology, Writing – original draft. ZL: Data curation, Formal analysis, Investigation, Methodology, Validation, Writing – original draft. YW: Conceptualization, Formal analysis, Funding acquisition, Investigation, Methodology, Project administration, Visualization, Writing – original draft, Writing – review & editing. DC: Conceptualization, Formal analysis, Funding acquisition, Resources, Supervision, Writing – original draft, Writing – review & editing.
The author(s) declare that financial support was received for the research, authorship, and/or publication of this article. This work was supported by the National Natural Science Foundation of China (82171063 to DC and 82101154 to YW). The funders had no role in the study design, data collection and analysis, publication decisions, or manuscript preparation.
The authors declare that the research was conducted in the absence of any commercial or financial relationships that could be construed as a potential conflict of interest.
The author(s) declared that they were an editorial board member of Frontiers, at the time of submission. This had no impact on the peer review process and the final decision.
All claims expressed in this article are solely those of the authors and do not necessarily represent those of their affiliated organizations, or those of the publisher, the editors and the reviewers. Any product that may be evaluated in this article, or claim that may be made by its manufacturer, is not guaranteed or endorsed by the publisher.
The Supplementary material for this article can be found online at: https://www.frontiersin.org/articles/10.3389/fmicb.2025.1479792/full#supplementary-material
Arrigo, A., Teussink, M., Aragona, E., Bandello, F., and Battaglia Parodi, M. (2021). MultiColor imaging to detect different subtypes of retinal microaneurysms in diabetic retinopathy. Eye (Lond.) 35, 277–281. doi: 10.1038/s41433-020-0811-6
Au, N. P. B., and Ma, C. H. E. (2022). Neuroinflammation, microglia and implications for retinal ganglion cell survival and axon regeneration in traumatic optic neuropathy. Front. Immunol. 13:860070. doi: 10.3389/fimmu.2022.860070
Bayer, F., Ascher, S., Pontarollo, G., and Reinhardt, C. (2019). Antibiotic Treatment Protocols and Germ-Free Mouse Models in Vascular Research. Front Immunol 10:2174.
Beli, E., Yan, Y., Moldovan, L., Vieira, C. P., Gao, R., Duan, Y., et al. (2018). Restructuring of the gut microbiome by intermittent fasting prevents retinopathy and prolongs survival in db/db mice. Diabetes 67, 1867–1879. doi: 10.2337/db18-0158
Bettag, J., Goldenberg, D., Carter, J., Morfin, S., Borsotti, A., Fox, J., et al. (2023). Gut microbiota to microglia: microbiome influences neurodevelopment in the CNS. Children (Basel) 10:1767. doi: 10.3390/children10111767
Bodeutsch, N., and Thanos, S. (2000). Migration of phagocytotic cells and development of the murine intraretinal microglial network: an in vivo study using fluorescent dyes. Glia 32, 91–101. doi: 10.1002/1098-1136(200010)32:1<91::AID-GLIA90>3.0.CO;2-X
Chen, D., Opavsky, R., Pacal, M., Tanimoto, N., Wenzel, P., Seeliger, M. W., et al. (2007). Rb-mediated neuronal differentiation through cell-cycle-independent regulation of E2f3a. PLoS Biol. 5:e179. doi: 10.1371/journal.pbio.0050179
Cordella, F., Sanchini, C., Rosito, M., Ferrucci, L., Pediconi, N., Cortese, B., et al. (2021). Antibiotics treatment modulates microglia-synapses interaction. Cells 10:2648. doi: 10.3390/cells10102648
Davis, E. J., Foster, T. D., and Thomas, W. E. (1994). Cellular forms and functions of brain microglia. Brain Res Bull 34, 73–78.
Das, T., Jayasudha, R., Chakravarthy, S., Prashanthi, G. S., Bhargava, A., Tyagi, M., et al. (2021). Alterations in the gut bacterial microbiome in people with type 2 diabetes mellitus and diabetic retinopathy. Sci. Rep. 11:2738. doi: 10.1038/s41598-021-82538-0
Erny, D., Hrabě De Angelis, A. L., Jaitin, D., Wieghofer, P., Staszewski, O., David, E., et al. (2015). Host microbiota constantly control maturation and function of microglia in the CNS. Nat. Neurosci. 18, 965–977. doi: 10.1038/nn.4030
Fernandes, A., Miller-Fleming, L., and Pais, T. F. (2014). Microglia and inflammation: conspiracy, controversy or control? Cell Mol Life Sci 71, 3969–3985.
Fernandes, R., Viana, S. D., Nunes, S., and Reis, F. (2019). Diabetic gut microbiota dysbiosis as an inflammaging and immunosenescence condition that fosters progression of retinopathy and nephropathy. Biochim. Biophys. Acta Mol. basis Dis. 1865, 1876–1897. doi: 10.1016/j.bbadis.2018.09.032
Fu, X., Chen, Y., and Chen, D. (2021). The Role of Gut Microbiome in Autoimmune Uveitis. Ophthalmic Res 64, 168–177.
Fu, X., Tan, H., Huang, L., Chen, W., Ren, X., and Chen, D. (2023). Gut microbiota and eye diseases: a bibliometric study and visualization analysis. Front. Cell. Infect. Microbiol. 13:1225859. doi: 10.3389/fcimb.2023.1225859
Graeber, M. B., Li, W., and Rodriguez, M. L. (2011). Role of microglia in CNS inflammation. FEBS Lett 585, 3798–3805.
Gritz, E. C., and Bhandari, V. (2015). The human neonatal gut microbiome: a brief review. Front. Pediatr. 3:17. doi: 10.3389/fped.2015.00017
Guo, L., Choi, S., Bikkannavar, P., and Cordeiro, M. F. (2022). Microglia: Key Players in Retinal Ageing and Neurodegeneration. Front Cell Neurosci 16:804782.
Huang, Y., Wang, Z., Ma, H., Ji, S., Chen, Z., Cui, Z., et al. (2021). Dysbiosis and implication of the gut microbiota in diabetic retinopathy. Front. Cell. Infect. Microbiol. 11:646348. doi: 10.3389/fcimb.2021.646348
Huang, L., Hong, Y., Fu, X., Tan, H., Chen, Y., Wang, Y., et al. (2023). The role of the microbiota in glaucoma. Mol Aspects Med 94:101221.
Jayasudha, R., Das, T., Kalyana Chakravarthy, S., Sai Prashanthi, G., Bhargava, A., Tyagi, M., et al. (2020). Gut mycobiomes are altered in people with type 2 diabetes mellitus and diabetic retinopathy. PLoS One 15:e0243077. doi: 10.1371/journal.pone.0243077
Johnson, K. V. A., and Burnet, P. W. J. (2020). Opposing effects of antibiotics and germ-free status on neuropeptide systems involved in social behaviour and pain regulation. BMC Neurosci. 21:32. doi: 10.1186/s12868-020-00583-3
Kennedy, E. A., King, K. Y., and Baldridge, M. T. (2018). Mouse Microbiota Models: Comparing Germ-Free Mice and Antibiotics Treatment as Tools for Modifying Gut Bacteria. Front Physiol 9:1534.
Kern, T. S., Miller, C. M., Tang, J., Du, Y., Ball, S. L., and Berti-Matera, L. (2010). Comparison of three strains of diabetic rats with respect to the rate at which retinopathy and tactile allodynia develop. Mol Vis 16, 1629–1639.
Kirwin, S. J., Kanaly, S. T., Linke, N. A., and Edelman, J. L. (2009). Strain-dependent increases in retinal inflammatory proteins and photoreceptor FGF-2 expression in streptozotocin-induced diabetic rats. Invest Ophthalmol Vis Sci 50, 5396–5404.
Li, S., Li, T., Luo, Y., Yu, H., Sun, Y., Zhou, H., et al. (2011). Retro-orbital injection of FITC-dextran is an effective and economical method for observing mouse retinal vessels. Mol. Vis. 17, 3566–3573. Available at: https://pmc.ncbi.nlm.nih.gov/articles/PMC3250377/
Li, N., Ma, W. T., Pang, M., Fan, Q. L., and Hua, J. L. (2019). The commensal microbiota and viral infection: a comprehensive review. Front. Immunol. 10:1551. doi: 10.3389/fimmu.2019.01551
Li, J., Wu, Y., Liu, B., Huang, Y., Wu, Q., Li, H., et al. (2021). Retro-orbital injection of FITC-dextran combined with isolectin B4 in assessing the retinal neovascularization defect. BMC Ophthalmol. 21:208. doi: 10.1186/s12886-021-01969-5
Mäkivuokko, H., Tiihonen, K., Tynkkynen, S., Paulin, L., and Rautonen, N. (2010). The effect of age and non-steroidal anti-inflammatory drugs on human intestinal microbiota composition. Br. J. Nutr. 103, 227–234. doi: 10.1017/S0007114509991553
Mosher, K. I., and Wyss-Coray, T. (2015). Go with your gut: microbiota meet microglia. Nat. Neurosci. 18, 930–931. doi: 10.1038/nn.4051
Mossad, O., Batut, B., Yilmaz, B., Dokalis, N., Mezö, C., Nent, E., et al. (2022). Gut microbiota drives age-related oxidative stress and mitochondrial damage in microglia via the metabolite N(6)-carboxymethyllysine. Nat. Neurosci. 25, 295–305. doi: 10.1038/s41593-022-01027-3
Mossad, O., and Erny, D. (2020). The microbiota-microglia axis in central nervous system disorders. Brain Pathol. 30, 1159–1177. doi: 10.1111/bpa.12908
Murenu, E., Gerhardt, M. J., Biel, M., and Michalakis, S. (2022). More than meets the eye: The role of microglia in healthy and diseased retina. Front Immunol 13:1006897.
Prasad, R., Asare-Bediko, B., Harbour, A., Floyd, J. L., Chakraborty, D., Duan, Y., et al. (2022). Microbial signatures in the rodent eyes with retinal dysfunction and diabetic retinopathy. Invest. Ophthalmol. Vis. Sci. 63:5. doi: 10.1167/iovs.63.1.5
Querques, L., Parravano, M., Borrelli, E., Chiaravalloti, A., Tedeschi, M., Sacconi, R., et al. (2020). Anatomical and functional changes in neovascular AMD in remission: comparison of fibrocellular and fibrovascular phenotypes. Br. J. Ophthalmol. 104, 47–52. doi: 10.1136/bjophthalmol-2018-313685
Rathnasamy, G., Foulds, W. S., Ling, E. A., and Kaur, C. (2019). Retinal microglia - A key player in healthy and diseased retina. Prog Neurobiol 173, 18–40.
Reikvam, D. H., Erofeev, A., Sandvik, A., Grcic, V., Jahnsen, F. L., Gaustad, P., et al. (2011). Depletion of murine intestinal microbiota: effects on gut mucosa and epithelial gene expression. PLoS One 6:e17996. doi: 10.1371/journal.pone.0017996
Robinson, R., Barathi, V. A., Chaurasia, S. S., Wong, T. Y., and Kern, T. S. (2012). Update on animal models of diabetic retinopathy: from molecular approaches to mice and higher mammals. Dis Model Mech 5, 444–456.
Robles Alonso, V., and Guarner, F. (2013). Linking the gut microbiota to human health. Br. J. Nutr. 109, S21–S26. doi: 10.1017/S0007114512005235
Sachdeva, M. M. (2021). Retinal neurodegeneration in diabetes: an emerging concept in diabetic retinopathy. Curr. Diab. Rep. 21:65. doi: 10.1007/s11892-021-01428-x
Schafer, D. P., Lehrman, E. K., Kautzman, A. G., Koyama, R., Mardinly, A. R., Yamasaki, R., et al. (2012). Microglia sculpt postnatal neural circuits in an activity and complement-dependent manner. Neuron 74, 691–705. doi: 10.1016/j.neuron.2012.03.026
Sengupta, P. (2013). The laboratory rat: relating its age with human's. Int. J. Prev. Med. 4, 624–630. Available at: https://pmc.ncbi.nlm.nih.gov/articles/PMC3733029/
Serban, D., Dascalu, A. M., Arsene, A. L., Tribus, L. C., Vancea, G., Pantea Stoian, A., et al. (2023). Gut Microbiota Dysbiosis in Diabetic Retinopathy-Current Knowledge and Future Therapeutic Targets. Life (Basel) 13.
Sorrentino, F. S., Allkabes, M., Salsini, G., Bonifazzi, C., and Perri, P. (2016). The importance of glial cells in the homeostasis of the retinal microenvironment and their pivotal role in the course of diabetic retinopathy. Life Sci. 162, 54–59. doi: 10.1016/j.lfs.2016.08.001
Szablewski, L. (2018). Human gut microbiota in health and Alzheimer's disease. J. Alzheimers Dis. 62, 549–560. doi: 10.3233/JAD-170908
Takeda, A., Shinozaki, Y., Kashiwagi, K., Ohno, N., Eto, K., Wake, H., et al. (2018). Microglia mediate non-cell-autonomous cell death of retinal ganglion cells. Glia 66, 2366–2384. doi: 10.1002/glia.23475
Thion, M. S., Low, D., Silvin, A., Chen, J., Grisel, P., Schulte-Schrepping, J., et al. (2018). Microbiome influences prenatal and adult microglia in a sex-specific manner. Cell 172, 500–516.e16. doi: 10.1016/j.cell.2017.11.042
Urso, C. J., and Zhou, H. (2021). Palmitic acid lipotoxicity in microglia cells is ameliorated by unsaturated fatty acids. Int. J. Mol. Sci. 22:9093. doi: 10.3390/ijms22169093
Wang, Z., Liu, D., Wang, F., Liu, S., Zhao, S., Ling, E. A., et al. (2012). Saturated fatty acids activate microglia via toll-like receptor 4/NF-κB signalling. Br. J. Nutr. 107, 229–241. doi: 10.1017/S0007114511002868
Wiens, J., Snyder, G. M., Finlayson, S., Mahoney, M. V., and Celi, L. A. (2018). Potential adverse effects of broad-Spectrum antimicrobial exposure in the intensive care unit. Open Forum Infect. Dis. 5:ofx270. doi: 10.1093/ofid/ofx270
Wong, T. Y., Cheung, C. M., Larsen, M., Sharma, S., and Simó, R. (2016). Diabetic retinopathy. Nat. Rev. Dis. Primers 2:16012. doi: 10.1038/nrdp.2016.12
Ye, P., Zhang, X., Xu, Y., Xu, J., Song, X., and Yao, K. (2021). Alterations of the gut microbiome and metabolome in patients with proliferative diabetic retinopathy. Front. Microbiol. 12:667632. doi: 10.3389/fmicb.2021.667632
Zeng, H. Y., Green, W. R., and Tso, M. O. (2008). Microglial activation in human diabetic retinopathy. Arch. Ophthalmol. 126, 227–232. doi: 10.1001/archophthalmol.2007.65
Zeng, X. X., Ng, Y. K., and Ling, E. A. (2000). Neuronal and microglial response in the retina of streptozotocin-induced diabetic rats. Vis. Neurosci. 17, 463–471. doi: 10.1017/S0952523800173122
Zhang, L., Liu, Z., Zhang, W., Wang, J., Kang, H., Jing, J., et al. (2024). Gut microbiota-palmitoleic acid-interleukin-5 axis orchestrates benzene-induced hematopoietic toxicity. Gut Microbes 16:2323227. doi: 10.1080/19490976.2024.2323227
Keywords: diabetic retinopathy, microglia, gut microbiota, broad-spectrum antibiotics, retinal ganglion cells, BN rats
Citation: Hou J, Lv Z, Wang Y and Chen D (2025) The gut microbiota regulates diabetic retinopathy in adult rats. Front. Microbiol. 16:1479792. doi: 10.3389/fmicb.2025.1479792
Edited by:
Elisavet Stavropoulou, Centre Hospitalier Universitaire Vaudois (CHUV), SwitzerlandReviewed by:
Rajeev Kumar Pandey, Thermo Fisher Scientific (India), IndiaCopyright © 2025 Hou, Lv, Wang and Chen. This is an open-access article distributed under the terms of the Creative Commons Attribution License (CC BY). The use, distribution or reproduction in other forums is permitted, provided the original author(s) and the copyright owner(s) are credited and that the original publication in this journal is cited, in accordance with accepted academic practice. No use, distribution or reproduction is permitted which does not comply with these terms.
*Correspondence: Yujiao Wang, d3lqZHJhZ29uQHFxLmNvbQ==; Danian Chen, ZGFuaWFuY2hlbjIwMDZAcXEuY29t
†ORCID: Danian Chen, https://orcid.org/0000-0002-6916-2978
†These authors have contributed equally to this work
Disclaimer: All claims expressed in this article are solely those of the authors and do not necessarily represent those of their affiliated organizations, or those of the publisher, the editors and the reviewers. Any product that may be evaluated in this article or claim that may be made by its manufacturer is not guaranteed or endorsed by the publisher.
Research integrity at Frontiers
Learn more about the work of our research integrity team to safeguard the quality of each article we publish.