 Alta E. G. Howells1,2*
 Lilja M. Quinn2,3
 Miguel G. Silva2,4Kylie Akiyama2,5
 Lucas M. Fifer6,7
 Grayson Boyer8
 Srishti Kashyap9Kirt Robinson2,8
 Jared Broddrick1Everett L. Shock8
 Tori M. Hoehler1
- 1NASA Ames Research Center, Moffett Field, CA, United States
- 2Blue Marble Space Institute of Sciences, San Francisco, CA, United States
- 3Department of Biology, Washington University, St. Louis, MO, United States
- 4Department of Aeronautics and Astronautics, Stanford University, Palo Alto, CA, United States
- 5Department of Bioengineering, University of California, Berkeley, Berkeley, CA, United States
- 6Department of Earth and Space Sciences, University of Washington, Seattle, WA, United States
- 7Astrobiology Program, University of Washington, Seattle, WA, United States
- 8School of Earth and Space Exploration, Arizona State University, Tempe, AZ, United States
- 9Department of Geological Sciences, University of Colorado, Boulder, CO, United States
Serpentinization, the reaction of water with ultramafic rock, produces reduced, hyperalkaline, and H2-rich fluids that support a variety of hydrogenotrophic microbial metabolisms. Previous work indicates the occurrence of methanogenesis in fluids from the actively serpentinizing Samail Ophiolite in the Sultanate of Oman. While those fluids contain abundant H2 to fuel hydrogenotrophic methanogenesis (CO2 + 4H2 ➔ CH4 + 2H2O), the concentration of CO2 is very low due to the hyperalkalinity (> pH 11) and geochemistry of the fluids. As a result, species such as formate and acetate may be important as alternative methanogenic substrates. In this study we quantified the impact of inorganic carbon, formate and acetate availability for methanogenic metabolisms, across a range of fluid chemistries, in terms of (1) the potential diffusive flux of substrates to the cell, (2) the Affinity (Gibbs energy change) associated with methanogenic metabolism, and (3) the energy “inventory” per kg fluid. In parallel, we assessed the genomic potential for the conduct of those three methanogenic modes across the same set of fluids and consider the results within the quantitative framework of energy availability. We find that formatotrophic methanogenesis affords a higher Affinity (greater energetic yield) than acetoclastic and hydrogenotrophic methanogenesis in pristine serpentinized fluids and, in agreement with previous studies, find genomic evidence for a methanogen of the genus Methanobacterium to carry out formatotrophic and hydrogenotrophic methanogenesis, with the possibility of even using bicarbonate as a supply of CO2. Acetoclastic methanogenesis is also shown to be energetically favorable in these fluids, and we report the first detection of a potential acetoclastic methanogen of the family Methanosarcinaceae, which forms a distinct clade with a genome from the serpentinizing seafloor hydrothermal vent field, Lost City. These results demonstrate the applicability of an energy availability framework for interpreting methanogen ecology in serpentinizing systems.
1 Introduction
In the subsurface, where energy from sunlight is not available to life, microorganisms must rely on redox chemical disequilibria as a source of energy. Such disequilibria can result from the reaction of water and rocks. One example is the process of serpentinization, where primary ferrous iron minerals in reduced ultramafic rock from the upper mantle react with water to produce secondary ferric iron minerals and H2 (McCollom and Bach, 2009). In addition to being H2-rich, fluids generated through serpentinization are reduced and hyperalkaline. H2 generated from this process can serve as an electron donor for many microbial metabolisms. When the serpentinized fluid mixes with unreacted fluids rich in electron acceptors, chemical disequilibrium is achieved, and the resulting energy can support life. The energy-rich, habitable zones created in the subsurface by serpentinization are of great interest to astrobiology. Evidence shows that water-rock reactions like serpentinization may occur on the moon of Saturn, Enceladus, and supply H2 detected in its plumes (Waite et al., 2017). Water-rock reactions may also be a relevant process for Europa, a moon of Jupiter (Vance et al., 2023). Serpentinizing systems on Earth provide a window into the potential habitability of Enceladus, Europa, and possibly other ocean worlds in our outer solar system. Therefore, of the many subsurface processes that can support life through chemical disequilibrium, we are highly motivated to understand how the subsurface process of serpentinization supports microbial life.
While typically thought of as being associated with the ocean floor along ocean-spreading ridges, serpentinization also occurs where the upper mantle has been uplifted and exposed on the continental crust. One example of continental serpentinization is the Samail Ophiolite in the Sultanate of Oman. Because the Samail ophiolite is located in an arid desert, the fluids receive little influence from surrounding vegetation and the fluid chemistry and associated microbiology are predominantly influenced by water-rock reactions.
The geological and physical processes governing fluid chemistry in Oman are well characterized through geochemical modeling and geochemical and mineralogical characterization (Kelemen et al., 2011; Miller et al., 2016; Canovas et al., 2017; Leong et al., 2021; Nothaft et al., 2021a). In Oman, there are two distinct fluid types. Type II fluids—representative of pristine serpentinized fluids—reacted in the deep subsurface (>500 meters). Type II fluids are highly reduced CaOH2 solutions that have high concentrations of H2, are hyperalkaline (>pH 11), and have low concentrations of dissolved inorganic carbon (DIC). Type I fluids are partially reacted in the shallow subsurface (<50 meters) and are MgHCO3+ solutions. Type I fluids are circumneutral (pH 7–8), have a lower concentration of H2 than Type II fluids, and are more oxidized due to the influence from the atmosphere (Leong et al., 2021). The two fluid types can mix in the subsurface and at the surface when expressed through fault lines and fissures to create steep geochemical gradients, making the process of serpentinization in Oman an ideal environment to understand the microbiological response to extreme conditions, namely alkaline pH and carbon limitation.
Methanogenesis, particularly hydrogenotrophic methanogenesis (4H2 + CO2 ➔ CH4 + 2H2O), has long been considered as a model for other ocean worlds given that methanogens are deeply rooted in Earth’s tree of life and utilize a metabolism that could readily proceed independently of the input of sunlight energy. Given the ample supply of H2, methanogenesis is an energetically favorable process in serpentinizing systems and a growing body of evidence points to its occurrence therein (Miller et al., 2016; Canovas et al., 2017; Rempfert et al., 2017; Fones et al., 2021; Nothaft et al., 2021a; Nothaft et al., 2021b; Thieringer et al., 2023; Howells et al., 2022). However, serpentinization typically yields fluids that are highly depleted in dissolved inorganic carbon (DIC) and, at high pH, have exceedingly low concentrations of the methanogenic substrate CO2. The dissolved inorganic carbon concentration in pristine Type II serpentinized fluids can be as low as 20 μM (Howells et al., 2022). For the mesophilic, neutrophilic organism Methanobacterium congolense, Chen et al. (2019) report a Monod half-saturation constant for DIC of KS-DIC = 2.2 mM, meaning that the cell will grow at half of its maximum rate at that DIC concentration. Below that concentration, the growth rate decreases approximately linearly with respect to DIC concentration. The implication of environmental DIC concentrations 100-fold lower than the reported KS-DIC is, therefore, a 100-fold lower growth rate. The situation is compounded for CO2, which is indicated by experimental and X-ray crystallographic studies to be the form of DIC that reacts during the first step of methanogenesis (Vorholt and Thauer, 1997) in presently characterized methanogens: based on the pKa of carbonic acid (~6.5) and the pH of the fluids (~11.5) (see modeled CO2 concentrations in Howells et al., 2022) the difference in CO2 concentration is eight orders of magnitude. DIC availability may thus significantly limit methanogenesis in serpentinizing systems.
Previous work suggests that DIC availability may indeed be a substantial influence on methanogen ecology for fluids that have undergone the greatest extent of water-rock reaction (Type II). Fones et al. (2021) reported that methanogens of the genus Methanobacterium, associated with Type II fluids in the Samail ophiolite, have genomic potential for the uptake of formate and conversion of formate to CO2 for hydrogenotrophic methanogenesis (Fones et al., 2021). Furthermore, Type II Methanobacterium genomes show evidence for loss of H2 utilization, suggesting that those organisms may rely on formate as an electron donor instead. In parallel, incubations with 14C formate and 14C bicarbonate showed significant methanogenic activity with formate and no activity for bicarbonate in Type II fluids. In contrast Methanobacterium genomes from Type I fluids reflect an ability to carry out hydrogenotrophic methanogenesis with H2 as an electron donor, and methanogenesis from both formate and bicarbonate was observed. In agreement with Fones et al. (2021), Thieringer et al. (2023) observed the distinct Type I and Type II Methanobacterium genomes in shotgun metagenome sequencing data from recently drilled bore-hole fluids. However, in addition to formate utilization, they found genomic evidence for acetate uptake by Methanobacterium as a carbon source. No studies on serpentinized fluids in Oman have shown evidence for acetoclastic methanogens, namely of the families Methanosarcinaceae and Methanosaetacea. Potential acetoclastic methanogens of the family Methanosarcinaceae have only been detected in the seafloor hydrothermal serpentinized fluids of Lost City (McGonigle et al., 2020; Brazelton et al., 2022) and in no other serpentinizing systems studied to date (Colman et al., 2024).
The energy yield from acetoclastic and formatotrophic methanogenesis is generally lower than from CO2 reduction with H2 (Stams and de Sousa, 2019). However, these pathways could become more energetically favorable and support microbial life in environments where CO2 is limited but acetate or formate are available. Both acetate and formate can be produced abiotically in serpentinization-driven hydrothermal systems through Fischer-Tropsch-type (FTT) synthesis reactions, which involve the reduction of inorganic carbon (CO or CO2) with H2 under high-temperature, high-pressure conditions (McCollom and Seewald, 2007; McDermott et al., 2015) and therefore are a viable carbon source in serpentinizing systems. Both reactions, summarized in Table 1, can produce inorganic carbon, which can feed into the hydrogenotrophic pathways for methanogenesis. Furthermore, serpentinized fluids provide a unique opportunity to examine how low CO2 concentrations as a product of these reactions influence overall energy availability.
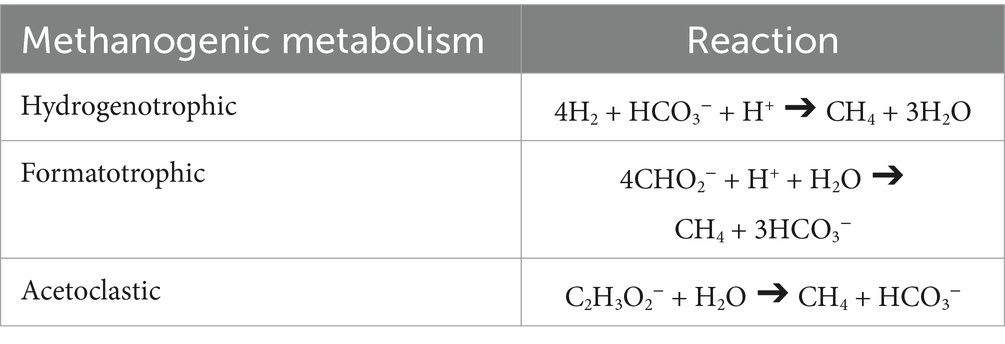
Table 1. Summary of redox reactions for methanogenic metabolisms examined in this study.
Multiple authors (Fones et al., 2021; Nothaft et al., 2021b; Thieringer et al., 2023; Colman et al., 2022) have pointed to low DIC availability as potentially influencing the microbial ecology of serpentinizing systems in Oman. In this study we quantitatively examine the influence of DIC availability on methanogenesis from three perspectives: (1) potential flux of substrates to the cell, (2) chemical affinity for the methanogenic metabolism, and (3) energy inventory per volume of fluid. Here, we focus on surface expressions of serpentinized fluids which allow ready access to significant chemical diversity (Canovas et al., 2017; Leong et al., 2021; Howells et al., 2022). Surface fluids largely retain both geochemical and biological similarity relative to subsurface fluids, while potentially also allowing us to consider the influence of mixing and atmospheric contact (Leong et al., 2021). For this study we collected and analyzed fluids for the concentration of acetate and formate and combined this new data set with DIC, H2 and CH4 values reported in Howells et al. (2022) for quantitative analyses of hydrogenotrophic, formatotrophic and acetoclastic methanogenesis (Table 1). We also performed shotgun metagenome sequencing on Type II fluid microbial communities to assess the genomic potential for these metabolisms. In carrying out a comparative energetic and genomic study, we broaden our understanding of possible metabolic strategies in extreme environments and inform our understanding of habitability.
2 Methods
2.1 Organic acid analysis
In this study, we characterized formate and acetate concentrations in surface-expressed fluids at sites, which are summarized in Table 2. The major ion fluid chemistry of these sites was previously reported on by Leong et al. (2021), and microbial community composition was previously reported by Howells et al. (2022) and Howells et al. (2023). Water samples from surface-expressed fluids were collected using a polytetrafluoroethylene (PTFE) scoop for organic acid analyses. The collected water was transferred to a one-liter Nalgene high-density polyethylene (HDPE) bottle. The bottle had a polypropylene tube inserted through a hole cut into the lid leading to a Covidien 140 mL plastic syringe. All plastic components were rinsed three times with each sample before filtration. This closed-system (albeit not airtight) setup was designed to minimize contamination and loss of volatiles from the sample as it was being apportioned into different types of sample containers.
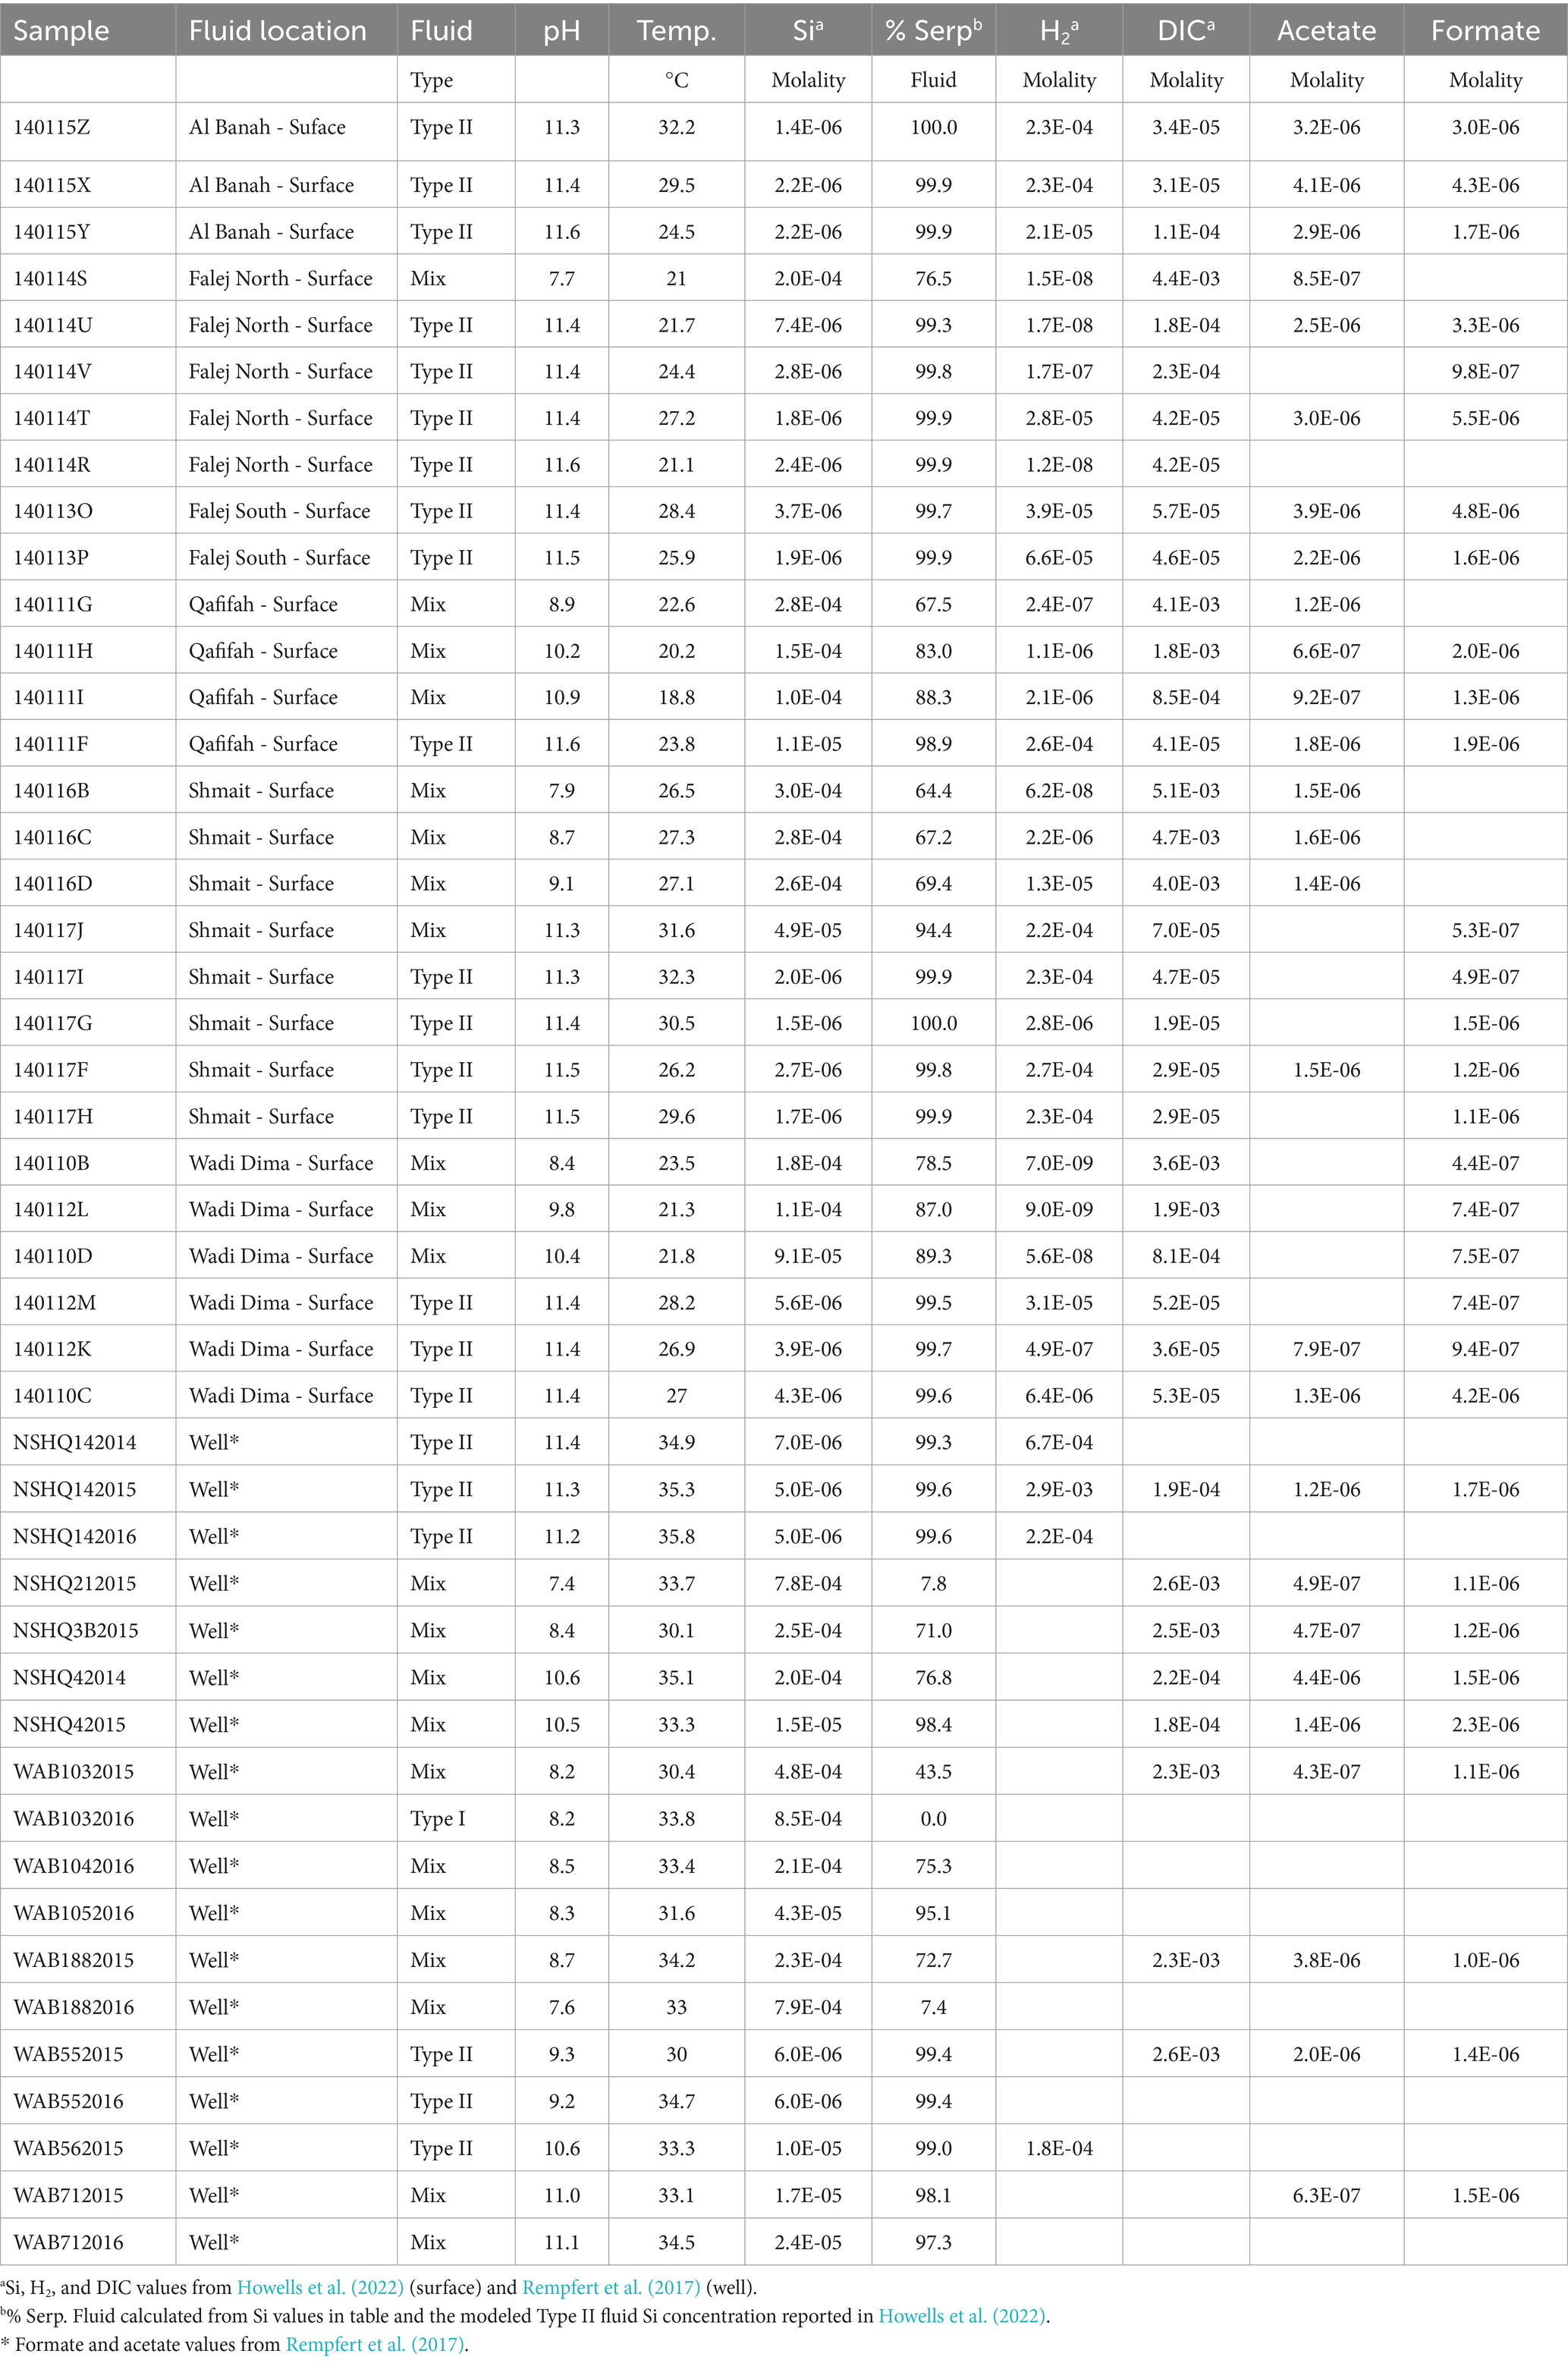
Table 2. Formate and acetate data collected for this study.
Water was then filtered through an Acrodisc® Supor® membrane 0.8/0.2 μm filter to remove particulates and cells. Prior to sample collection, >130 mL of sample was rinsed through the filters and not collected for the analyses. Approximately 20 mL of filtered water was then collected for organic acid anion analysis. Samples for organic acid analysis were collected in 20 mL Qorpak amber glass bottles with PTFE cap inserts. Prior to the field expedition, the amber glass bottles and their PTFE cap inserts were first rinsed three times with DI, and then the cap inserts were soaked for 24 h while the glass bottles were muffled in a furnace at 500°C for 24 h in order to remove any potential residual organic carbon. Then, the cap inserts were dried, and these bottles were also closed for transport to the field. Upon return from the field, the amber glass bottles were refrigerated until the time of analysis, which was under 5 weeks for all samples from the time of their collection.
In the lab, organic acid analysis was performed using a Dionex ICS-1500 ion chromatograph equipped with a Dionex IonPac® ICE-AS6 ion exclusion column (9 × 250 mm), a Dionex AMMS-ICE 300 suppressor, a Dionex DS6 heated conductivity cell detector, and a Dionex AS40 autosampler. Samples were spiked with 25 μL of 3.75 M hydrochloric acid prior to analysis so that sample pH was <7 in order for organic acids to speciate into the proper proportions of associated versus dissociated for interaction with the column. Each sample was run twice, and each run consisted of duplicate injections. The first run used 0.60 mM heptafluorobutyric acid (HFBA) as an eluent and was designed to isolate the formate peak from eluting interferences. The second run used 0.15 mM HFBA to isolate the acetate peak. In both cases, the eluent flow rate was set to 1.00 mL/min. The suppressor regenerant was 5.00 mM tetrabutylammonium hydroxide (TBAOH), set to a nitrogen pressure-driven flow of ~3 mL/min. Five-point calibration curves with R2 > 0.993 were generated for formate and acetate using standards purchased from High-Purity Standards. Natural sample peaks were verified in all cases by overlaying sample and standard chromatograms and, in some cases, verified by standard addition. Instrument detection limits for organic acid anions were ~0.2 μM.
2.2 Energetic calculations
The concentration of major ions and the concentration of Si in this study were previously reported on by Leong et al. (2021) and Howells et al. (2022). For details on methods for fluid sample collection and analyses, please see those studies. Chemical speciation of site fluids to determine chemical activities of reactants and products for methanogenesis reactions summarized in Table 1 were performed on the Water-Organic-Rock-Microbe (WORM) Portal1 using the AqEquil Python package (Boyer et al., 2024) and wrapper for EQ3/6 (Wolery, 2013). During speciation, all redox reactions involving N, C, S, and P were suppressed. The charge balance is set based on pH or Cl− (or no charge balance), depending on the data available for each sample site. Redox state was set based on O2 for fluids with greater influence from the atmosphere (Type I and mix) and H2 for pristine serpentinized fluid (Type II). Chemical affinities and energy supplies for redox reactions were calculated for speciated samples using the calculate_energy function included in AqEquil. This function calculates the chemical affinity of a given reaction, r, using the equation published in Shock et al. (2010),
which is Gibbs energy change of reaction, r, (ΔrG) with respect to reaction progress (ξr). ΔrG is solved by,
with R being the universal gas constant, T the temperature of the fluid in Kelvin, ΔrG° the standard state Gibbs energy of the reaction given by
and Qr the activity product given by
Qr is solved with the chemical activities estimated using the AqEquil package described above where ai is the activity (a) of the given reactant or product (i) raised to its stoichiometry in the reaction (vi,r) (positive for products and negative for reactants). From Equations 1–4 we can solve for affinity,
Chemical affinities calculated using Equation 5 were normalized according to the number of moles CH4 produced (kJ per mole CH4). Energy supplies for each reaction (Er) (J per kg fluid) were calculated using equations outlined in Howells et al. (2022). Briefly, affinity (Ar) in J per mole reaction is multiplied by the concentration of the limiting reactant (mlim) and divided by the stoichiometric coefficient of the limiting reactant (vlim), as summarized below.
Using Equation 6, energy supplies were calculated in AqEquil with the parameter as_written set to False to sum all chemical species in equilibrium with a designated substrate. This accounts for the fact that as the substrate is consumed in 1 kg of fluid, the system re-equilibrates to supply more of that substrate. For example, as HCO3− is consumed from a pool of inorganic carbon, the system re-equilibrates with other inorganic carbon species (CO2(aq), CO32−, CaHCO3+, etc.) to continuously supply CO2 until the whole inorganic carbon pool is consumed. The other option in AqEquil is to set the parameter as_written to True, which only uses the concentration of the substrate specified in the reaction and no other (e.g., HCO3− and no other forms of DIC), however this option was not used in the current study. The output of AqEquil with all estimated chemical activities can be found in Supplementary Table S1.
2.3 Meta-analysis of 16S rRNA gene amplicon sequencing
For the meta-analysis of microbial diversity in subsurface well and surface-expressed serpentinized fluids we downloaded raw 16S rRNA gene amplicon sequencing data from NCBI Short Read Archive (SRA). For well fluids, we downloaded data from SRA accession SRP092764 (Rempfert et al., 2017). For surface data we downloaded from SRA accession, SRP308538 (Howells et al., 2022). Both sets of data were generated using the EMP primer set (Caporaso et al., 2012) and Illumina MiSeq sequencing platform. Rempfert et al. (2017) used the 2 × 250 Illumina method, Howells et al. (2022) used the 1 × 150 Illumina method. Raw data downloaded from NCBI SRA was processed using programs within the QIIME2 version 2021-4 wrapper following protocol described in Howells et al. (2022). Briefly, sequencing quality was checked using FastQC and trimmed based on a quality score of 25 or lower. Sequences were denoised and resolved to 100% sequence similarity with DADA2 (Callahan et al., 2016). The resulting amplicon sequence variants (ASVs) were rarefied to 2,500 counts per sample. Alpha diversity analysis carried out in QIIME2 using the q2-diversity plugin. Taxonomic assignment was done using the QIIME2 plugin, q2-feature-classifier with the naïve Bayes method with pre-trained classifier built using the Green Genes 13_8 99 16S rRNA gene database (DeSantis et al., 2006). We acknowledge Green Genes is an older database, however we find that Green Genes produces comparable taxonomic assignments as the more recent SILVA ribosomal RNA gene database (Quast et al., 2012) as shown by Howells et al. (2023). The rarefied ASV table was exported from QIIME2 and beta diversity (NMDS) analysis carried out with the R package, vegan (version 2.5-6) within the R version 3.6.0 (2019-04-26) (R Core Team, 2021). For the NMDS analysis, rarefied frequencies of ASVs at each site were converted to relative abundances and square-root transformed. Bray–Curtis dissimilarity was calculated on the transformed relative abundances. NMDS ordination was conducted with 1,000 permutations and two dimensions. The stress for the NMDS ordination was 0.2. Supplementary Table S2 is the relative abundance of each ASV at each study site and is used for downstream statistical analyses. Supplementary Table S3 relative abundance of ASVs grouped at the genus level (taxonomy included).
2.4 Shotgun metagenome sequencing
Sediments for shotgun metagenome sequencing were collected simultaneously for 16S rRNA gene amplicon sequencing using the same approach described in Howells et al. (2022) from sites 140112K, 140117H, and 140111F. Pictures of the sampling sites and a description of the sediments can be found in Supplementary Figure S1. In the lab, DNA was extracted using the Quick-DNA Miniprep Plus Kit (catalog #D4068) from Zymo. For each Zymo prep, we extracted DNA from ~500 mg (kit protocol recommends 200 mg, but 500 mg was optimal for our sediments) of wet sediment in replicate for each site and pooled the DNA. For site 140112K, 8 replicate DNA extracts were pooled; for site 140117H, 8 replicates were pooled; and for 140111F, 5 replicates were pooled. We implemented the Zymo protocol for “BioFluid + Cell Buffer.” Prior to carrying out the extraction protocol provided by Zymo, we conducted freeze/thaw cycles where samples were first thawed at room temperature, then frozen at −80°C for 15 min, heated to 55°C for 15 min three times. We carried out a proteinase K step, adding 10 uL of 20 μg/mL proteinase K per 100 mg of wet sediment and incubated at 55°C for 3 h. From there, the “BioFluid + Cell Buffer” protocol was followed. The quality of the DNA extracts was assessed using a NanoDrop. The A260/A280 of the extracts were between 1.5 and 2. PCR was conducted to ensure extracts were PCR amplifiable. DNA extracts were then pooled. The sequencing facility was provided 35 ng DNA from site 140112K, 30 ng DNA from site 140117H, and 60 ng from site 140111F. Shotgun metagenome sequencing was conducted in the Marine Biological Laboratory at Woods Hole Oceanographic Institute using the Illumina 150 × 2 platform using their standard protocol.
We processed shotgun metagenome sequencing reads in two ways, “by-site” and “co-assembly.” For our by-site approach, we processed sequencing data from each site individually. Raw sequencing reads, both forward and reverse, in “.fastq” format were loaded into The Department of Energy Systems Biology Knowledgebase (KBase).3 In Kbase, the quality of raw sequencing reads was assessed using FastQC v0.12.1.4 Based on the quality assessment, files were trimmed with the program Trimmomatic v0.36 (Bolger et al., 2014) with a “sliding window size” of 4 and a “sliding window minimum quality” of 25. Once the read files were trimmed, their quality was rechecked using FastQC v0.12.1. Once the quality of the reads was determined to be sufficient, the reads were assembled using metaSPAdes v3.15.3 (Nurk et al., 2017). In MetaSPAdes, the “Minimum Contig Length” parameter was less than or equal to 1,000, with the smallest possible read length being 300. MetaSPAdes produced 32,933 contigs from site 140112K, 68,329 contigs from site 140117H, and 60,294 contigs from site 140111F. The contigs produced were annotated with RASTtk v1.073 using the default KBase parameters.
Contigs were binned using CONCOCT v1.1 (Alneberg et al., 2013) and MetaBAT2 v1.7 (Kang et al., 2019), with the maximum contig length parameter being less than or equal to 2,500 base pairs. The lowest possible contig length for CONCOCT and MetaBAT2 was set to 1,500 base pairs. CONCOCT binned 17,914 contigs from site 140112K, 36,751 contigs from site 140117H, and 41,353 contigs from site 140111F to produce 62, 84, and 87 bins from each site, respectively. MetaBAT2 binned 13,460 contigs from site 140112K, 28,028 contigs from site 140117H, and 32,614 contigs from site 140111F to produce 40, 60, and 49 bins from each site, respectively. We optimized the bin outputs from CONCOCT and MetaBAT2 with DAS Tool v1.1.2 (Sieber et al., 2018) using the default diamond identification tool and default advanced parameters. The bin optimization tool resulted in 22 optimized bins from site 140112K, 41 bins from 140117H, and 36 bins from 140111F.
The quality of the bins produced was assessed with CheckM v1.0.18 (Parks et al., 2015). Following bin assessment, all the bins were extracted as assemblies using Extract Bins as Assemblies from BinnedContigs v1.0.2 in Kbase. Once the bins were extracted, the taxonomy of each bin was classified using GTDB-tk v1.7.0 (Chaumeil et al., 2022), and bins classified as known methanogens were functionally annotated using RASTtk v1.073 (Brettin et al., 2015) using the default KBase parameters.
All quality-checked and trimmed “.fastqc” sequencing files were uploaded into one read file using the program Merge Reads Libraries v1.2.2 in Kbase for the co-assembly approach. From there, contigs were assembled using metaSPAdes. This resulted in 121,536 contigs. Contigs were then binned following the same protocol as the by-site approach. The number of bins resulting from CONCOCT v1.1 was 135 from 121,536 contigs, and the number of bins from MetaBAT2 v1.7 was 96 from 56,113 contigs. Bin optimization was carried out using DAS Tool v1.1.2, resulting in 64 bins. Assemblies were extracted and taxonomically classified using GTDB-tk v1.7.0. Those classified as methanogens were functionally annotated using RASTtk v1.073.
The relative frequency of each bin at each site was determined using the program Bowtie2 v2.3.2 (Langmead and Salzberg, 2012) in Kbase with phred33 used as the alignment quality score type, the alignment type set to end-to-end and the maximum fragment length for paired-end alignments set to 500. Bowtie2 maps raw sequence reads against genome assemblies to determine the percentage of reads that align with each assembly at each site.
After assembling and processing the bins, we searched the RASTk annotations for core methanogen metabolism genes using Thieringer et al. (2023) as a guide. We used BLASTp (Camacho et al., 2009) to determine the percent identity with protein sequences of previously characterized methanogen genomes. Supplementary Table S4 contains tables of RASTtk annotations and BLASTp results of amino acid sequences that code for proteins in the core metabolisms of the resolved methanogen genomes.
2.5 Phylogenomic analysis
GToTree was used to construct a phylogenomic tree of methanogens (Lee, 2019). We included several genomes from the Samail Ophiolite isolated by Thieringer et al. (2023), Fones et al. (2019), and those newly published in this study. We also curated and included several high-quality genomes for which environmental metadata was available. Additionally, representative genomes from the genera Methanobacterium, Methanosphaera, Methanobrevibacter, and Methanosarcina were included using the “gtt-get-accessions-from-GTDB” functionality with the “--GTDB-representatives-only” flag for each of these taxa. Finally, genomes identified by GTDB-Tk - v2.3.2 as “close relatives” of Methanocalculus natronophilus, Methanobacterium congolense buetzberg, and the Oman MAGs isolated by Thieringer et al. (2023) and Fones et al. (2019) were also included. However, for genomes identified by GTDB, we removed those that were shown to be redundant in previous maximum parsimony and maximum likelihood trees from the final phylogeny for the sake of clarity. A full table of the genomes used and any associated metadata used in this study is available in Supplementary Table S5.
Once the genomes were collected, GToTree v1.8.8 was run with default parameters, using the hidden Markov model (HMM) target gene set of 76 archaeal marker genes included in the program as the basis for the phylogeny. Genes were predicted within input genomes using Prodigal v2.6.3 (Hyatt et al., 2010); our 76 target genes were then identified within these genes using HMMR v3.4 (Eddy, 2011) and, respectively, aligned using Muscle 5.1 for OS x 64 (Edgar, 2022). These genes were then trimmed via TrimAl v1.5.rev0 (Capella-Gutiérrez et al., 2009) and concatenated to construct the phylogenomic tree. Then, IQ-TREE v2.3.6 (Nguyen et al., 2015) was used to generate a maximum-likelihood phylogeny with 1,000 bootstrap replicates. Subsequently, the tree was visualized in the Interactive Tree of Life online viewer (Letunic and Bork, 2024). Canva was then used to overlay relevant environmental metadata onto the tree and reformat taxon names. Supplementary Table S5 includes optimal growth temperature and pH for genomes of methanogens in culture and the temperature and pH of sampling sites of metagenome-assembled genomes in this study and other studies where relevant.
3 Results and discussion
3.1 Surface-expressed serpentinized fluids, a window into subsurface processes
To illustrate geochemical similarities and differences between surface-expressed and subsurface well fluids, Figure 1 summarizes the concentrations of geochemical constituents reported in Howells et al. (2022) and Rempfert et al. (2017) directly influenced by the process of serpentinization. Leong et al. (2021) describe how the serpentinization process influences pH, Si, Ca, and DIC in detail. Si indicates the extent to which fluids have undergone serpentinization and the extent of mixing between Type I (high Si concentration) and Type II (low Si concentration) fluids. Based on the concentration of Si and pH shown in Figure 1A, there is a high degree of geochemical overlap between surface and subsurface fluids. However, Figure 1B shows a distinction in the concentration of Ca, with more pristine Type II fluids (lowest concentrations of Si) from the subsurface having higher concentrations of Ca. This may be attributed to Ca in surface fluids reacting with inorganic carbon supplied from CO2 in the atmosphere to form carbonate minerals, which can draw down the Ca concentration in serpentinized fluids. Additionally, in fluids where H2 was measurable in the Rempfert et al. (2017) study, H2 is more than an order magnitude higher in concentration than the highest H2 concentrations from the surface, as shown in Figure 1C. Lower H2 concentrations in surface fluids may be attributed to the consumption of H2 by microorganisms or degassing of H2 from serpentinized fluid along its migration from the subsurface to the surface. Despite these differences, previous energetic calculations show sufficient energy for hydrogenotrophic methanogenesis in more pristine Type II surface-expressed fluids (Canovas et al., 2017; Howells et al., 2022). Energetic observations coupled with the detection of methanogen 16S rRNA gene phylotypes in Howells et al. (2022) suggest that H2 would not be a limiting factor in many surface-expressed fluids and certainly not in subsurface fluids. The difference in Ca concentration provides insights into factors that may influence inorganic carbon availability in the surface and subsurface.
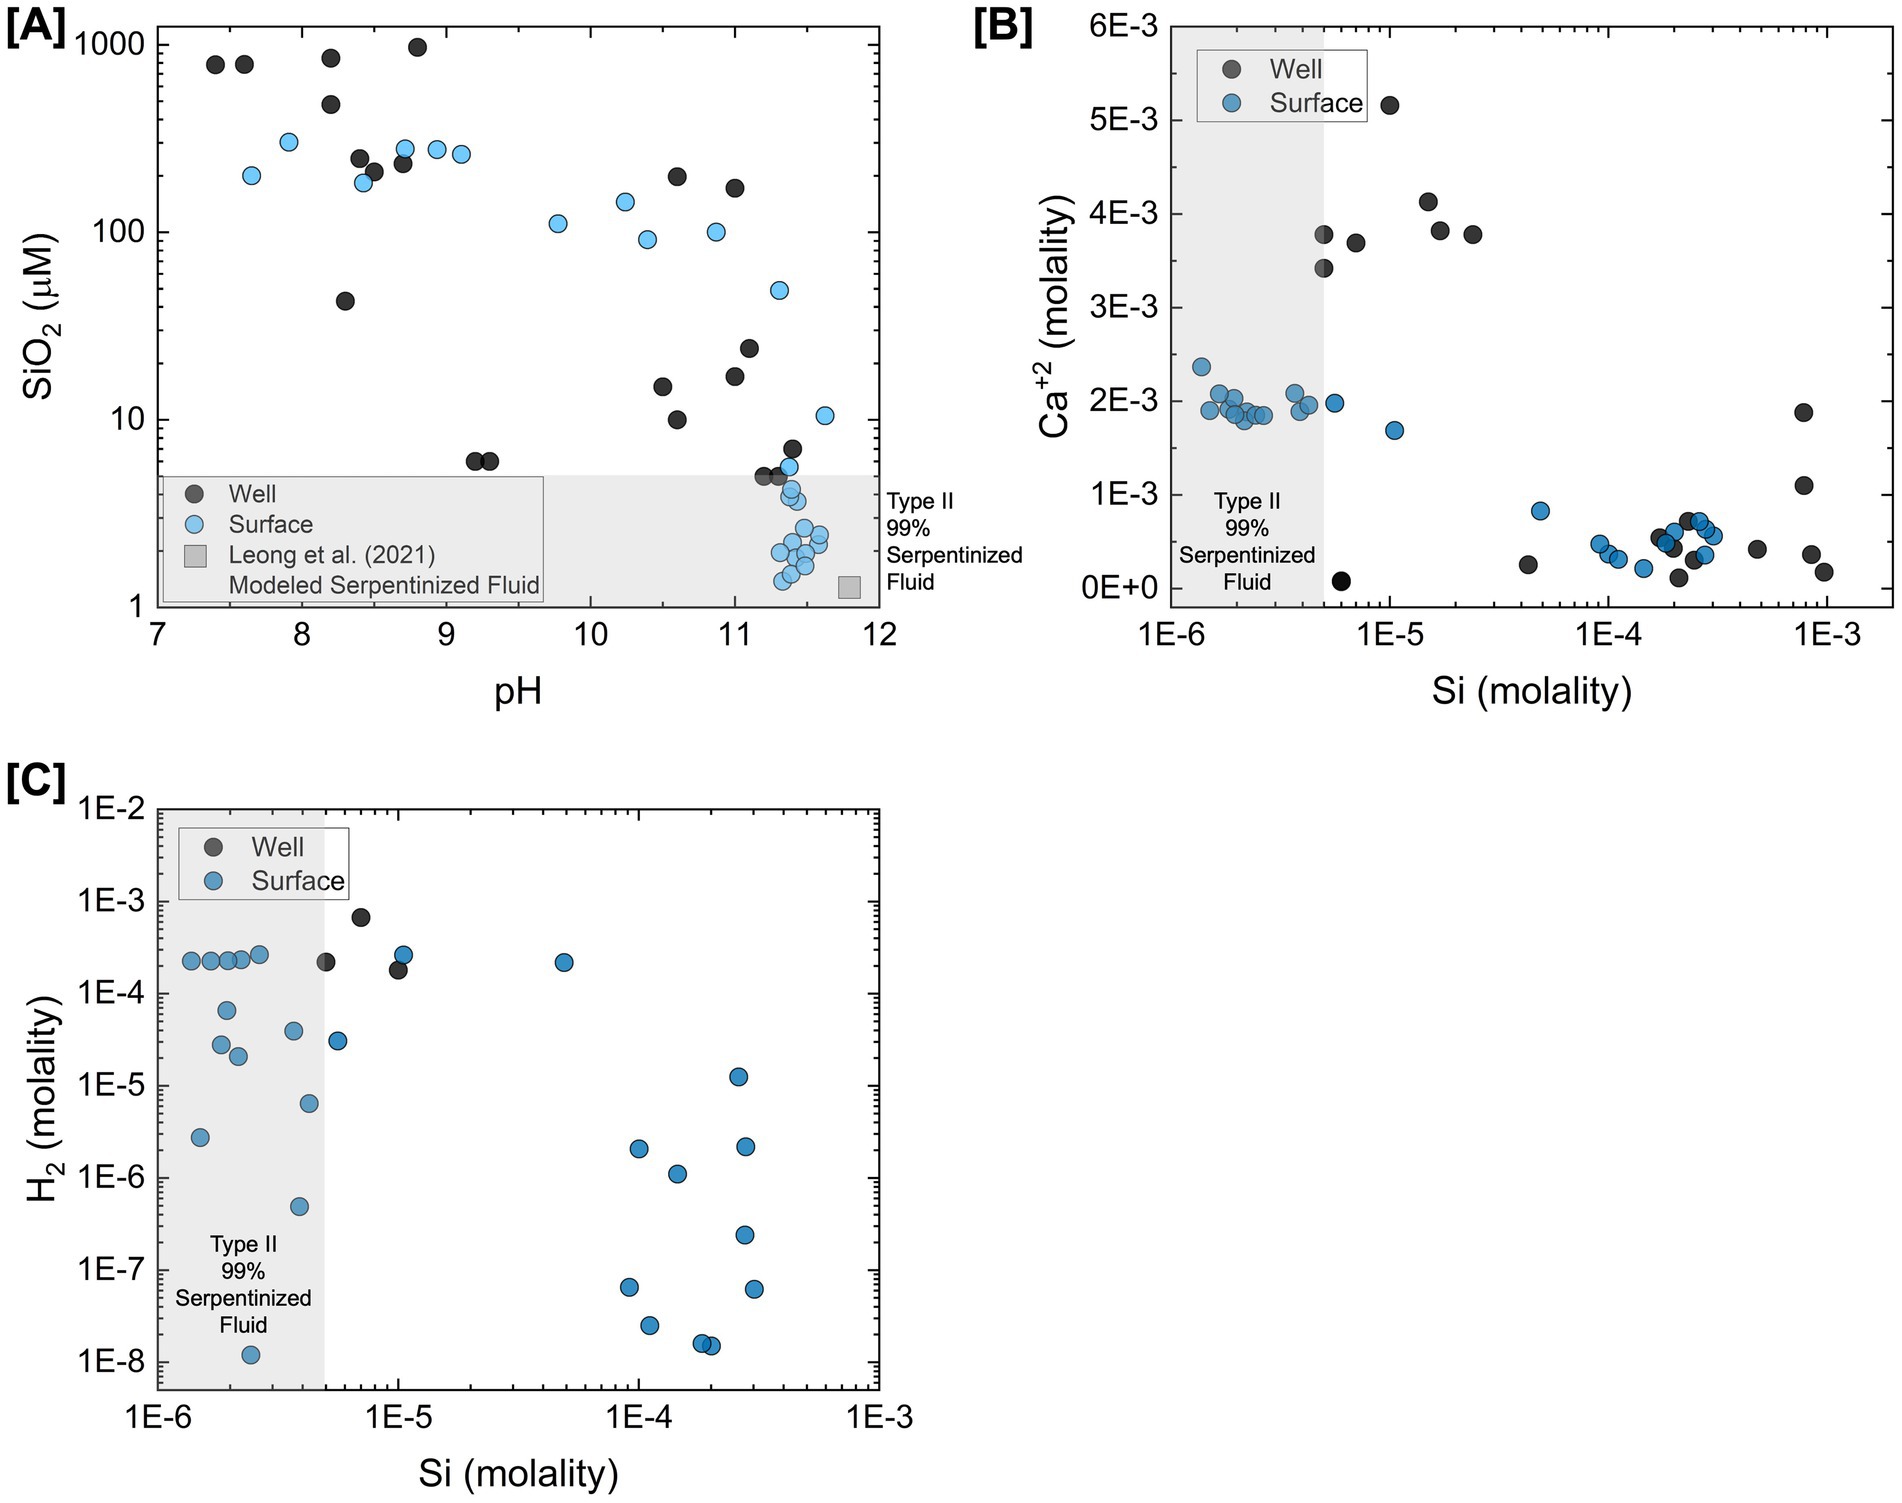
Figure 1. Comparison of surface-expressed and subsurface well serpentinized fluid chemistry from the Samail Ophiolite. Chemical constituents plotted are directly influenced by the process of serpentinization as described in Leong et al. (2021). Values for surface-expressed fluid chemistry (blue) are reported in Howells et al. (2022) values from well fluids (black) are reported in Rempfert et al. (2017). This figure is adapted from Howells et al. (2022). (A) The concentration of Si in fluids plotted as a function of pH. Si is considered to be an indicator of the extent of serpentinization fluids have undergone and extent Type I and Type II fluids have mixed (Leong et al., 2021). The gray square represents the estimated pH and Si concentration of a pristine serpentinized fluid modeled by Leong et al. (2021). This is used as the Type II end-member fluid for estimating the percent serpentinized fluid composition of fluids using a conservative mixing model with Si as described in Howells et al. (2022). (B) Concentration of Ca+2 plotted as a function of Si. (C) Concentration of H2 plotted as a function of Si.
To examine similarities in microbial community composition and the distribution of Methanobacterium in surface-expressed and subsurface well fluids, we conducted a meta-analysis of 16S rRNA gene amplicon sequencing data reported in Howells et al. (2022) (surface-expressed fluids) and Rempfert et al. (2017) (subsurface well fluids). We can do this meta-analysis given that both studies used the Earth Microbiome Primer set (Caporaso et al., 2012) and the same type of sequencing platform (MiSeq 150 × 2). In comparing the alpha diversity, or the number of distinct representative 16S rRNA gene sequences, of surface and subsurface communities, we see in Figure 2A that both surface and subsurface fluid alpha diversity negatively trend with Si. It is worth noting that surface-expressed fluids can have higher alpha diversity than subsurface fluids with <99% serpentinized fluid composition. Both subsurface and surface-expressed Type II fluids have relatively low alpha diversity in comparison to Type I and mixed fluids, which in previous studies is hypothesized to result from the selective pressure of alkaline pH (Rempfert et al., 2017; Fones et al., 2019; Fones et al., 2021).
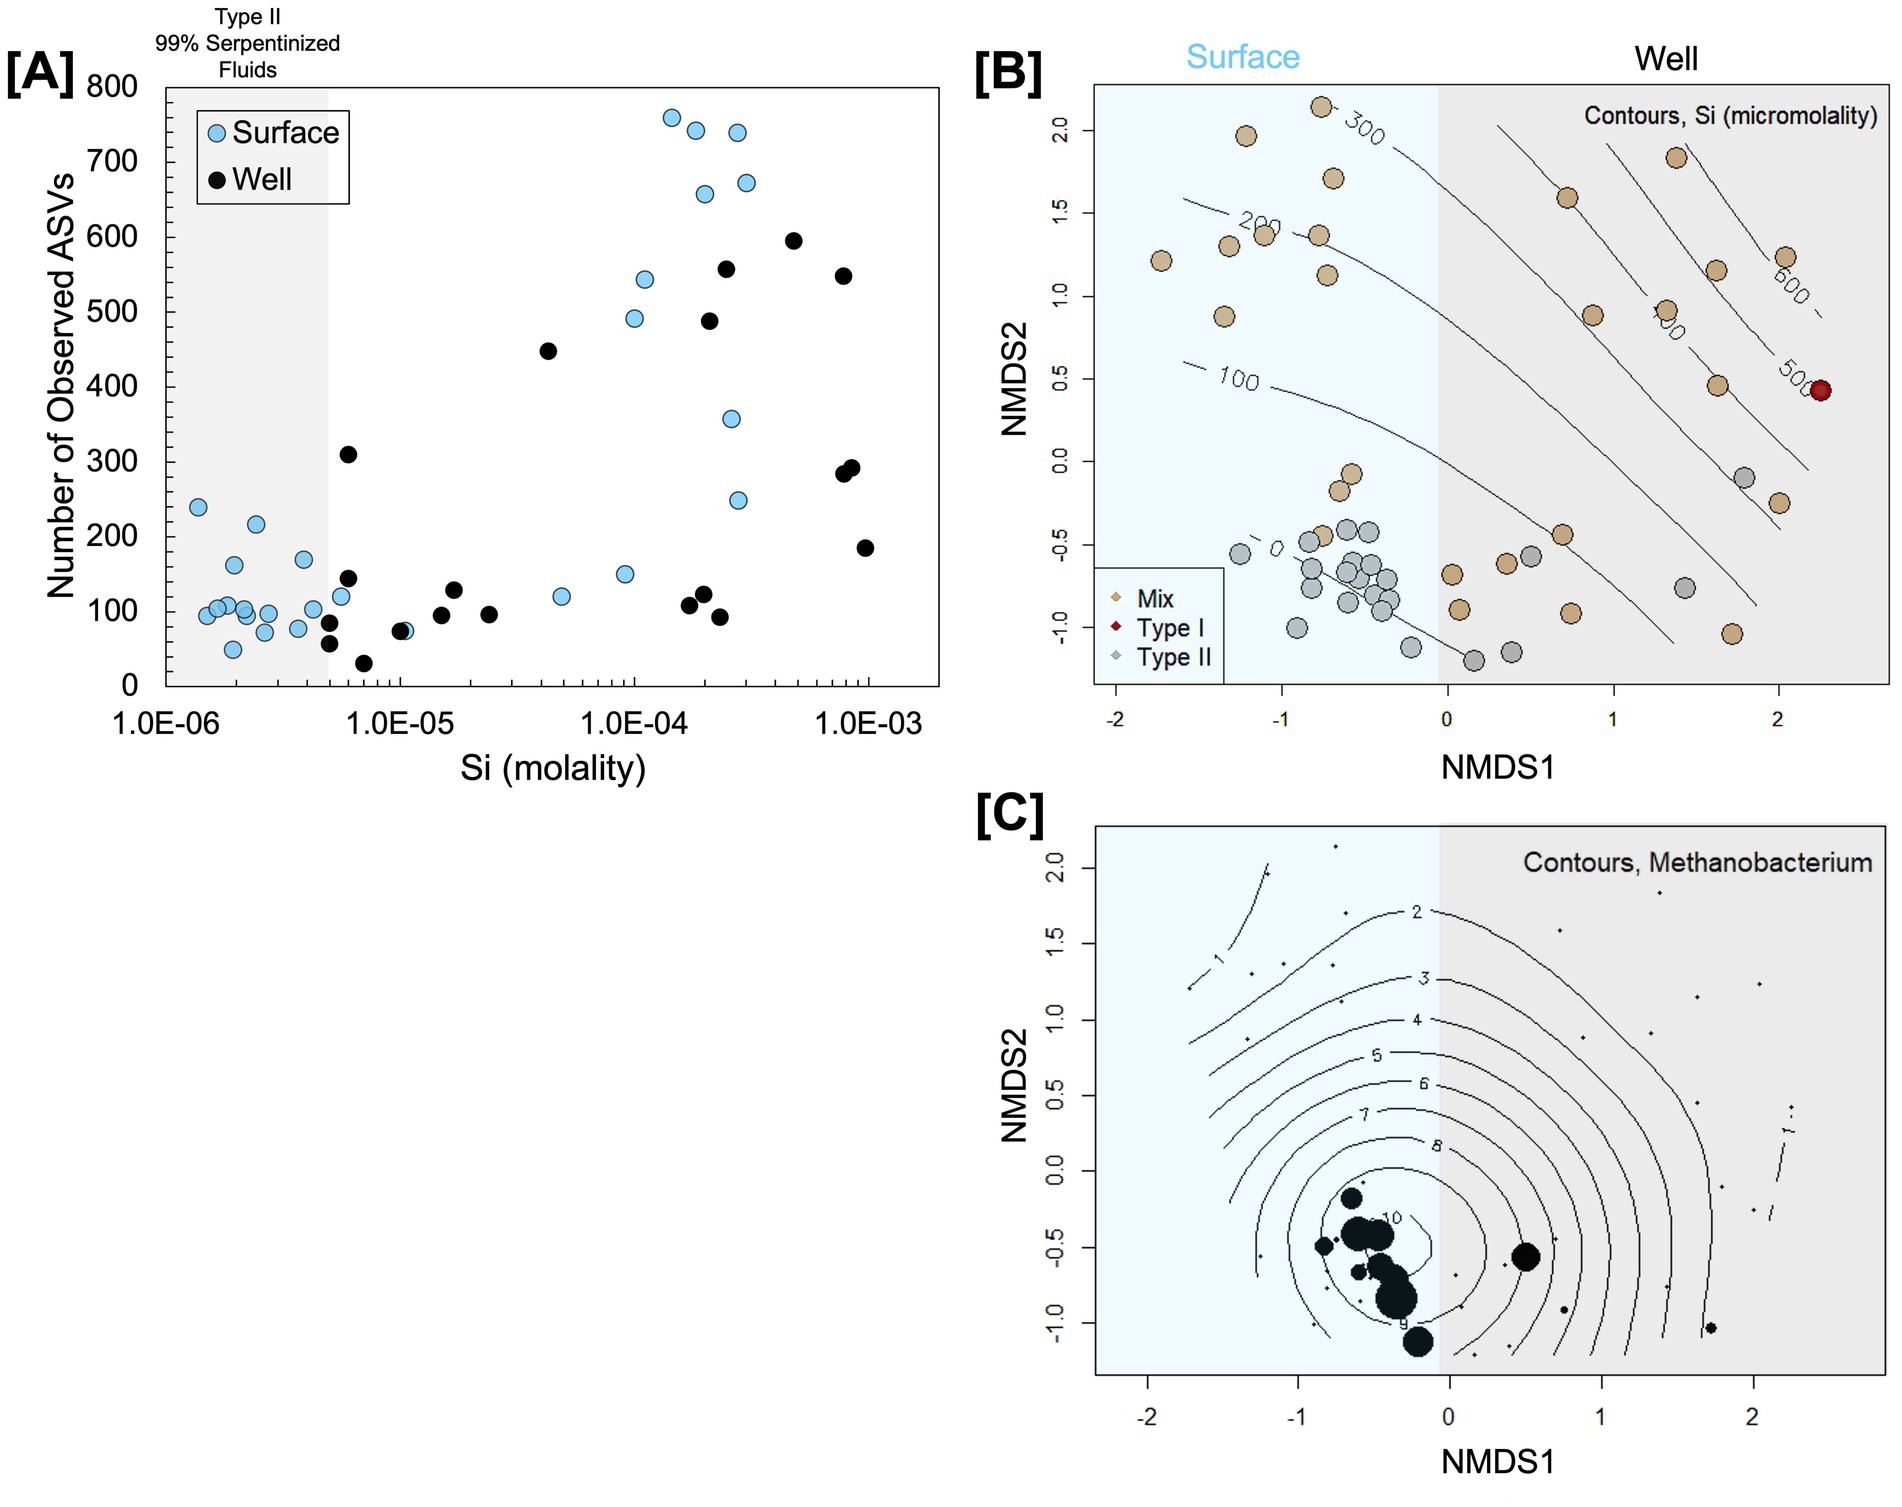
Figure 2. Comparison of microbial community diversity in surface-expressed and subsurface well serpentinized fluids of the Samail Ophiolite. 16S rRNA gene amplicon sequencing data from Rempfert et al. (2017) and Howells et al. (2022) were reprocessed to compare the alpha diversity quantified through the number of observed ASVs plotted as a function of Si in (A) and the beta diversity assessed through Bray–Curtis dissimilarity analysis of square-root transformed ASV relative abundances visualized through NMDS ordination (stress = 0.2) in (B). Contours in (B) are a maximum likelihood fit of the Si concentration at each site and colors indicate fluid type following Table 2. The distribution of 16S rRNA gene amplicon ASVs classified as Methanobacterium is shown by the size of circles in (C), which scales with relative abundance and. Contours in (C) are a maximum likelihood fit of the relative abundance of Methanobacterium.
To assess beta diversity or similarities in community composition, we carried out an NMDS ordination of a Bray–Curtis dissimilarity analysis of square-root transformed 16S rRNA gene ASV relative abundances. Visually, community composition variation along NMDS1 trends with whether the communities are from the surface or the subsurface, as shown in Figure 2B. ANOSIM analysis shows that the communities from the surface and subsurface are significantly different (ANOSIM r statistic = 0.5124, p-value = 0.0001, 9,999 permutations); however, Type II fluids from the surface and subsurface fall closer together in ordination than fluids influenced by mixing and Type I fluids. Mixing and Type I fluids are likely dissimilar between the surface and subsurface due to the availability of O2 and sunlight at the surface. As Howells et al. (2023) reported, surface fluids influenced by mixing are populated by phototrophs and heterotrophs that use O2 as an electron acceptor. The dissimilarity between the Type II fluid communities may be due to the differences in the relative abundance of Methanobacterium and OP1 [also referred to as Acetothermia (Colman et al., 2022)] as shown by the NMDS ordination with OP1 relative abundances overlaid in Supplementary Figure S2. We overlayed the relative abundance of Methanobacterium phylotypes onto the NMDS ordination, as shown in Figure 2C. Methanobacterium is present in both Type II fluid types; however, it appears to be slightly more prevalent in surface-expressed Type II fluids. Overall, the community analysis shows that while there are significant global differences between surface and subsurface fluids, as may be expected due to differences in the availability of O2 and sunlight, Type II fluids are surprisingly similar in alpha diversity and community composition. Furthermore, Methanobacterium is prevalent in surface-expressed and subsurface Type II fluids.
3.2 Energetic potential for methanogenesis
In this section we quantitatively examine methanogen substrate availability through assessments of substrate flux to the cell, availability of energy in terms of moles CH4 produced and energy supply per kg of fluid. For these assessments we characterized formate and acetate concentrations shown in Figure 3A in surface-expressed fluids and combine our data with DIC, H2 and CH4 concentrations previously reported in Leong et al. (2021) and Howells et al. (2022), which are from the same sites and sampled at the same time. Some well fluids characterized in Rempfert et al. (2017) have measured concentrations of H2, CH4, DIC, acetate, and formate allowing comparison between surface and subsurface. Table 2 summarizes the organic acid data collected for this study as well as organic acid data previously reported in Rempfert et al. (2017). Also in Table 2 is an estimation of the percent serpentinized fluid at each study site using the concentration of Si as described in Howells et al. (2022) and a descriptor of the sampling site as Type II (>99% serpentinized fluid), mixed, and our representative Type I surface expressed fluid. As described in the methods, we estimate the chemical activities of dissolved CO2 and HCO3− from measurements of DIC. We account for the effects of major ion concentrations (such as Na+, Cl−, Ca+2 and Mg+2) and pH on the chemical speciation of DIC and activity of dissolved CO2 and HCO3− using the program EQ3/6 (Wolery, 2013) and program wrapper we developed, AqEquil Python package (Boyer et al., 2024). Given the alkalinity of serpentinized fluids we cannot measure CO2 through the gas phase as we did with H2 and CH4 in Howells et al. (2022). Therefore, estimating dissolved CO2 in this manner is the best approach for deriving a CO2 chemical activity. The same approach was used to estimate the chemical activity of formic acid, formate anion, acetic acid and acetate anion from bulk measurements of formate and acetate, respectively. Estimated chemical activities can be found in Supplementary Table S1. We assume chemical activities are approximately equal to molarity for the potential flux calculations described below.
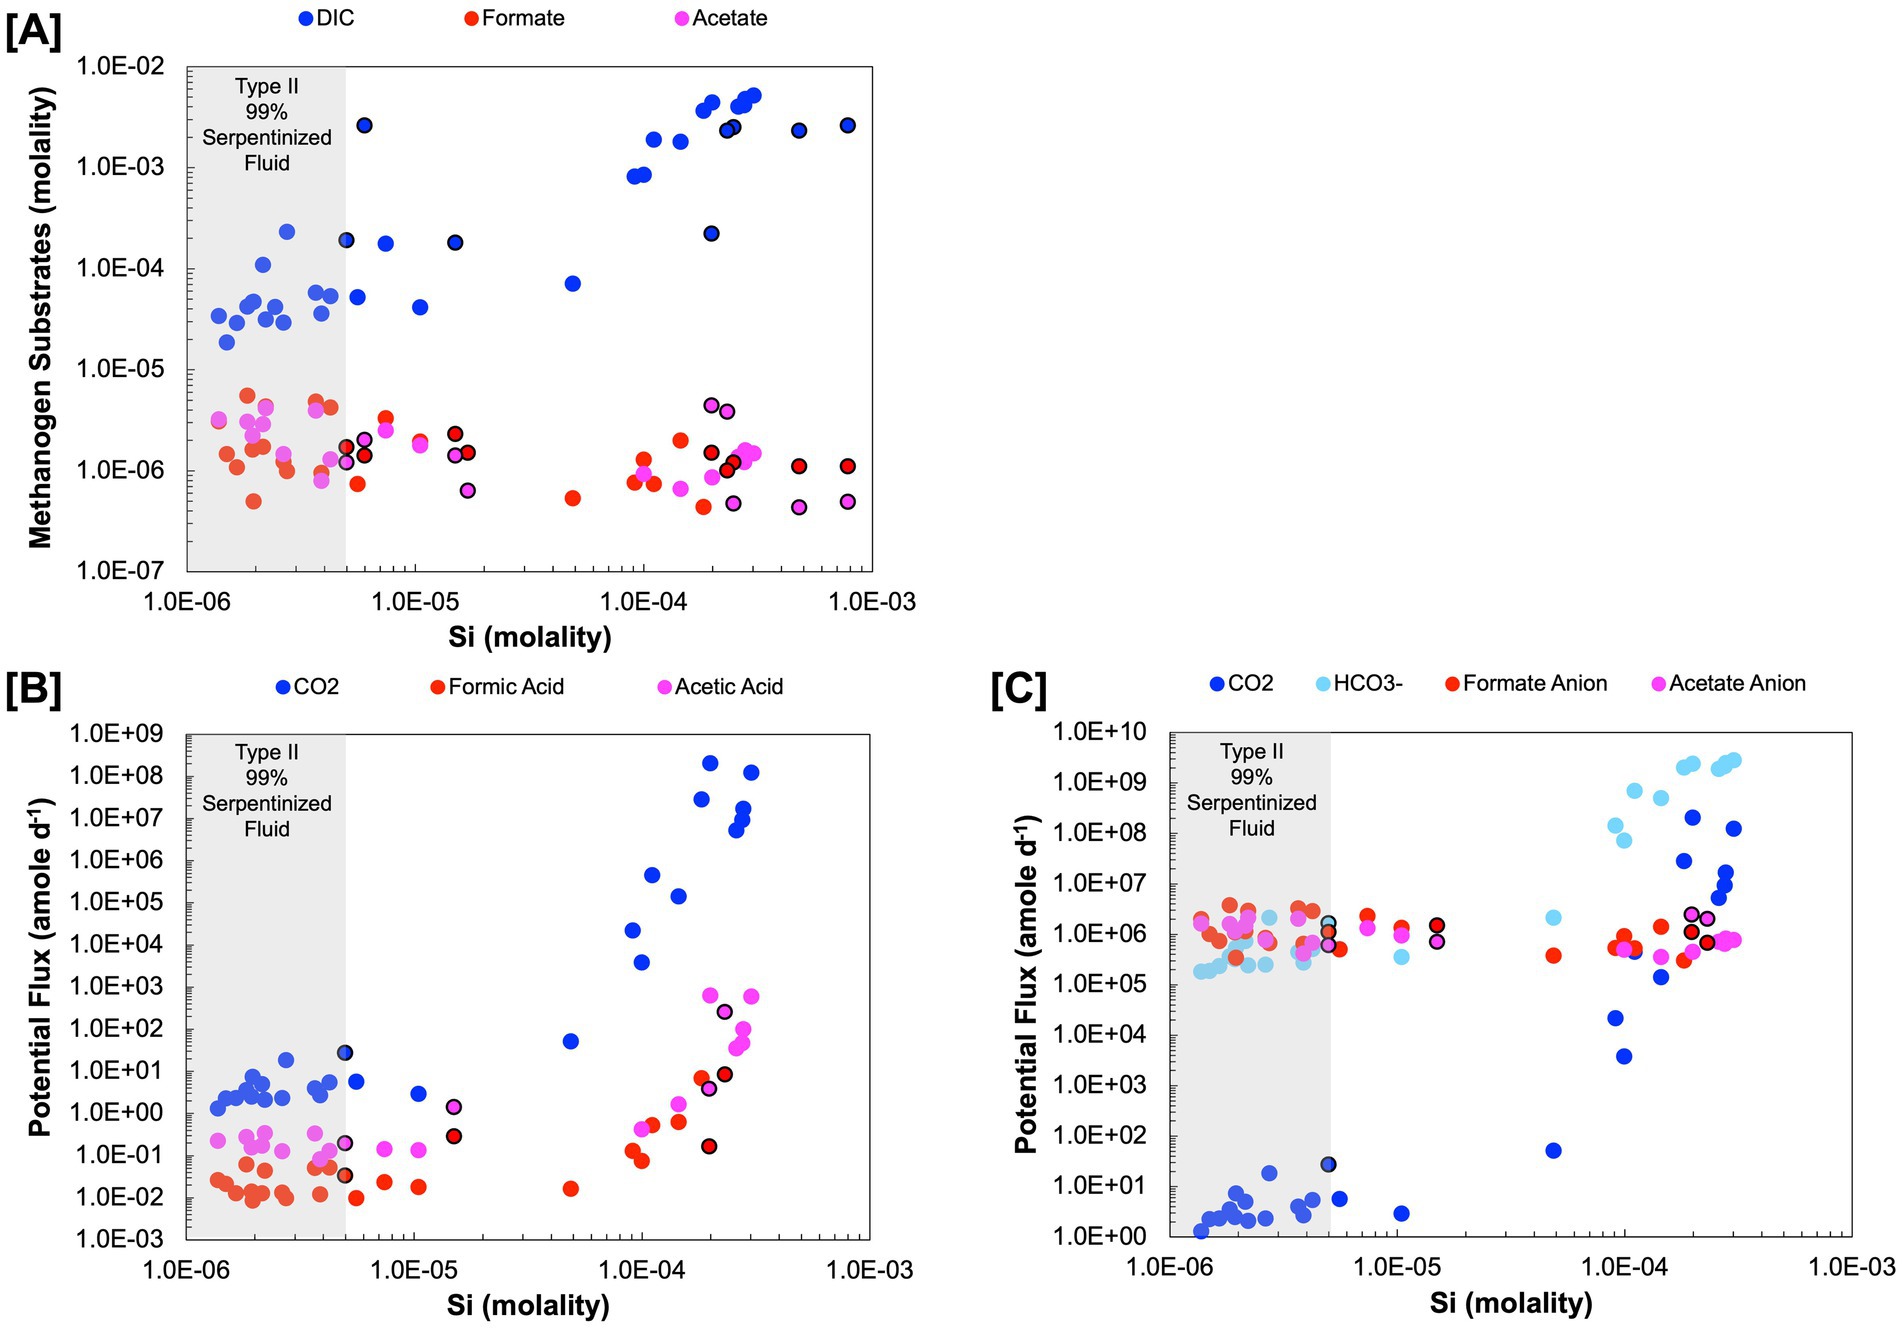
Figure 3. Substrate concentration in molality and potential flux in attomoles per day (amole day−1) (A) Are the measured concentrations of dissolved inorganic carbon, formate and acetate. (B) is the potential flux for the acidic forms, dissolved CO2 (carbonic acid), formic acid, and acetic acid. (C) is the approximation of potential flux for the anion forms HCO3−, formate anion and acetate anion. Black outlines indicate subsurface well fluids.
3.2.1 Potential flux
Low concentrations can limit the diffusive flux of substrates to a cell and thereby limit rates of metabolism. We calculated the potential fluxes of methanogenic substrates as follows. The rate of diffusive flux to the surface of a sphere of radius R is given by integrating the general equation relating flux and substrate concentration in spherical coordinates (Crank, 1979) from R to infinity (Hoehler, 2004):
Where J is the diffusive flux, D is the species-specific diffusion coefficient, C∞ is the substrate concentration at infinite distance from the cell, and CR is the substrate concentration at the surface of the sphere. In our calculations, R is set to 0.5 μm in order to yield the flux to a spherical surface of cell-like scale. C∞ is set to the measured bulk solution concentration of a given substrate. In practice, “infinite distance” with respect to a cell consuming substrate at the diffusion limited rate is on the order of tens of microns (Boone et al., 1989), meaning that the substrate concentration at that distance very closely approximates the substrate concentration at true infinite distance. CR is set to the concentration of substrate that is at equilibrium with respect to the methanogenic metabolism in question, in order to place a lower bound on the possible extent of substrate depletion at the surface of the sphere that could result from metabolic consumption. In practice, CR would almost certainly be higher because (i) cells can only consume substrates down to concentrations that still support energy conservation, rather than to equilibrium; and (ii) enzymatic substrate consumption at less than the diffusion-limited rate implies that substrate concentrations at the surface of the sphere will be drawn down to only a limited extent. The latter of these considerations is particularly important because most enzymes operate orders of magnitude more slowly than the diffusion-limited rate (Bar-even et al., 2011), and the potential draw down of substrate concentration at R will be limited to the same extent. For these reasons, the calculated fluxes represent physical upper limits on the possible rates of substrate delivery to a cell, and we note this by henceforth referring to them as “potential fluxes.”
Separate calculations were performed for potential fluxes of the neutral species CO2, formic acid, acetic acid, which can potentially diffuse freely across a cell membrane, and the corresponding anionic forms, HCO3−, formate, and acetate, which can only transit the cell membrane via facilitated diffusion (e.g., through ion channels) or active transport. The calculated fluxes are specific to a given compound and neglect the potential for resupply by equilibration with protonated or ionic counterparts. For example, calculated fluxes assume that dissolved CO2 is delivered to the cell surface solely by diffusion from the bulk medium and not via production from bicarbonate in the vicinity of the cell surface. At the length scales considered here, diffusion dominates over the comparatively sluggish kinetics of CO2 production from bicarbonate (Johnson, 1982), making this approach a good approximation for the DIC system. It is not clear whether the same is true for the potential for formic acid and acetic acid to be formed in the vicinity of the cell by protonation of formate and acetate, respectively, and the potential fluxes of formic and acetic acids could be higher than the calculated values as a consequence. Table 3 shows the diffusion coefficients (D) used, their references, and the potential fluxes calculated using Equation 7.
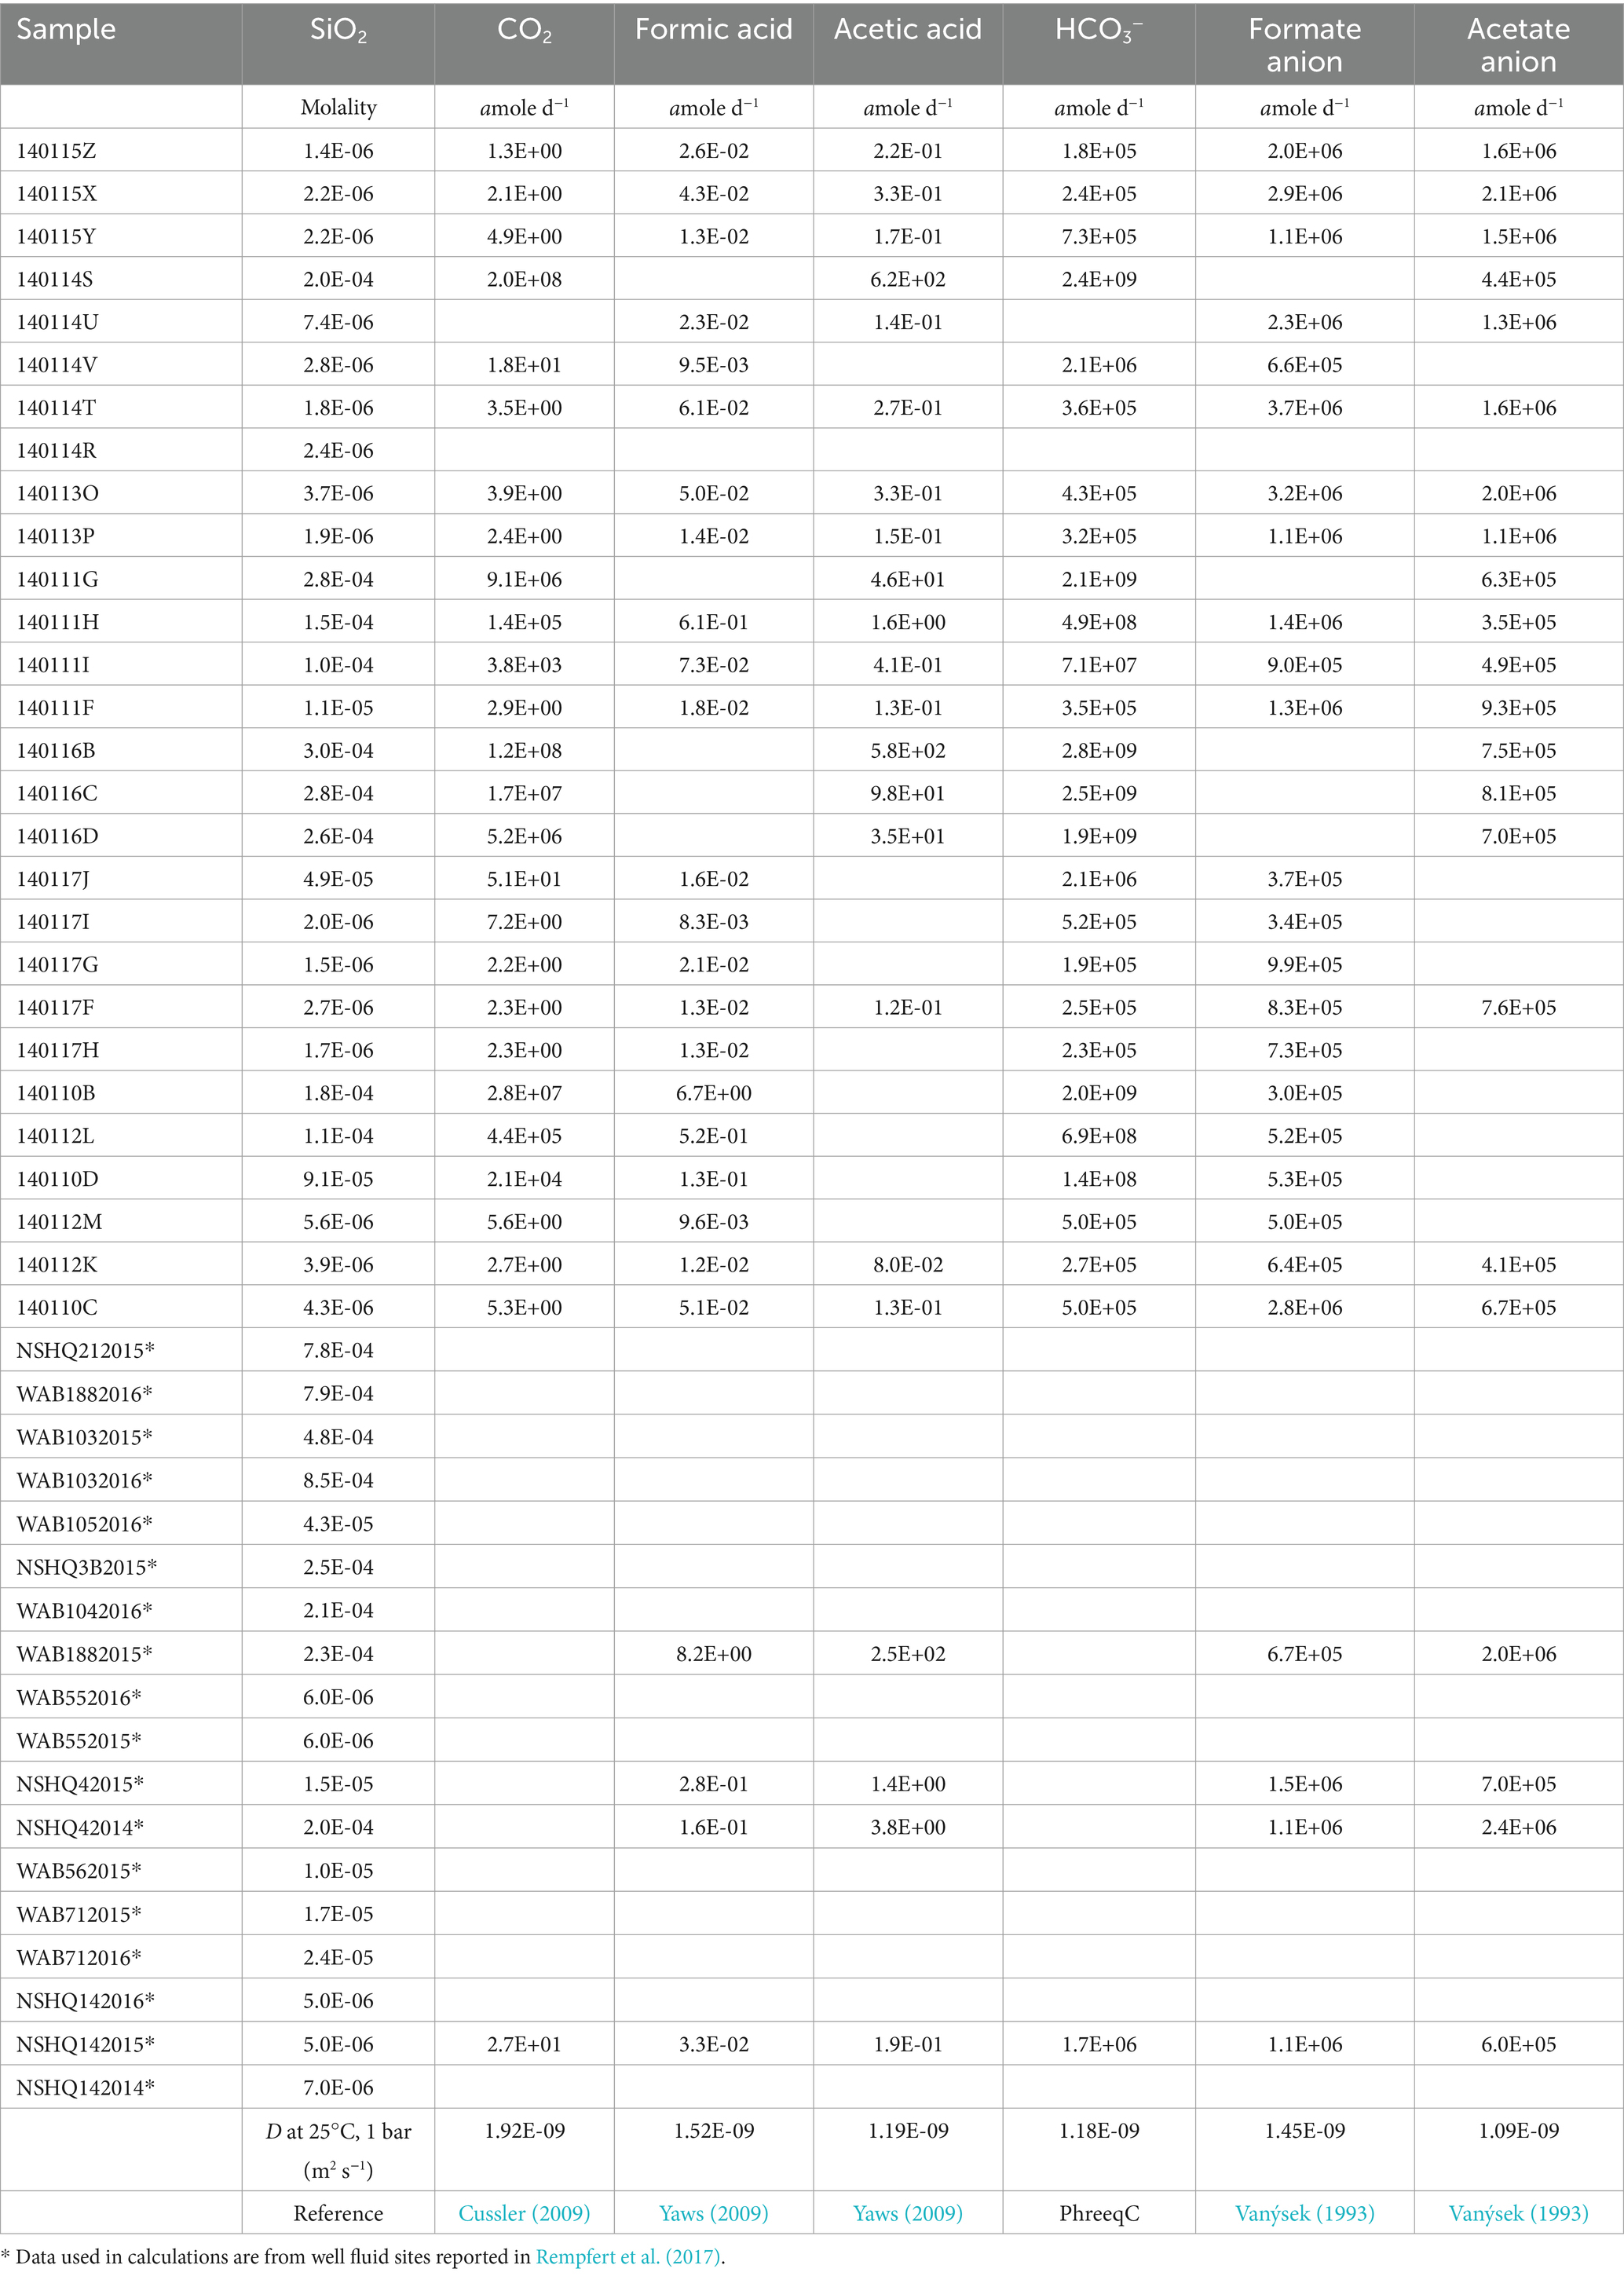
Table 3. Potential flux values reported in attomoles per day (amole d−1) and the diffusion coefficients in water (D) at 25°C, 1 bar for each chemical species used in the calculation.
Of the acid forms dissolved CO2 (carbonic acid), formic acid, and acetic acid, dissolved CO2 has the highest potential flux, as shown in Figure 3B, which can be attributed to the differences in concentration among DIC, formate, and acetate. The anion forms (Figure 3C) have a more nuanced expression of potential flux, particularly in Type II fluids. There are cases where HCO3− is more available than the anion forms of formate and acetate and vice versa, making any one of these a viable option for methanogenesis in Type II fluids. Given the orders of magnitude higher potential flux for the anion forms over the acid forms of inorganic carbon, formate, and acetate in Type II fluids, this work suggests it would be at least kinetically more favorable to use these forms if methanogens have a mechanism for taking them up. Indeed, some methanogens have been found to have transporters for formate (White and Ferry, 1992) and acetate anions (Welte et al., 2014). While transporters for HCO3− have yet to be characterized in methanogens some bacterial chemolithoautotrophs have been found to have bicarbonate transporters (Scott et al., 2019).
3.2.2 Energy availability, kJ per mole CH4
Energy availability does not necessarily mean faster growth or prevalence of a microbial population in a system. For example, an organism with a slow maximum growth rate may result in only a fraction of the energy available being utilized. Additionally, in a case where there is sufficient energy available, there may be energetically costly physiological stressors such as alkaline pH. Another possibility is competition for substrates, which can lower the overall experienced energy (Shock and Holland, 2007; Hoehler, 2007; Howells et al., 2022). In a system where energy is limited due to alkaline pH and the system is primarily driven by the geochemistry of the serpentinization reactions, chemical energy availability may have a more considerable impact on biology.
Estimations of energy availability in units of kJ per mole CH4, shown in Figure 4A and summarized in Table 4, show that formatotrophic methanogenesis would yield the most energy in Type II fluids, followed by acetoclastic methanogenesis and hydrogenotrophic methanogenesis. While the differences in affinity among formatotrophic, acetoclastic and hydrogenotrophic methanogenesis are in some cases less than an order of magnitude, these results emphasize that formatotrophic methanogenesis is just as energy yielding as hydrogenotrophic methanogenesis, which may be surprising given the high H2 concentrations in serpentinized fluid. Fones et al. (2021) argue that the dependence on formate for methanogenesis by Methanobacterium stems from the low concentration of HCO3− for hydrogenotrophic methanogenesis, which results in a preference for formate. That said, formate is lower in concentration than DIC, as shown in Figure 3A, which should make it a less viable substrate, especially if the acid form is used (see Figure 3B). However, given that serpentinized fluids have a uniquely low concentration of HCO3− and 3 moles of HCO3− are produced for every mole of CH4 produced by the formatotrophic pathway, the low concentration of HCO3− as a product (and not a substrate) makes formatotrophic methanogenesis more energetically favorable than hydrogenotrophic methanogenesis. Therefore, the drive to use formate in Type II fluids may be the result of energy availability, not due to the low concentration of HCO3− as a substrate, but as a product of formatotrophic methanogenesis.
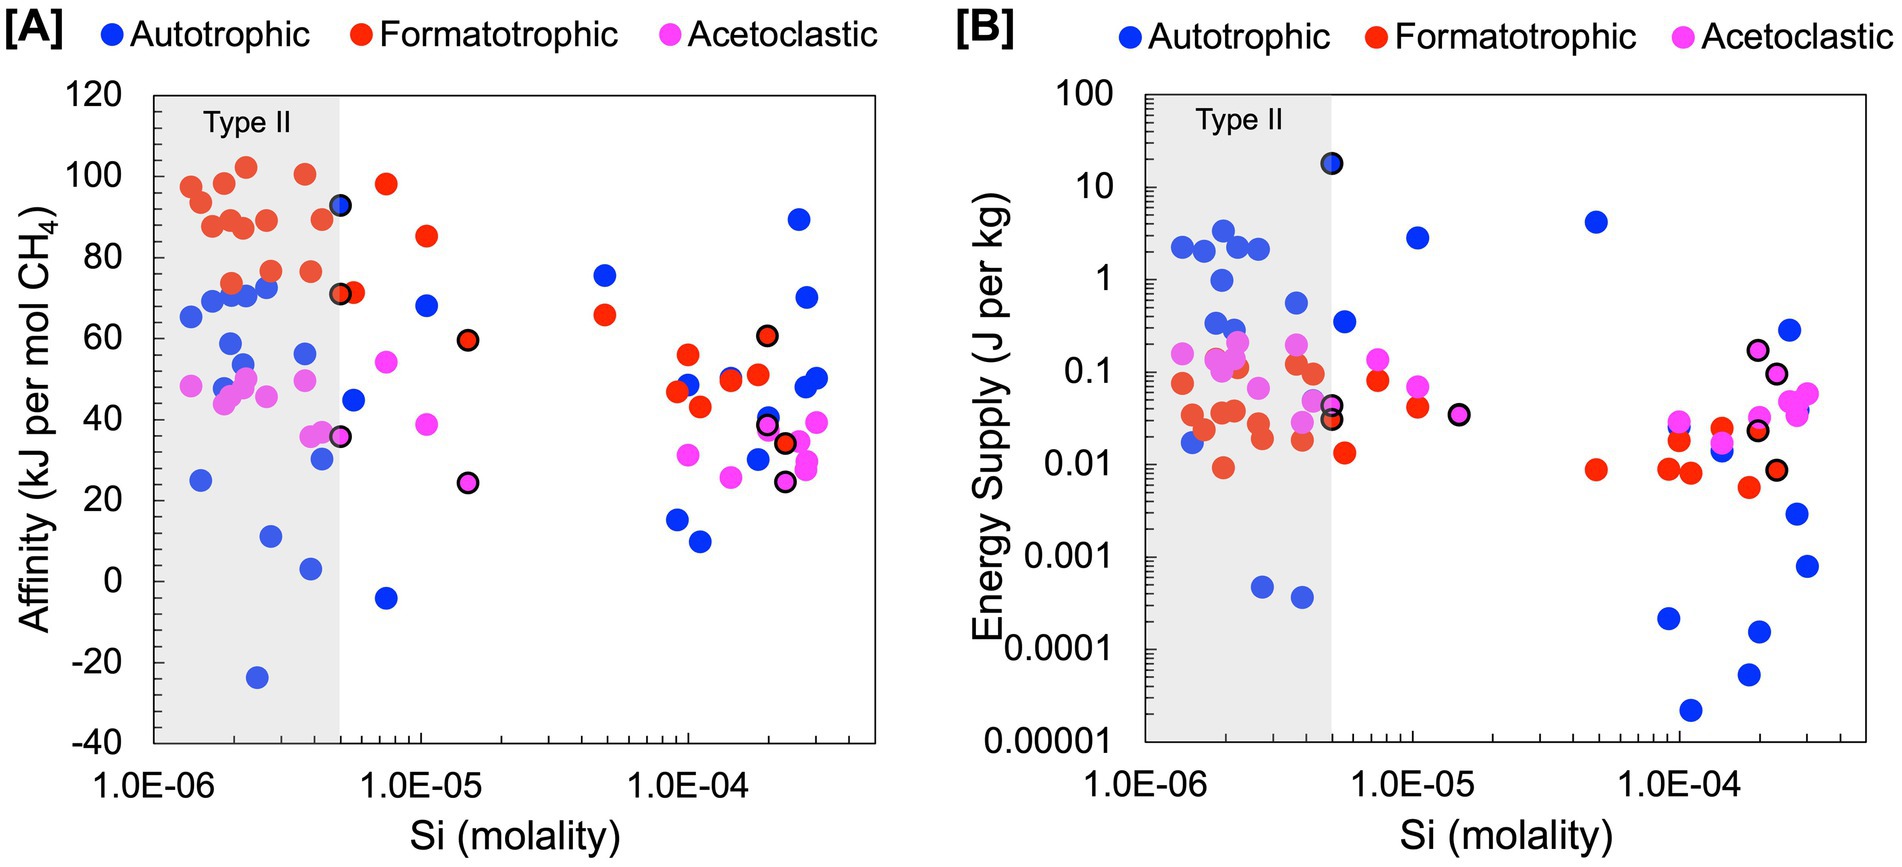
Figure 4. Estimations of energy availability for hydrogenotrophic (4H2 + HCO3− + H+ ➔ CH4 + H2O), formatotrophic (4CHO2− + H+ + H2O ➔ CH4 + 3HCO3−) and acetoclastic (C2H3O2− + H2O ➔ CH4 + HCO3−) methanogenesis. Energy availability was estimated in terms of (A) kJ per mol of CH4 and (B) kJ per mol of kg of environmental fluid. Black outlines indicate subsurface well fluids.

Table 4. Energy availability calculations.
3.2.3 Energy availability, J per kg of fluid
Another way to examine energy availability is to assess the number of joules of energy that can be supplied to a microbial community in a kg of fluid in Figure 4B. This exemplifies the energy available to microorganisms in a case where 1 kg of fluid is closed off, and all energy is consumed, i.e., the reaction proceeds until the limiting reactant runs out. We can calculate this by multiplying affinity in joules per mole reaction by the concentration of the limiting reactant divided by its stoichiometric coefficient to get J per kg fluid (Equation 6). For the concentration of the limiting reactant, we summed the concentration of the total pool of chemical species the reactant is in equilibrium with; for example, for HCO3− we summed the activities of dissolved CO2, CO3−2, CaHCO3+, MgHCO3+, CaCO3, and MgCO3 in addition to HCO3− to calculate energy supply. We do this to account for the fact that as one chemical species is consumed, the system re-equilibrates for a continuous supply of the reactant until the total pool is consumed. Formate and acetate are always the limiting reactant for formatotrophic and acetoclastic methanogenesis, whereas hydrogenotrophic methanogenesis can be either H2-limited or inorganic carbon-limited depending on their relative concentrations.
Our results show that for energy supply (Figure 4B), hydrogenotrophic methanogenesis tends to yield the most energy, particularly in mixed fluids with the highest energy supply at a site with 99.6% serpentinized fluid. This is because inorganic carbon is the stoichiometrically limiting substrate for hydrogenotrophic methanogenesis in fluids with >70% serpentinized fluid and DIC is higher in concentration than formate and acetate in these fluids. By contrast, in fluids with <70% serpentinized fluids (high Si; mixed and Type I), formatotrophic and acetoclastic methanogenesis yield more energy per kg of fluid than hydrogenotrophic methanogenesis. In mixed and Type I fluids, hydrogenotrophic methanogenesis is stoichiometrically limited by the concentration of H2. Formate and acetate in these systems are higher in concentration than H2, and therefore, formatotrophic and acetoclastic methanogenesis yield more energy.
These results suggest that the energy available to methanogens in serpentinized fluids depends on substrate availability and how energy is experienced by the methanogen cell. If methanogens can take up HCO3− and the anions of formate and acetate, then, based on our approximation of potential flux, these chemical species are more readily available to methanogens in Type II serpentinized fluids than dissolved CO2 (Figure 3C). For energy calculations, in terms of moles CH4 produced, formatotrophic methanogenesis is more energetically favorable than acetoclastic and hydrogenotrophic methanogenesis in Type II fluids (Figure 4A) and may explain why Methanobacterium preferentially uses formate in these systems. The observation that hydrogenotrophic methanogenesis can be more energetically yielding per kg fluid suggests that in a case where systems are closed off, methanogens would have a greater supply of energy for hydrogenotrophic methanogenesis and may explain why Methanobacterium strains in mixed fluids can use both bicarbonate (with H2 as an electron donor) and formate for methanogenesis as observed in Fones et al. (2021). While no acetoclastic methanogens have been previously detected in the Samail Ophiolite, energetic calculations suggest this metabolism is viable. However, given that energy availability for acetoclastic methanogenesis is comparable to hydrogenotrophic methanogenesis in Type II fluids, acetoclastic methanogens may be energetically limited. This is also reflected in an assessment of energy available in recently drilled bore-hole fluids from Oman reported in Nothaft et al. (2021b).
3.3 Genomic potential for methanogenesis
To assess the genomic potential for hydrogenotrophic, formatotrophic, and acetoclastic methanogenesis, we conducted shotgun metagenome sequencing on DNA extracts from sediments of three chemically distinct Type II surface-expressed serpentinized fluids. Supplementary Figure S2 includes images of the sampling sites which are pools or streams of surface expressed serpentinized fluids. To acquire enough biological material and minimize system disruption we sampled up to 1 cm depth of sediments that underlie fluids after sampling fluid for chemical characterization. We take the bulk fluid composition that overlies the sediments to be an approximation of what microorganisms experience in the sediments. Given that the sediments are shallow due to the underlying travertine we expect fluid circulation in the sediments. One difference between overlying fluids and the sediment pore fluids may be the concentration of O2 the microbial communities experience, with the sediment favoring anaerobic metabolisms. Figure 5A summarizes the energetic availability of these three systems. Shotgun metagenomic sequencing revealed that, in agreement with Howells et al. (2022), Methanobacterium is present in surface-expressed serpentinized fluids. As summarized in Table 5, we assembled four bins classified as Methanobacterium. Bin36 was assembled using our “co-assembly” approach, where reads from all three sites were combined and processed to assemble bins. Bins 5, 9, and 19 were assembled from sites 140112K, 140117H, and 140111F, respectively, using our “by-site” approach where reads from individual sites were used to resolve bins. Bin9 has the highest estimated completeness (87.7%) and lowest estimated contamination (0%) of the assemblies. For the first time in Oman serpentinized fluids, in addition to detecting Methanobacterium, we have evidence for a potential acetoclastic methanogen of the class Methanosarcinaceae. We assembled two bins, one from the co-assembly approach, Bin50 (completeness 76.14%, contamination 0.65%), and one with the by-site approach, Bin11 (completeness 76.14%, contamination 2.61%), from site 140117H. We could not resolve bins for Methanosarcinaceae from sites 140112K and 140111F. Methanosarcinaceae bins were classified as JAAXQB01, which is a metagenome-assembled genome in the NCBI genome database (accession #, JAAXQB000000000) resolved from a Lost City serpentinized fluid hydrothermal vent (McGonigle et al., 2020). When examining the nearest neighbors in our classification approach (see methods), Bin50 and Bin11 only share one close relative, that being genome JAAXQB01 (see Supplementary Figure S3), which suggests serpentinized fluid Methanosarcinaceae are phylogenetically unique and more work must be done to characterize these novel organisms in serpentinized fluid.
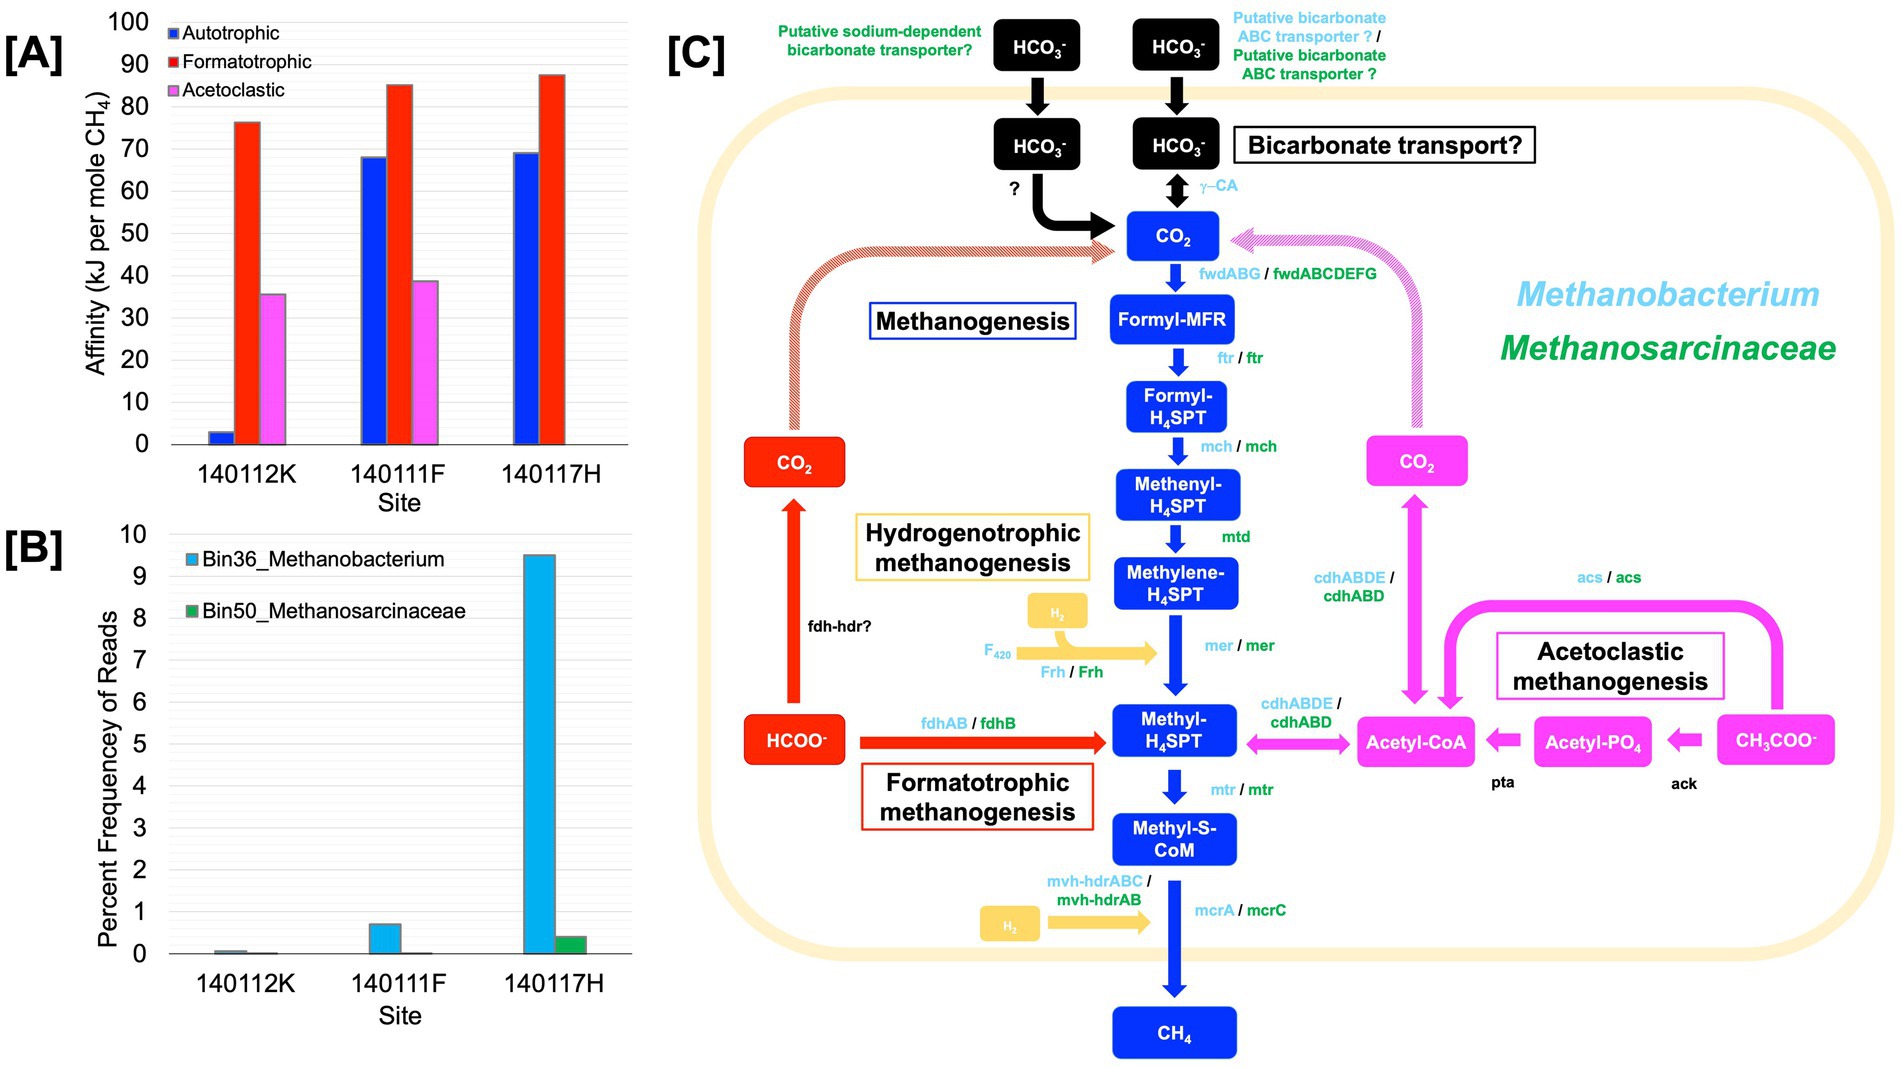
Figure 5. Core metabolism summary of methanogen metagenome assembled genomes. (A) Energy availability in kJ per mol of CH4 for methanogenesis reactions at shotgun metagenome sequencing sites. (B) Estimated percent frequency of Methanobacterium Bin36 and Methanosarcinaceae Bin50 at sequencing sites. (C) Portrays the core methanogen metabolic pathways of a Methanobacterium and the potential acetolactic methanogen of the genus, Methanocarcinaceae. Detected enzymes with >60% sequence identity of cultured methanotroph enzymes are shown in green for Methanocarcinaceae and orange for Methanobacterium. All enzymes appear next to the arrow between its substrate and product. Carbon substrates and products appear in colored boxes. The meshed arrows indicate the potential pathway in which intracellular CO2 is generated. Blue colored arrows and boxes indicate Methanogenesis; red indicates Formatotrophic methanogenesis; yellow indicates Hydrogenotrophic methanogenesis, purple indicates Acetoclastic methanogenesis, and black indicates the carbon concentrating mechanism. This figure is inspired by Thieringer et al. (2023). Genes: ɣ-CA, carbonic anhydrase; fwd, formylmethanofuran dehydrogenase; ftr, formylmethanofuran:H4SPT formyltransferase; mch, methenyl-H4SPT cyclohydrolase; mtd, F420-dependent methylene H4SPT dehydrogenase; mer, F420-dependent methyleneH4SPT reductase; mtr, methyl-H4SPT:coenzyme M methyltransferase; mcr, methyl-coenzyme M reductase; ack, acetate kinase; pta, phosphate acetyltransferase; acs, acetyl-CoA synthetase; cdh, carbon monoxide dehydrogenase; fdh, formate dehydrogenase; hdr, heterodisulfide reductase; mvh, methyl viologen-reducing [NiFe]-hydrogenase; frh, coenzyme F420 [NiFe]-hydrogenase; F420, coenzyme F420. Carbon compounds: CO2, carbon dioxide; formyl-MFR, formyl-methanofuran; formyl-H4SPT, formyl-tetrahydrosarcinapterin; methenyl-H4SPT, methenyl-tetrahydrosarcinapterin; methylene-H4SPT, methylene-tetrahydrosarcinapterin; methyl-H4SPT, methylene-tetrahydrosarcinapterin; methylene-S-CoM, 2-(Methylthio) ethanesulfonate; Acetyl-CoA, acetyl-Coenzyme A; Acetyl-PO4, acetylphosphate; CH3COO−, acetate; HCOO−, formate; HCO3−, bicarbonate.
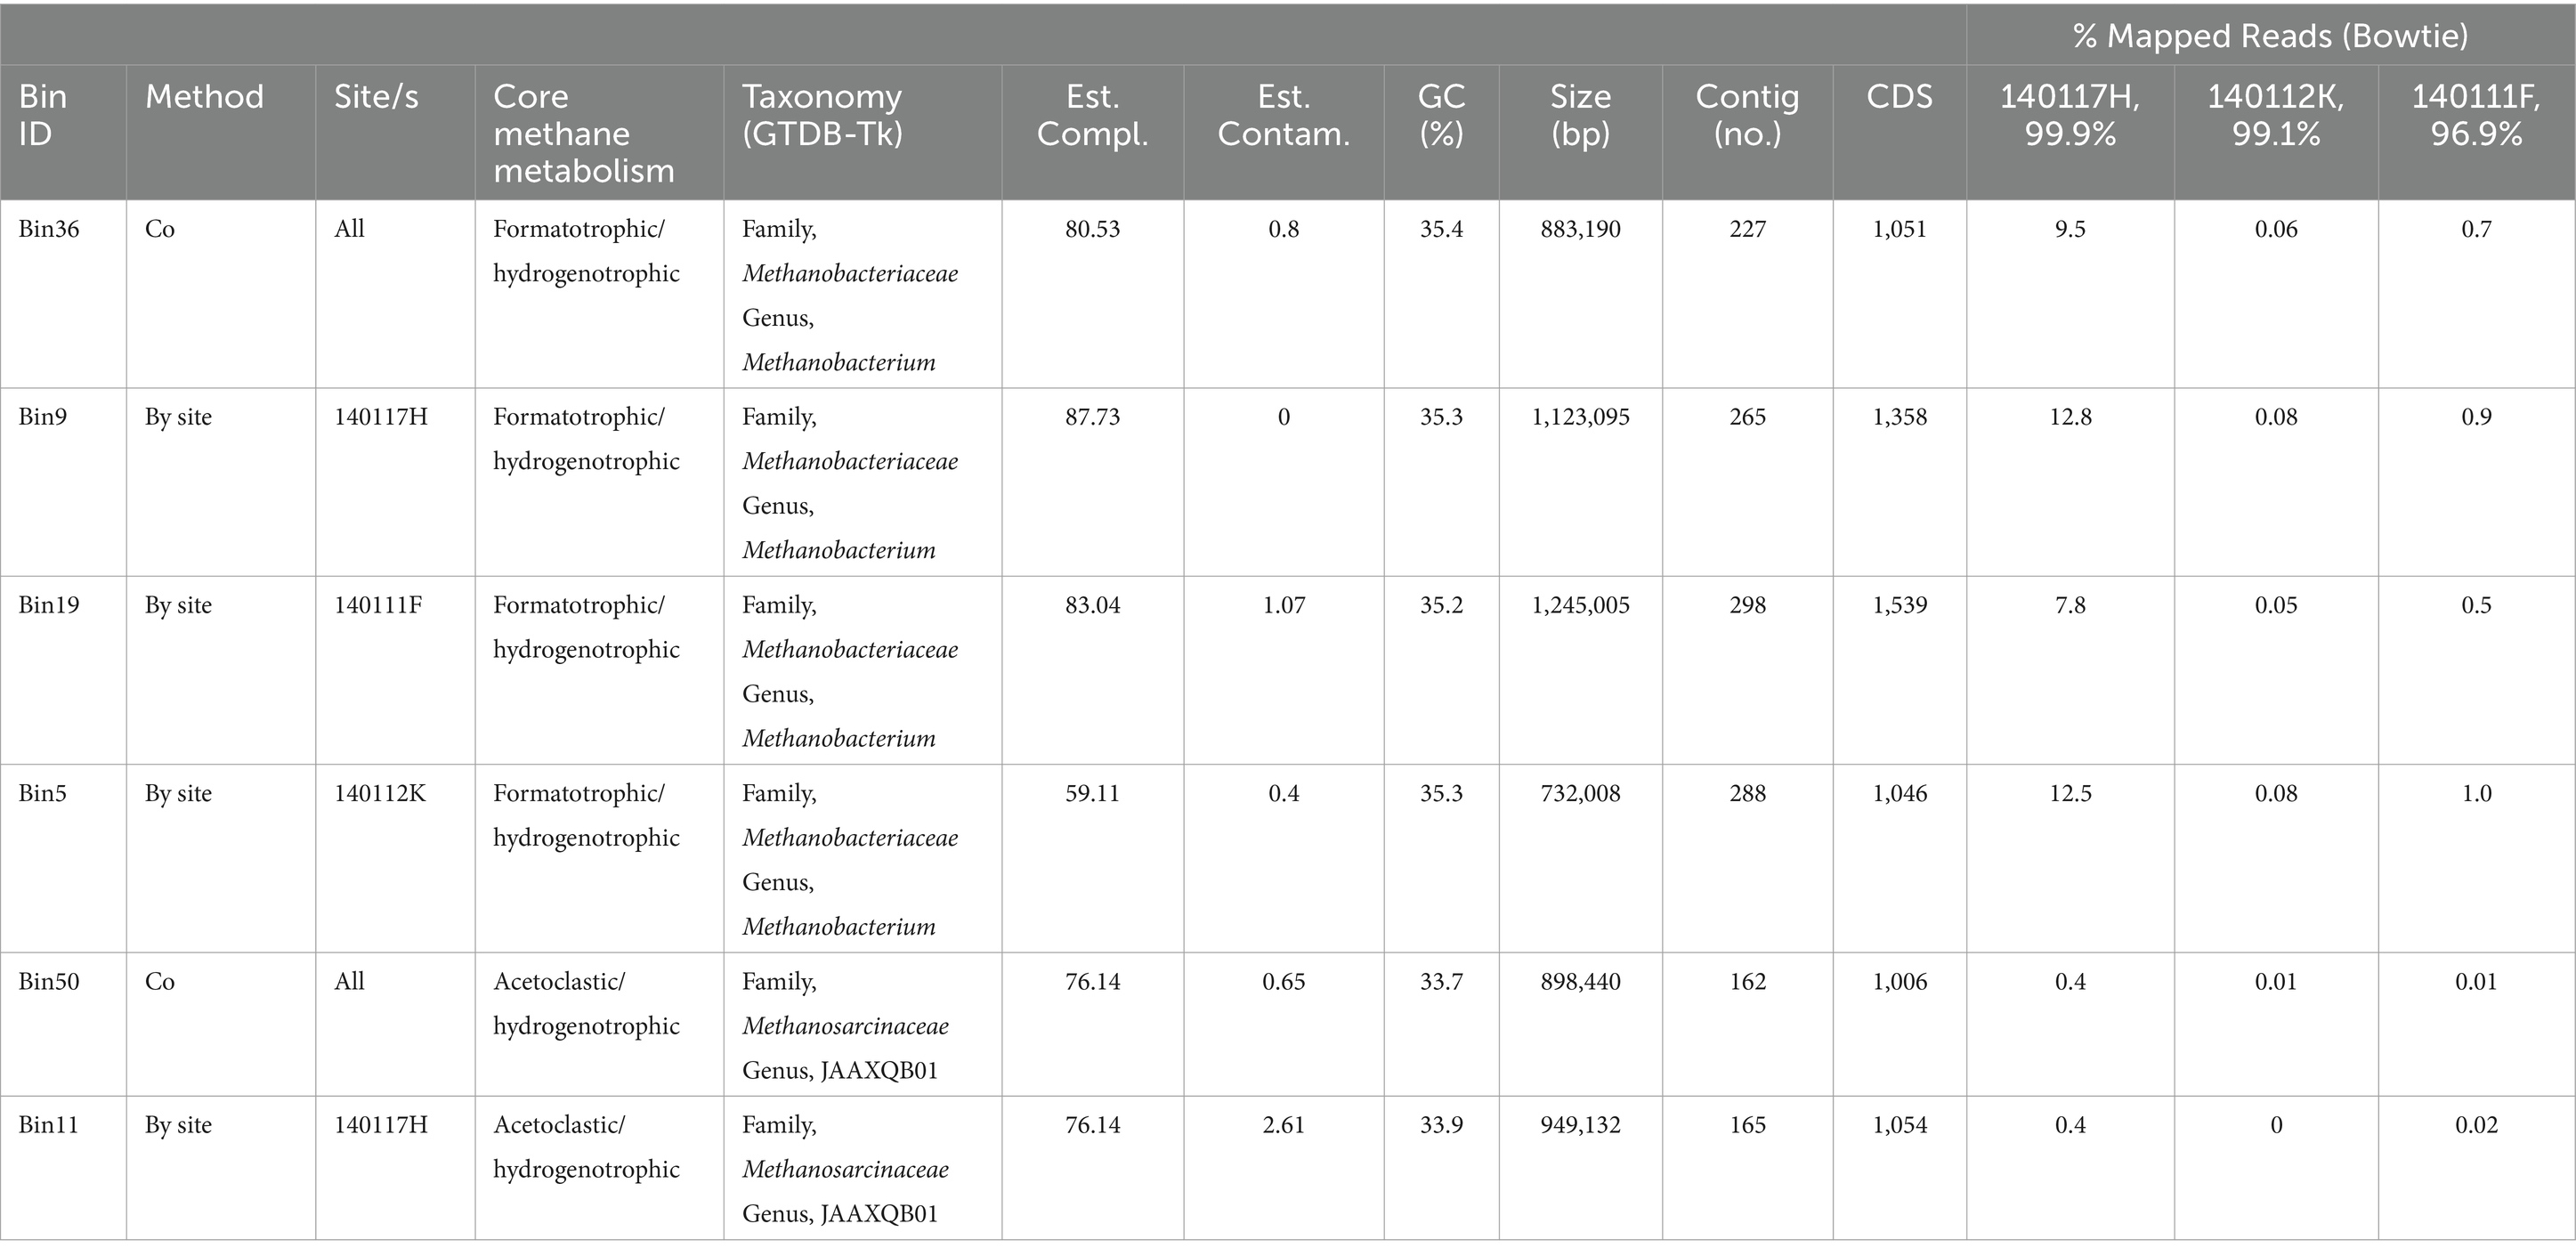
Table 5. Assembly statistics for metagenome assemble genomes (MAGs) of methanogens and the estimated frequency of the genomes at each sequencing site.
We assessed the relative frequency of the methanogen bins reported in Table 5, focusing on Bin36 (Methanobacterium) and Bin50 (Methanosarcinaceae) (co-assembled MAGs) in Figure 5B. Among the three sites, Methanobacterium Bin36 is the most abundant at site 140117H, which is the most H2-rich and has the highest energy available in terms of kJ per mole CH4 for formatotrophic and hydrogenotrophic methanogenesis. Bin36 is lowest in abundance at site 140111K, which has the least energy available for hydrogenotrophic and acetoclastic methanogenesis. Methanosarcinaceae Bin50 has the highest frequency at site 1401117H, although it is incredibly low (0.4%) when compared to the frequency of Methanobacterium Bin36 (9.5%). While we could not characterize energy availability for acetoclastic methanogenesis at this site due to acetate being below detection, another Type II fluid site in the same sampling location as 1401117H has comparable energy availability as the other two sites in this analysis, 140111K and 140111F. Therefore, the energy availability for acetoclastic methanogenesis may not be a strong determinant for the occurrence of Methanosarcinaceae in serpentinizing systems.
Given the estimated completeness of the genomes and the number of contigs that did not pass the binning process at each site (see methods), we take these genomes to be draft genomes. However, valuable insights into methanogen metabolisms can be gained from these assemblies. Figure 5C summarizes the core metabolisms of the Methanobacterium and Methanosarcinaceae bins. As Figure 5C illustrates, we see the genomic potential for formatotrophic methanogenesis by Methanobacterium in surface-expressed Type II fluids with the presence of formate dehydrogenase (fdh). Methanobacterium genomes also show evidence for hydrogenotrophic methanogenesis with the presence of methyl viologen reducing hydrogenases (mvh) and CoB-CoM heterodisulfide reductase (hdr) as well as coenzyme F420-reducing hydrogenase (Frh) and membrane bound NiFe hydrogenase (see Supplementary Table S5). As Thieringer et al. (2023) observed, Methanobacterium in our study may be able to use acetate as a carbon source with the presence of acetyl-CoA synthetase (acs) and carbon monoxide dehydrogenase (cdh).
In surface-expressed Type II Methanobacterium genomes, we also see potential for uptake and utilization of HCO3− as a carbon source for hydrogenotrophic methanogenesis. We detect putative ATP-dependent ABC nitrate/sulfonate/bicarbonate transporter in all three Methanobacterium bins. While the exact function of this transporter is unknown, it is not out of the realm of possibilities for chemolithotrophs to have functional bicarbonate transporters (Scott et al., 2019), however, bicarbonate transporters have yet to be characterized in methanogens. If Methanobacterium has functional bicarbonate transporters, once bicarbonate is transported, it is possible that the gamma carbonic anhydrase detected in Methanobacterium bins in this study can convert HCO3− to CO2 for hydrogenotrophic methanogenesis. This process may require some form of a DIC concentrating mechanism, like a carboxysome (an organelle-like structure that traps CO2 and concentrates carbon in bacteria), but whether or not a carboxysome is required is dependent on the DIC flux required at the in-situ growth rate. Carbon concentrating mechanisms have yet to be observed in methanogens and remains a point of exploration, particularly for serpentinized fluids. It is worth noting that carbonic anhydrase was not detected in subsurface Methanobacterium genomes characterized in Fones et al. (2021) and Thieringer et al. (2023), making this a unique attribute of surface-expressed serpentinized fluid Methanobacterium.
Despite the low estimated completeness of the Methanosarcinaceae bins, examining the core metabolism of these genomes reveals that these methanogens have the functional potential to carry out acetoclastic methanogenesis and hydrogenotrophic methanogenesis. The bins of Methanosarcinaceae lack the genes that code for acetate kinase (ack) and phosphate acetyltransferase (pta), which together can convert acetate to acetyl-CoA, however they have acetyl-CoA synthetase (acs) which directly converts acetate to acetyl-CoA. Acetoclastic methanogens of the genus Methanothrix are known to have acs, which has a higher substrate affinity for acetate than methanogens of the genus Methanosarcina, which use ack and pta for acetate activation (Stams et al., 2019). It may be that the overall low organic carbon content of serpentinizing systems selects for acetoclastic methanogens with a high substrate affinity for acetate. It is worth noting that the activation of acetate by acs requires two ATP (Stams et al., 2019). The energetic cost to make 1 ATP from 1 ADP is ~45 kJ per mol CH4 (Thauer et al., 1977). Based on our affinity calculations there is on average 38 ± 9 kJ per mole CH4, which is only enough energy for production of 1 ATP and therefore not enough for acetate activation. However, the bins shown evidence for H2 utilization. If both pools of energy (hydrogenotrophic and acetoclastic) are available to acetoclastic methanogens, then there is more than enough energy for acetate activation. Indeed, some acetoclastic methanogens have been shown to also use H2 and CO2 (Welte and Deppenmeier, 2014). It is also worth noting the complete pathway for autotrophy in the Methanosarcinaceae bins. It is possible that CO2 can be supplied through acetate uptake and conversion to CO2 (with acetyl-CoA as intermediate) by carbon monoxide dehydrogenase (cdh). This may explain why the frequency of Bin11 is highest at 140117H, which has the highest energy availability for hydrogenotrophic methanogenesis as the electron donor among the three sequencing sites.
We carried out a phylogenomic analysis to compare our Methanobacterium genomes to those published in Fones et al. (2021) and Thieringer et al. (2023). The resulting maximum likelihood phylogenomic tree shows the pattern of macroevolutionary relationships between Samail Ophiolite Methanobacterium and other methanogens, including other Methanobacterium species, as well as Methanosphaera, Methanobrevibacter, Methanocalculus, and the Methanosarcinaceae. Bootstrap values at nodes indicate the percentage of replicate trees in which a given node was observed; these were overwhelmingly close to 100, as can be seen in Figure 6. Genomes for which there was reliable environmental data available were labeled according to environment type. Colored squares were used to indicate pH affinity. The highest observed optimum or environmental pH for each genome was used to assess whether it fell into the following categories: neutrophile: pH 6.5 to 8.5; alkaliphile: pH 8.5 to 10; hyperalkaliphile: pH 10 and above. Colored triangles indicate temperature affinity. Psychrophiles were those with their lowest point in optimum or observed temperature below 20°C; all others were mesophiles. Among genomes from the Samail Ophiolite, colored circles indicate whether genomes were found at the surface or subsurface. The root of the tree is based on Thieringer et al. (2023). An unrooted tree is shown in Supplementary Figure S4.
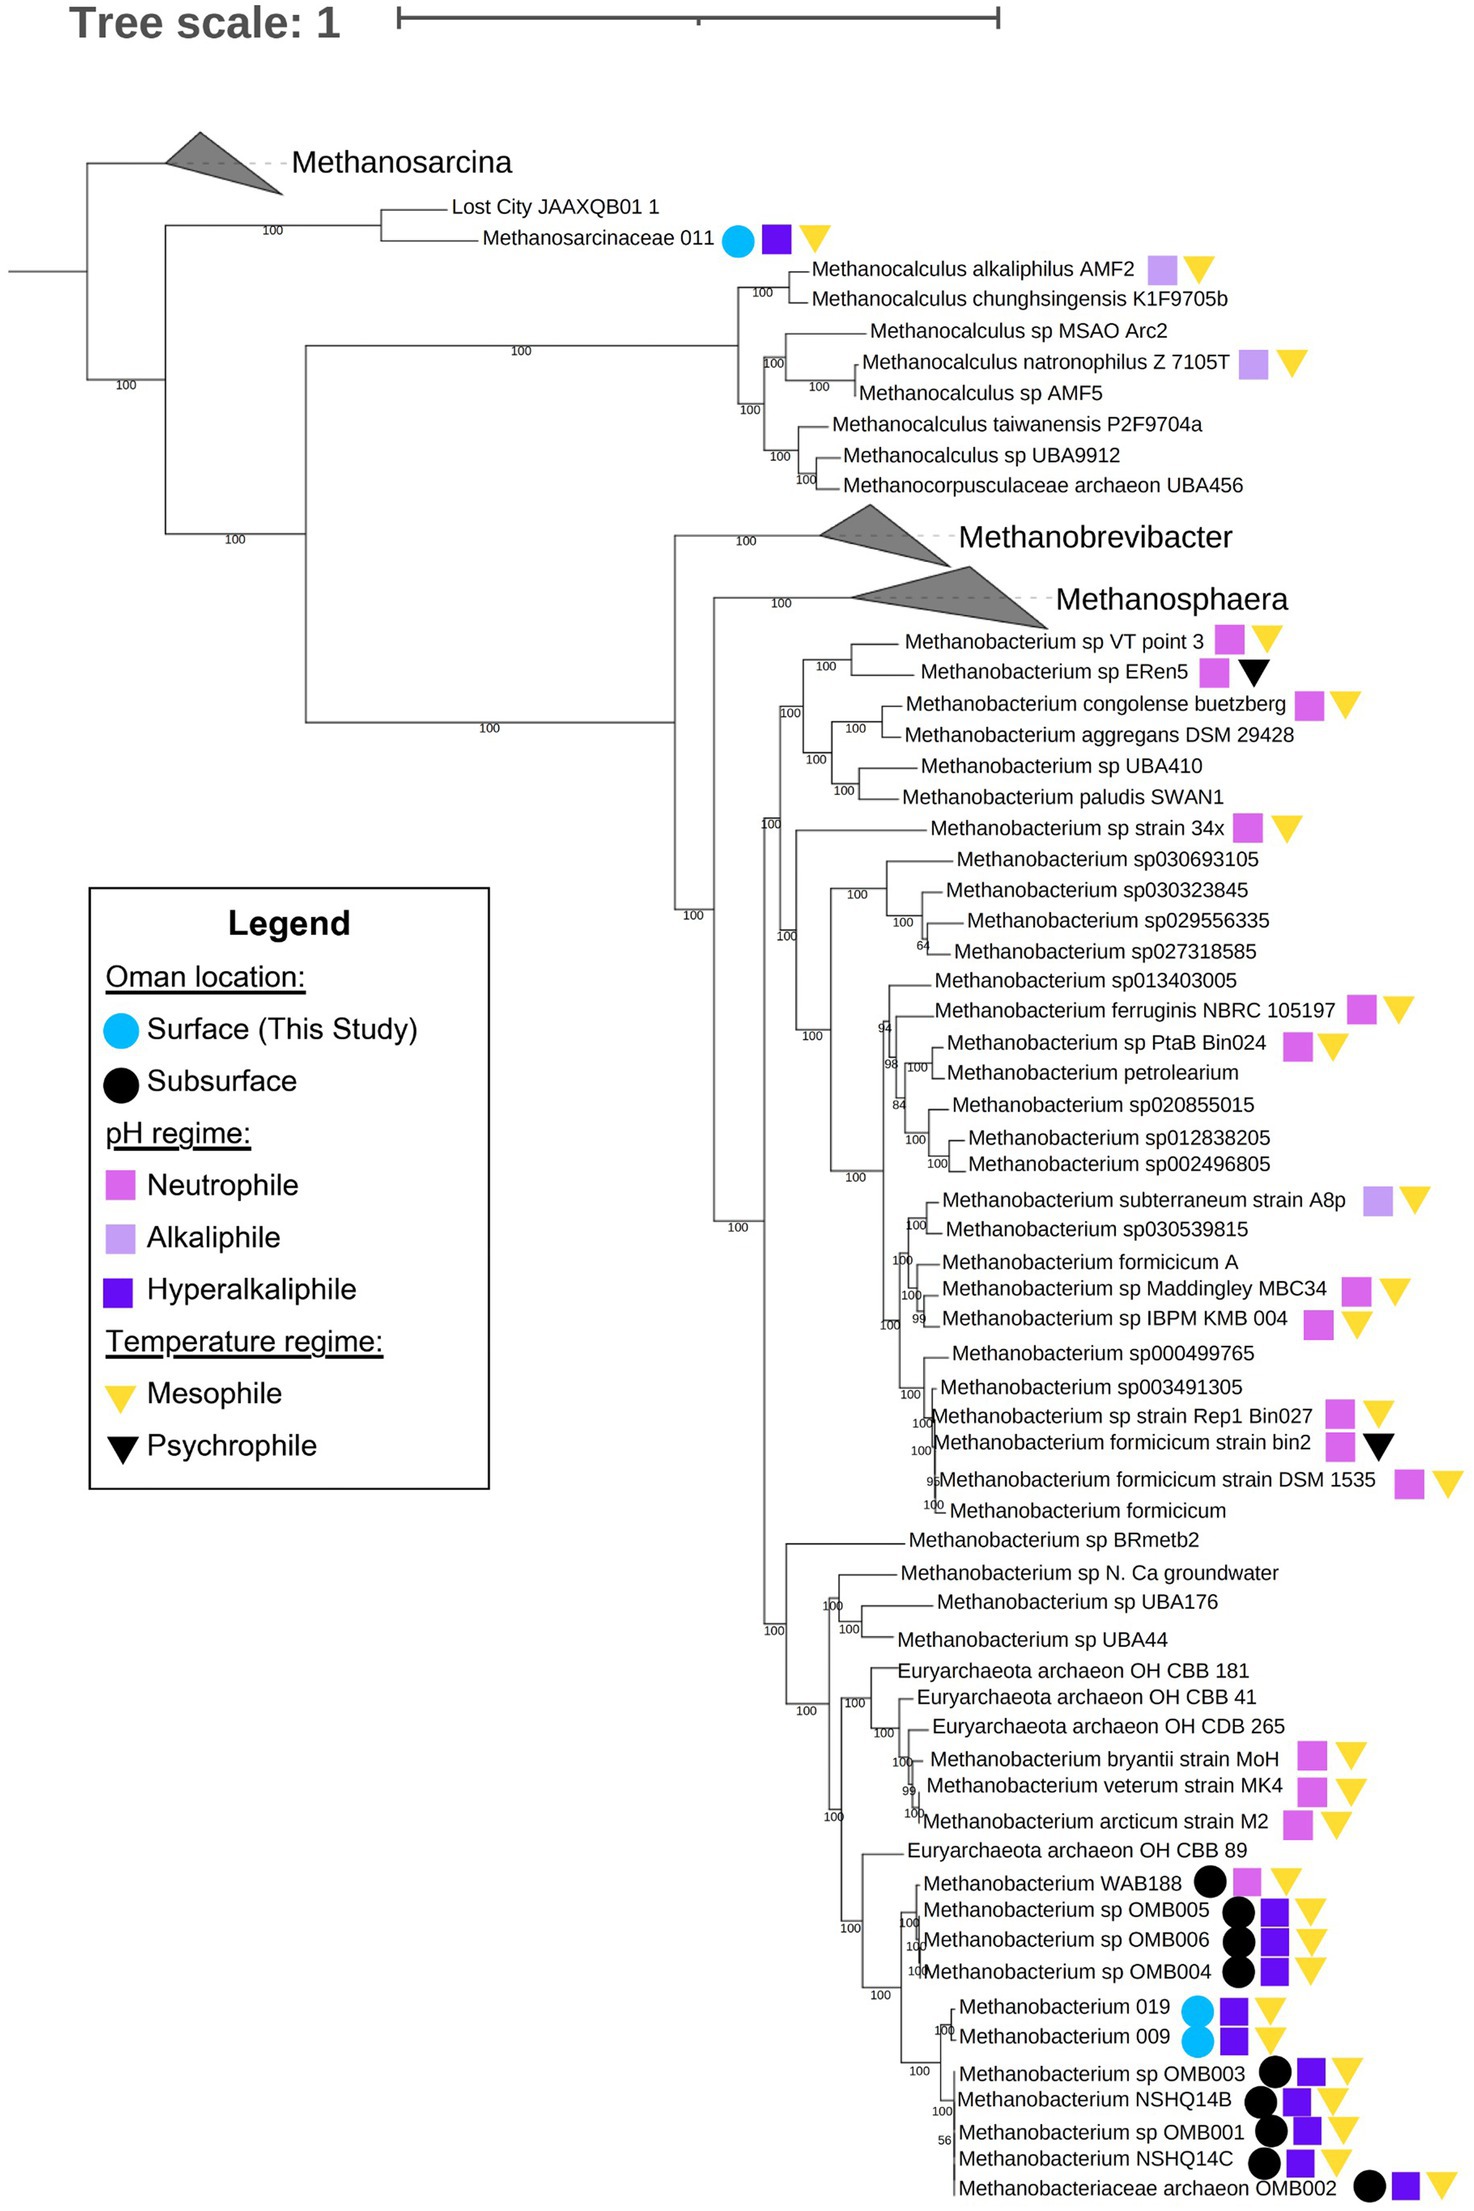
Figure 6. Maximum likelihood phylogenomic tree of Methanobacterium, Methanosarcinaceae and related taxa constructed via GToTree using 76 archaeal marker genes identified by the program. Within GToTree, IQ-TREE was called in order to generate the tree. The program was run with 1,000 bootstrap replicates; bootstrap confidence estimates (out of 100) are shown at nodes. We included 11 genomes from Samail Ophiolite Methanobacterium and 18 genomes from other methanogenic archaea which had satisfactory metadata and genome completeness. Also included were GTDB representative genomes from the genera Methanobacterium, Methanosphaera, Methanobrevibacter, and Methanosarcina, as well as genomes identified by GTDB-Tk - v2.3.2 as “close relatives” of Methanocalculus natronophilus, Methanobacterium congolense buetzberg, and the Oman MAGs isolated by Thieringer et al., 2023 and in this study. Genomes for which relevant metadata was available are marked on the tree. Circles indicate genomes from surface (light blue) and subsurface (teal) environments among methanogens taken from the Samail Ophiolite in Oman. Squares indicate pH affinity, neutrophile (mauve), alkaliphile (lavender), or hyperalkaliphile (dark purple), of all relevant strains; and triangles indicate temperature affinity, mesophile (yellow) or psychrophile (black), of all relevant strains. Neutrophiles were defined as organisms which, whether through environmental or culture-derived data, were determined to thrive between pH 6.5 and 8.5 but no higher; alkaliphiles were defined as those which thrived between pH 8.5 and 10 but no higher; hyperalkaliphiles were those which thrived at pH 10 and above. Similarly, psychrophiles were defined as organisms which, whether through environmental or culture-derived data, were determined to thrive below 20°C; mesophiles were those which thrived between 20 and 50°C but no lower. More information on these genomes and the metadata used to label this tree can be found in Supplementary Table S5.
This analysis shows that Methanobacterium bins from surface-expressed fluids share a common ancestor with Type II Methanobacterium from the subsurface (Figure 6). The phylogenomic relationship and core metabolism annotation suggest that like Type II Methanobacterium from subsurface well fluids (Fones et al., 2021) Methanobacterium from the surface may be able to use formate as an electron donor and have maintained functional capability for hydrogenotrophic methanogenesis. The phylogenomic tree also reveals that Methanobacterium from Oman form their own clade distinct from neutrophilic Methanobacterium. There is one Methanobacterium cultivar considered to be an alkaliphile, M. subterraneum. However, it is in a clade with other neutrophilic Methanobacterium genomes. This suggests that adaptations to serpentinized fluids may extend beyond adaptation to alkaline pH alone. For Methanobacterium, this may be attributed to carbon limitation, as described in Fones et al. (2021). The Methanosarcinaceae Bin11 and Lost City MAG (JAAXQB01) form their own distinct clade and appear to share a common ancestor with other Methanosarcina (see unrooted tree in Supplementary Figure S4). The new serpentinizing system clade are closely relately to methanogens of the genus Methanocalculus, some species of which are alkaline soda lake methanogens that can carry out hydrogenotrophic methanogenesis and require acetate for growth (Sorokin et al., 2015). This suggests that alkaline pH may be a selective pressure for evolution of acetoclastic and acetate-utilizing methanogens.
Overall, examining methanogen genomes in surface-expressed Type II fluids shows that hydrogenotrophic methanogenesis with HCO3−, formatotrophic methanogenesis, and acetoclastic methanogenesis are genomically possible, even co-occurring in these systems. The genomic potential for formatotrophic methanogenesis by Methanobacterium combined with energetic calculations supports the hypothesis that there may be an energetic drive for Methanobacterium to carry out formatotrophic methanogenesis, despite the high concentration of H2 available for hydrogenotrophic methanogenesis. H2 may may act as an additional electron donor for methanogenesis by Methanosarcinaceae in serpentinizing systems after acetate is converted to CO2 by carbon monoxide dehydrogenase. The first-time detection of genomes in the Samail Ophiolite classified as Methanosarcinaceae and their phylogenomic similarity to Methanosarcinaceae genomes from Lost City suggest that potential acetoclastic methanogens in serpentinizing systems are unique and beg for deeper characterization.
4 Conclusion
In this study, we found that in the most reduced, hyperalkaline, H2-rich serpentinized fluids in the Samail Ophiolite, formatotrophic methanogenesis yields more energy than hydrogenotrophic and acetoclastic methanogenesis in terms of kJ per mole CH4 produced. While these fluids are H2-rich, they are also depleted of inorganic carbon. Consequently, formatotrophic methanogenesis, a reaction that produces 3 moles of inorganic carbon per mole of CH4 produced, can be more energetically favorable than hydrogenotrophic methanogenesis with H2 as the electron donor. This may explain why formatotrophic Methanobacterium from Oman characterized in subsurface Type II fluids in Fones et al. (2021) and possibly surface-expressed Methanobacterium characterized in this study may preferentially use formate over bicarbonate in Type II fluids. That said, in terms of J per kg of fluid, hydrogenotrophic methanogenesis yields more energy than formatotrophic and acetoclastic methanogenesis, especially in mixed fluids where H2 is not stoichiometrically limited, and there is a greater supply of inorganic carbon due to fluid mixing. While mixed fluids pose a problem to methanogens at the surface due to the influence of O2 (Howells et al., 2022), the energy available for hydrogenotrophic methanogenesis in mixed subsurface fluids may explain the ability of Methanobacterium (genome Type I) to use inorganic carbon and formate for methanogenesis as reported in Fones et al. (2021).
Our work finds that acetoclastic methanogenesis is energetically favorable in serpentinized fluids in Oman. However, previous studies on the microbial communities in the Samail Ophiolite failed to detect acetoclastic methanogens. In this study, we assembled for the first time a genome classified as belonging to the acetoclastic methanogen family, Methanosarcinaceae. Based on phylogenomic analyses, this MAG has only one close relative, a genome of an acetoclastic methanogen of the family Methanosarcinaceae, JAAXQB01, resolved from the Lost City serpentinizing hydrothermal vent field (McGonigle et al., 2020). The unique nature of these genomes inspires deeper characterization of a potentially novel methanogen group.
Overall, this work stresses the importance of considering both substrate availability and energy availability when examining factors that influence methanogen distribution and evolution on Earth. For the same reason that hydrogenotrophic methanogenesis is an energetically costly process in serpentinized fluids, formatotrophic methanogenesis is energetically favorable and circumvents the cost of utilizing CO2 in an inorganic carbon-limited environment. As we look beyond Earth and consider what life may be supported on Enceladus or Europa, this study suggests a broader suite of carbon substrates could support life like methanogens on these moons, particularly given that formate can be produced abiotically under hydrothermal, serpentinizing conditions.
Data availability statement
The original contributions presented in the study are publicly available. This data can be found here: https://www.ncbi.nlm.nih.gov/sra, under the BioProject number PRJNA1207711. The metagenome-assembled genomes presented in this study will be made available by the authors without undue reservation upon request.
Author contributions
AH: Conceptualization, Data curation, Formal analysis, Investigation, Methodology, Project administration, Supervision, Validation, Visualization, Writing – original draft, Writing – review & editing. LQ: Data curation, Formal analysis, Investigation, Methodology, Visualization, Writing – original draft, Writing – review & editing. MS: Data curation, Formal analysis, Investigation, Methodology, Visualization, Writing – original draft, Writing – review & editing. KA: Data curation, Formal analysis, Investigation, Visualization, Writing – original draft, Writing – review & editing. LF: Conceptualization, Data curation, Formal analysis, Investigation, Methodology, Software, Validation, Visualization, Writing – original draft, Writing – review & editing. GB: Data curation, Formal analysis, Investigation, Methodology, Project administration, Software, Supervision, Validation, Visualization, Writing – original draft, Writing – review & editing. SK: Data curation, Formal analysis, Investigation, Methodology, Supervision, Validation, Writing – original draft, Writing – review & editing. KR: Data curation, Formal analysis, Investigation, Methodology, Validation, Writing – original draft, Writing – review & editing. JB: Formal analysis, Funding acquisition, Investigation, Project administration, Resources, Supervision, Writing – original draft, Writing – review & editing. ES: Funding acquisition, Investigation, Project administration, Resources, Supervision, Validation, Writing – original draft, Writing – review & editing. TH: Formal analysis, Funding acquisition, Investigation, Methodology, Project administration, Resources, Supervision, Validation, Writing – original draft, Writing – review & editing.
Funding
The author(s) declare that financial support was received for the research, authorship, and/or publication of this article. Field research was funded by NASA Exobiology Grant NNX12AB38G, the NASA Astrobiology Institute Rock-Powered Life (RPL) project Grant NNA15BB02A, and NSF Grant EAR-1515513. The Water-Organic-Rock-Microbe (WORM) Portal was supported by NSF grants EAR-1949030 and EAR-2149016. Shotgun metagenome sequencing was funded through the Deep Carbon Observatory’s Census of Deep Life supported by the Alfred P. Sloan Foundation. We acknowledge support from the NASA Planetary Science Division to the Center for Life Detection ISFM team. The NASA Postdoctoral Program at NASA Ames Research Center funded Alta E. G. Howells postdoctoral fellowship. The University of Washington Astrobiology Program supported Lucas Fifer’s involvement in the project. Lilja Quinn, Miguel Silva and Kylie Akiyama completed their portions of this project as part of their participation in the BMSIS Young Scientist Program (YSP) at NASA Ames Research Center under the mentorship of Alta E. G. Howells and Tori M. Hoehler.
Acknowledgments
We acknowledge the contribution of the Exobiology Scholars Program in the Exobiology Branch at NASA Ames Research Center to the internships of Lilja Quinn, Miguel Silva and Kylie Akiyama. We appreciate Sanjoy Som for the helpful insights into methanogenesis and substrate flux in serpentinizing systems. We acknowledge Alexis Templeton and Rock Powered Life for facilitating research in Oman. We thank Peter Kelemen and Jürg Matter for their logistical assistance in the field. We acknowledge the assistance of Michael Kubo in setting up the internships of Lilja Quinn, Kylie Akiyama and Miguel Silva. We thank Jan Amend for being a source of inspiration and helping lay the foundations of energy supply assessments in this study.
Conflict of interest
The authors declare that the research was conducted in the absence of any commercial or financial relationships that could be construed as a potential conflict of interest.
Generative AI statement
The authors declare that no Gen AI was used in the creation of this manuscript.
Publisher’s note
All claims expressed in this article are solely those of the authors and do not necessarily represent those of their affiliated organizations, or those of the publisher, the editors and the reviewers. Any product that may be evaluated in this article, or claim that may be made by its manufacturer, is not guaranteed or endorsed by the publisher.
Supplementary material
The Supplementary material for this article can be found online at: https://www.frontiersin.org/articles/10.3389/fmicb.2024.1523912/full#supplementary-material
Footnotes
References
Alneberg, J., Bjarnason, B. S., de Bruijn, I., Schirmer, M., Quick, J., Ijaz, U. Z., et al. (2013). CONCOCT: clustering contigs on coverage and composition. arXiv:1312.4038. doi: 10.48550/arXiv.1312.4038
Bar-Even, A., Noor, E., Savir, Y., Liebermeister, W., Davidi, D., Tawfik, D. S., et al. (2011). The moderately efficient enzyme: evolutionary and physicochemical trends shaping enzyme parameters. Biochemistry 50, 4402–4410. doi: 10.1021/bi2002289
Bolger, A. M., Lohse, M., and Usadel, B. (2014). Trimmomatic: a flexible trimmer for Illumina sequence data. Bioinformatics 30, 2114–2120. doi: 10.1093/bioinformatics/btu170
Boone, D. R., Johnson, R. L., and Liu, Y. (1989). Diffusion of the interspecies electron carriers H2 and formate in methanogenic ecosystems and its implications in the measurement of K m for H2 or formate uptake. Appl. Environ. Microbiol. 55, 1735–1741. doi: 10.1128/aem.55.7.1735-1741.1989
Boyer, G., Robare, J., Park, N., Ely, T., and Shock, E. (2024). AqEquil: Python package for aqueous geochemical speciation (v0.19.0). Zenodo. doi: 10.5281/zenodo.13530217
Brazelton, W. J., McGonigle, J. M., Motamedi, S., Pendleton, H. L., Twing, K. I., Miller, B. C., et al. (2022). Metabolic strategies shared by basement residents of the lost City hydrothermal field. Appl. Environ. Microbiol. 88, e00929–e00922. doi: 10.1128/aem.00929-22
Brettin, T., Davis, J. J., Disz, T., Edwards, R. A., Gerdes, S., Olsen, G. J., et al. (2015). RASTtk: a modular and extensible implementation of the RAST algorithm for building custom annotation pipelines and annotating batches of genomes. Sci. Rep. 5, 1–6. doi: 10.1038/srep08365
Callahan, B. J., McMurdie, P. J., Rosen, M. J., Han, A. W., Johnson, A. J. A., and Holmes, S. P. (2016). DADA2: high-resolution sample inference from Illumina amplicon data. Nat. Methods 13, 581–583. doi: 10.1038/nmeth.3869
Camacho, C., Coulouris, G., Avagyan, V., Ma, N., Papadopoulos, J., Bealer, K., et al. (2009). BLAST+: architecture and applications. BMC Bioinformatics 10:421. doi: 10.1186/1471-2105-10-421
Canovas, P. A. III, Hoehler, T., and Shock, E. L. (2017). Geochemical bioenergetics during low-temperature serpentinization: an example from the Samail ophiolite, Sultanate of Oman. J. Geophys. Res. Biogeo. 122, 1821–1847. doi: 10.1002/2017JG003825
Capella-Gutiérrez, S., Silla-Martínez, J. M., and Gabaldón, T. (2009). trimAl: a tool for automated alignment trimming in large-scale phylogenetic analyses. Bioinformatics 25, 1972–1973. doi: 10.1093/bioinformatics/btp348
Caporaso, J. G., Lauber, C. L., Walters, W. A., Berg-Lyons, D., Huntley, J., Fierer, N., et al. (2012). Ultra-high-throughput microbial community analysis on the Illumina HiSeq and MiSeq platforms. ISME J. 6, 1621–1624. doi: 10.1038/ismej.2012.8
Chaumeil, P. A., Mussig, A. J., Hugenholtz, P., and Parks, D. H. (2022). GTDB-Tk v2: memory friendly classification with the genome taxonomy database. Bioinformatics 38, 5315–5316. doi: 10.1093/bioinformatics/btac672
Chen, X., Ottosen, L. D. M., and Kofoed, M. V. W. (2019). How low can you go: methane production of Methanobacterium congolense at low CO2 concentrations. Front. Bioeng. Biotechnol. 7:34. doi: 10.3389/fbioe.2019.00034
Colman, D. R., Boyd, E. S., Templeton, A. S., and Spear, J. R. (2024). The microbial ecology of Serpentinites. bioRxiv. doi: 10.1101/2024.11.10.622848
Colman, D. R., Kraus, E. A., Thieringer, P. H., Rempfert, K., Templeton, A. S., Spear, J. R., et al. (2022). Deep-branching acetogens in serpentinized subsurface fluids of Oman. Proc. Natl. Acad. Sci. 119:e2206845119. doi: 10.1073/pnas.2206845119
Cussler, E. L. (2009). Diffusion: Mass transfer in fluid systems. New York, United States: Cambridge University Press.
DeSantis, T. Z., Hugenholtz, P., Larsen, N., Rojas, M., Brodie, E. L., Keller, K., et al. (2006). Greengenes, a chimera-checked 16S rRNA gene database and workbench compatible with ARB. Appl. Environ. Microbiol. 72, 5069–5072. doi: 10.1128/AEM.03006-05
Eddy, S. R. (2011). Accelerated profile HMM searches. PLoS Comput. Biol. 7:e1002195. doi: 10.1371/journal.pcbi.1002195
Edgar, R. C. (2022). Muscle5: high-accuracy alignment ensembles enable unbiased assessments of sequence homology and phylogeny. Nat. Commun. 13:6968. doi: 10.1038/s41467-022-34630-w
Fones, E. M., Colman, D. R., Kraus, E. A., Nothaft, D. B., Poudel, S., Rempfert, K. R., et al. (2019). Physiological adaptations to serpentinization in the Samail ophiolite, Oman. ISME J. 13, 1750–1762. doi: 10.1038/s41396-019-0391-2
Fones, E. M., Colman, D. R., Kraus, E. A., Stepanauskas, R., Templeton, A. S., Spear, J. R., et al. (2021). Diversification of methanogens into hyperalkaline serpentinizing environments through adaptations to minimize oxidant limitation. ISME J. 15, 1121–1135. doi: 10.1038/s41396-020-00838-1
Hoehler, T. M. (2004). Biological energy requirements as quantitative boundary conditions for life in the subsurface. Geobiology 2, 205–215. doi: 10.1111/j.1472-4677.2004.00033.x
Hoehler, T. M. (2007). An energy balance concept for habitability. Astrobiology 7, 824–838. doi: 10.1089/ast.2006.0095
Howells, A. E., De Martini, F., Gile, G. H., and Shock, E. L. (2023). An examination of protist diversity in serpentinization-hosted ecosystems of the Samail ophiolite of Oman. Front. Microbiol. 14:1139333. doi: 10.3389/fmicb.2023.1139333
Howells, A. E., Leong, J. A., Ely, T., Santana, M., Robinson, K., Esquivel-Elizondo, S., et al. (2022). Energetically informed niche models of hydrogenotrophs detected in sediments of serpentinized fluids of the Samail ophiolite of Oman. Journal of geophysical research. Biogeosciences 127:e2021JG006317. doi: 10.1029/2021JG006317
Hyatt, D., Chen, G. L., LoCascio, P. F., Land, M. L., Larimer, F. W., and Hauser, L. J. (2010). Prodigal: prokaryotic gene recognition and translation initiation site identification. BMC Bioinformatics 11:119. doi: 10.1186/1471-2105-11-119
Johnson, K. S. (1982). Carbon dioxide hydration and dehydration kinetics in seawater 1. Limnol. Oceanogr. 27, 849–855. doi: 10.4319/lo.1982.27.5.0849
Kang, D. D., Li, F., Kirton, E., Thomas, A., Egan, R., An, H., et al. (2019). MetaBAT 2: an adaptive binning algorithm for robust and efficient genome reconstruction from metagenome assemblies. PeerJ, 7:e7359.
Kelemen, P. B., Matter, J., Streit, E. E., Rudge, J. F., Curry, W. B., and Blusztajn, J. (2011). Rates and mechanisms of mineral carbonation in peridotite: natural processes and recipes for enhanced, in situ CO2 capture and storage. Annu. Rev. Earth Planet. Sci. 39, 545–576. doi: 10.1146/annurev-earth-092010-152509
Langmead, B., and Salzberg, S. L. (2012). Fast gapped-read alignment with bowtie 2. Nat. Methods 9, 357–359. doi: 10.1038/nmeth.1923
Lee, M. D. (2019). GToTree: a user-friendly workflow for phylogenomics. Bioinformatics 35, 4162–4164. doi: 10.1093/bioinformatics/btz188
Leong, J. A. M., Howells, A. E., Robinson, K. J., Cox, A., Debes, R. V., Fecteau, K., et al. (2021). Theoretical predictions versus environmental observations on serpentinization fluids: lessons from the Samail ophiolite in Oman. J. Geophys. Res. Solid Earth 126:e2020JB020756. doi: 10.1029/2020JB020756
Letunic, I., and Bork, P. (2024). Interactive tree of life (iTOL) v6: recent updates to the phylogenetic tree display and annotation tool. Nucleic Acids Res. 52, W78–W82. doi: 10.1093/nar/gkae268
McCollom, T. M., and Bach, W. (2009). Thermodynamic constraints on hydrogen generation during serpentinization of ultramafic rocks. Geochim. Cosmochim. Acta 73, 856–875. doi: 10.1016/j.gca.2008.10.032
McCollom, T. M., and Seewald, J. S. (2007). Abiotic synthesis of organic compounds in deep-sea hydrothermal environments. Chem. Rev. 107, 382–401. doi: 10.1021/cr0503660
McDermott, J. M., Seewald, J. S., German, C. R., and Sylva, S. P. (2015). Pathways for abiotic organic synthesis at submarine hydrothermal fields. Proc. Natl. Acad. Sci. 112, 7668–7672. doi: 10.1073/pnas.1506295112
McGonigle, J. M., Lang, S. Q., and Brazelton, W. J. (2020). Genomic evidence for formate metabolism by Chloroflexi as the key to unlocking deep carbon in lost City microbial ecosystems. Appl. Environ. Microbiol. 86, e02583–e02519. doi: 10.1128/AEM.02583-19
Miller, H. M., Matter, J. M., Kelemen, P., Ellison, E. T., Conrad, M. E., Fierer, N., et al. (2016). Modern water/rock reactions in Oman hyperalkaline peridotite aquifers and implications for microbial habitability. Geochim. Cosmochim. Acta 179, 217–241. doi: 10.1016/j.gca.2016.01.033
Nguyen, L. T., Schmidt, H. A., Von Haeseler, A., and Minh, B. Q. (2015). IQ-TREE: a fast and effective stochastic algorithm for estimating maximum-likelihood phylogenies. Mol. Biol. Evol. 32, 268–274. doi: 10.1093/molbev/msu300
Nothaft, D. B., Templeton, A. S., Boyd, E. S., Matter, J. M., Stute, M., Paukert Vankeuren, A. N., et al. (2021a). Aqueous geochemical and microbial variation across discrete depth intervals in a peridotite aquifer assessed using a packer system in the Samail ophiolite, Oman. Journal of geophysical research. Biogeosciences 126:e2021JG006319. doi: 10.1029/2021JG006319
Nothaft, D. B., Templeton, A. S., Rhim, J. H., Wang, D. T., Labidi, J., Miller, H. M., et al. (2021b). Geochemical, biological, and clumped isotopologue evidence for substantial microbial methane production under carbon limitation in serpentinites of the Samail ophiolite, Oman. J. Geophys. Res. Biogeosci. 126:e2020JG006025. doi: 10.1029/2020JG006025
Nurk, S., Meleshko, D., Korobeynikov, A., and Pevzner, P. A. (2017). metaSPAdes: a new versatile metagenomic assembler. Genome Res. 27, 824–834. doi: 10.1101/gr.213959.116
Parkhust, D. L., and Appelo, C. A. J. (1999). A computer program for speciation, batch-reaction, one-dimensional transport and inverse geochemical calculations. USGS Report.
Parks, D. H., Imelfort, M., Skennerton, C. T., Hugenholtz, P., and Tyson, G. W. (2015). CheckM: assessing the quality of microbial genomes recovered from isolates, single cells, and metagenomes. Genome Res. 25, 1043–1055. doi: 10.1101/gr.186072.114
Quast, C., Pruesse, E., Yilmaz, P., Gerken, J., Schweer, T., Yarza, P., et al. (2012). The SILVA ribosomal RNA gene database project: improved data processing and web-based tools. Nucleic Acids Res. 41, D590–D596. doi: 10.1093/nar/gks1219
R Core Team (2021). R: A Language and Environment for Statistical Computing. R Foundation for Statistical Computing, Vienna, Austria.
Rempfert, K. R., Miller, H. M., Bompard, N., Nothaft, D., Matter, J. M., Kelemen, P., et al. (2017). Geological and geochemical controls on subsurface microbial life in the Samail ophiolite, Oman. Front. Microbiol. 8:56. doi: 10.3389/fmicb.2017.00056
Schönheit, P., Moll, J., and Thauer, R. K. (1980). Growth parameters (K s, μmax, Y s) of Methanobacterium thermoautotrophicum. Arch. Microbiol. 127, 59–65. doi: 10.1007/BF00414356
Scott, K. M., Leonard, J. M., Boden, R., Chaput, D., Dennison, C., Haller, E., et al. (2019). Diversity in CO2-concentrating mechanisms among chemolithoautotrophs from the genera Hydrogenovibrio, Thiomicrorhabdus, and Thiomicrospira, ubiquitous in sulfidic habitats worldwide. Appl. Environ. Microbiol. 85, e02096–e02018. doi: 10.1128/AEM.02096-18
Shock, E. L., and Holland, M. E. (2007). Quantitative habitability. Astrobiology 7, 839–851. doi: 10.1089/ast.2007.0137
Shock, E. L., Holland, M., Amend, J. P., Osburn, G. R., and Fischer, T. P. (2010). Quantifying inorganic sources of geochemical energy in hydrothermal ecosystems, Yellowstone National Park, USA. Geochim. Cosmochim. Acta 74, 4005–4043. doi: 10.1016/j.gca.2009.08.036
Sieber, C. M., Probst, A. J., Sharrar, A., Thomas, B. C., Hess, M., Tringe, S. G., et al. (2018). Recovery of genomes from metagenomes via a dereplication, aggregation and scoring strategy. Nat. Microbiol. 3, 836–843. doi: 10.1038/s41564-018-0171-1
Sorokin, D. Y., Abbas, B., Merkel, A. Y., Rijpstra, W. I. C., Damsté, J. S. S., Sukhacheva, M. V., et al. (2015). Methanosalsum natronophilum sp. nov., and Methanocalculus alkaliphilus sp. nov., haloalkaliphilic methanogens from hypersaline soda lakes. Int. J. Syst. Evol. Microbiol. 65, 3739–3745. doi: 10.1099/ijsem.0.000488
Stams, A. J. M., Teusink, B., and Sousa, D. Z. (2019). Ecophysiology of acetoclastic methanogens. In: Biogenesis of Hydrocarbons. Handbook of Hydrocarbon and Lipid Microbiology. Eds. A. Stams, D. Sousa. Cham: Springer.
Thauer, R. K., Jungermann, K., and Decker, K. (1977). Energy conservation in chemotrophic anaerobic bacteria. Bacteriol. Rev. 41, 100–180. doi: 10.1128/br.41.1.100-180.1977
Thieringer, P. H., Boyd, E. S., Templeton, A. S., and Spear, J. R. (2023). Metapangenomic investigation provides insight into niche differentiation of methanogenic populations from the subsurface serpentinizing environment, Samail ophiolite, Oman. Front. Microbiol. 14:1205558. doi: 10.3389/fmicb.2023.1205558
Vance, S. D., Craft, K. L., Shock, E., Schmidt, B. E., Lunine, J., Hand, K. P., et al. (2023). Investigating Europa’s habitability with the Europa clipper. Space Sci. Rev. 219:81. doi: 10.1007/s11214-023-01025-2
Vanýsek, P. (1993). “Ionic conductivity and diffusion at infinite dilution” in CRC handbook of chemistry and physics, vol. 94.
Vorholt, J. A., and Thauer, R. K. (1997). The active species of ‘CO2’ utilized by formylmethanofuran dehydrogenase from methanogenic Archaea. Eur. J. Biochem. 248, 919–924.
Waite, J. H., Glein, C. R., Perryman, R. S., Teolis, B. D., Magee, B. A., Miller, G., et al. (2017). Cassini finds molecular hydrogen in the Enceladus plume: evidence for hydrothermal processes. Science 356, 155–159. doi: 10.1126/science.aai8703
Welte, C., and Deppenmeier, U. (2014). Bioenergetics and anaerobic respiratory chains of aceticlastic methanogens. Biochim. Biophys. Acta Bioenerget. 1837, 1130–1147. doi: 10.1016/j.bbabio.2013.12.002
Welte, C., Kröninger, L., and Deppenmeier, U. (2014). Experimental evidence of an acetate transporter protein and characterization of acetate activation in aceticlastic methanogenesis of Methanosarcina mazei. FEMS Microbiol. Lett. 359, 147–153. doi: 10.1111/1574-6968.12550
White, W. B., and Ferry, J. G. (1992). Identification of formate dehydrogenase-specific mRNA species and nucleotide sequence of the fdhC gene of Methanobacterium formicicum. J. Bacteriol. 174, 4997–5004. doi: 10.1128/jb.174.15.4997-5004.1992
Wolery, T. J. (2013). EQ3/6 - software for geochemical modeling, Version 8.0a, LLNL-CODE-2013-683958. Livermore, CA: Lawrence Livermore National Laboratory.
Yaws, C. L. (2009). Chapter 12 - “Diffusion coefficient in water–organic compounds” in Transport properties of chemicals and hydrocarbons (Boston: William Andrew Publishing), 502–593. Available at: https://www.sciencedirect.com/science/article/pii/B978081552039950017X
Keywords: methanogenesis, serpentinization, substrate flux, bioenergetics, genomics
Citation: Howells AEG, Quinn LM, Silva MG, Akiyama K, Fifer LM, Boyer G, Kashyap S, Robinson K, Broddrick J, Shock EL and Hoehler TM (2025) Energetic and genomic potential for hydrogenotrophic, formatotrophic, and acetoclastic methanogenesis in surface-expressed serpentinized fluids of the Samail Ophiolite. Front. Microbiol. 15:1523912. doi: 10.3389/fmicb.2024.1523912
Edited by:
Alberto Robador, University of Southern California, United StatesReviewed by:
William J. Brazelton, The University of Utah, United StatesAnnette Ruth Rowe, University of Cincinnati, United States
Copyright © 2025 Howells, Quinn, Silva, Akiyama, Fifer, Boyer, Kashyap, Robinson, Broddrick, Shock and Hoehler. This is an open-access article distributed under the terms of the Creative Commons Attribution License (CC BY). The use, distribution or reproduction in other forums is permitted, provided the original author(s) and the copyright owner(s) are credited and that the original publication in this journal is cited, in accordance with accepted academic practice. No use, distribution or reproduction is permitted which does not comply with these terms.
*Correspondence: Alta E. G. Howells, YWx0YS5ob3dlbGxzQGJtc2lzLm9yZw==