
95% of researchers rate our articles as excellent or good
Learn more about the work of our research integrity team to safeguard the quality of each article we publish.
Find out more
ORIGINAL RESEARCH article
Front. Microbiol. , 04 February 2025
Sec. Antimicrobials, Resistance and Chemotherapy
Volume 15 - 2024 | https://doi.org/10.3389/fmicb.2024.1512580
 Tesfaye Gebreyohannis Hailemariam1,2*
 Melaku Tilahun2
 Abay Atnafu2
 Tesfaye Gelanew2
 Tewodros Tariku Gebresilase2
 Mekdes Alemu Tola2Abaysew Ayele2
 Shewki Moga Siraj3
 Workineh Shibeshi1Kidist Bobosha2
 Liya Wassie2Yonas Hirutu2
 Ephrem Engidawork1
Tuberculosis (TB) remains a global health challenge, with treatment outcomes influenced by the genetic diversity of Mycobacterium tuberculosis (Mtb) strains. This study examines the growth kinetics and drug susceptibility of Mtb strains from different lineages in Ethiopia to understand their impact on disease management. Mtb strains, including sub-lineages 4.1.2.1, 4.2.2.2, 4.6.3, lineages 3 and 7, and the reference strain H37Rv (ATCC 27294), were cultured in liquid 7H9 Middlebrook broth. Growth began on day 6 post-inoculation. Sub-lineage 4.1.2.1 showed rapid exponential growth by day 9, reaching the stationary phase by day 15. Sub-lineage 4.1.2.1 followed by sub-lineage 4.2.2.2 had the highest maximum growth concentration (Cmax), indicating enhanced growth efficiency and adaptive traits that may increase their pathogenicity or resistance to host defenses or anti-TB drugs. To support this observation, the minimum inhibitory concentrations (MIC) for first-line anti-TB drugs were assessed for all the studied Mtb strains using the microdilution broth method. While all strains were susceptible, MIC values varied. Sub-lineages 4.1.2.1 and 4.2.2.2 had MIC values matching WHO’s critical concentrations (except for rifampicin). Lineage 3 showed increased sensitivity to rifampicin, isoniazid, and streptomycin, requiring only half the standard concentration. Lineage 7 also exhibited higher sensitivity to rifampicin and streptomycin. These findings highlight the importance of considering lineage-specific differences in Mtb strains for optimizing treatment regimens and improving TB control strategies, particularly in regions with diverse Mtb populations like Ethiopia.
Tuberculosis (TB), caused by Mycobacterium tuberculosis (Mtb), continues to be a critical global health issue, claiming the lives of over 1.6 million people and further causing infections in about 10.6 million individuals in 2021 (Bagcchi, 2023). If left untreated, up to 70% of those afflicted with the disease will not survive (Tiemersma et al., 2011). The vast majority of these cases occur in developing regions, underscoring the impact of poverty, subpar living conditions, and inadequate healthcare (Bai and Ameyaw, 2024).
Mycobacteria in the Mycobacterium tuberculosis complex (MTBC) share a strong genetic similarity (99.9%) and identical 16S rRNA sequences but differ in host preferences, disease potential, treatment outcomes, drug resistance, BCG vaccine effectiveness, transmission ease, and epidemiological outbreaks. Insights into these differences are vital for developing new vaccines and managing drug-resistant Mtb, ultimately improving treatment strategies and healthcare (Chae and Shin, 2018; Brosch et al., 2002).
The MTBC consists of nine lineages (1 to 9) that have adapted to human hosts (Hailu et al., 2023). These lineages (L) are divided into two clades. The first, “modern” clade, which is adapted to humans and characterized by the TbD1 deletion, forms a monophyletic group (a single phylogenetic lineage) and consists of L-2 (East-Asian), L-3 (East-African Indian), and L-4 (Euro-American) (Moopanar and Mvubu, 2020; Coscolla and Gagneux, 2014). These lineages have undergone more recent diversification than other MTBC strains. Lineages 2 and 4 are not only more globally widespread but also exhibit greater virulence compared to other lineages with more restricted geographical distribution (Coscolla and Gagneux, 2014). The second, ancient clade (are paraphyletic), which retains the TbD1 region, includes lineages adapted to both humans and animals: L-1 (Indo-Oceanic), L-5, L-6 (M. africanum West Africa 1 and 2), L-7 (Ethiopia), L-8 (Rwanda) and L-9 (Related to East African lineages) (Moopanar and Mvubu, 2020; Coscolla and Gagneux, 2014; Ngabonziza et al., 2020; Coscolla et al., 2021). Lineages 1, L-2, and L-3 lack RD239, RD105, and RD750 sequences, respectively, while lineage 4 has a deletion in the pks15/1 gene. Lineages 5 and L-6 lack the RD9 region, with lineage 6 also missing RD7, RD8, and RD10. Additionally, lineages 5 and 6 have unique markers, RD711 and RD702 (Moopanar and Mvubu, 2020).
Africa is the only continent where all MTBC lineages are present, with Ethiopia being a major hub for most lineages (Ngabonziza et al., 2020). In a study of 4,371 clinical isolates over 20 years, 99.5% were Mtb and 0.5% were M. bovis. The proportions of lineages were L4 (62.3%), L3 (21.7%), L1 (7.9%), and L7 (3.4%). The most common sub-lineages were L4.2.2.2 (ETH/SIT149) (14.4%), L4.10/SIT53 (9.7%), L3. ETH1/SIT25 (7.2%), and L4.6/SIT37 (5.5%) (Mekonnen et al., 2019). Lineage 4, especially sublineage 4.2.2.2, is spreading in Ethiopia and is linked to more widespread and multidrug-resistant (MDR) TB infections (Mekonnen et al., 2023), suggesting unique virulence traits.
The outcome of tuberculosis infection and disease varies significantly and has been largely attributed to factors such as host characteristics, MTBC genomic diversity, and environmental influences. Different MTBC strains exhibit variations in virulence and immunogenicity, and there is growing evidence suggesting that strain diversity may play a role in human TB. However, the extent to which MTBC genomic diversity impacts the progression of disease in clinical settings requires further research (Coscolla and Gagneux, 2010).
Generating data on the minimum inhibitory concentration (MIC) and growth kinetics of the different Mtb strains contribute to improving TB treatment strategies and enhancing the dynamics of healthcare system. This study attempted to optimize growth kinetics for most prevalent MTBC lineages circulating in Ethiopia, by measuring colony-forming units (CFU), turbidity, and optical density at 600 nm (OD600). The data provide valuable insights into growth rates and minimum inhibitory concentrations (MIC), thereby generating evidence for potential personalized TB treatment options.
This was an experimental study, where stored Mtb isolates, collected from active pulmonary TB patients as part of the TBGEN study, were used. Five clinically identified Mtb strains, with known genetic characteristics (using whole-genome sequencing, and phenotypic traits, such as drug resistance profiles) along with a reference Mtb strain, H37Rv (ATCC 27294), were selected from the Armauer Hansen Research Institute (AHRI) TB laboratory. The samples were selected based on high genome sequence quality, representing various Mtb lineages and sub-lineages circulating in Ethiopia.
Raw read quality was assessed with FASTQC (v0.12.1) (Yang et al., 2013). Trimmomatic (v0.39) was used to remove low-quality reads, short fragments, and adapter sequences (Daniyarov et al., 2020), the cleaned reads were then aligned to the H37Rv reference genome (NC 000962.3) using BWA (v0.7.18) (Li, 2013). Single nucleotide polymorphisms (SNPs) were identified using the bcftools (v1.8) (Phelan et al., 2019). TBProfiler (v6.2.0) was used to predict drug resistance profiles and lineages (Verboven et al., 2022). SNP-based phylogenetic trees were constructed using IQ-TREE (v2.0.3) with a maximum likelihood model and 1,000 bootstrap replicates, and subsequently annotated and visualized with interactive Tree of Life (iTOL) (v6.9) (Yu, 2020).
To ensure all strains started at a similar growth phase, all Mtb clinical and H37Rv (ATCC 27294) strains standardized concentration of 100 μL (OD600 of 0.2) and each having two replicates, were cultured on 10 mL Middlebrook 7H9 broth (Difco, Detroit, MI, United States) supplemented with 10% OADC (oleic acid, albumin, dextrose, and catalase; Becton Dickinson and Company, Sparks, MD, United States), 0.2% glycerol, and 0.05% Tween 80. The inoculated cultures were incubated in an incubator (Panasonic, MCO-801C-PE) at 37°C for 21 days. Within the first 24 h after inoculation, the culture was visually examined to detect any signs of contamination (Sarkar et al., 2012).
To measure colony-forming unit concentration (CFU/mL), a 100 μL bacterial suspension (from stock vials with an OD600 of 0.2) was used to prepare serial dilutions, which were then inoculated in duplicate onto Middlebrook 7H11 agar plates (Difco, Detroit, MI, United States) containing 0.5% glycerol and 10% OADC growth enrichment (Becton Dickinson, Cockysville, MD, United States). During the 21-day incubation, turbidity, CFU/mL, and OD600 measurements were regularly taken every 3 days (Sarkar et al., 2012). The CFU/mL results were systematically correlated with McFarland standard data and OD600 readings. The optical density at 600 nm (OD600) of the bacterial suspensions was measured using a BioSpectrophotometer (Eppendorf, AG, 22331), while the turbidity of the suspensions was evaluated through nephelometry (DEN-1). The Mtb colonies were carefully counted and adjusted according to the dilution factor.
The MICs were determined as the lowest drug concentration after twofold serially diluted concentration of the drugs that inhibits growth of more than 99.0% of a bacterial proportion of the tested Mtb strains, on suitable broth method, within 14 to 21 days of incubation at 37°C (Schönfeld et al., 2012). MIC of the first-line anti-tuberculosis (TB) drugs isoniazid (INH), rifampicin (RIF), ethambutol (EMB), and streptomycin (STR) was determined using the microdilution broth method (Schön et al., 2021). Mtb clinical isolates were initially cultured and adjusted to a turbidity matching the 1.0 McFarland (McF) standard, which is approximately 1.97 × 10⁶ CFU/mL. This was done by suspending bacterial colonies in sterile saline and visually comparing the turbidity to the McFarland standard. The bacterial suspension was then diluted in Middlebrook 7H9 broth to achieve the final inoculum density required for the assay (Peñuelas-Urquides et al., 2013).
Serial dilutions of each drug were prepared in sterile 96-well microtiter plates, starting from concentration ranges based on critical thresholds: 0.1 μg/mL for INH, 1 μg/mL for RIF, 5 μg/mL for EMB, and 2 μg/mL for STR. MIC determination assays were carried out in triplicate. Each well was inoculated with the 10 μL bacterial suspension, and the plates were incubated at 37°C for 7 to 14 days, depending on the strain’s growth rate (Santos et al., 2020). A growth control (without drug) and a sterile control (without inoculum) were included in each plate. The GCs consist of 1:100 dilution of the 10−2 inoculum of 1 McF (i.e., 1% of the inoculum present in antibiotic contain wells; GC 1%), and the same inoculum (10−2) suspension of 1 McF (i.e., 100% of the inoculum present in antibiotic containing wells; GC100%) (Wikler, 2006).
The MIC was defined as the lowest drug concentration that inhibited visible bacterial growth, indicated by the absence of turbidity in the well. Results were interpreted based on the susceptibility breakpoints established by the World Health Organization’s technical guidelines for microdilution broth method.
Data were analyzed using GraphPad Prism version 10.00 for Windows, GraphPad Software, www.graphpad.com. Two-way ANOVA was performed to evaluate the growth curves and growth rates of Mtb strains and correlation between turbidity, CFU/mL, and OD600, followed by Tukey’s multiple comparisons test to determine the differences in growth rates between each strain. An adjusted p-value threshold of <0.05 was set for significance.
This study received approval from the Institutional Review Board (IRB) of the College of Health Sciences, Addis Ababa University (Approval No. 072/21/Sop). This study was also approved by the AHRI institutional ethics review committee (P031/18).
Clinical isolates of Mtb used in this study were obtained from a previously characterized TB patients from the TBGEN study. A total of five Mtb clinical isolates, with one lineage 3, one lineage 7 and three lineage 4 isolates (sub-lineages 4.2.2.2, 4.6.3, and 4.1.2.1), and one control, H37Rv (ATCC 27294) strain were used. All samples were confirmed to be both genetically and phenotypically sensitive to all first line anti-TB drugs. Additionally, all strains were genetically susceptible to second-line antituberculosis drugs (Figure 1).
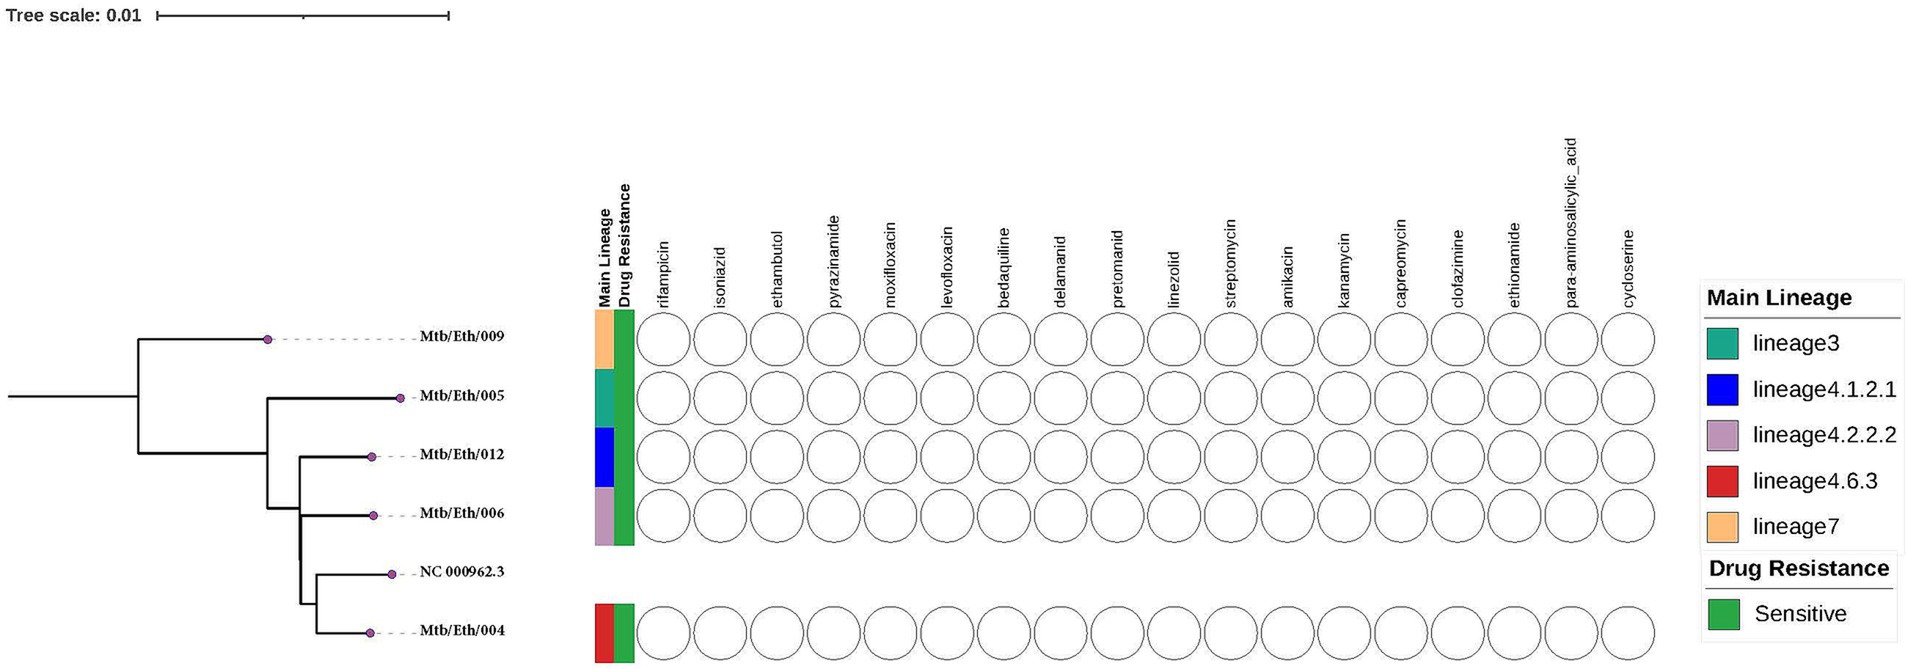
Figure 1. The whole-genome phylogeny and phenotypic drug sensitivity/resistance profiles of the Mycobacterium tuberculosis isolates in this study were assessed against standard first and second line anti-TB drugs. The phylogenetic tree was constructed using the H37Rv reference genome (NC 000962.3) obtained from NCBI.
A strong correlation was observed between CFU/mL and OD600 measurements for all clinical isolates and H37Rv Mtb samples, with an R2 value of 0.9644 (Figure 2A). The correlation between CFU/mL and the McFarland standard, and OD600 and the McFarland standard were also strong across all samples (R2 = 0.871 and 0.7452, respectively) (Figures 2B,C).
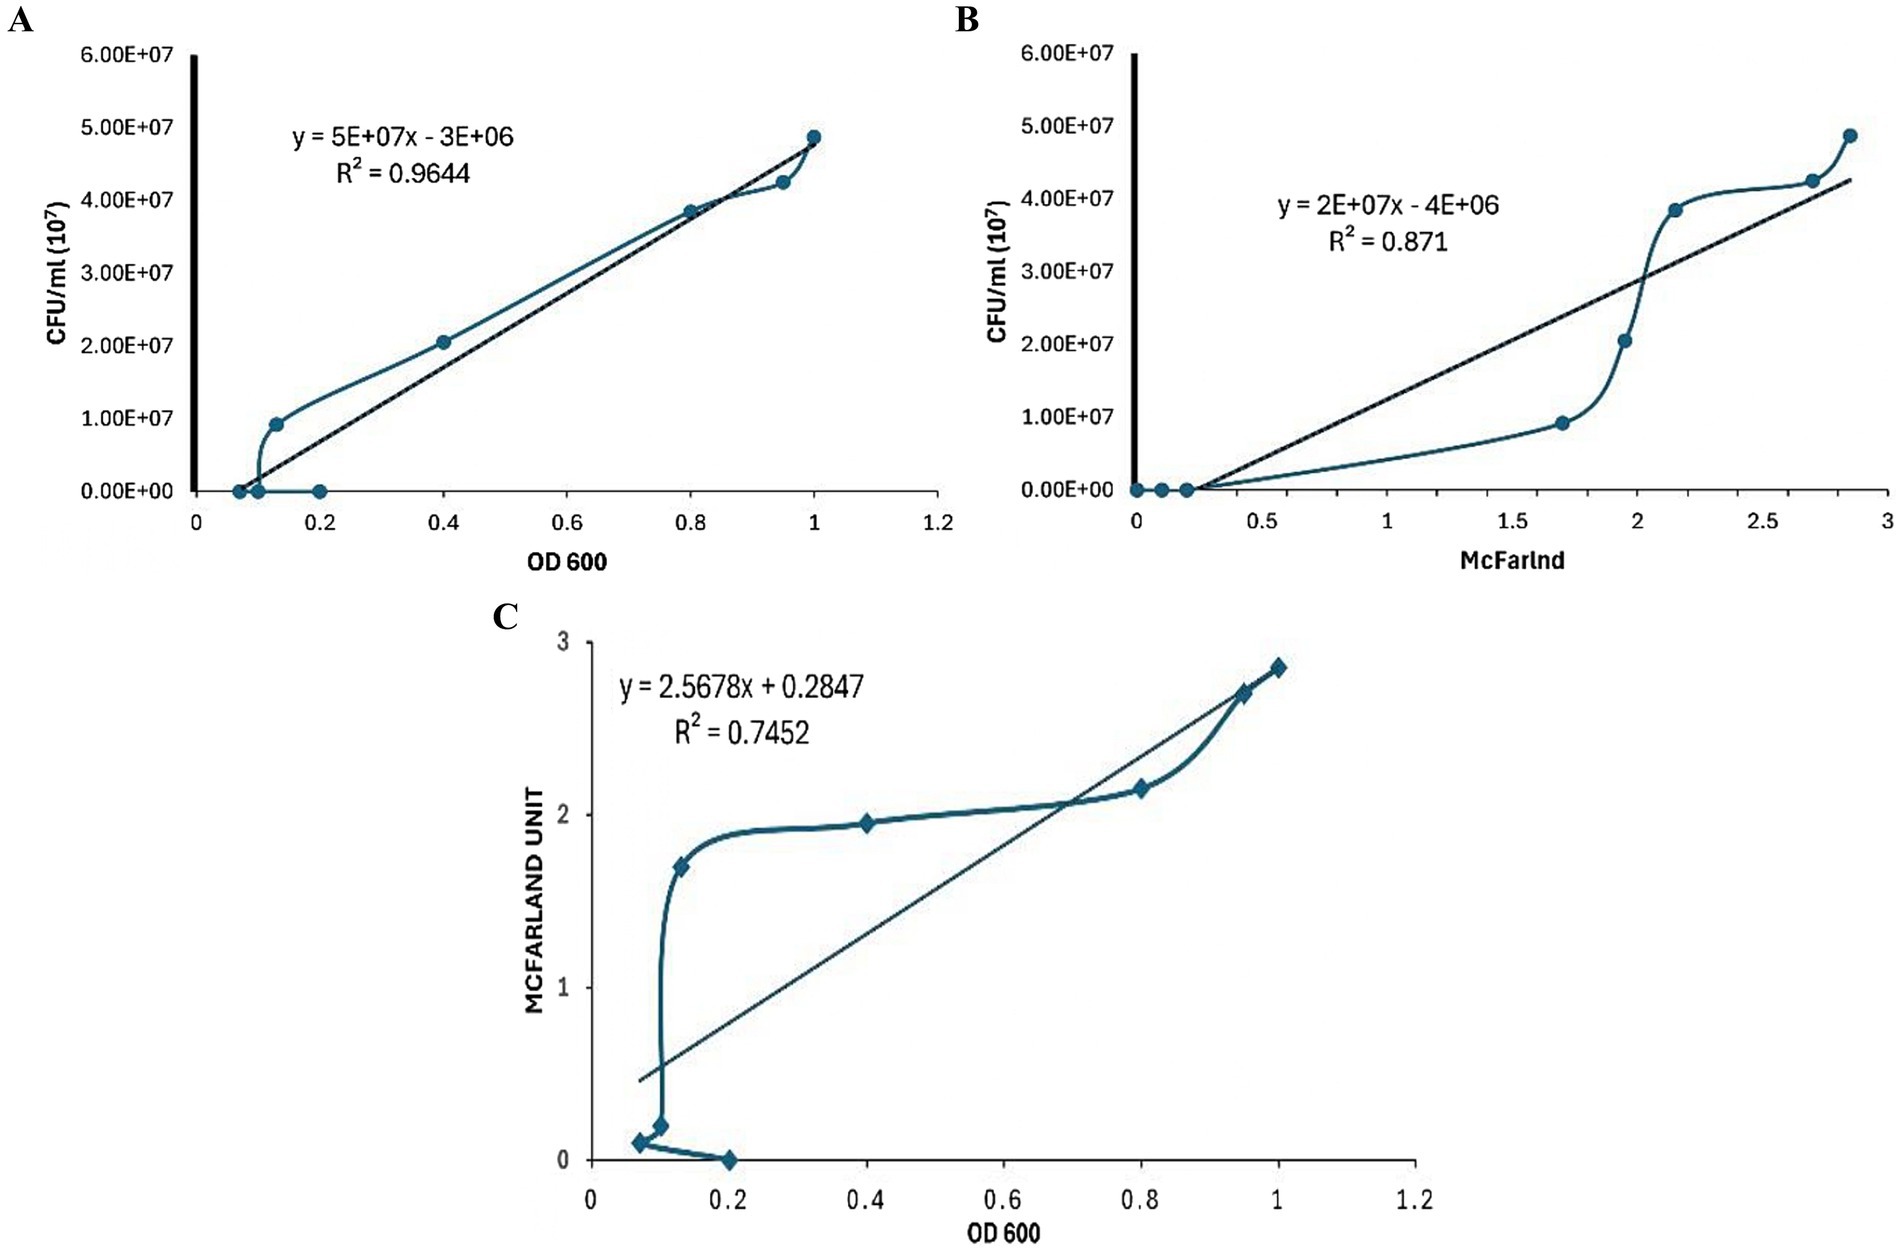
Figure 2. Comparison of the correlation between various Mycobacterium tuberculosis concentration methods. (A) Correlation between colony-forming units (CFU) per mL and optical density at 600 nm (OD600). (B) Correlation between colony-forming units (CFU) per mL and McFarland standard. (C) Correlation between McFarland standard and optical density at 600 nm (OD600).
Mycobacterium tuberculosis strains from various Mtb lineages were cultured in liquid 7H9 Middlebrook broth to assess growth rates across lineages prevalent in Ethiopia. All Mtb strains showed growth from 6 day onwards (Figure 3). Sub-lineage 4.1.2.1 and lineage 7 began growing on the 9th day, sub-lineage 4.1.2.1 displaying rapid kinetics (exponential phase) over the following 6 days (Figure 3). All Mtb strains started to subside their growth and entered the stationary phase since day 15 (Figure 3). A comparison of Cmax (the maximum point on the growth curve) among different sub-lineages indicate that sub-lineage 4.1.2. 1exhibited a higher Cmax, or greater bacterial concentration, than sub-lineage 4.2.2.2, lineage 7, lineage 3, sub-lineage 4.6.3, and H37Rv.
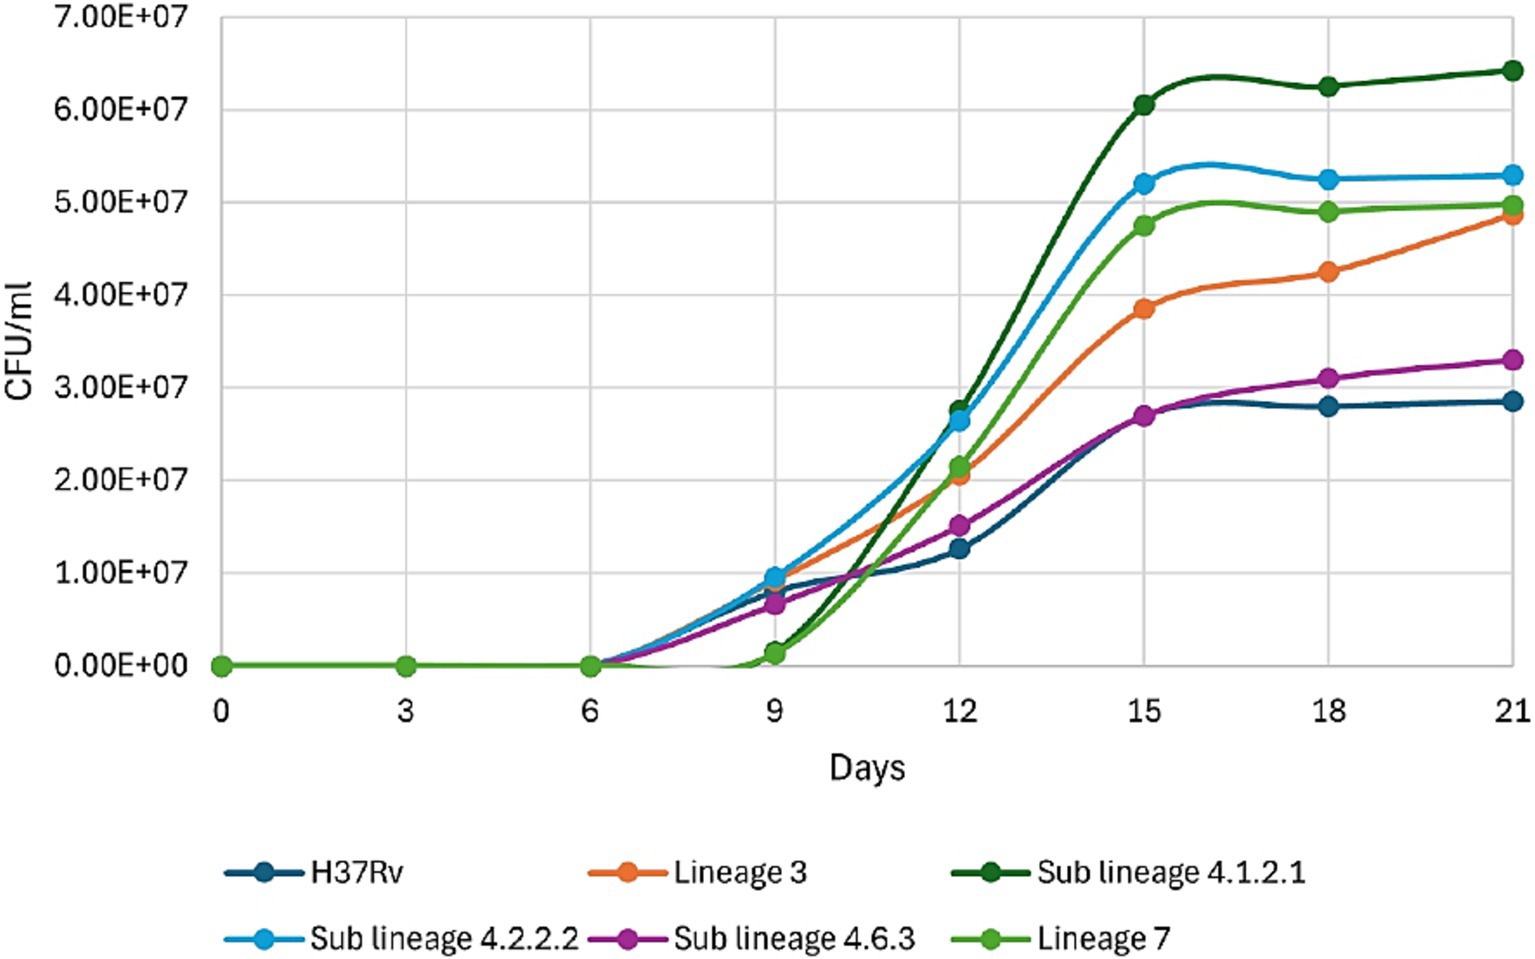
Figure 3. Growth kinetics of different clinical strains of Mycobacterium tuberculosis prevalent in Ethiopia, along with H37Rv (ATCC 27294).
Sub-lineage 4.2.2.2 exhibited a significant difference in growth rate or CFU compared to all other study strains from day 9 or day 12 until the end of the study (Table 1). Similarly, sub-lineage 4.1.2.1 showed a significant difference in growth rate or CFU compared to H37Rv, sub-lineage 4.2.2.2, and sub-lineage 4.6.3 starting from day 9 onward (Table 2). Other sub-lineages demonstrated inconsistent but significant differences in growth rate or CFU when compared to each other on various study days. No significant differences in growth rate or CFU was observed between H37Rv and sub-lineage 4.6.3 throughout the study period (Table 1).
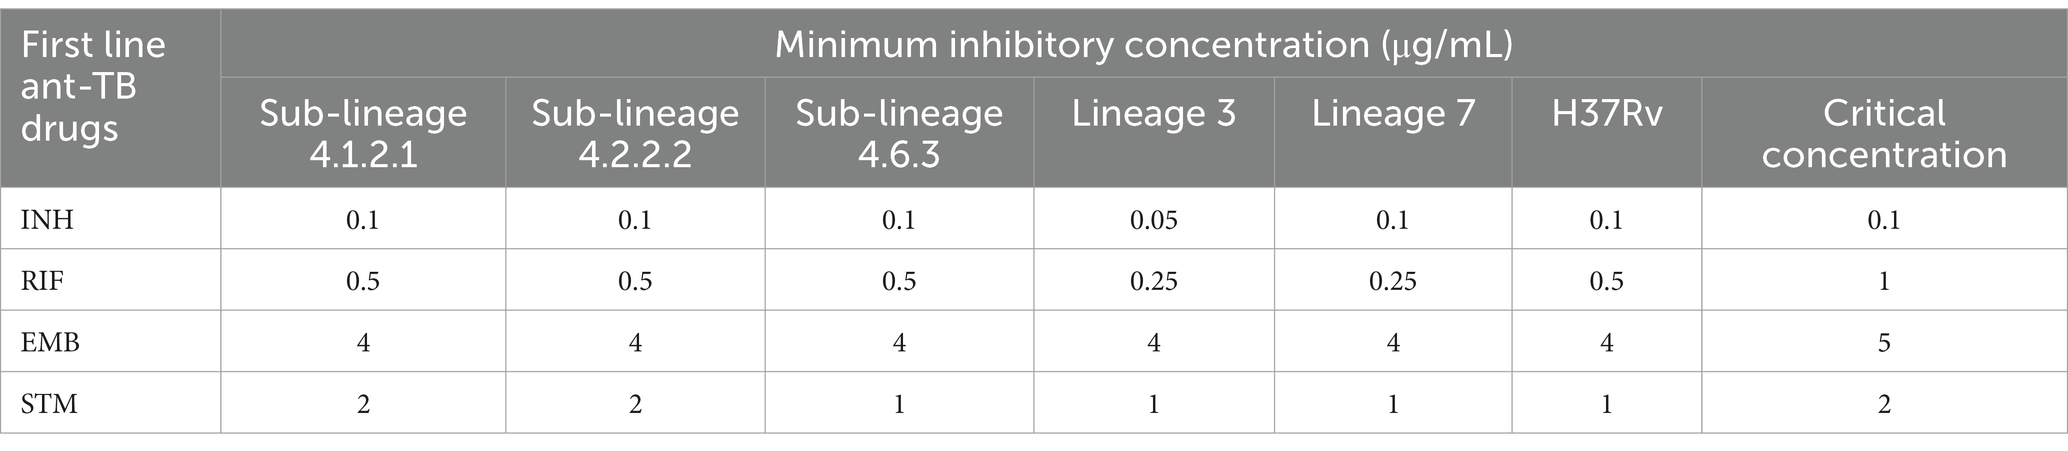
Table 1. Minimum inhibitory concentration for the first-line anti-TB drugs across all Mycobacterium tuberculosis strains, along with critical concentration for the microdilution broth method.
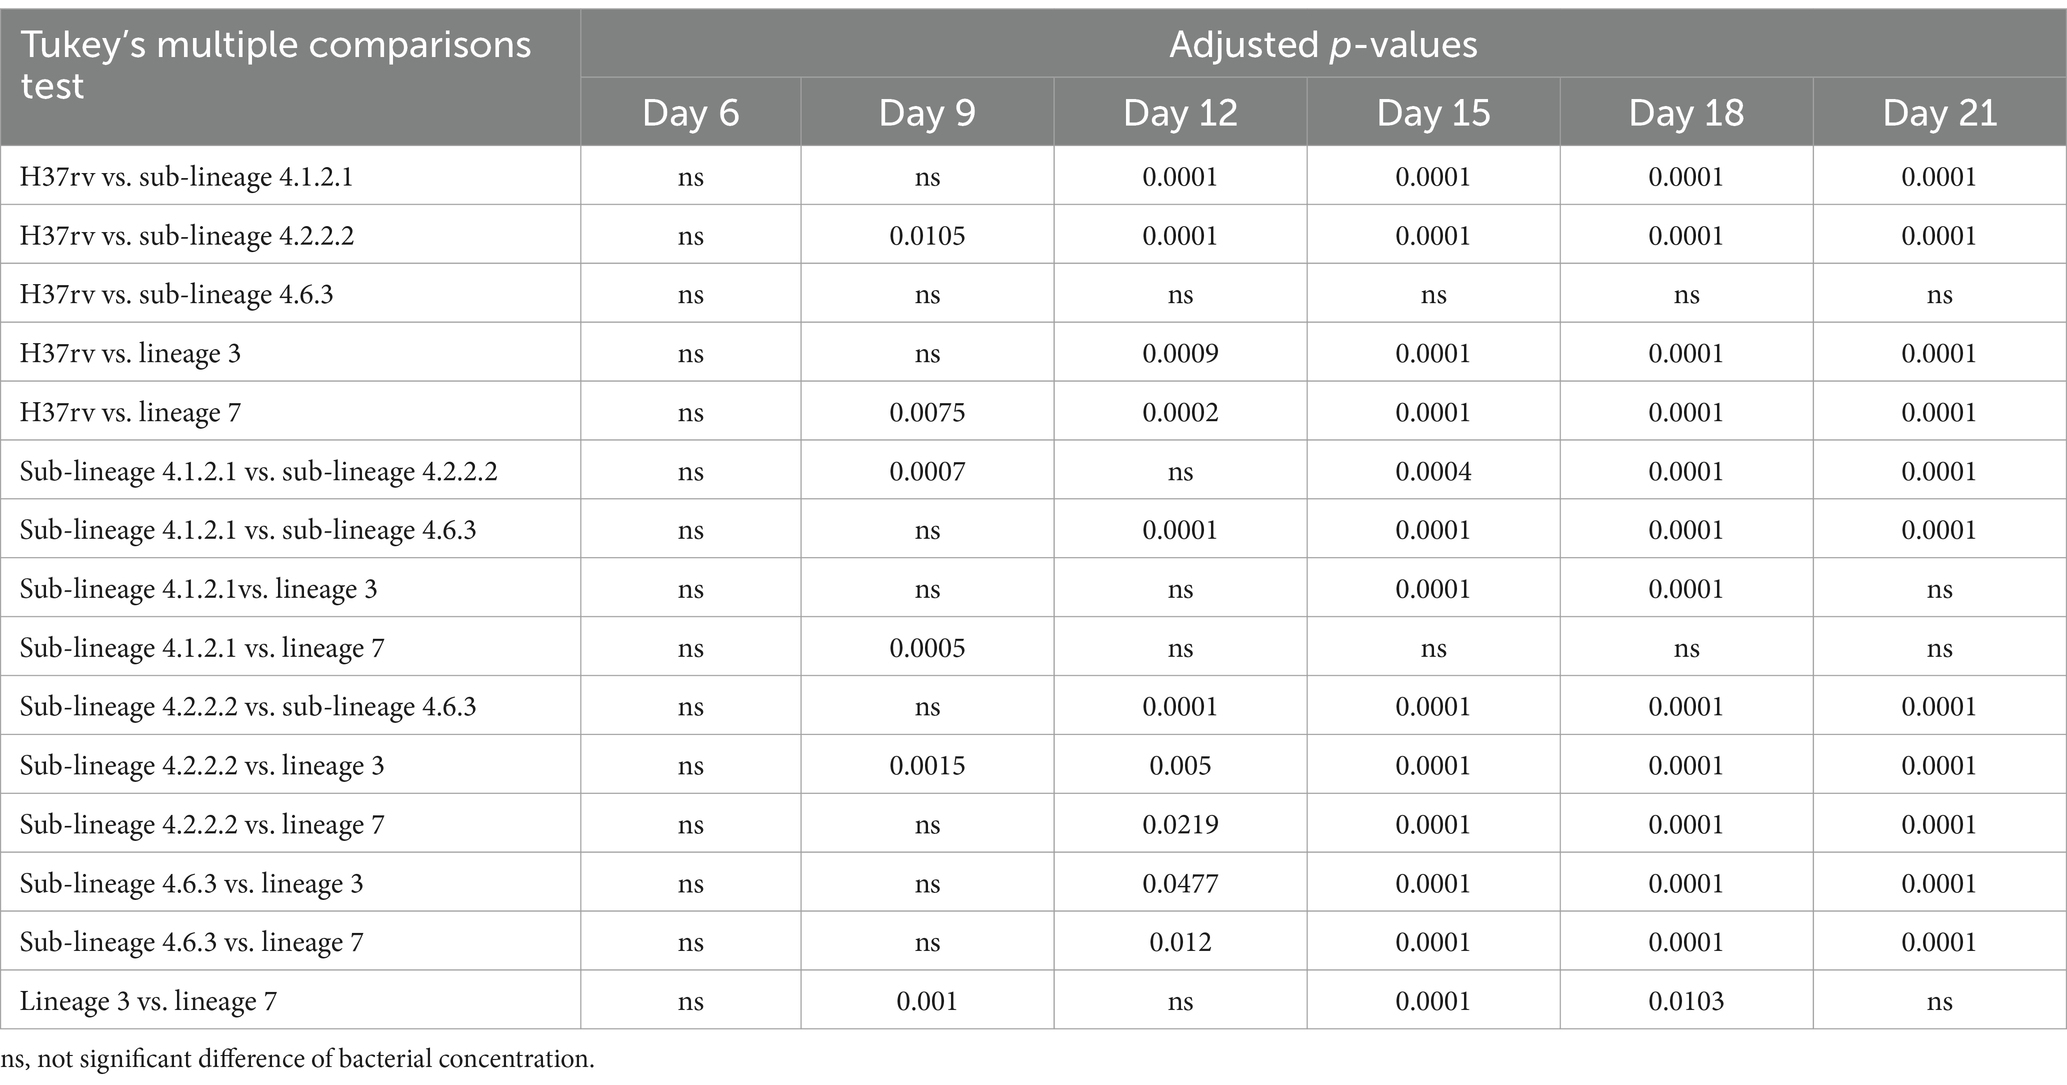
Table 2. Tukey’s multiple comparisons test for different Mycobacterium tuberculosis sub-lineages growth, as measured by CFU, over study period.
The study measured the MIC for first-line anti-TB drugs across all strains using microdilution broth method. Although all strains were susceptible to these drugs, MIC values varied between strains (Table 1). Sub-lineages 4.1.2.1 and 4.2.2.2 exhibited MIC values that matched the critical concentration for first-line anti-TB drugs, except for RIF, where the MIC was half of the critical concentration. In contrast, lineages 3 and 7 exhibited increased sensitivity to RIF and STM, needing only half of the standard critical concentration established for the microdilution broth method. Additionally, lineage 3 showed increased sensitivity to INH, requiring just half of the conventional critical concentration set for the same method.
We studied the growth kinetics of various Mtb strains in liquid 7H9 Middlebrook broth. Our findings reveal distinct growth patterns. All strains began growing on day 6, with sub-lineage 4.1.2.1 showing rapid exponential growth from day 9. This phase lasted about 6 days, after which all strains entered the stationary phase around day 15, likely due to a common growth-limiting factor like nutrient depletion. Sub-lineage 4.1.2.1 reached the highest bacterial concentration (Cmax), surpassing sub-lineage 4.2.2.2, lineage 7, lineage 3, sub-lineage 4.6.3, and the reference H37Rv strain. This suggests that sub-lineage 4.1.2.1 may have unique genetic or physiological traits for more efficient growth, and these differences in Cmax could indicate varying abilities to adapt to environmental stress, such as nutrient availability or immune response factors in a host setting (Mashabela et al., 2019; Kanabalan et al., 2021; Saelens et al., 2019).
After entering the host’s airway, Mtb is taken up by alveolar macrophages, triggering an inflammatory response that promotes granuloma formation. This structure forms as immune cells are recruited to the infection sites, confining bacterial growth within macrophage phagosomes. Mtb’s capacity to survive and multiply within macrophages influences the quantity of bacteria released in respiratory droplets, enhancing its transmission potential and contributing to bacterial hypervirulence (Aiewsakun et al., 2021). The observed growth patterns in sub-lineages 4.2.2.2 and 4.1.2.1 particularly their high Cmax, rapid progression into exponential growth, or elevated bacillary concentrations may impact their higher virulence and wider transmission when compared to other Mtb sub-lineages. Sub-lineage 4.1.2.1 (Haarlem), is known for its significant global distribution (Negrete-Paz et al., 2021) and representing about 10% of Mtb cases in Ethiopia (Mekonnen et al., 2019), suggesting a competitive advantage in various host environments, potentially enhancing this sub-lineage’s ability to spread across populations. Conversely, sub-lineage 4.2.2.2 shows a more restricted geographical prevalence, notably in Ethiopia, where it accounts for approximately 15% of cases. This sub-lineage demonstrates heightened virulence and a propensity for drug resistance, which may be associated with genetic variations that might impact macrophage infection pathways and immune evasion mechanisms (Getahun et al., 2024).
Faster-growing strains could potentially lead to more aggressive infections, and understanding these differences at the growth kinetics level could inform tailored treatment approaches (Iacob and Iacob, 2013). Further research is needed to investigate the underlying genetic factors driving these variations in growth kinetics and their impact on disease progression and treatment outcomes in different Mtb lineages.
The multiple comparison study reveals significant growth differences among various Mtb sub-lineages, with sub-lineage 4.2.2.2 showing a notable growth advantage compared to all other strains from day 9 or day 12 until day 21. Similarly, sub-lineage 4.1.2.1 exhibited significantly higher growth rates or CFU counts when compared to H37Rv, sub-lineage 4.2.2.2, and sub-lineage 4.6.3 from day 9 onwards. These consistent growth advantages, and higher bacterial load suggest that sub-lineages 4.2.2.2 and 4.1.2.1 may possess adaptive traits that enhance their survival and replication, potentially increasing their pathogenicity, causing severe disease or resistance to host defenses and antibiotics (Thwaites et al., 2008; Tram et al., 2018).
In contrast, the other sub-lineages demonstrated inconsistent but significant differences in growth rates or CFU counts on various days, indicating that they may lack the same level of adaptability or resilience. No significant differences were found between H37Rv and sub-lineage 4.6.3, suggesting a closer relationship between these strains as observed in the phylogenetic tree (Figure 1). Overall, these findings emphasize the diversity in growth patterns among Mtb sub-lineages, which could have important implications for TB treatment and disease progression. Further research is needed to explore the genetic and phenotypic factors driving these differences.
The study emphasizes the differences in MIC values for first-line anti-TB drugs (RIF, INH, STM, and EMB) among various Mtb strains from lineages/sub-lineages commonly found in Ethiopia, even though all strains are susceptible to these drugs. Using the microdilution broth method, we observed distinct differences in drug susceptibility between various Mtb lineages. Sub-lineages 4.1.2.1 and 4.2.2.2 exhibited MIC values that were consistent with the critical concentrations set for first-line anti-TB drugs (except RIF), indicating a standard level of drug susceptibility in these sub-lineages. This suggests that these sub-lineages respond to treatment in line with the expected drug efficacy thresholds established by WHO guidelines.
In contrast, lineages 3 and 7 demonstrated significantly increased sensitivity to RIF and STM, requiring only half of the standard critical concentration for inhibition. This heightened sensitivity suggests that these lineages might respond more effectively to lower doses of these anti-TB drugs compared to other Mtb strains. Furthermore, lineage 3 also showed increased sensitivity to INH, with MIC values at half of the conventional critical concentration.
Lineage 3 has a prevalence of 21% in Ethiopia, with a 24.1% resistance rate to isoniazid. In contrast, lineage 4 has a prevalence of approximately 70% and a higher isoniazid resistance rate of 74.1% (Getahun et al., 2024). Among the sub-lineages, L4.2.2.2 is the most prevalent drug-resistant group, responsible for 50% of resistant cases and 34.5% of MDR+ cases (Mekonnen et al., 2023). Additionally, our findings indicate that lineage 3 has lower growth kinetics, bacillary load, and MIC values compared to sub-lineages 4.2.2.2, 4.1.2.1, and L7. The increased sensitivity of L3 to INH, STM and RIF may be influenced by either its lower bacillary load or the specific type of L3 strain circulating and examined in this study.
These findings underscore the importance of considering lineage-specific drug responses in TB treatment. Administering the same dose of antituberculosis drugs across different Mtb lineages may have significant implications for treatment effectiveness and resistance development (Chae and Shin, 2018). Different Mtb lineages exhibit distinct growth rates, virulence factors, and drug susceptibility profiles. For instance, faster-growing or more virulent lineages, such as those with high bacillary loads and rapid replication, may require higher or more frequent doses for effective clearance, as they might respond to drugs differently or evade host immune responses more efficiently. Standard dosing may be insufficient for such lineages, potentially leading to suboptimal drug exposure, which can promote resistance development and reduce treatment success.
It was reported that highly spreading and drug resistance, MDR, and XDR TB strains present in certain regions are linked to specific Mtb lineages, often confined to those areas (Chae and Shin, 2018; Malm et al., 2017). For example, lineage 4.2.2.2, which is geographically restricted, has demonstrated a heightened likelihood of drug resistance (Mekonnen et al., 2023; Getahun et al., 2024) and may not respond optimally to standard dosing due to its genetic adaptations. The one-size-fits-all dosing strategy might therefore undermine treatment efficacy in specific lineages, especially those more likely to develop resistance. Understanding host pathogen gene interactions and tailoring drug regimens to the characteristics of specific Mtb lineages could improve patient outcomes, slow resistance spread, and ensure the prolonged efficacy of current therapies.
While determining growth kinetics and drug sensitivity analyses of various Mtb lineages, the number of isolates considered for this analysis was limited. Thus, future research on larger sample set from each lineage would therefore be invaluable for confirming these findings on a broader scale. Another limitation of this study lies in the potential discrepancies between in vitro and in vivo conditions, which may affect the interpretation of growth kinetics and drug susceptibility data. In vitro models, while valuable for studying Mtb growth characteristics and drug responses, lack the complex interactions and immune pressures present in a host environment. For instance, in vivo conditions expose Mtb to immune responses, oxygen gradients, and nutrient limitations, which can alter bacterial metabolism and growth rates. These differences mean that findings from in vitro studies might not fully reflect the pathogen’s behavior within the human body, potentially impacting our understanding of how quickly certain lineages replicate or respond to drugs in real infections.
Furthermore, drug efficacy observed in vitro may not directly translate to in vivo outcomes, as host factors such as drug absorption, distribution, and immune-mediated effects play crucial roles in treatment effectiveness. These limitations highlight the need for caution when extrapolating in vitro findings to clinical scenarios and underscore the importance of complementing in vitro data with in vivo or clinical studies to better understand Mtb lineage-specific growth patterns and drug susceptibility. Moreover, while the study focused on first-line anti-TB drugs, it did not evaluate the effects of second-line or newer TB treatments. Understanding lineage-specific responses to a broader range of drugs could provide a more comprehensive view of treatment options. This study also did not explore the genetic mechanisms underlying the observed differences in growth kinetics and drug sensitivity between the various Mtb lineages. Future studies are warranted to further validate our observations, while addressing these limitations.
In conclusion, the findings from this study hold significant practical implications for improving TB treatment strategies in Ethiopia and comparable regions. By highlighting the growth characteristics, drug resistance tendencies, and geographic distribution of specific Mtb sub-lineages, our research suggests that tailored treatment approaches could improve therapeutic outcomes and mitigate the spread of drug-resistant strains. For example, considering lineage-specific drug dosing or developing diagnostic tools that quickly identify high-risk sub-lineages could allow for more targeted interventions.
To build on these findings, future research should include in vivo studies to validate the clinical relevance of these lineage-specific growth and drug resistance patterns. Additionally, large-scale epidemiological studies could further assess the distribution and transmission dynamics of these sub-lineages, while pharmacokinetic and pharmacodynamic studies might determine the most effective dosing strategies for each lineage. Ultimately, integrating these findings into public health policy and clinical practice could improve TB control efforts, particularly in areas where drug-resistant and virulent Mtb lineages are prevalent.
The whole genome data from this study have been submitted to the NCBI repository under BioProject ID PRJNA1201357.
TGH: Conceptualization, Data curation, Formal analysis, Funding acquisition, Investigation, Methodology, Project administration, Resources, Software, Supervision, Validation, Visualization, Writing – original draft, Writing – review & editing. MTi: Data curation, Formal analysis, Investigation, Methodology, Validation, Writing – review & editing. AAt: Data curation, Formal analysis, Investigation, Methodology, Validation, Writing – review & editing. TG: Methodology, Supervision, Writing – review & editing. TTG: Data curation, Formal analysis, Writing – review & editing. MTo: Investigation, Writing – review & editing. AAy: Data curation, Formal analysis, Visualization, Writing – review & editing. SS: Funding acquisition, Writing – review & editing. WS: Supervision, Writing – review & editing. KB: Funding acquisition, Supervision, Writing – review & editing. LW: Supervision, Writing – review & editing. YH: Supervision, Writing – review & editing. EE: Supervision, Writing – review & editing.
The author(s) declare that financial support was received for the research, authorship, and/or publication of this article. This study was funded by Armauer Hansen Research Institute (AHRI).
The authors thank the study personnel from the TBGene project. We also extend our heartfelt gratitude to Addis Ababa University and AHRI.
The authors declare that the research was conducted in the absence of any commercial or financial relationships that could be construed as a potential conflict of interest.
The authors declare that no Gen AI was used in the creation of this manuscript.
All claims expressed in this article are solely those of the authors and do not necessarily represent those of their affiliated organizations, or those of the publisher, the editors and the reviewers. Any product that may be evaluated in this article, or claim that may be made by its manufacturer, is not guaranteed or endorsed by the publisher.
Aiewsakun, P., Prombutara, P., Siregar, T. A. P., Laopanupong, T., Kanjanasirirat, P., Khumpanied, T., et al. (2021). Transcriptional response to the host cell environment of a multidrug-resistant Mycobacterium tuberculosis clonal outbreak Beijing strain reveals its pathogenic features. Sci. Rep. 11:3199. doi: 10.1038/s41598-021-82905-x
Bagcchi, S. (2023). WHO’s global tuberculosis report 2022. Lancet Microbe 4:e20. doi: 10.1016/S2666-5247(22)00359-7
Bai, W., and Ameyaw, E. K. (2024). Global, regional and national trends in tuberculosis incidence and main risk factors: a study using data from 2000 to 2021. BMC Public Health 24:12. doi: 10.1186/s12889-023-17495-6
Brosch, R., Gordon, S. V., Marmiesse, M., Brodin, P., Buchrieser, C., Eiglmeier, K., et al. (2002). A new evolutionary scenario for the Mycobacterium tuberculosis complex. Proc. Natl. Acad. Sci. U.S.A. 99, 3684–3689. doi: 10.1073/pnas.052548299
Chae, H., and Shin, S. J. (2018). Importance of differential identification of Mycobacterium tuberculosis strains for understanding differences in their prevalence, treatment efficacy, and vaccine development. J. Microbiol. 56, 300–311. doi: 10.1007/s12275-018-8041-3
Coscolla, M., and Gagneux, S. (2010). Does M. tuberculosis genomic diversity explain disease diversity? Drug Discov. Today Dis. Mech. 7, e43–e59. doi: 10.1016/j.ddmec.2010.09.004
Coscolla, M., and Gagneux, S. (2014). Consequences of genomic diversity in Mycobacterium tuberculosis. Semin. Immunol. 26, 431–444. doi: 10.1016/j.smim.2014.09.012
Coscolla, M., Gagneux, S., Menardo, F., Loiseau, C., Ruiz-Rodriguez, P., Borrell, S., et al. (2021). Phylogenomics of Mycobacterium africanum reveals a new lineage and a complex evolutionary history. Microb. Genom. 7:000477. doi: 10.1099/mgen.0.000477
Daniyarov, A., Molkenov, A., Rakhimova, S., Akhmetova, A., Nurkina, Z., Yerezhepov, D., et al. (2020). Whole genome sequence data of Mycobacterium tuberculosis XDR strain, isolated from patient in Kazakhstan. Data Brief 33:106416. doi: 10.1016/j.dib.2020.106416
Getahun, M., Beyene, D., Mollalign, H., Diriba, G., Tesfaye, E., Yenew, B., et al. (2024). Population structure and spatial distribution of Mycobacterium tuberculosis in Ethiopia. Sci. Rep. 14:10455. doi: 10.1038/s41598-024-59435-3
Hailu, E., Cantillon, D., Madrazo, C., Rose, G., Wheeler, P. R., Golby, P., et al. (2023). Lack of methoxy-mycolates characterizes the geographically restricted lineage 7 of Mycobacterium tuberculosis complex. Microb. Genom. 9:mgen001011. doi: 10.1099/mgen.0.001011
Iacob, S. A., and Iacob, D. G. (2013). “Neurotuberculosis and HIV infection” in Tuberculosis-current issues in diagnosis and management (London: IntechOpen).
Kanabalan, R. D., Lee, L. J., Lee, T. Y., Chong, P. P., Hassan, L., Ismail, R., et al. (2021). Human tuberculosis and Mycobacterium tuberculosis complex: a review on genetic diversity, pathogenesis and omics approaches in host biomarkers discovery. Microbiol. Res. 246:126674. doi: 10.1016/j.micres.2020.126674
Li, H. (2013). Aligning sequence reads, clone sequences and assembly contigs with BWA-MEM. arXiv. Available at: https://doi.org/10.48550/arXiv.1303.3997. [Epub ahead of preprint]
Malm, S., Linguissi, L. S. G., Tekwu, E. M., Vouvoungui, J. C., Kohl, T. A., Beckert, P., et al. (2017). New Mycobacterium tuberculosis complex sublineage, Brazzaville, Congo. Emerg. Infect. Dis. 23, 423–429. doi: 10.3201/eid2303.160679
Mashabela, G. T., De Wet, T. J., and Warner, D. F. (2019). Mycobacterium tuberculosis metabolism. Microbiol. Spectr. 7. doi: 10.1128/microbiolspec.GPP3-0067-2019
Mekonnen, D., Derbie, A., Chanie, A., Shumet, A., Biadglegn, F., Kassahun, Y., et al. (2019). Molecular epidemiology of M. tuberculosis in Ethiopia: a systematic review and meta-analysis. Tuberculosis 118:101858. doi: 10.1016/j.tube.2019.101858
Mekonnen, D., Munshea, A., Nibret, E., Adnew, B., Getachew, H., Kebede, A., et al. (2023). Mycobacterium tuberculosis sub-lineage 4.2. 2/SIT149 as dominant drug-resistant clade in Northwest Ethiopia 2020–2022: in-silico whole-genome sequence analysis. Infect. Drug Resist. 16, 6859–6870. doi: 10.2147/IDR.S429001
Moopanar, K., and Mvubu, N. (2020). Lineage-specific differences in lipid metabolism and its impact on clinical strains of Mycobacterium tuberculosis. Microb. Pathog. 146:104250. doi: 10.1016/j.micpath.2020.104250
Negrete-Paz, A. M., Vázquez-Marrufo, G., and Vázquez-Garcidueñas, M. S. (2021). Whole-genome comparative analysis at the lineage/sublineage level discloses relationships between Mycobacterium tuberculosis genotype and clinical phenotype. PeerJ. 9:e12128. doi: 10.7717/peerj.12128
Ngabonziza, J. C. S., Loiseau, C., Marceau, M., Jouet, A., Menardo, F., Tzfadia, O., et al. (2020). A sister lineage of the Mycobacterium tuberculosis complex discovered in the African Great Lakes region. Nat. Commun. 11:2917. doi: 10.1038/s41467-020-16626-6
Peñuelas-Urquides, K., Villarreal-Treviño, L., Silva-Ramírez, B., Rivadeneyra-Espinoza, L., Said-Fernández, S., Bermúdez de León, M., et al. (2013). Measuring of Mycobacterium tuberculosis growth: a correlation of the optical measurements with colony forming units. Braz. J. Microbiol. 44, 287–290. doi: 10.1590/S1517-83822013000100042
Phelan, J. E., Lim, D. R., Mitarai, S., Sessions, P. F. D., Tujan, M. A. A., Reyes, L. T., et al. (2019). Mycobacterium tuberculosis whole genome sequencing provides insights into the Manila strain and drug-resistance mutations in the Philippines. Sci. Rep. 9:9305. doi: 10.1038/s41598-019-45566-5
Saelens, J. W., Viswanathan, G., and Tobin, D. M. (2019). Mycobacterial evolution intersects with host tolerance. Front. Immunol. 10:528. doi: 10.3389/fimmu.2019.00528
Santos, N. C. S., Scodro, R. B. L., Leal, D. C., do Prado, S. M., Micheletti, D. F., Sampiron, E. G., et al. (2020). Determination of minimum bactericidal concentration, in single or combination drugs, against Mycobacterium tuberculosis. Future Microbiol. 15, 107–114. doi: 10.2217/fmb-2019-0050
Sarkar, R., Lenders, L., Wilkinson, K. A., Wilkinson, R. J., and Nicol, M. P. (2012). Modern lineages of Mycobacterium tuberculosis exhibit lineage-specific patterns of growth and cytokine induction in human monocyte-derived macrophages. PLoS One 7:e43170. doi: 10.1371/journal.pone.0043170
Schön, T., Werngren, J., Machado, D., Borroni, E., Wijkander, M., Lina, G., et al. (2021). Multicentre testing of the EUCAST broth microdilution reference method for MIC determination on Mycobacterium tuberculosis. Clin. Microbiol. Infect. 27:288.e1. doi: 10.1016/j.cmi.2020.10.019
Schönfeld, N., Bergmann, T., Vesenbeckh, S., Mauch, S., Bettermann, H., Bauer, G., et al. (2012). Minimal inhibitory concentrations of first-line drugs of multidrug-resistant tuberculosis isolates. Lung India 29, 309–312. doi: 10.4103/0970-2113.102794
Thwaites, G., Caws, M., Chau, T. T., D’Sa, A., Lan, N. T., Huyen, M. N., et al. (2008). Relationship between Mycobacterium tuberculosis genotype and the clinical phenotype of pulmonary and meningeal tuberculosis. J. Clin. Microbiol. 46, 1363–1368. doi: 10.1128/JCM.02180-07
Tiemersma, E. W., van der Werf, M. J., Borgdorff, M. W., Williams, B. G., and Nagelkerke, N. J. D. (2011). Natural history of tuberculosis: duration and fatality of untreated pulmonary tuberculosis in HIV negative patients: a systematic review. PLoS One 6:e17601. doi: 10.1371/journal.pone.0017601
Tram, T. T. B., Nhung, H. N., Vijay, S., Hai, H. T., Thu, D. D. A., Ha, V. T. N., et al. (2018). Virulence of Mycobacterium tuberculosis clinical isolates is associated with sputum pre-treatment bacterial load, lineage, survival in macrophages, and cytokine response. Front. Cell. Infect. Microbiol. 8:417. doi: 10.3389/fcimb.2018.00417
Verboven, L., Phelan, J., Heupink, T. H., and Van Rie, A. (2022). TBProfiler for automated calling of the association with drug resistance of variants in Mycobacterium tuberculosis. PLoS One 17:e0279644. doi: 10.1371/journal.pone.0279644
Wikler, M. A. (2006). Methods for dilution antimicrobial susceptibility tests for bacteria that grow aerobically: approved standard. Wayne, PA: Clinical and Laboratory Standards Institute, 26.
Yang, X., Liu, D., Liu, F., Wu, J., Zou, J., Xiao, X., et al. (2013). HTQC: a fast quality control toolkit for Illumina sequencing data. BMC Bioinformatics 14:33. doi: 10.1186/1471-2105-14-33
Keywords: Mycobacterium tuberculosis , sub-lineages, growth kinetics, minimum inhibitory concentrations, optimizing TB treatment
Citation: Hailemariam TG, Tilahun M, Atnafu A, Gelanew T, Gebresilase TT, Tola MA, Ayele A, Siraj SM, Shibeshi W, Bobosha K, Wassie L, Hirutu Y and Engidawork E (2025) Comparative growth kinetics and drug susceptibility of Mycobacterium tuberculosis lineages prevalent in Ethiopia: implications for tuberculosis treatment and management. Front. Microbiol. 15:1512580. doi: 10.3389/fmicb.2024.1512580
Edited by:
Santi M. Mandal, Indian Institute of Technology Kharagpur, IndiaReviewed by:
Raquel Muñiz-Salazar, Autonomous University of Baja California, MexicoCopyright © 2025 Hailemariam, Tilahun, Atnafu, Gelanew, Gebresilase, Tola, Ayele, Siraj, Shibeshi, Bobosha, Wassie, Hirutu and Engidawork. This is an open-access article distributed under the terms of the Creative Commons Attribution License (CC BY). The use, distribution or reproduction in other forums is permitted, provided the original author(s) and the copyright owner(s) are credited and that the original publication in this journal is cited, in accordance with accepted academic practice. No use, distribution or reproduction is permitted which does not comply with these terms.
*Correspondence: Tesfaye Gebreyohannis Hailemariam, dGVzZmF5ZXBoYXJtQGdtYWlsLmNvbQ==
Disclaimer: All claims expressed in this article are solely those of the authors and do not necessarily represent those of their affiliated organizations, or those of the publisher, the editors and the reviewers. Any product that may be evaluated in this article or claim that may be made by its manufacturer is not guaranteed or endorsed by the publisher.
Research integrity at Frontiers
Learn more about the work of our research integrity team to safeguard the quality of each article we publish.