- 1Key Laboratory of Ecological Adaptive Evolution and Conservation on Animals-Plants in Southwest Mountain Ecosystem of Yunnan Province Higher Institutes College, Yunnan Normal University, Kunming, China
- 2School of Life Sciences, Yunnan Normal University, Kunming, China
- 3Key Laboratory of Yunnan Province for Biomass Energy and Environment Biotechnology, Yunnan Normal University, Kunming, China
Animals’ digestion, energy metabolism, and immunity are significantly influenced by interactions between the gut microbiota and the intestinal environment of the host. Previous studies have shown that gut microbiota of Eothenomys miletus can respond to environmental changes, high fiber or fat foods. But how E. miletus in high-altitude adapt to their environment through gut microbiota and physiological changes during winter food shortages period was unclear. In the present study, we evaluated the altitude differences in gut microbiota and their interactions with physiology in terms of body mass regulation in order to study the adaptation of the gut microbiota and physiological indicators of the E. miletus under food restriction settings. E. miletus were collected for this study from Jingdong County (JD, low-altitude) and Xianggelila County (XGLL, high-altitude) in Yunnan Province, China, and split into three groups: control group, food-restricted feeding group for 7 days, and re-feeding group was offered a standard diet for 14 days. 16S rRNA gene sequencing and physiological methods were used to analyze the abundance and community structure of gut microbiota, as well as physiological indicators of each group in E. miletus. The results showed that while the RMR changed more during the period of food restriction, the body mass and major organ masses of E. miletus from high-altitude changed less. After food restriction, RMR in XGLL decreased by 25.25%, while that of in JD decreased by 16.54%. E. miletus from the XGLL had gut bacteria that were more abundant in Firmicutes and had fewer OTUs, and the microbiota had a closer interaction with physiological indicators. Moreover, the gut microbiota adapted to the food shortage environment by enhancing the genera of Bacterroides, Ruminococcus, Turicibacter, and Treponema to improve the utilization of nutrient resources. The interactions between microbial species and the equilibrium of energy homeostasis were further impacted by alterations in physiological indicators and microbial community structure. These variations were important for E. miletus to adapt to the fluctuations and changes of food resources in high-altitude region, which also expand our knowledge of organismal adaptations and the mechanisms behind the interactions between gut bacteria and host physiology.
1 Introduction
Animal host’s gut often contains a range of distinct bacterial communities, each of which serves an essential purpose (Koch et al., 2012). Interaction between host’s intestinal environment and the gut microbiota influence their thermogenesis, immunity, and metabolism (Zhou et al., 2023). The gut community may alter as a result of high-altitude environmental factors (Wang et al., 2022). For example, mammals and humans who were exposed to high altitudes for extended periods showed a higher proportion and relative abundance of Firmicutes and Bacteroidetes (Geng et al., 2023). By comparing fecal samples from mice living at high and low altitudes, it discovered substantial differences in the number of genera linked with inflammation, gastrointestinal illnesses in the gut microbiota of individuals from high altitudes (Zhang et al., 2018). There are also studies that showed spatial–temporal change in gut microbial function was more profound in the low-altitude macaques than in the high-altitude population (Li et al., 2023).
Selection pressures in high-altitude environments drive adaptations in organismal phenotypes (Hao et al., 2019). According to studies, yaks’ hearts and lungs in high-altitude were comparatively larger than those of their close relatives who reside at low-altitude (Guan et al., 2017). Bactrian camels living in higher altitude had a faster respiratory rate and lower blood glucose levels (Lamo et al., 2020), and plateau pikas living at high altitude had a higher resting metabolic rate (RMR) relative to individuals living at low altitude (Zhu et al., 2022). These results suggested that the animals had evolved a special physiological adaptation strategy for living at high altitudes for an extended period of time.
Food amount affects the diversity and community structure of an animal’s gut microbiota, and different animals’ gut microbiota experienced distinct alterations in response to food constraint (Li et al., 2024; Zha et al., 2018). Research showed that food restriction can alter the abundance of Staphylococcus, Aerococcus, and Jeotgalicoccus in Brandt’s voles (Dai et al., 2023). Furthermore, food restriction significantly altered the physiological characteristics of rodents. Rodents under conditions of food restriction exhibited reducing of energy expenditure, and changed metabolic processes of carbohydrates, proteins or lipids, along with corresponding enzyme activity (Liang and Zhang, 2003). Body mass of Phodopus sungorus and other hamsters dropped dramatically when food was scarce. However, upon refeeding, both body mass and body fat returned to the control level, demonstrating obvious plasticity (Keen-Rhinehart and Bartness, 2008; Del Valle et al., 2006). Energy metabolism of E. miletus was also influenced by food resource changes. Food affected the it’s regulation to adapt to different survival situations by controlling its internal organ body mass, digestive tract shape, and thermogenic capability (Zhu et al., 2009; Zhu et al., 2011; Mu et al., 2014).
The Hengduan Mountains, a unique alpine valley region in China that is at the intersection of the Eastern Oceanic and Palaearctic zones, are one of the world’s hotspots for biodiversity (Gong et al., 2001). Significant height disparities, temperature fluctuations, evident seasonal changes in vegetation availability, and discernible differences in the physiological and ecological traits of small mammals at various elevations are all present (Zhu et al., 2010). E. miletus belongs to the genus Eothenomys, Rodentia, which is endemic to China and inherent to the Hengduan Mountains (Chen et al., 2022). It generally eats carbohydrate and sucrose and feeds on the fresh sap of plants and grass roots (Gong et al., 2021). Mammals’ gut microbiota composition and functional selection were strongly impacted by altitude. For instance, the diversity of gut microbiota in high-altitude habitats has changed significantly in animals like wild sable, pika, and rhesus macaques (Su et al., 2021; Li et al., 2018; Wu et al., 2020). According to our previous researches, alterations in the structure and diversity of the gut bacterial community in E. miletus favorably correlated with environmental changes (Yan et al., 2022). Furthermore, changes in gut community composition and diversity under high-fiber diets can provide a significant safeguard for adapting in winter (Zhang et al., 2023). However, it is unclear how E. miletus in higher-altitude adjust to the environment by modifying alterations in gut community and physiological indicators when faced with food restriction in winter. Thus, by employing 16S rRNA gene sequencing technology to examine the adaptation of E. miletus’s gut microbiota and physiological markers in various altitude zones under food restriction. It clarified the survival adaption mechanisms of high-altitude E. miletus in the face of food scarcity by comparing the variations in gut microbiota with altitude and their interactions with physiology in terms of body mass regulation. We hypothesized that food shortage will affect the composition and diversity of gut microbiota as well as physiological indices of E. miletus at high altitude.
2 Materials and methods
2.1 Collection of experimental animals
Eothenomys miletus were collected from Jingdong County (JD) and Xianggelila County (XGLL) in winter of 2023, respectively. Experimental animals were all non-breeding healthy adult individuals. The habitat characteristics of the sampling sites were shown in Table 1.
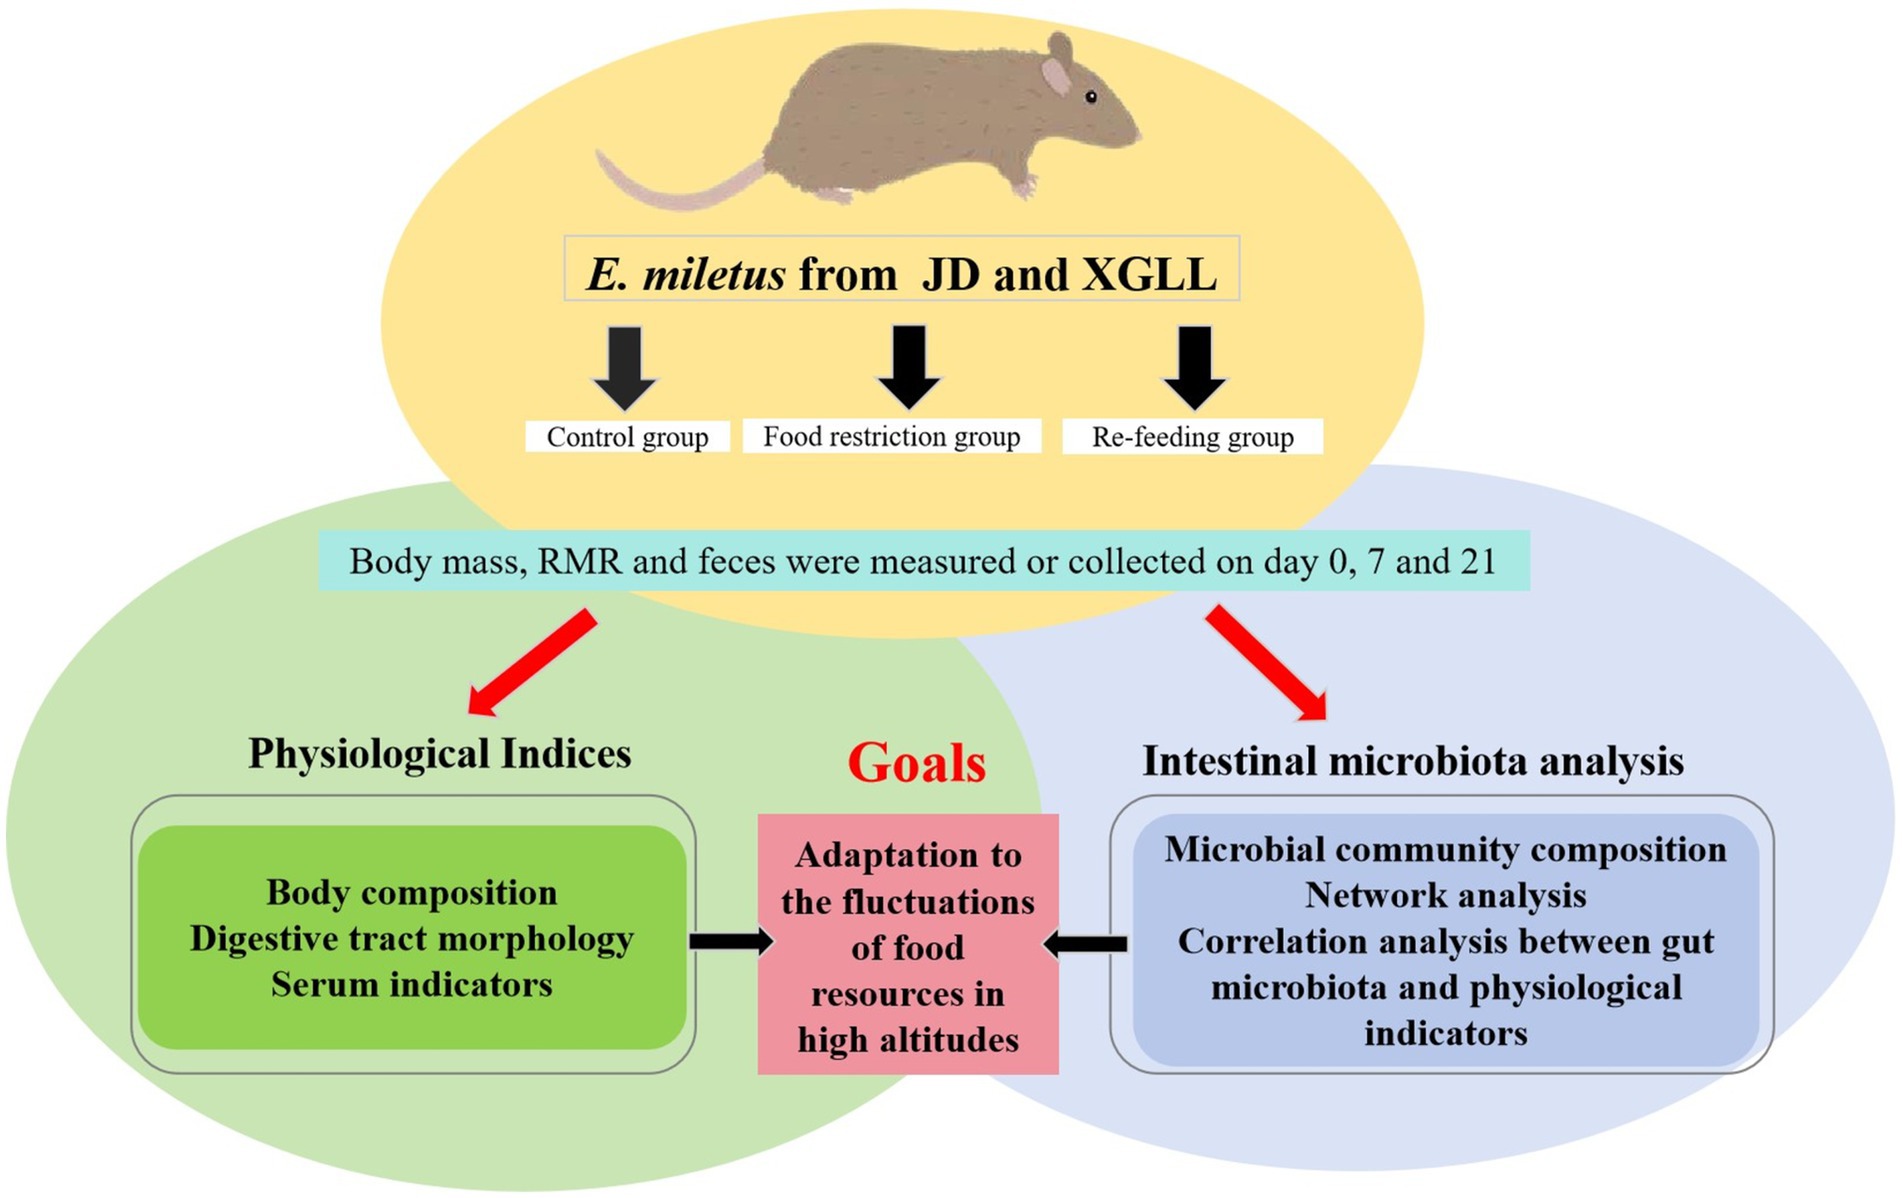
2.2 Experimental designs
Eothenomys miletus that were captured in two separate locations were sterilized to remove fleas, brought back to the animal breeding room at Yunnan Normal University, and put in separate rat cages (260 × 160 × 150 mm). After 4 days of acclimatization, E. miletus were divided into three groups using a two-factor (region × food restriction) experimental design: a 0 d control group, a 7 days food-restricted group, and a 14 days re-feeding group after food restriction (Figure 1). The restricted-food group fed 80% of the control group’s food intake (Yang et al., 2013), while the control group had free access to food and water. That is, JD control group (CJD, n = 7), JD restricted food group (FRJD, n = 7), JD re-feeding group (FR-ReJD, n = 7), XGLL control group (CXGLL, n = 7), XGLL restricted food group (FRXGLL, n = 7), XGLL re-feeding group (FR-ReXGLL, n = 6). Room temperature was controlled at 25 ± 1°C with a photoperiod of 12 L:12D (Light: Dark). The trial period lasted 21 days, during which the animals were fed standard rat chow (from Kunming Medical University, Kunming, China). Body mass, food intake, RMR and feces were measured simultaneously when the test was carried out on day 0, 7, and 21. Body mass was measured with an LT502 electronic balance (accurate to 0.01 g), food intake was measured with the food balance method, and RMR was measured with a portable respirometer (Gong et al., 2022). They were carried out under carbon dioxide anesthesia following the identification of the pertinent markers, and serum and rectal feces were collected.
2.3 Measurement of physiological indices
At the end of the experiment, blood was collected, allowed to stand for 1 h in the refrigerator at 4°C, and was centrifuged at 4°C (4,000 r/min, 30 min), taking up serum in a centrifuge tube, stored in the refrigerator (−80°C), and set aside. Measurements of leptin, glucose (Glu), triglyceride (Tg), total cholesterol (Tc), SCFAs, LPS, fasting-induced adipocyte factor (FIAF), and TNF-α were measured the serum using an enzyme-linked immunosorbent assay (ELISA). After the experimental animals were executed, brown adipose tissue (BAT) was carefully removed, weighed and put into centrifuge tubes, and stored in a low-temperature refrigerator for storage. The content and activity of uncoupling protein 1 (UCP1) were determined using ELISA. The assay was conducted following the instruction manual, and the product numbers of the assay kits were leptin Assay Kit (JM-11498 M1), Glu Assay Kit(S0104F-1), Tg Assay Kit (S0104F-1) Tg Assay Kit (S0140O-1), Tc Assay Kit (S05042-1), SCFAs Assay Kit (JM-11498 M1), LBP Assay Kit (JM-12488 M1), FIAF Assay Kit (JM-12613 M1), TNF-α AssayKit(JM-02415 M1).
2.4 Measurement of digestive tract morphology
Organs and other tissues are separated and then weighted after draining the surface liquid with a filter, (accurate to 0.001 g). After removing the digestive tract, carefully remove the mesentery, connective tissue, and fat from the stomach, small intestine, colon, and cecum. Then, weigh and measure the length of each organ.
2.5 DNA extraction and 16S rRNA gene sequencing
A centrifugal column-based soil genome extraction kit (DNeasy®PowerSoil®Kit, Germany) was used to collect the rectal feces and enrich the total DNA on the filter membrane. The concentration of purified PCR products was determined using a Nanodrop 2000 spectrophotometer, and valid samples were defined as having a nucleic acid concentration greater than 10 ng/uL and a purity (A260/A180) greater than 1.8. Purified DNA samples were mixed at equimolar concentrations and sequenced using the Illumina Miseq platform (Illumina, San Diego, CA, USA).
2.6 Bioinformatics analysis
The 2 × 250 bp double end sequences were obtained by sequencing on the Illumina Miseq platform (Illumina, San Diego, CA, USA) and these raw data were processed and analyzed using the QIIME platform (version 1.8). The double-end sequences were first spliced using Flash software (version 1.2.111) and then matched to a unique barcode label for each sample. Low quality sequences (sequence length less than 300 or base mass fraction less than 30) were removed during the splicing process. By QIIME software, the raw data was processed, using Flash software to clear low-quality sequences, and then removing the chimeras in the sequences by Usearch 7.0 software. The OTU sequences with more than 97% recognition were clustered using the Uclust algorithm, and the representative OTU sequences were analyzed and identified based on the Ribosomal Database Project, and finally, the sequences of all samples were normalized by the “Daisychopper” script code. Finally, we standardized the sequences of all the samples by using the code “Daisychopper.”
2.7 Data analysis
2.7.1 Microbial community composition
A percentage stacked bar chart was created using origin 2018 to describe the bacterial community.
2.7.2 α and β diversity
α diversity was estimated by 2 diversity indicators: Chao1 and Shannon diversity and described by creating box plots using Origin 2018, and Kruskal-Wallis H-test was used in SPSS 21 to analyze if differences in diversity between the two groups. The reason we chose the non-parametric test here was that these two indicators did not conform to the homogeneity of variance.
β diversity: community structure was described using QIIME and Origin 2018. Based on unweighted and weighted UniFrac distance matrices, PERMANOVA (Permutational multivariate analysis of variance) was used to calculate the difference among the groups. The unweighted UniFrac distance depends on phylogenetic relationships and OTU species abundance, while species absence/presence and phylogenetic relationships are considered by the weighted UniFrac distance. Then principal co-ordinates analysis (PCoA) was used to visualize the β diversity of all samples.
2.7.3 Venn diagram
Common and unique parameters between groups were analyzed via Venn diagrams implemented online in Venn 2.1.
2.7.4 Enrichment analysis
We used one-way of variance analysis to compare the distribution differences of microbial abundance among groups, and the variable was different treatment group. The genera of microorganisms with significant differences in distribution between groups were screened out, and the heatmap was drawn by R packages “vegan,” “permute,” and “gplots” for visualization. The prefixes “o” and “f” represented the order and family level of unidentified genera, respectively.
2.7.5 Heat map of the correlation between environmental physicochemical properties and dominant microorganisms in the feces of Eothenomys miletus in different regions
Pearson analysis using SPSS 21 and R3.6.2 were used to obtain the correlation heat map.
2.7.6 RDA analysis
Redundancy analysis (RDA) was used to assess the correlation between dominant genera (top 9) and physicochemical factors using Canoco 5.0.
2.7.7 Network analysis
Use R3.6.2 and Gephiv.0.9.2 software to further analyze these results to generate network analysis (p < 0.05, |r| > 0.4). R was used to calculate the correlation between these microorganisms, and the network analysis diagram was drawn based on the correlation matrix. With the help of Gephi, we further calculated the topological characteristics (namely modularity) of the network.
2.7.8 Physiological indicators analysis
The data was analyzed using SPSS 26.0 software, and the differences in various indicators between the two regions were analyzed using two-way ANOVA or two-way ANCOVA (Region × Diet), with body mass as the covariate. The results were expressed as mean ± SE, with p < 0.05 indicating significant differences.
3 Results
In the present study, a total of 39 samples were collected to extract the DNA and amplify the PCR products, and each sample was normalized to 6,982 sequences after removing low-quality sequences, chimeras, monomers, and chloroplasts.
3.1 Effects of food restriction on physiological indicators
Body mass of E. miletus was significantly affected by area and time (Region: F = 35.751, p < 0.01; Time: F = 7.895, p < 0.05). Region and time significantly affected RMR of E. miletus (Region: F = 15.928, p < 0.01; Time: F = 17.141, p < 0.01). The interaction of region and time significantly affected liver weight in E. miletus (Region: F = 32.960, p < 0.01; Time: F = 8.225, p < 0.01; Interaction: F = 12.614, p < 0.01). Region significantly affected kidney weight and lung weight in the E. miletus (Region: F = 14.679, p < 0.05; Time: F = 12.245, p < 0.05). Cecum length was significantly affected by region and time (Region: F = 21.508, p < 0.01; Time: F = 3.321, p < 0.05). Time significantly affected WAT weight (F = 4.744, p < 0.05) and the interaction of region and time significantly affected BAT weight (Region: F = 32.618, p < 0.01; Time: F = 7.154, p < 0.05; and Interaction: F = 10.955, p < 0.01) in E. miletus (Figure 2). Region significantly affected the Leptin content of the E. miletus (F = 18.688, p < 0.01) (Figure 3). Region and time did not significantly affect other indices of E. miletus in XGLL (Table 2). E. miletus in XGLL had smaller changes in leptin, larger changes in RMR, greater weight loss in main organs, and larger changes in cecum.
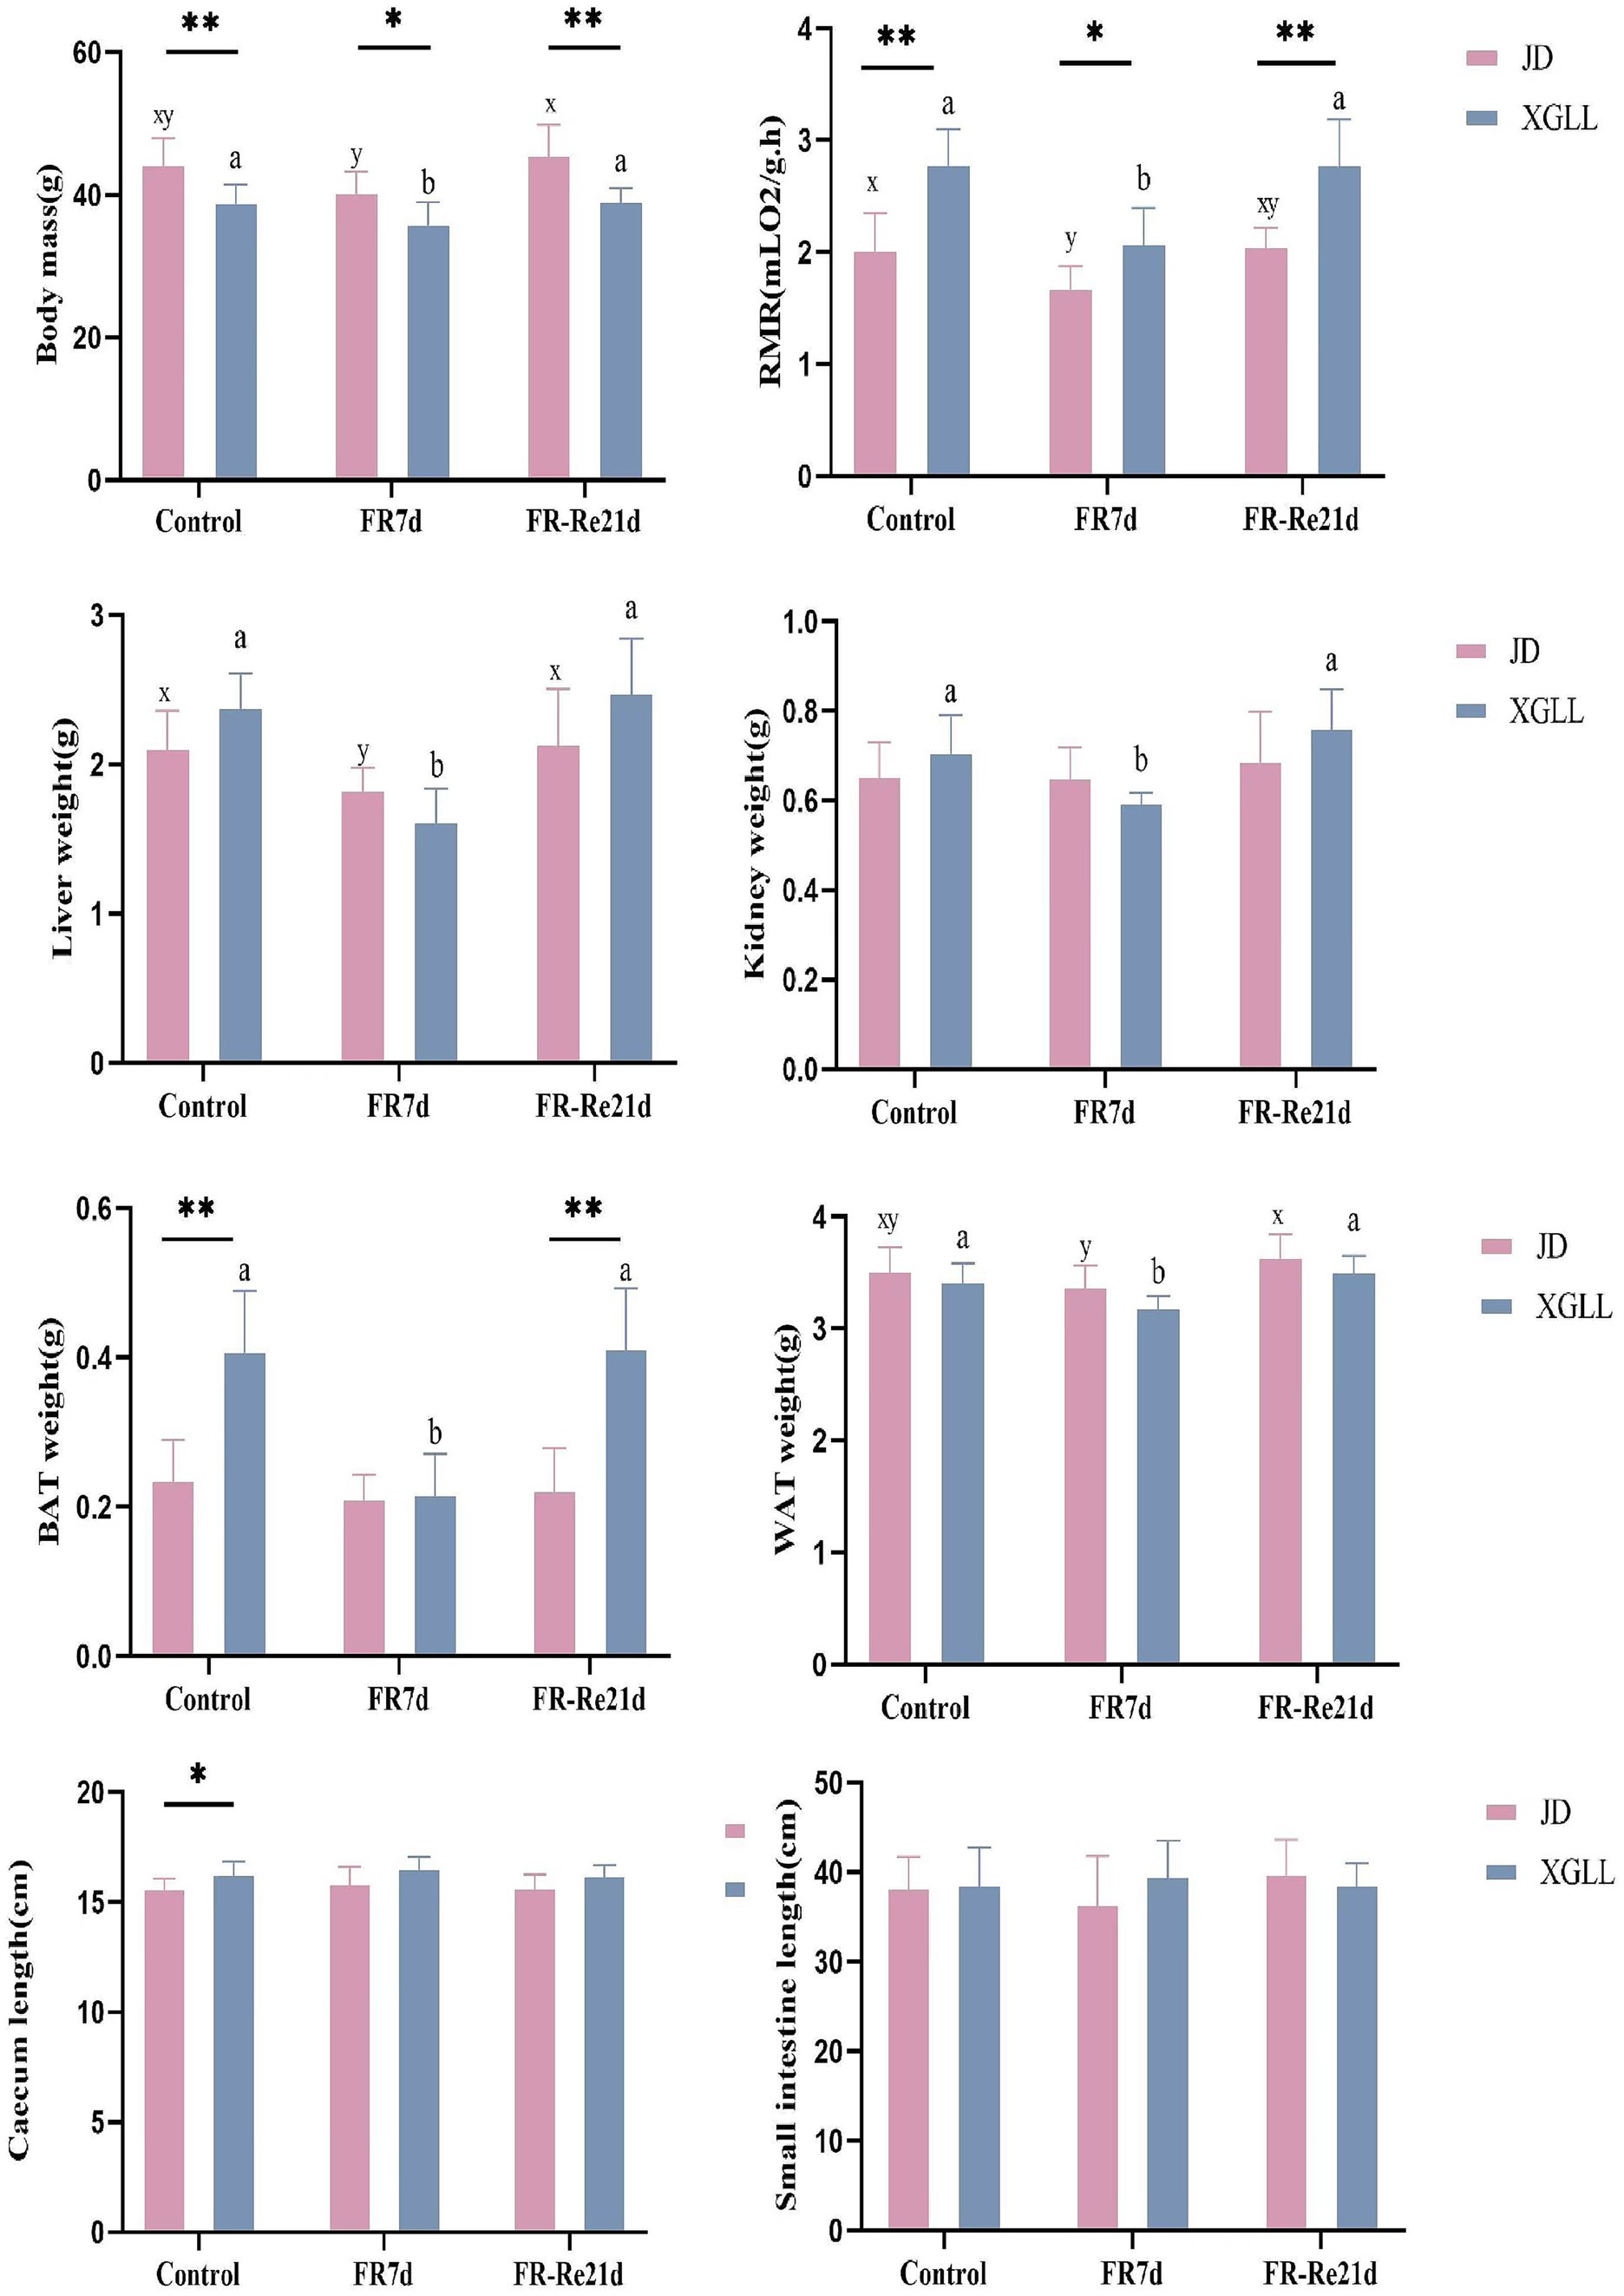
Figure 2. Effects of different regions and food restriction on physiological indices of E. miletus. Control, Control group; FR7d, Restricted food for 7 days group; FR-Re21d, 14 days re-feeding group after food restriction.
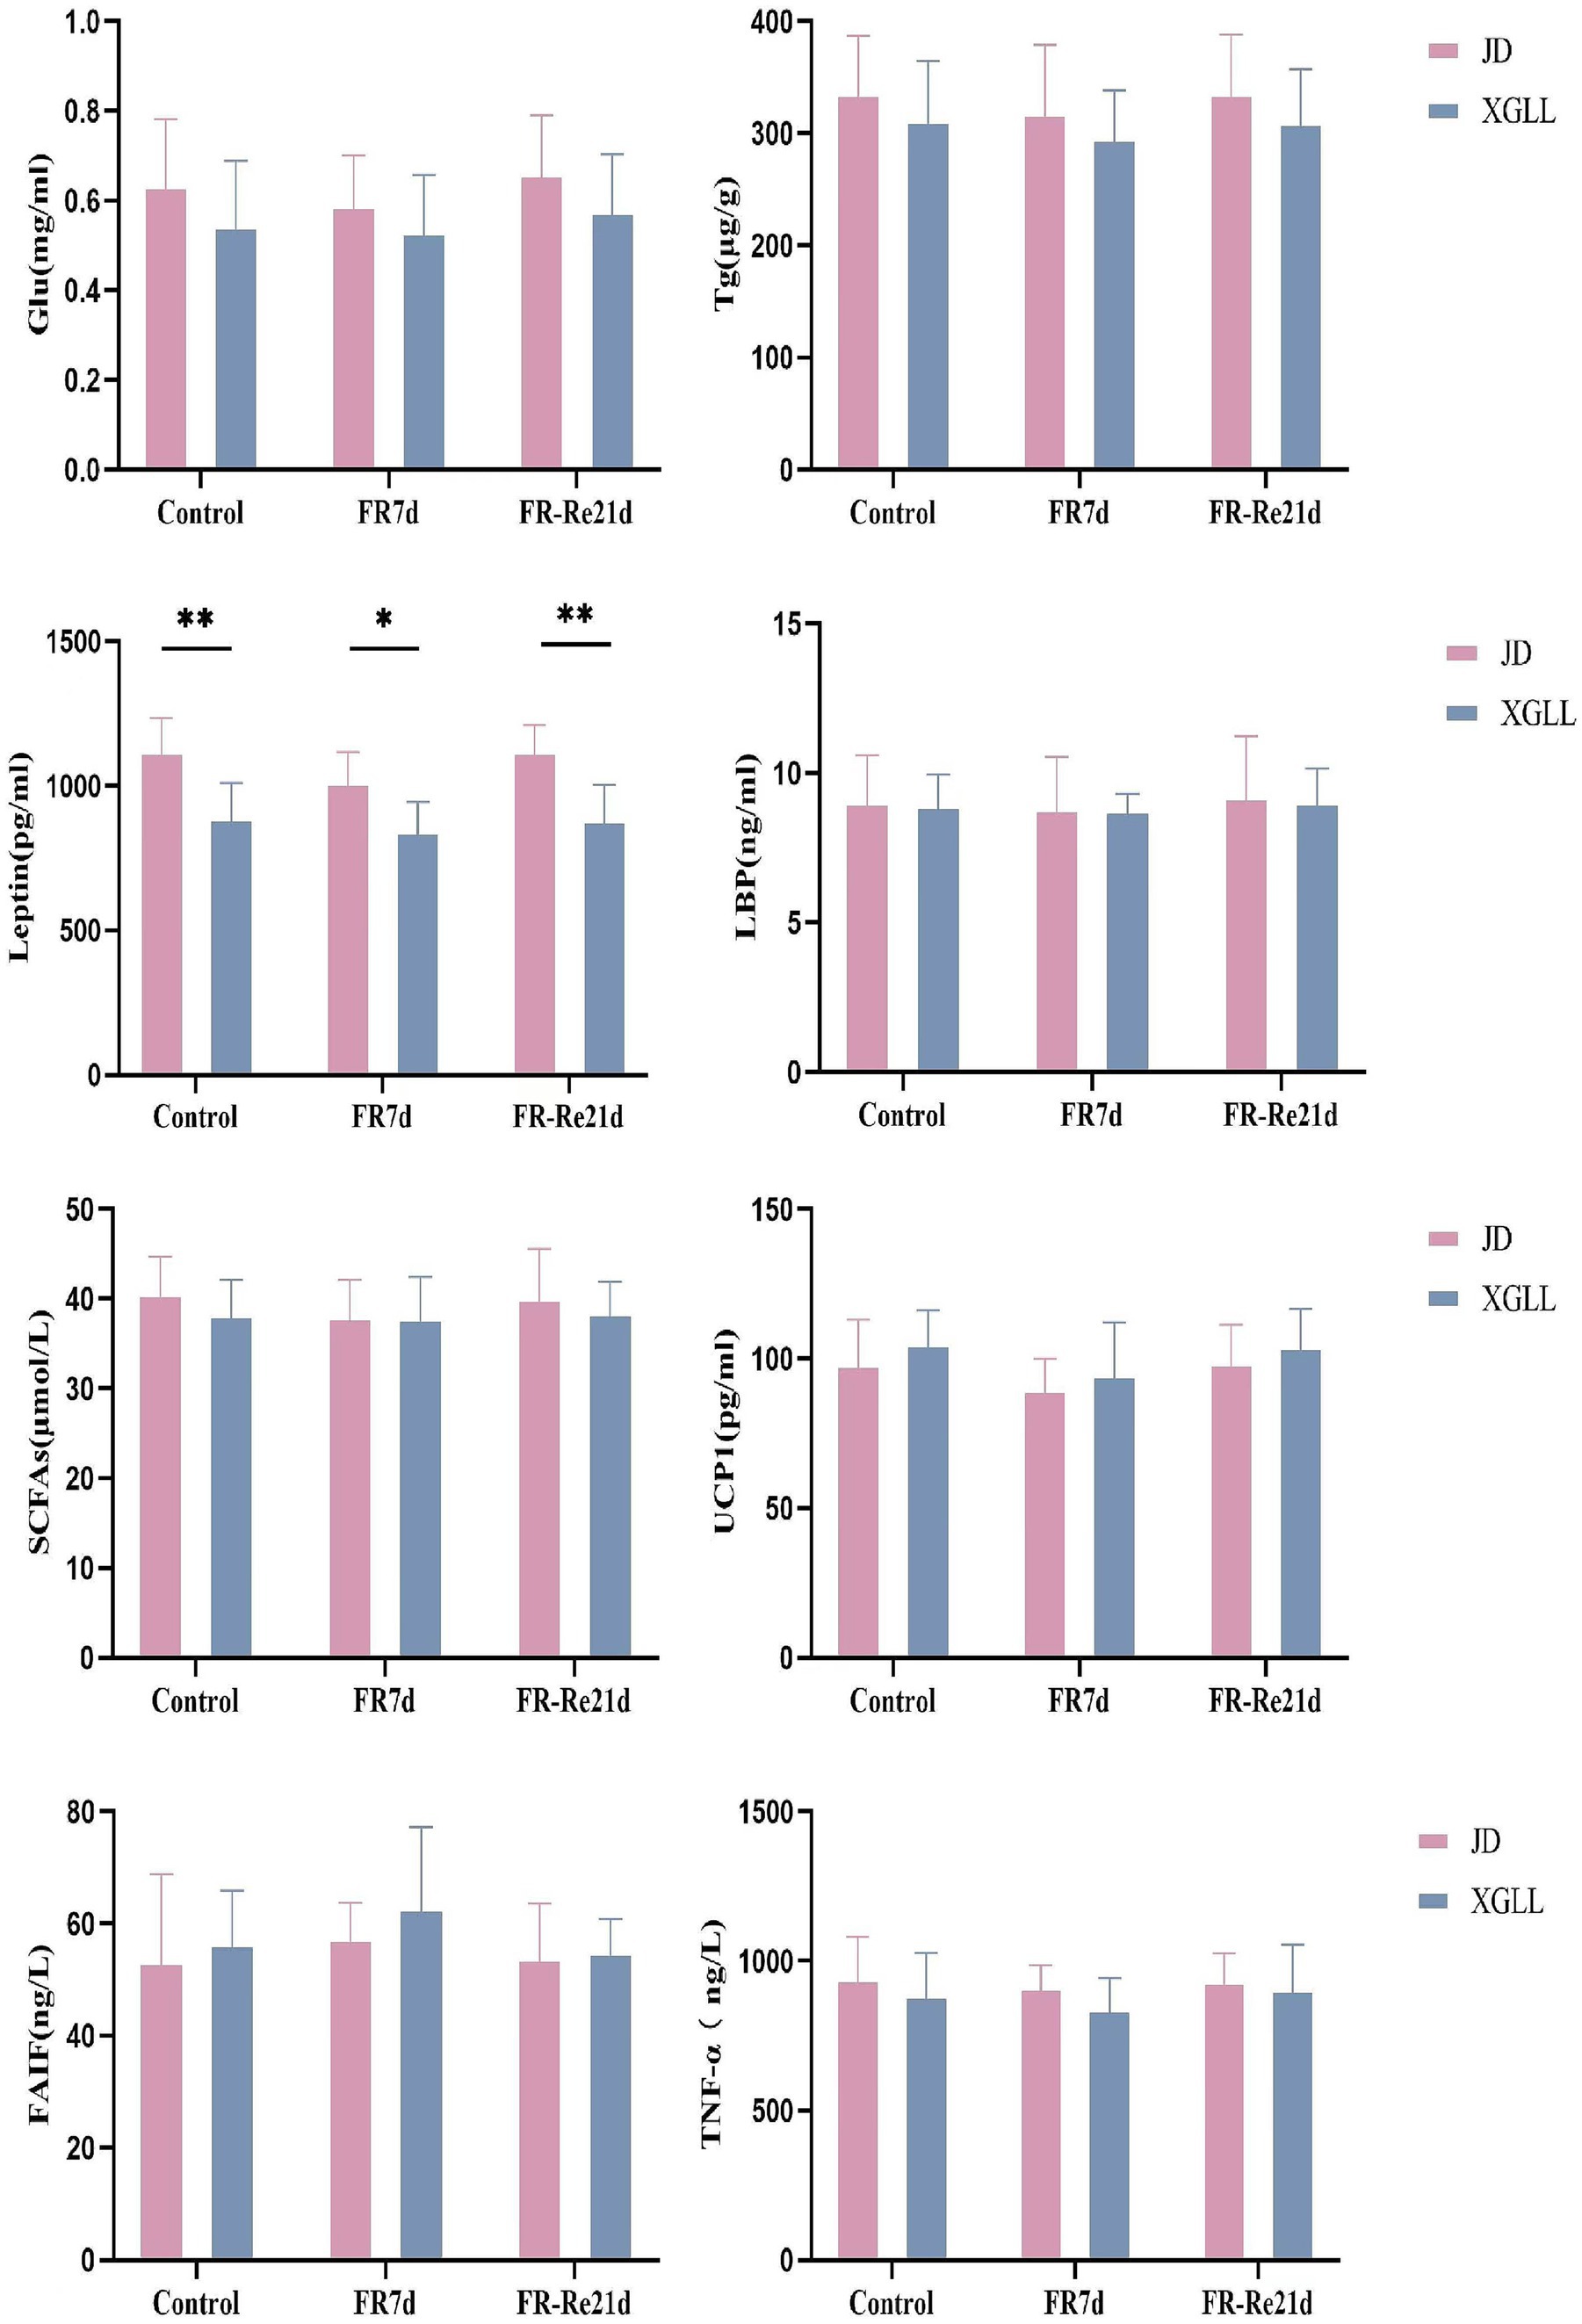
Figure 3. Effect of different regions and food restriction on serum indices of E. miletus. Control, Control group; FR7d, Restricted food for 7 days group; FR-Re21d, 14 days re-feeding group after food restriction. Data were mean ± standard deviation. Different letters indicated significant differences between treatments in the same region, xy indicates JD region and ab indicates XGLL region. *p < 0.05, **p < 0.01, JD and XGLL were compared on the same day.
Data were mean ± standard deviation. Different letters indicated significant differences between treatments in the same region, xy indicates JD region and ab indicates XGLL region. *p < 0.05, **p < 0.01, JD and XGLL were compared on the same day.
3.2 Microbial community composition
Firmicutes, Bacteroidetes, and Spirochaetes were the fecal microbial dominant phylum of E. miletus (Figure 4), with mean relative abundances of 80.71, 9.22, and 8.66%, respectively. The relative abundance of Firmicutes, the predominant phylum of fecal microbes in E. miletus, did not differ significantly between the two regions of JD and XGLL, similar to the relative abundance of Bacteroidetes did not change between the regions at different treatment periods. Conversely, the dominant phylum Spirochaetes’ average relative abundance in XGLL exhibited a tendency of decline followed by an increase, while the shift was less noticeable in JD.
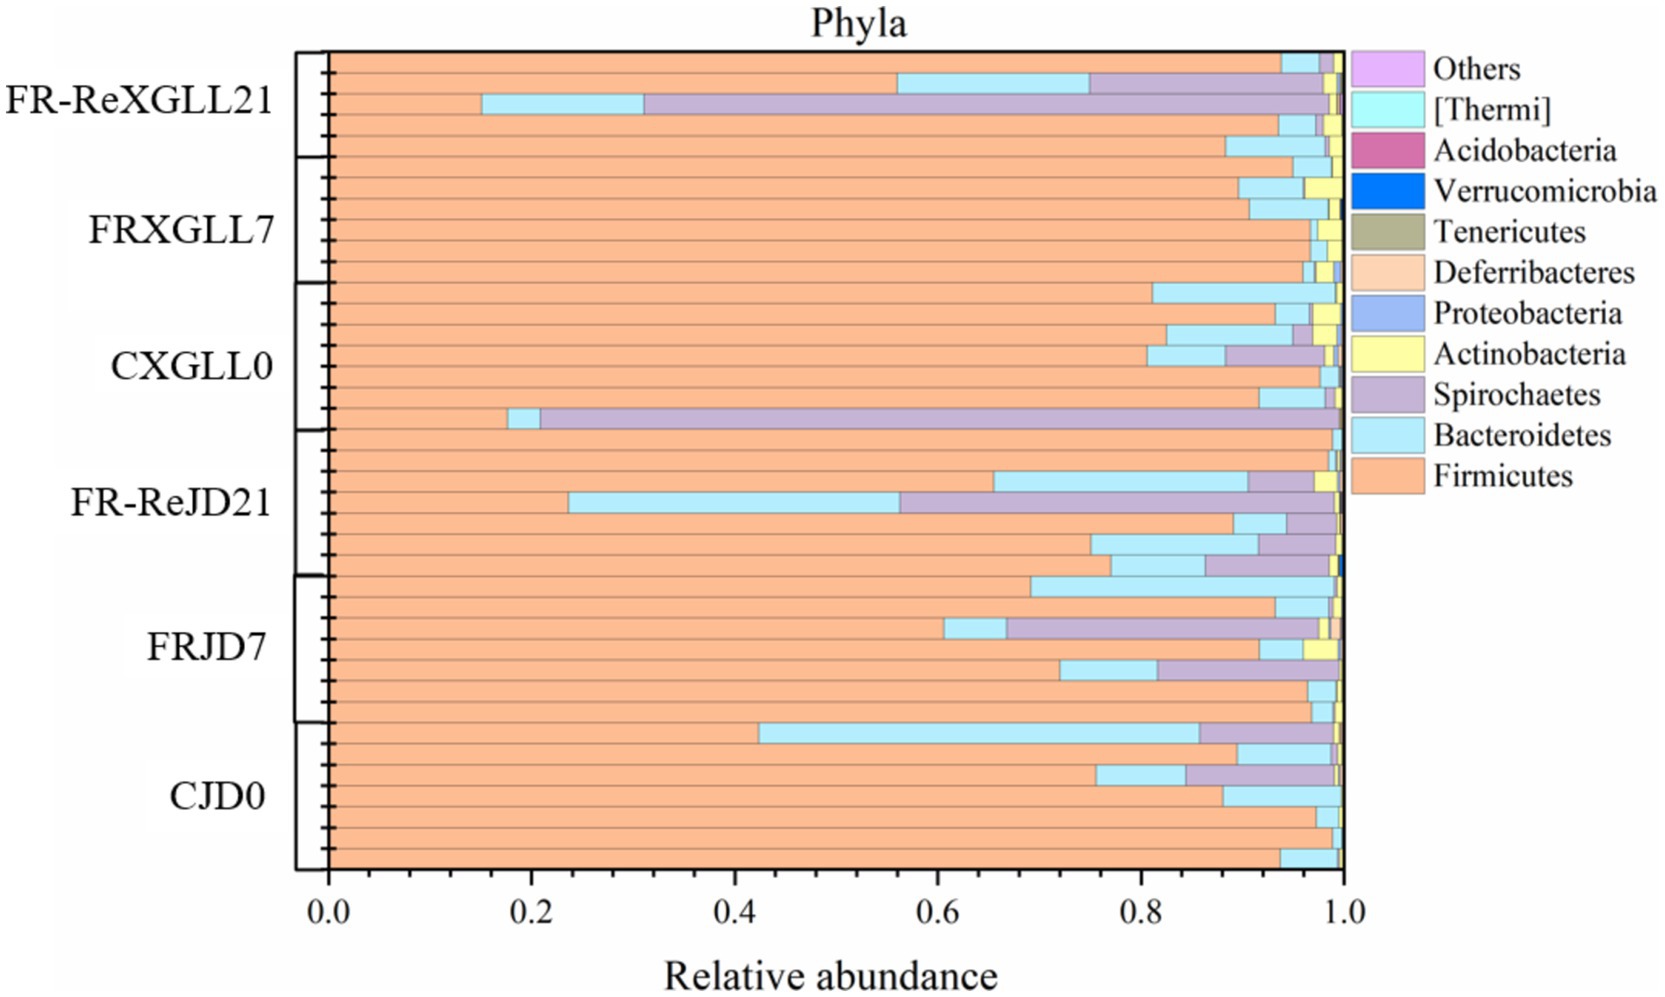
Figure 4. Microbial phylum level community composition. CJD0, JD control group; FRJD7, JD restricted food group; FR-ReJD21, JD re-feeding group; CXGLL, XGLL control group; FRXGLL7, XGLL restricted food group; FR-ReXGLL21, XGLL re-feeding group.
At the genus level, the main dominant genera of fecal microorganisms in the E. miletus were Lactobacillus, Treponema, and S24-7 (UG), with average relative abundances of 73.72, 8.63, and 6.68% in all groups (Figure 5). Lactobacillus did not exhibit a significant variation in mean relative abundance over time or place in E. miletus. In XGLL, the dominating genus Treponema’s average relative abundance first trended downward before rising.
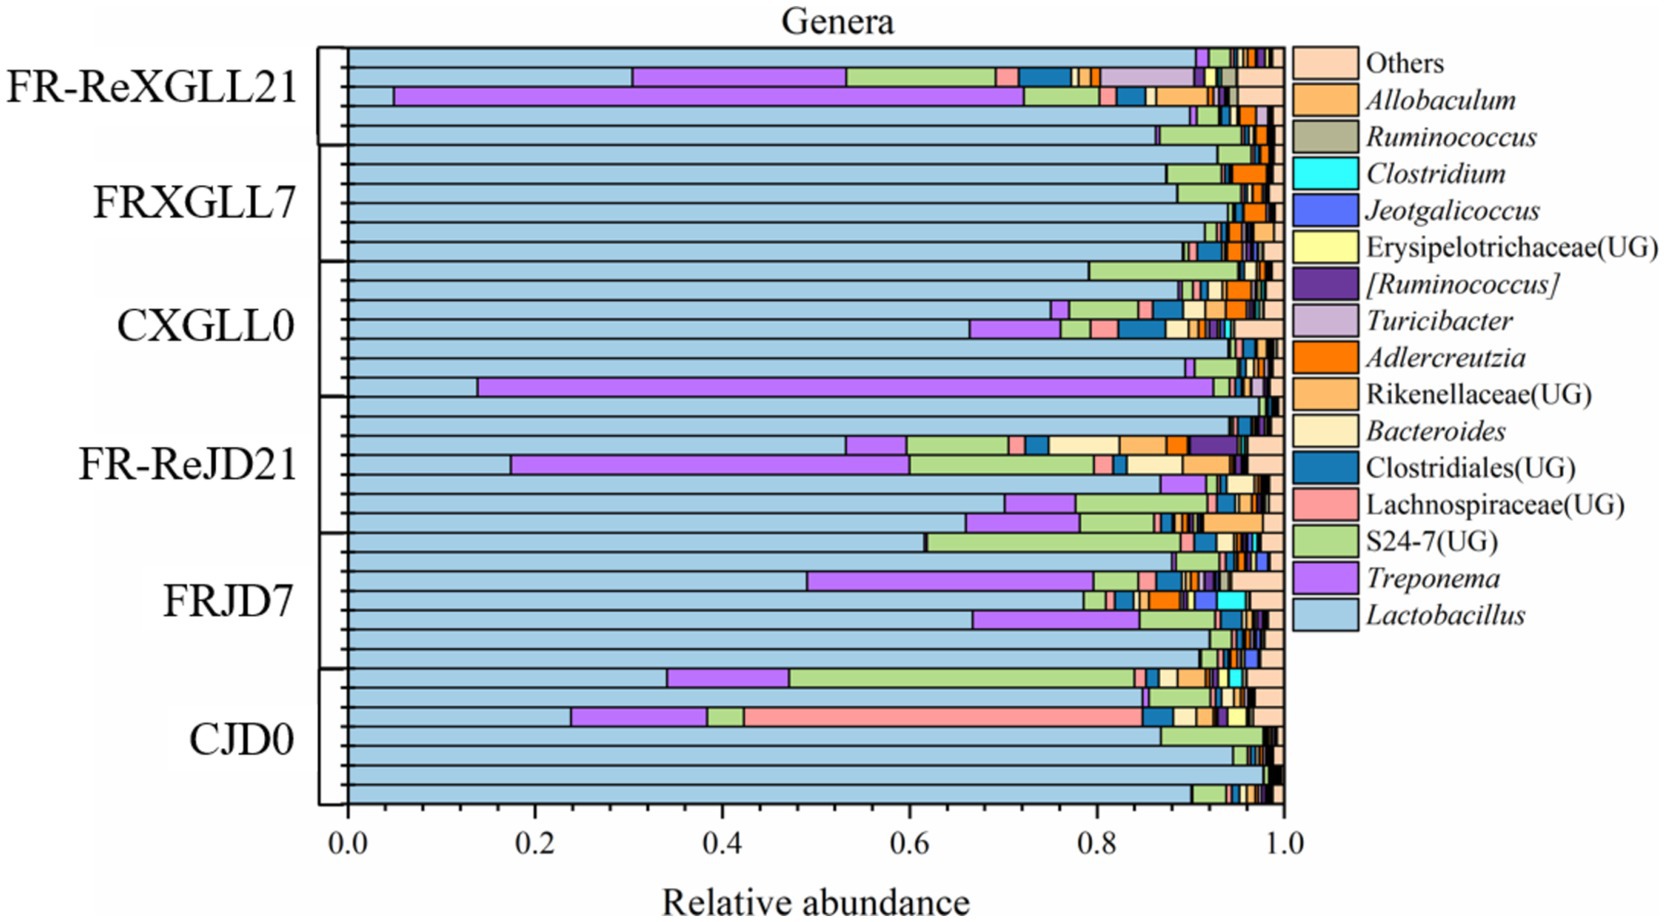
Figure 5. Microbial composition at the genus level. CJD0, JD control group; FRJD7, JD restricted food group; FR-ReJD21, JD re-feeding group; CXGLL, XGLL control group; FRXGLL7, XGLL restricted food group; FR-ReXGLL21, XGLL re-feeding group.
3.3 Microbial community α and β diversity analysis
Food restriction did not significantly affect the α-diversity (Chao1 and Shannon diversity) of E. miletus (Figure 6). The PCoA plot showed that the β-diversity of E. miletus in the various food-restricted group regions was dispersed, without any discernible tendency of aggregation (Figure. 7), which implied that the fecal microbial β-diversity of E. miletus was not significantly affected by the food-restricted treatment.
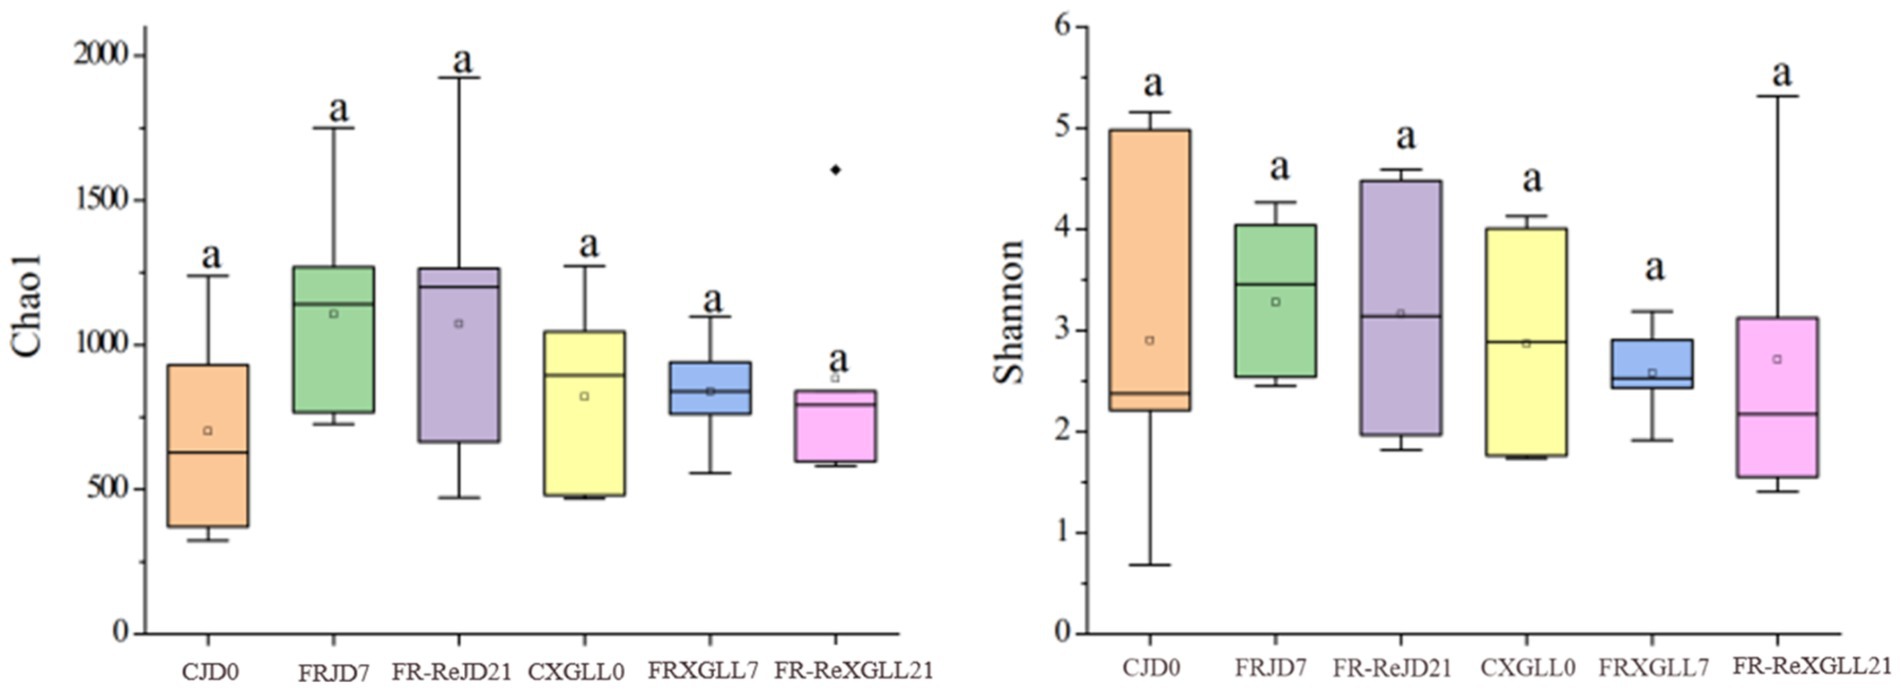
Figure 6. Microbial α-diversity of fecal microorganisms of E. miletus in different regions and time periods. CJD0, JD control group; FRJD7, JD restricted food group; FR-ReJD21, JD re-feeding group; CXGLL, XGLL control group; FRXGLL7, XGLL restricted food group; FR-ReXGLL21, XGLL re-feeding group.
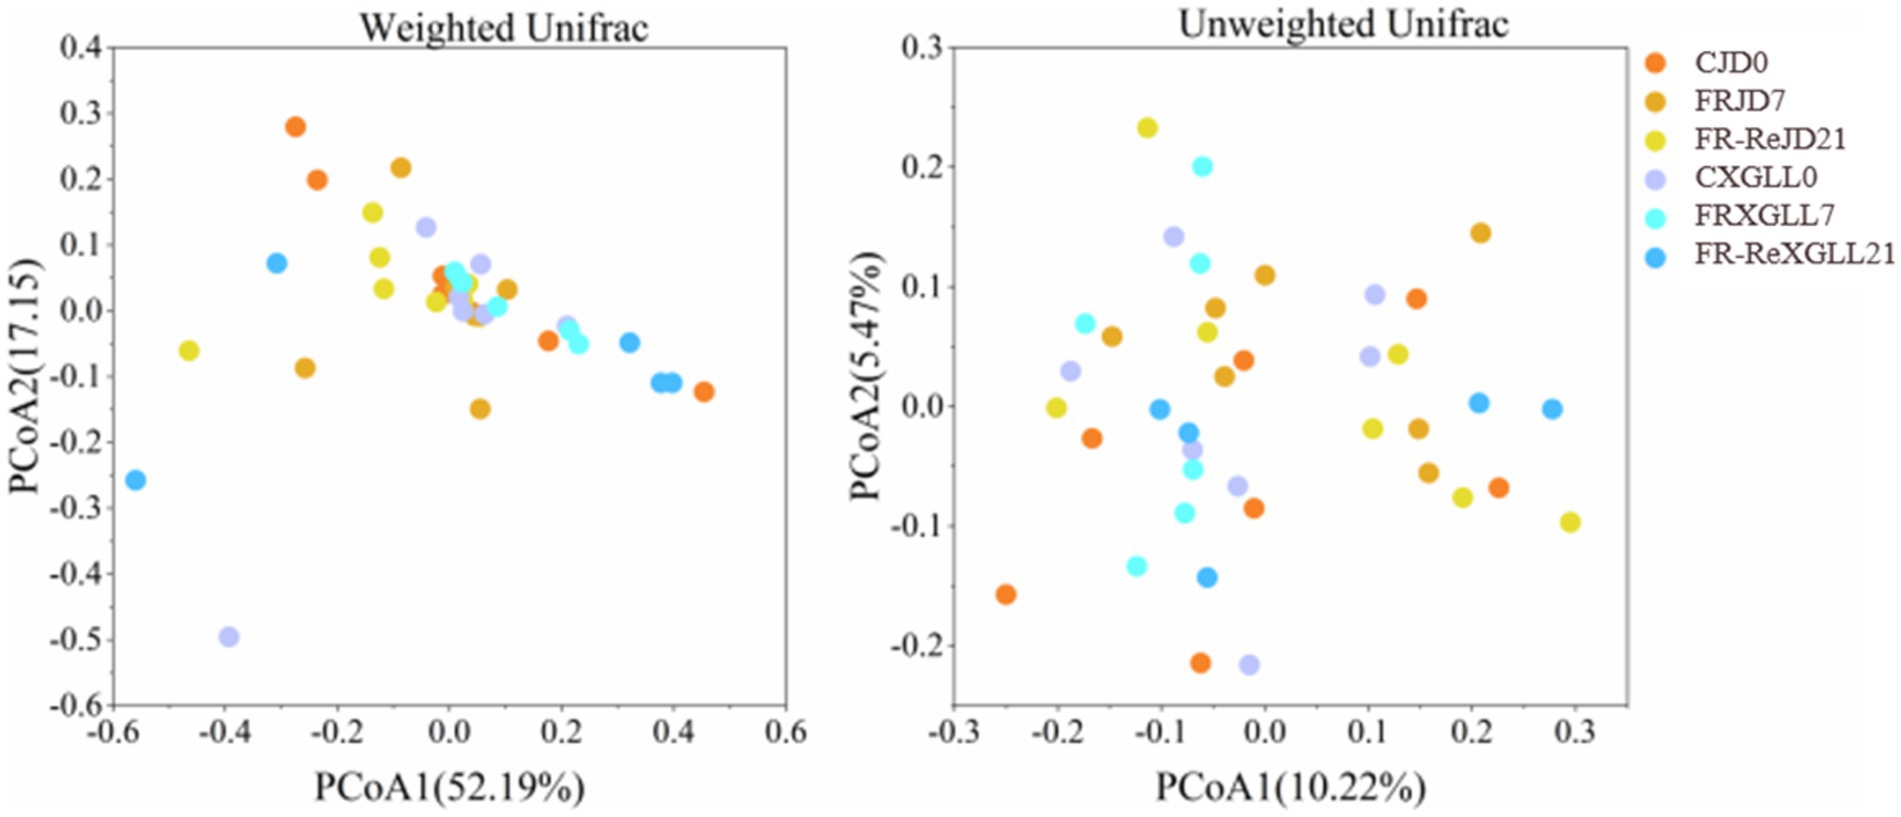
Figure 7. β-diversity of fecal microorganisms of E. miletus in different regions and periods in the food-restricted group. CJD0, JD control group; FRJD7, JD restricted food group; FR-ReJD21, JD re-feeding group; CXGLL, XGLL control group; FRXGLL7, XGLL restricted food group; FR-ReXGLL21, XGLL re-feeding group.
Subsequent PERMANOVA testing revealed that the overall distribution of fecal microbial β-diversity (weighted and unweighted matrices) in E. miletus was not significantly affected by treatment or location (Table 3).

Table 3. PERMANOVA test for fecal microorganisms in different regions and periods of time of E. miletus.
3.4 Distribution of common and unique microorganisms in different regions and periods
There were 67 genera of fecal microorganisms in the food-restricted group of E. miletus in the JD (Figure 8). Among them, 18 genera were unique to CJD0 group, 27 genera were unique to the FRJD7 group, and 21 genera were unique to FR-ReJD21 group. The food-restricted group of E. miletus at XGLL had 60 genera of fecal bacteria. In XGLL, there were 31 genera that were particular to the CXGLL0 group, 15 genera that were specific to FRXGLL7 group, and 26 genera that were exclusive to FR-ReXGLL21 group. It showed that the common and endemic bacteria in XGLL and JD were almost identical.
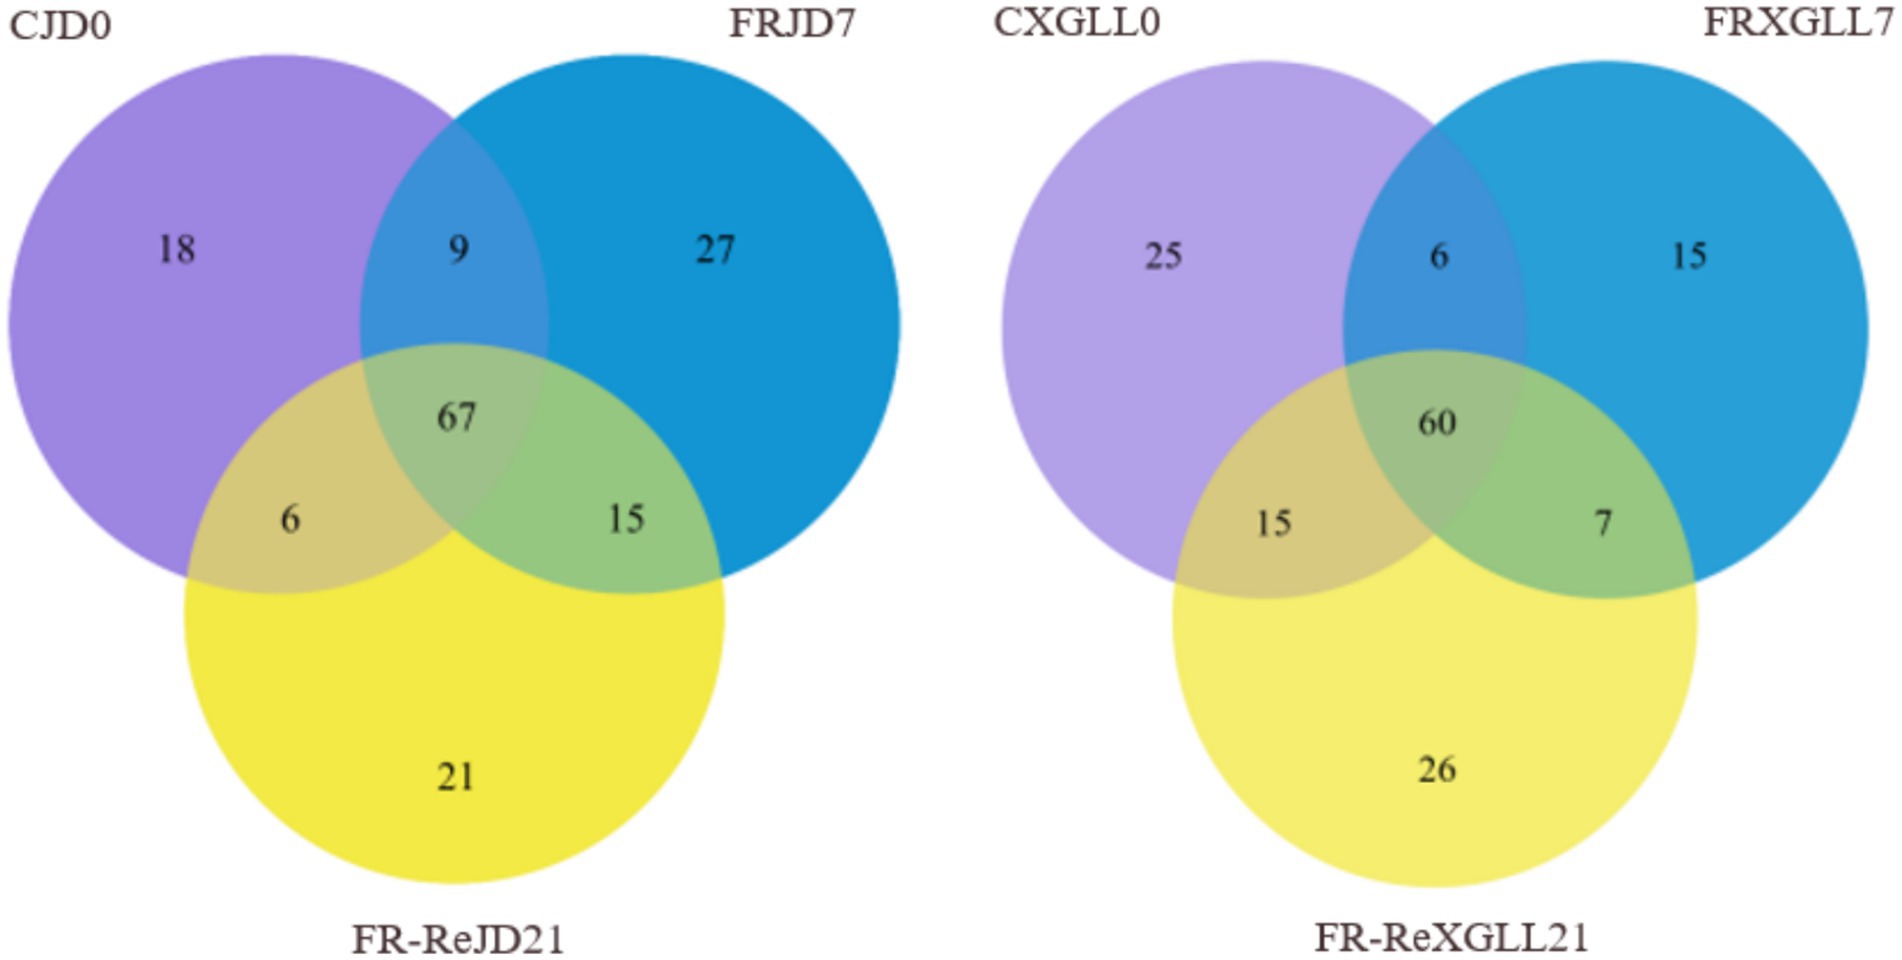
Figure 8. Venn diagram of fecal microorganisms of E. miletus feces at different time periods. CJD0, Jingdong control group; FRJD7, Jingdong restricted food group; FR-ReJD21, Jingdong re-feeding group; CXGLL, Xianggelia control group; FRXGLL7, Xianggelila restricted food group; FR-ReXGLL21, Xianggelila re-feeding group.
There were 56 genera of fecal bacteria in various places and periods as Figure 9 demonstrated. Among them, 44 genera were exclusive to CJD0 group, 62 genera were exclusive to FRJD7 group, and 53 genera were exclusive to the FR-ReJD21 group. In XGLL, there were 50 genera were exclusive to CXGLL0 group, 32 genera were exclusive to FRXGLL7 group, and 52 genera were exclusive to FR-ReXGLL21 group.
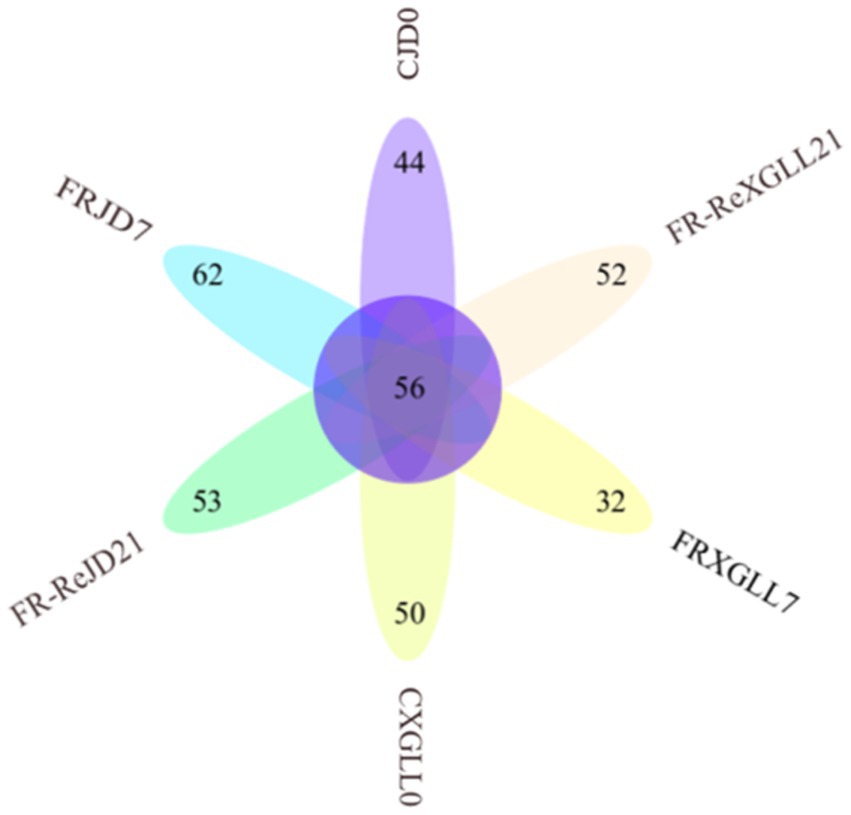
Figure 9. Venn diagram of fecal microorganisms of E. miletus in different regions and time periods. CJD0, JD control group; FRJD7, JD restricted food group; FR-ReJD21, JD re-feeding group; CXGLL, XGLL control group; FRXGLL7, XGLL restricted food group; FR-ReXGLL21, XGLL re-feeding group.
3.5 Analysis of microbial enrichment differences in different regions and periods
The relative abundance of microorganisms differed in the feces of JD and XGLL E. miletus as shown in Figure 10. Denovo61049 (f_S24-7) was most enriched in JD control group (p < 0.05). The majority of microbial OTUs, including denovo17865 (g_Lactobacillus), denovo20621 (g_SMB53), denovo34950 (f_S24-7), denovo45512 (g_Jeotgalicoccus), etc., were higher enriched in the FRJD7 group (p < 0.05). Compared to the CJD0 and FRJD7 groups, denovo56247 (g_Lactobacillus) was significantly enriched in FR-ReJD21 groups (p < 0.05).
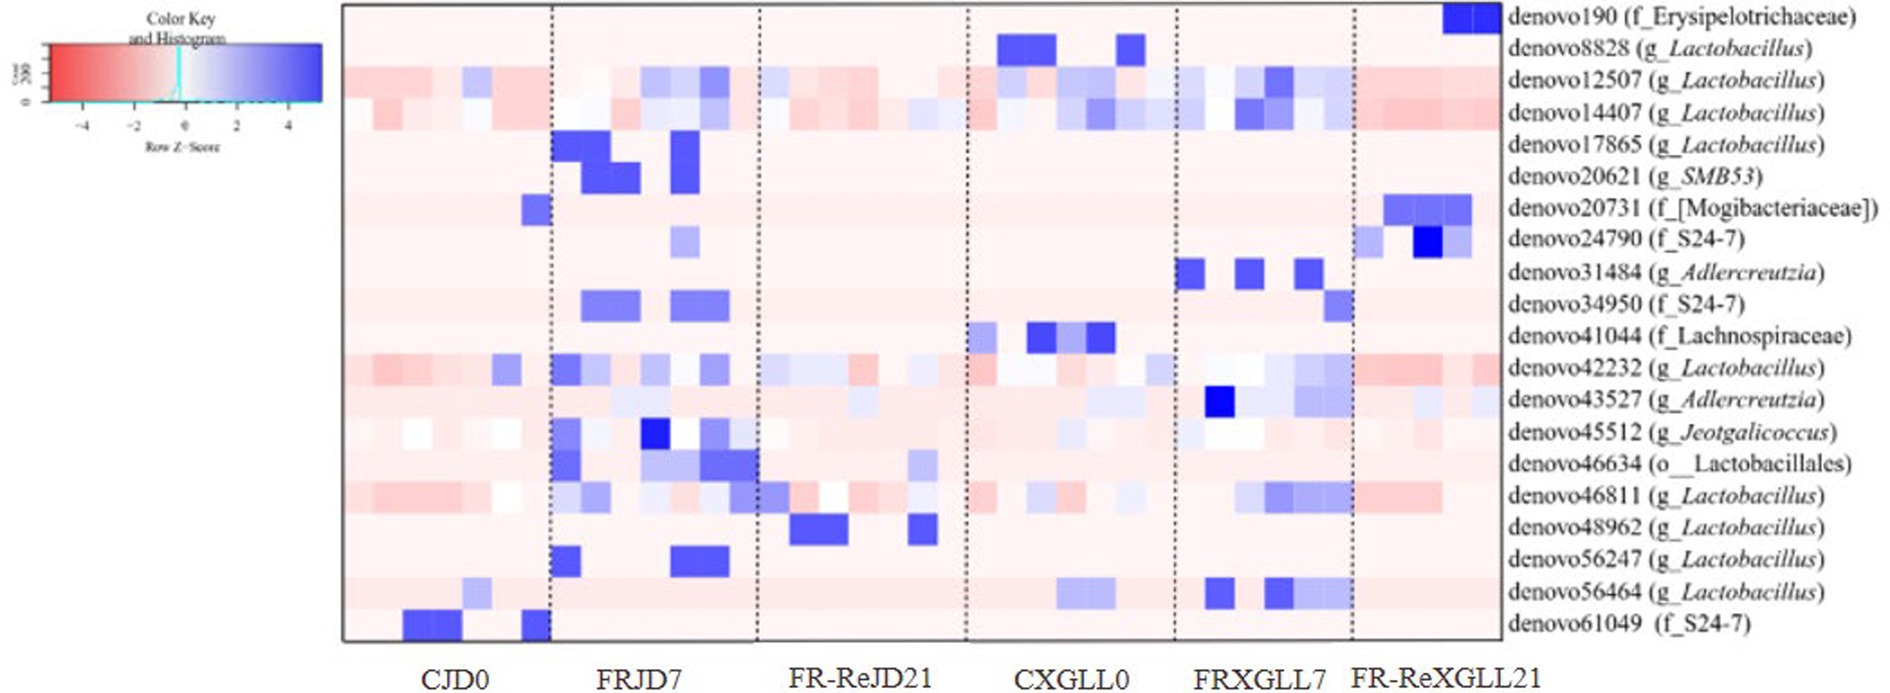
Figure 10. Differential microbial analysis of the feces of E. miletus in the food-restricted groups in Jindong and Xianggelila at different periods of time. CJD0, JD control group; FRJD7, JD restricted food group; FR-ReJD21, JD re-feeding group; CXGLL, XGLL control group; FRXGLL7, XGLL restricted food group; FR-ReXGLL21, XGLL re-feeding group.
In XGLL, OTUs enriched in the CXGLL0 group included denovo8828 (g_Lactobacillus) and denovo41044 (f_Lachnospiraceae). Comparing the CXGLL0 and FRXGLL7 groups, denovo190 (f_Erysipelotrichaceae), denovo20731 (f_[Mogibacteriaceae]), and denovo24790 (f_S24-7) were significantly enriched (p < 0.05) in FR-ReXGLL21 groups. Similarly to JD, microbial OTUs were more enriched in the 7-day group, such as denovo31484 (g_AJDercreutzia), denovo34950 (f_S24-7), denovo43527 (g_AJDercreutzia), and denovo46811 (g_ Lactobacillus), etc.
3.6 Relationship between physiological indicators and microorganisms in different regions and periods in Eothenomys miletus
The correlation between physiological indicators and the dominant genera (top ten relative abundance of all samples) in the feces of E. miletus in JD was shown in Figure 11. It was found between various physiological indicators and some of the main genera found in the feces of E. miletus in JD. For instance, there was a significant negative relationship between liver weight and AJDercreutzia abundance (p < 0.05), a significant negative correlation between BAT mass and Bacteroides and [Ruminococcus] abundance (p < 0.05), and a significant negative correlation between WAT mass and Turicibacter abundance (p < 0.05).
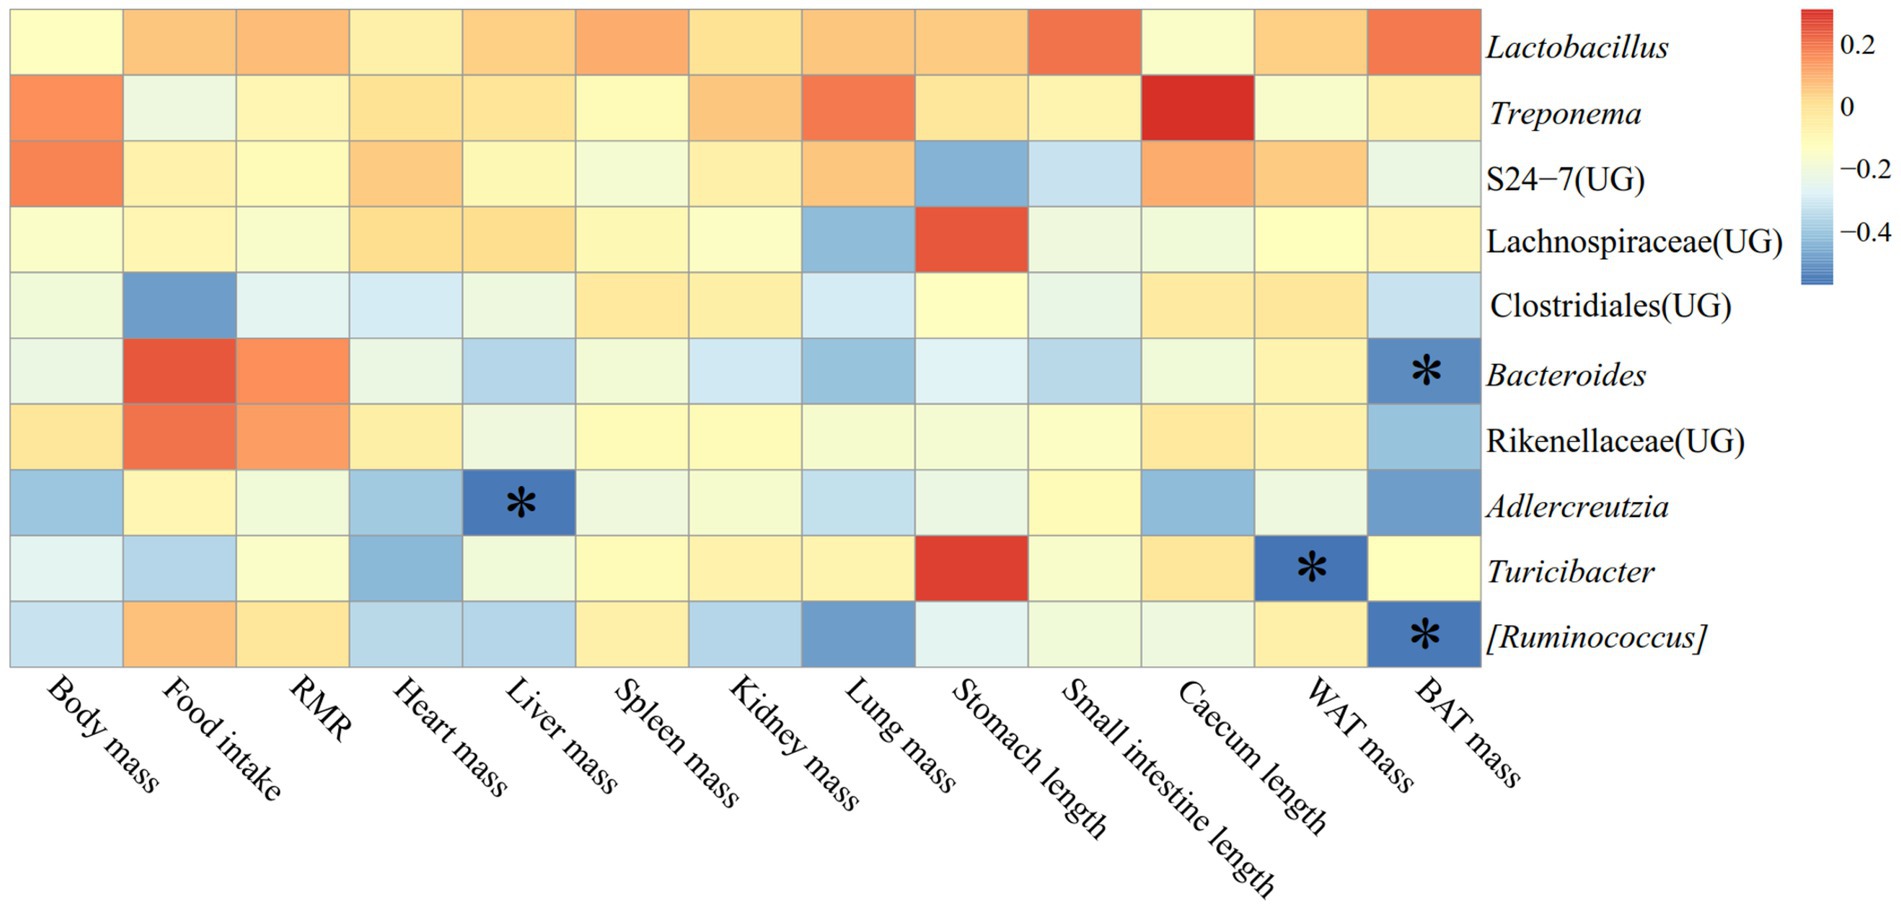
Figure 11. Heat map of physiological indicators related to the dominant microorganisms in the feces of E. miletus in JD.
In JD, it illustrated the relationship between detection markers and fecal dominating genera (top ten relative abundance of all samples) of E. miletus (Figure 12). There was a substantial and positive correlation (p < 0.05) between Tc and the abundance of S24-7 (UG); conversely, there was a significant and negative correlation (p < 0.01) between Glu and Turicibacter.
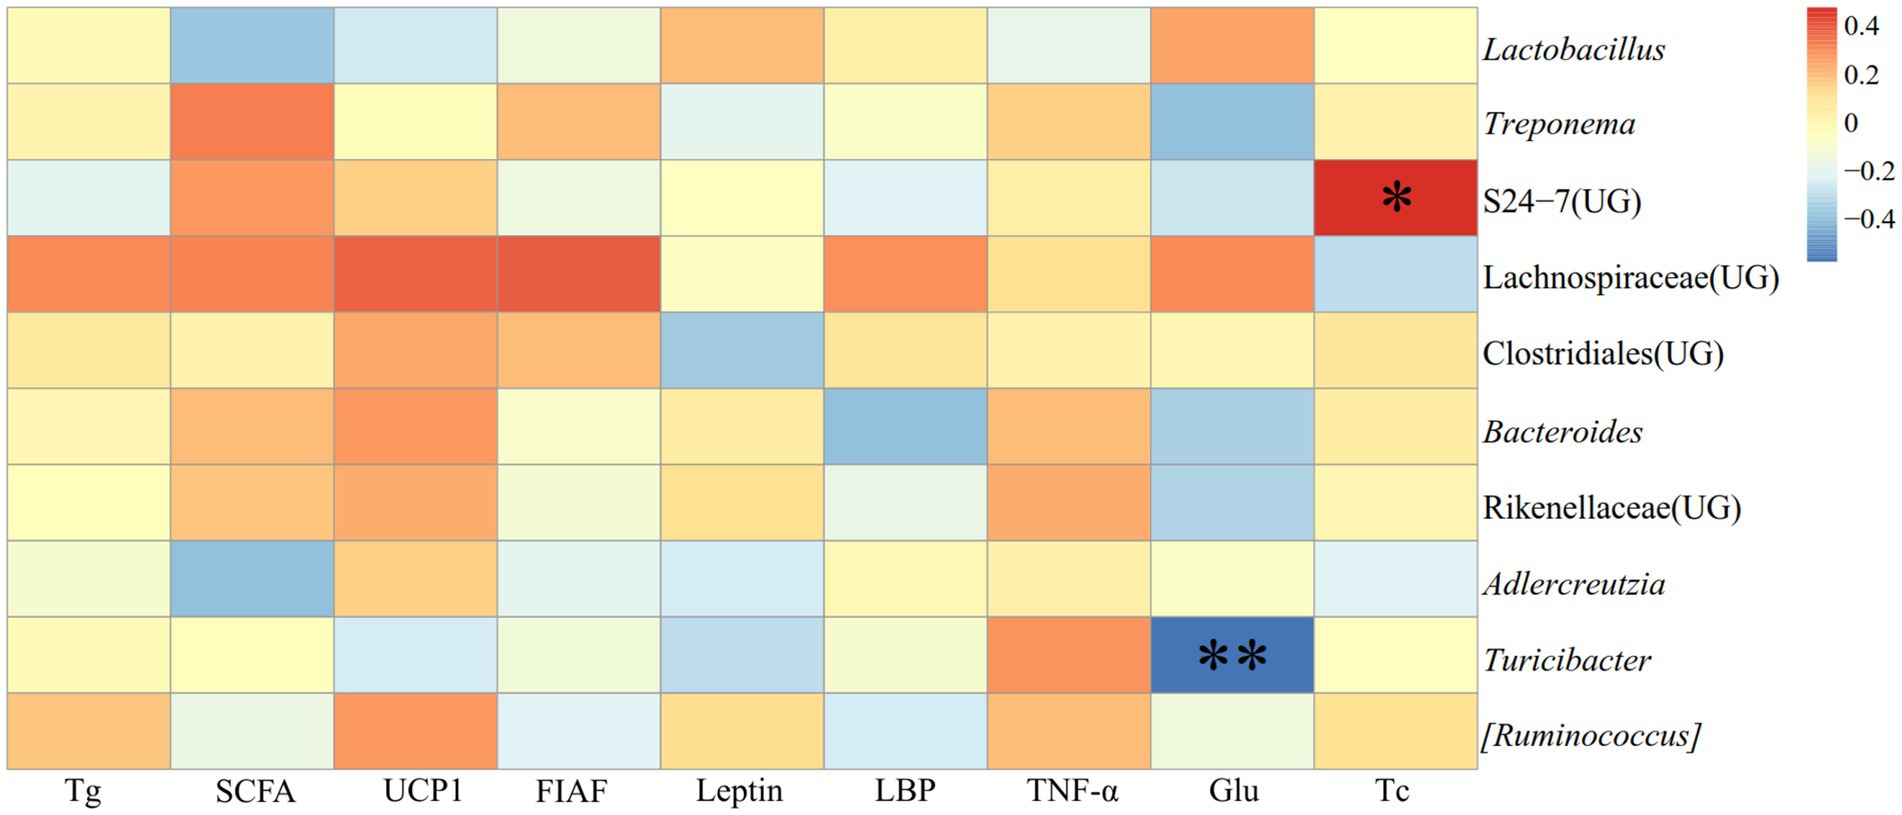
Figure 12. Heat map of the correlation between the detection indicators and the dominant microorganisms in the feces of E. miletus in JD.
Figure 13 displayed the relationship between physiological markers and fecal dominating genera (the top ten relative abundances of all samples) for E. miletus in XGLL. In comparison to the JD, XGLL had more physiological indications linked to the fecal dominating genus of E. miletus. Among them, Lactobacillus abundance was significantly negatively correlated (p < 0.05) with the majority of the physiological indicators (body mass, heart weight, liver weight, spleen weight, kidney weight, lung weight, WAT mass), whereas in contrast, Treponema abundance was significantly positively correlated (p < 0.05) with most of the physiological indicators (body mass, food intake, heart weight, liver weight, spleen weight, kidney weight, lung weight, WAT mass); BAT mass was significantly positively correlated (p < 0.05) with the abundance of Lachnospiraceae (UG), Clostridiales (UG), Bacteroides, and [Ruminococcus]. The abundance of AJDercreutzia was significantly negatively correlated (p < 0.05) with body mass, heart weight, and liver weight, and the abundance of Rikenellaceae (UG) was positively correlated (p < 0.05) with the abundance of food intake, liver weight, spleen weight, and lung weight. Furthermore, it showed a substantial positive correlation (p < 0.05) between lung weight and the majority of prominent species, including Treponema, Lachnospiraceae (UG), Clostridiales (UG), Rikenellaceae (UG), Turicibacter, and [Ruminococcus].
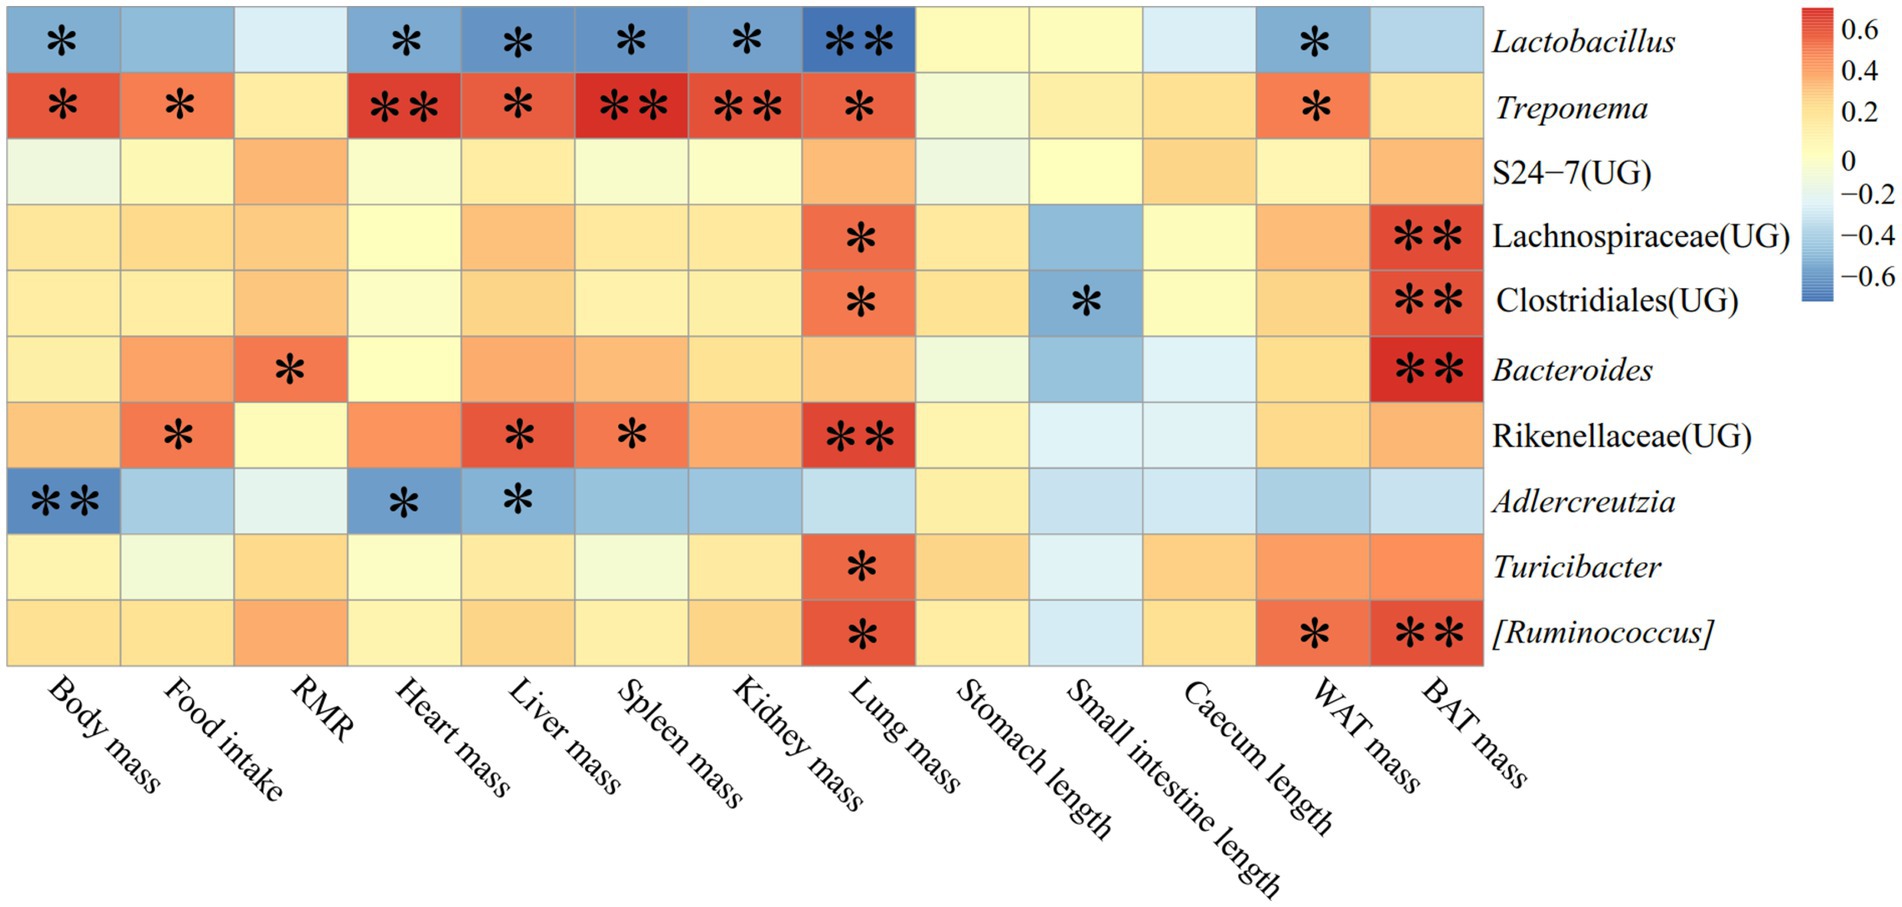
Figure 13. Heat map of physiological indicators related to the dominant microorganisms in the feces of E. miletus in XGLL.
Figure 14 illustrated the relationship between the detection indexes and the dominating genera (top ten relative abundance of all samples) in E. miletus in XGLL. TNF-α was significantly negatively correlated (p < 0.05) with S24-7 (UG) abundance; Glu and Tc were significantly positively correlated (p < 0.05) with Treponema and Rikenellaceae (UG) abundance; Tg was significantly and positively correlated (p < 0.05) with the abundance of Lachnospiraceae (UG), Clostridiales (UG), and Bacteroides; Leptin was significantly and negatively correlated (p < 0.05) with the abundance of Lactobacillus and significantly and positively correlated with the abundance of Treponema.
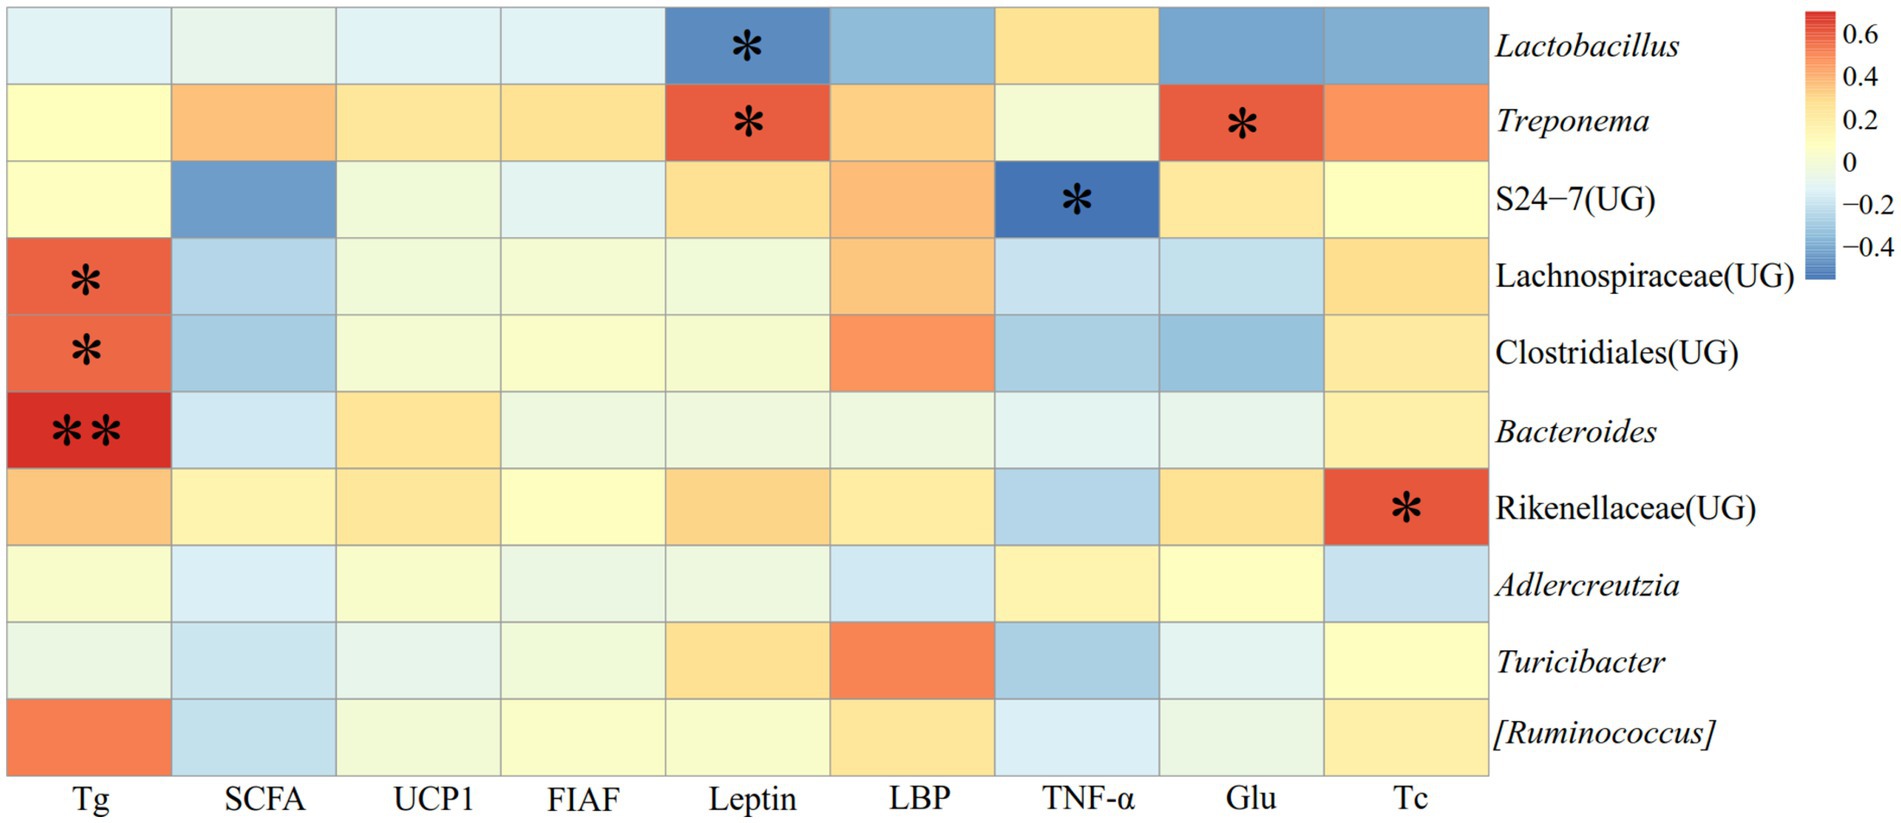
Figure 14. Heat map of the correlation between detected indicators and the dominant microorganisms in the feces of E. miletus in XGLL.
Figure 15 illustrated the relationship between various regional physiological markers and the fecal dominance OTUs in E. miletus. For instance, the abundance of denovo35645 (g_Lactobacillus) was negatively linked with food intake, lung weight, and BAT mass. The denovo52794 (g_Treponema) abundance showed a positive correlation with heart weight, liver weight, kidney weight, and lung weight, while the denovo14407 (g_Lactobacillus) abundance showed a negative correlation. Lung weight and BAT mass were positively correlated with denovo33406 (g_Turicibacter) abundance.
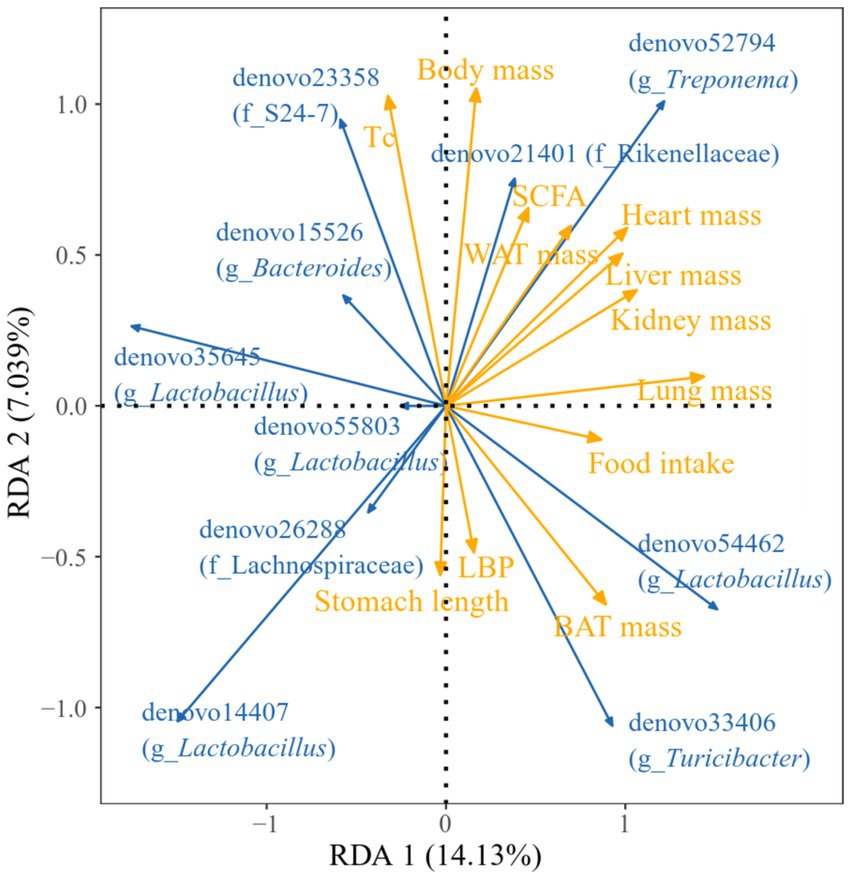
Figure 15. Redundancy analysis (RDA) of correlations between physiological indicators and dominant microbial communities. Blue arrows represent gut microbiota genera, yellow arrows represent physiological markers. The length of the physiological markers arrow can represent the influence of the factor on the gut microbiota. The angles between the arrows represent positive and negative correlations.
3.7 The fecal microbial co-occurrence network of Eothenomys miletus
The correlation network of the dominant OTUs found in the feces of E. miletus from various regions as shown in Figure 16. In this network, the top 200 OTUs by relative abundance were included. Gephi 0.9.2 was used to create a network with 200 nodes and 502 edges, of which 501 were positive and 1 was negative, suggesting that the microorganisms in the co-occurring network of this dominant OTU primarily interact cooperatively.
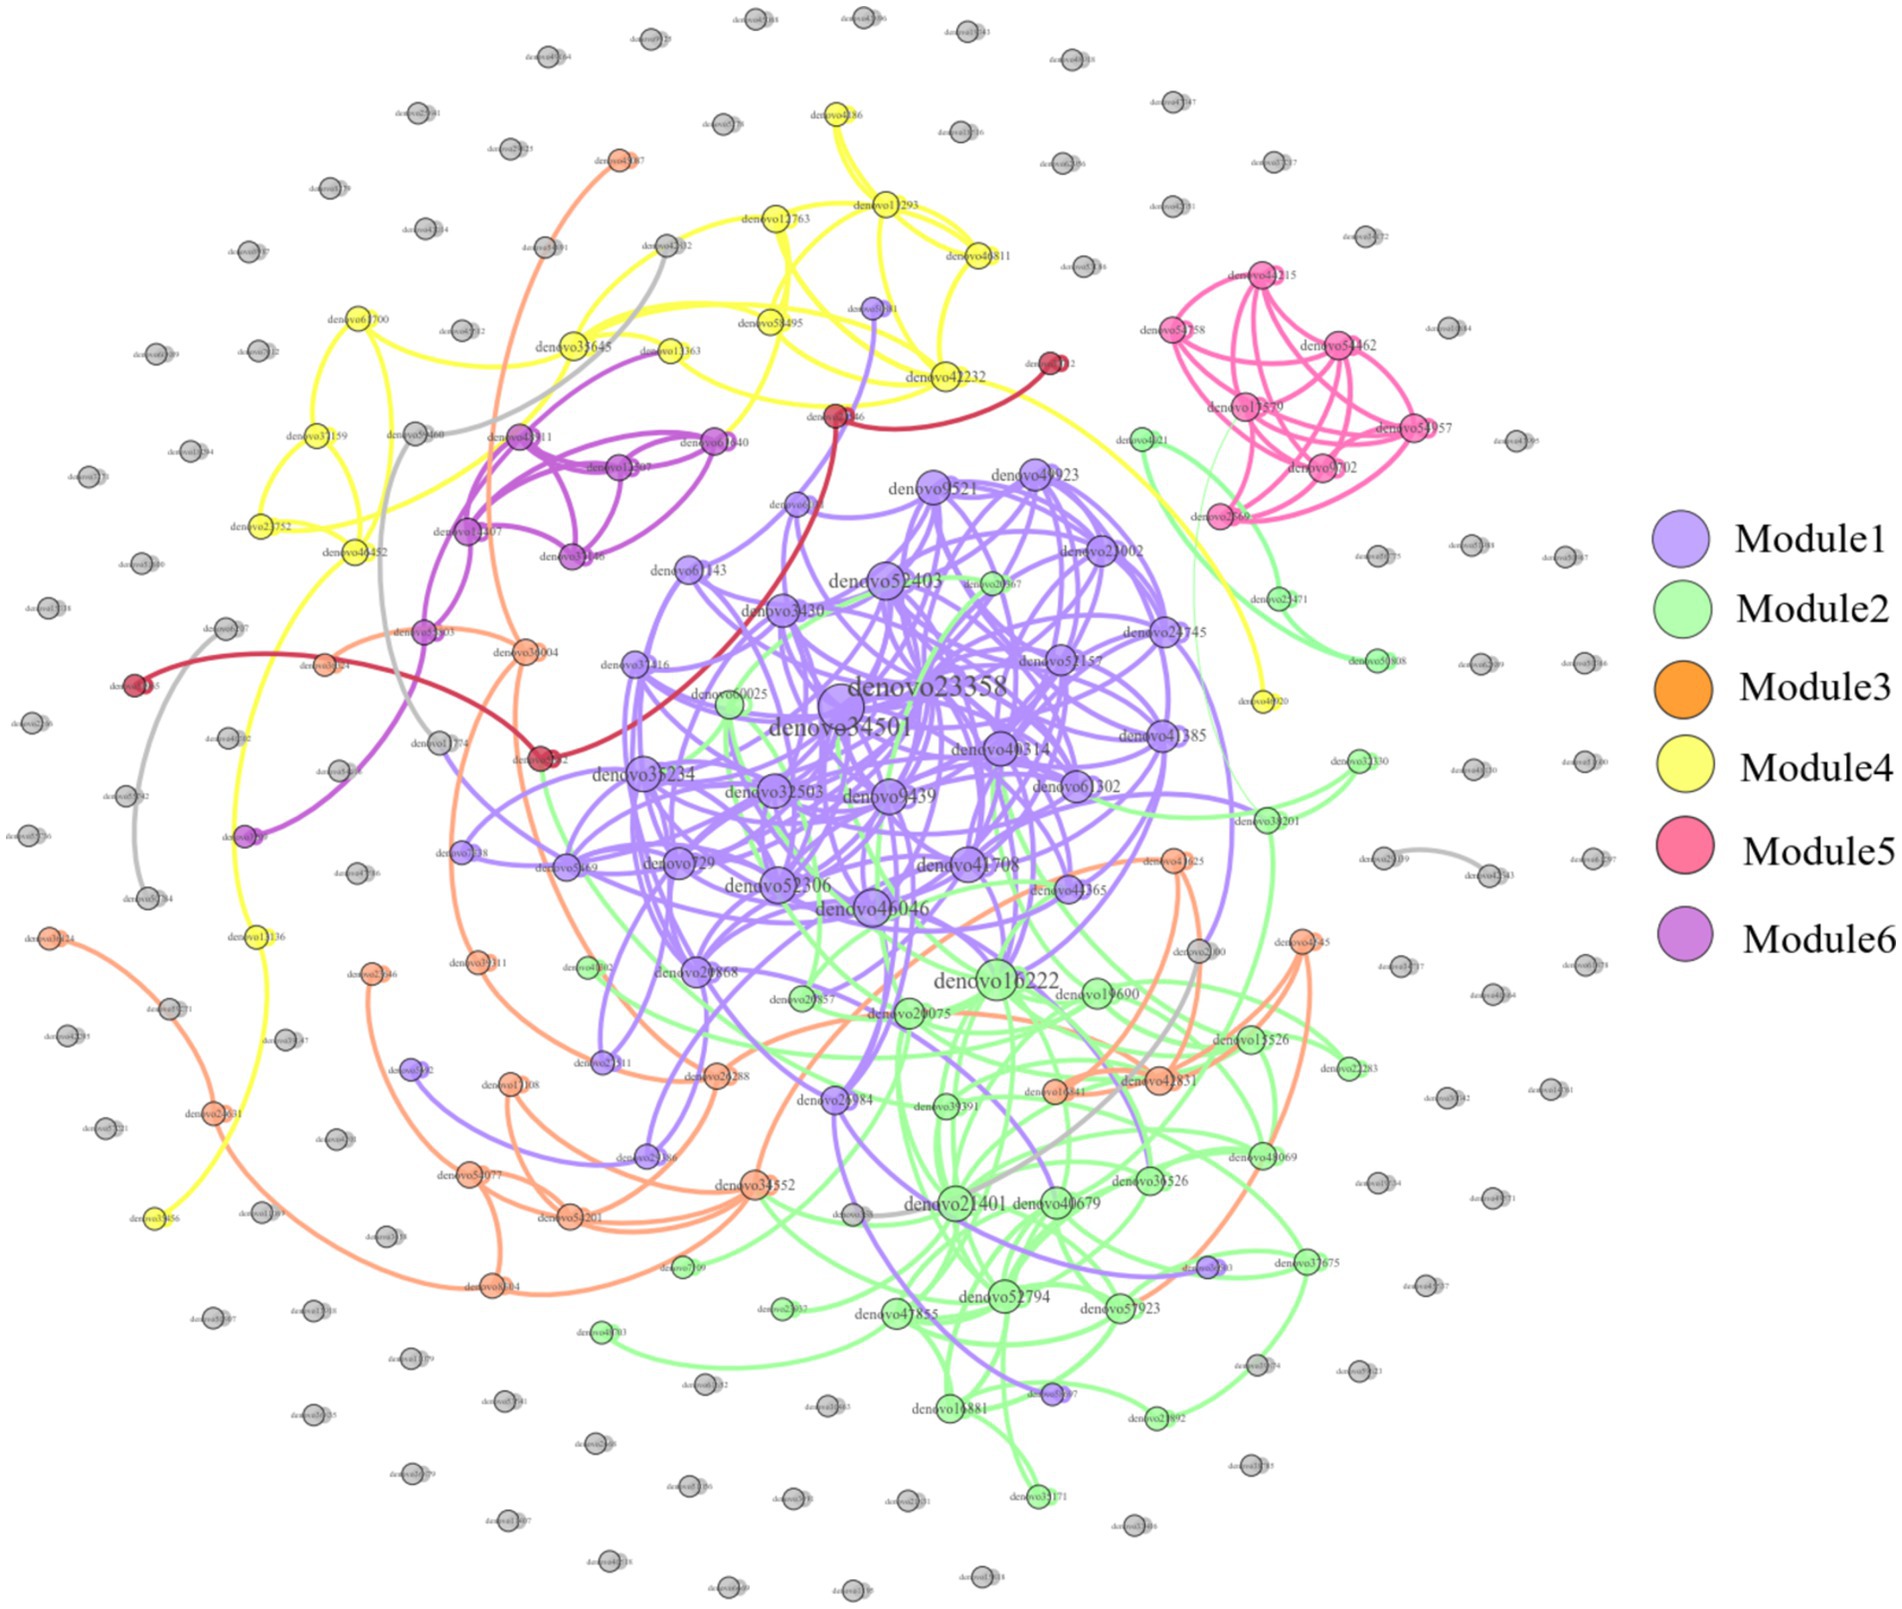
Figure 16. Dominant OTU co-occurrence network of feces of E. miletus in all regions. The size of each node is proportional to the number of connections, each module is presented as a specific color.
4 Discussion
4.1 Eothenomys miletus in high-altitude had smaller body weights, higher RMR, longer cecums, greater BAT weights, and lower leptin levels under restricted food conditions
Eothenomys miletus in JD and XGLL had drastically different body mass, RMR, cecum length, BAT weight, and leptin level in the control group. XGLL had a higher elevation compared to JD, and smaller body mass of E. miletus may suggest that it has some degree of size adaption in high-altitude regions. Since body size affects practically all physiological, behavioral, and ecological feature of mammals, changes in body size are typically a crucial approach for adapting to rapidly changing environmental situations (Searing et al., 2023). Rats’ larger lung-to-body-weight ratio might help maintaining respiratory efficiency in an oxygen-sparse high-altitude environment by improving the body’s capacity to absorb, transport, and diffuse oxygen (Shao et al., 2010). Furthermore, higher RMR indicated that rats use more energy to sustain body temperature, perform vital functions, and cope with food scarcity in the high-altitude setting. For small and winter-active rats to survive in high-elevation environments, sustained aerobic thermogenesis is necessary (Storz et al., 2019). The cecum contains fiber hydrolase (Frias et al., 2023), and a longer cecum may indicate that E. miletus consume more cellulose at high elevations, which calls for longer cecums to facilitate the digestion of cellulose. The larger BAT weight suggested that E. miletus need more calories to stay warm while at high altitudes. Lower levels of the hormone leptin, which controls hunger and energy metabolism and is mostly produced by adipocytes (Perakakis et al., 2021), and lower levels of leptin may indicate E. miletus had an increased appetite at high altitude and need to consume more food to satisfy their energy requirements. After re-feeding, larger changes in body mass, RMR and liver weight were observed in JD than in XGLL, which may be related to their larger body mass. We suggesting that different physiological adaptation may be used by E. miletus living in the XGLL to cope with food restriction. These strategies could include improving energy use pathways and lowering activity levels to avoid needless energy consumption.
4.2 Reduced α diversity of gut microorganisms and number of OTUs in high altitude Eothenomys miletus under restricted food conditions
In this experiment, the dominant phyla in E. miletus from different regions were the Firmicutes, Bacteroidetes and Spirochaetes. The Chao1 index was used to assess the community’s richness, and the larger the value, the higher the species richness (Wang et al., 2020). A steady and nutrient-rich environment supplied by the host is also necessary for the survival and reproduction of gut microbes (Bäckhed et al., 2004). The gut microbiota of E. miletus in XGLL abundance declined following food restriction, according to α diversity analysis. This could be explained by the fact that there was less food available at higher altitudes, which led the organisms to respond by reducing the number of certain microorganisms in order to conserve energy. Higher Shannon index has been found to correlate with better bacterial community stabilization and increased disease resistance (Liu et al., 2023). The results of the food restriction treatment indicated that food reduction may result in a decrease in the stability of the bacterial community in the intestinal tract, which weakens their resistance to disease. Shannon index of E. miletus was lower in XGLL than that of in JD, that is contrary to previous studies on the intestinal microbiota of goats (Zhang et al., 2024). We speculated that this phenomenon occurs because of differences in physiology, digestive systems, and behavior between E. miletus and goats, which influence their reliance on and selection of gut microbiota. E. miletus may be more dependent on specific microbes to cope with high altitude environments, whereas goats’ digestive systems may be more inclined to promote microbial diversity. Moreover, there is a non-significant decreasing trend in Shannon’s index in E. miletus in both JD and XGLL.
The animals exhibit broader diversity of gut community as the altitude increases, which is consistent with the adaptation of rhesus monkey and plateau pika gut microbes to high-altitude environments (Li et al., 2018; Wu et al., 2020). A comparison of the JD and XGLL control groups revealed that the gut community richness of E. miletus was greater at higher altitudes. Animals that live at high altitudes have a variety of environmental obstacles, including low temperatures, reduced oxygen levels, and higher UV radiation (Liu, 2020). To adapt to these changes, their gut microbiota has undergone adaptive alterations. The animal gut microbiota is more adaptive due to the increased community diversity, and it can aid the host in surviving and thriving in the relatively harsh environment of high altitude. Important ecological traits of gut community include stability, resistance, and resilience (Lozupone et al., 2012). It showed that the β diversity of gut microbiota in E. miletus was not significantly affected by food restriction treatments or different regions, which was inconsistent with the results of previous studies of gut microbiota in wild pikas. Plateau pika (Ochotona curzoniae) is an important high-altitude model animal, the β-diversity of their gut microbiota increased with elevation (Li et al., 2019), but for E. miletus, their diet was relatively monotonous, indicating that the gut microbial community of E. miletus was relatively stable and resistant to some degree of external interference.
In the present study, there were less OTUs in XGLL than in JD. Rhesus monkeys and bumblebees both showed a decline in the OTUs of gut bacteria with an increase in altitude, reflecting that the gut community has adapted to the high-altitude environment (Wu et al., 2020; Zhang et al., 2023). We speculated that only microorganisms adapted to this more extreme environment may survive at high altitude, as a result of a natural selection pressure exerted by the comparatively harsh environment of high altitude on animal gut microbiota. In the JD and XGLL regions, there was little difference between endemic and shared microorganisms. Animal gut microbial communities are frequently greatly impacted by their host species (Wang et al., 2022). Research has demonstrated that at varying elevations, the variety and quantity of gut microbiota in striped strong-ribbed lizards are similar (Montoya-Ciriaco et al., 2020). There is minimal diversity in the gut microbial species of the same animal species since their physiological traits and metabolic processes are comparable throughout geographic regions. Furthermore, individual gut microbiota abundance is more stable over time, and the effects of environmental differences across different places may not be significant (Chen et al., 2021). Animal gut microbiota may therefore stay essentially unchanged in a variety of settings.
The genera of gut microbes enriched in E. miletus in JD and XGLL can be divided into Bacteroidetes and Firmicutes, as the enrichment analysis graph illustrated. In contrast to the Bacteroidetes in JD, the microorganisms in the control groups were richer in Firmicutes in XGLL due to its higher elevation, less plant growth, and food scarcity. Bacteriophages can break down proteins and carbohydrates, while Firmicutes can break down a greater variety of organic materials and fibers (Waite and Taylor, 2014; He et al., 2023). Because Firmicutes was physiologically well-adapted and breaks down fiber more forcefully, E. miletus may be more dependent on them for energy at higher elevations. Firmicutes, which contain genes involved in energy metabolism, showed a notable enrichment in the food restriction groups in both locations (Kaakoush, 2015), and Bacteroidetes, which breaks down polysaccharides (McKee et al., 2021). E. miletus may be altering their energy intake and metabolism mechanisms to gather energy more efficiently, as evidenced by the phenomenon’s occurrence after food limitation. Further, it can be shown that AJDercreutzia was enriched in XGLL but not in JD when comparing the genera enriched in the food restriction group in both locations. By producing isoflavones through metabolism, AJDercreutzia can have anti-inflammatory properties (Galipeau et al., 2021). Isoflavones possess anti-inflammatory, anti-oxidant, immunomodulatory, and antifibrotic qualities (Alipour and Karimi-Sales, 2020). Furthermore, it has the potential to mitigate irritable bowel syndrome and improve intestinal community (Huang et al., 2022). Thus, we speculated that in a high-altitude, food-limited environment, the gut microbiota of E. miletus experienced distinct adaptive modifications in response to potential inflammatory reactions.
4.3 Most of the gut microbes were significantly correlated with physiological indicators, and gut microbes were adapted to the high-altitude environment by enriching for fat metabolism-promoting and cellulose-degrading bacterial genera
Figure 11 demonstrated the significant and negative correlation between BAT mass and the presence of Bacteroides and Ruminococcus, as well as the strong and negative correlation between WAT mass and the abundance of Turicibacter. Small mammals’ BAT, which uses energy to generate heat (Ghesmati et al., 2024). Following a food restriction, BAT’s weight decreased in E. miletus. Because of its potent ability to use polysaccharides, Bacteroides can nourish other bacteria and promote the symbiotic relationship of the gut community (Rakoff-Nahoum et al., 2016). Reduced food intake brought on by an increase in altitude may result in an increase in Bacteroides abundance, which would facilitate the organism’s adaptation to a food shortfall. This will improve how well food sugars are absorbed and used. Studies have indicated that a notable proportion of rumen bacteria are called Ruminococcus, and that diets high in fiber often lead to an increase in Ruminococcus abundance (Morrison and Miron, 2000). Our results were consistent, and one possible reason was that when food intake was restricted at high altitude and the food’s fiber content was contained, Ruminococcus becomes more numerous, making better use of the limited nutritional resources. When one consumes less food, their body breaks down WAT to replenish lost energy from daily metabolism. WAT functions as an energy reserve, an endocrine organ that regulates whole-body metabolism, and a source of fatty acids for other tissues through lipolysis as needed (Qian et al., 2022). In rodent and human studies, the relative abundance of Turicibacter is usually negatively correlated with dietary fat (Lynch et al., 2023). The fact that Turicibacter abundance increased following the dietary restriction treatment is likewise in line with our findings. Thus, WAT mass showed a significant negative correlation with Turicibacter abundance.
The majority of the physiological parameters of E. miletus in XGLL corresponded with the predominant genus of gut microorganisms. A significant negative association was seen between the abundance of Lactobacillus and most physiological indices, such as body mass, liver weight, heart weight. Lactobacillus abundance was significantly increased in both animal and human obesity studies (Drissi et al., 2017), which is closely related to the physiological functions of Lactobacillus. Lactobacillus can affect the balance of the intestinal community (Walter, 2008), producing lactic acid and short chain fatty acids that lower the pH of the intestinal tract and regulating the adaptation of other bacteria (Slattery et al., 2019). These acids can aid in weight control by improving lipolysis and oxidation and reducing the formation and accumulation of fat. They can also regulate energy and fat metabolism. At low pH values and in bile, lactobacillus can survive (Lynch et al., 2023). Additionally, by promoting the release of host antimicrobial peptides, acetic acid and propionic acid, which are generated by metabolism, can function as antimicrobials (Fukuda et al., 2011), which helps to maintain intestinal health. Furthermore, by producing short-chain fatty acids, Lactobacillus can induce the body to release the tyrosyl peptide PYY and glucagon-like peptide 1 (GLP-1) (Psichas et al., 2015). PYY controls intestinal motility, improves satiety, and decreases food intake, which lowers body mass; SCFAs suppress appetite and energy intake by encouraging the synthesis and secretion of PYY and GLP-1 by intestinal epithelial gland cells; and GLP-1 increases insulin secretion and sensitivity in the body, which prevents stomach emptying and encourages intestinal peristalsis (Delzenne et al., 2005; Byrne et al., 2015; Chambers et al., 2015). In our study, it showed that there had a positive correlation between Tc and S24-7(UG) abundance. It has been demonstrated that diabetic-sensitive animals given a high-fat diet have an increase in S24-7 abundance (Serino et al., 2012). This supports our findings that the body speeds up lipid metabolism to provide energy for daily tasks when food intake is restricted. It also restricted the amount of dietary cholesterol that is available and the liver’s rate of synthesis. It has been proven that Turicibacter influences bile acids and lipids in the host, which can lower adipose tissue mass and serum cholesterol (Lynch et al., 2023). Following food limitation, blood levels of glu drop, and Turicibacter may supply energy by increasing the abundance of the bacteria that break down fat and cholesterol. Adipose tissue secretes the hormone leptin, and the amount of this hormone in the serum varies with the size of the animal’s adipose tissue (Friedman and Halaas, 1998). In adipose tissue, Lactobacillus stimulates oxidative phosphorylation, which increases energy expenditure (Yoon et al., 2020). Therefore, there was a negative correlation between leptin and Lactobacillus quantity.
It showed that Treponema and Bacteroides, the two predominant bacteria of E. miletus in XGLL, helped E. miletus adapt to the high-altitude habitat. It has been shown that Treponema is associated with cellulose degradation (Baniel et al., 2021). Cellulose, a major component of plant cell walls, was also frequently present in plant-based diets that E. miletus may eat. Therefore, when there was a shortage of food, Treponema may help the body use dietary resources more effectively for energy and nutrients by breaking down polysaccharides. It has been demonstrated that Bacteroides stimulate the bile acid-TGR5-PPAR-α axis to activate fat oxidation in adipose tissue (Yang et al., 2017). Tg and Bacteroides abundance showed a positive correlation, which may indicate that Bacteroides promoted fatty acid oxidative degradation, which increased the host body’s energy source and helps E. miletus survive and proliferate in high-altitude environments.
RAD analysis showed that the physiological parameters of E. miletus responded differently to the relative abundance of distinct dominating bacteria in its intestine. The interactions within the intestinal population of E. miletus could be the cause of the occurrence. Figure 14 demonstrated the positive and negative correlations, respectively, between the abundance of Lactobacillus and Turicibacter and BAT mass. BAT mass was an important effector tissue for adaptive thermogenesis in humans and rodents (Greenhill, 2024), and was also linked to energy metabolism and body mass regulation (Liu et al., 2020). Turicibacter can modify lipid and bile acid metabolism, which impacts host lipid metabolism (Lynch et al., 2023). Therefore, by affecting bile acid and lipid metabolism, Turicibacter may indirectly alter BAT, however, more research is required to identify the precise mechanisms and effects. In the gut, Lactobacillus is a probiotic that controls key elements of the microbial community (Shi et al., 2024; Mani-López et al., 2022). Hence, we postulated that Lactobacillus might affect host energy balance and lipid metabolism via altering the composition of the gut microbial community. Network analysis is frequently used to infer the microbiome under theories of symbiosis, parasitism, and competition (Weiss et al., 2016). The co-occurrence network analysis reveals that microbes mostly cooperate with one another to support the stability and well-being of the gut environment.
5 Conclusion
The present study revealed the complex changes in gut community and physiological characteristics triggered by changes in the amount of food fed after food restriction in E. miletus captured at different altitudes. In this study, we discovered that while gut microbiota in E. miletus facilitates adaptation to high altitude, dietary limitation alters the composition of gut microbiota. Gut microbes cooperated to regulate metabolism and immunity during food shortage at high altitude. Smaller body mass, higher RMR, longer cecum, larger BAT weight, and lower leptin level were seen in E. miletus that survived at high altitudes. Changes in gut microbiota and physiological characteristics affecting flora species interactions and energetic homeostasis were significant in the adaptation of E. miletus to high altitude food fluctuations, providing a theoretical basis for future research on the mechanisms of high-altitude animal adaptation to the environment. Moreover, there is a connection between gut microbiota and physiological functions, but further research is required as a result of the current study’s inability to determine the precise mechanisms of this interaction.
Data availability statement
The datasets presented in this study can be found in online repositories. The names of the repository/repositories and accession number(s) can be found at: https://www.ebi.ac.uk/ena, PRJEB63215; https://figshare.com/, doi.org/10.6084/m9.figshare.27063499.
Ethics statement
The animal study was approved by all animal operation procedures comply with the rules of Animals Care and Use Committee of School of Life Sciences, Yunnan Normal University. This study was approved by the Committee (13-0901-011). The study was conducted in accordance with the local legislation and institutional requirements.
Author contributions
TZ: Investigation, Methodology, Writing – original draft. TJ: Investigation, Methodology, Writing – original draft. WZ: Conceptualization, Funding acquisition, Investigation, Writing – review & editing. LF: Conceptualization, Funding acquisition, Writing – review & editing.
Funding
The author(s) declare that financial support was received for the research, authorship, and/or publication of this article. This work was financially supported by the National Natural Scientific Foundation of China (32160254, 32060115), Yunnan Fundamental Research Projects (202401AS070039), Yunnan Ten Thousand Talents Plan Young & Elite Talents Project (YNWR-QNRC-2019-047).
Conflict of interest
The authors declare that the research was conducted in the absence of any commercial or financial relationships that could be construed as a potential conflict of interest.
The author(s) declared that they were an editorial board member of Frontiers, at the time of submission. This had no impact on the peer review process and the final decision.
Publisher’s note
All claims expressed in this article are solely those of the authors and do not necessarily represent those of their affiliated organizations, or those of the publisher, the editors and the reviewers. Any product that may be evaluated in this article, or claim that may be made by its manufacturer, is not guaranteed or endorsed by the publisher.
References
Alipour, M. R., and Karimi-Sales, E. (2020). Molecular mechanisms of protective roles of isoflavones against chemicals-induced liver injuries. Chem. Biol. Interact. 329:109213. doi: 10.1016/j.cbi.2020.109213
Bäckhed, F., Ding, H., Wang, T., Hooper, L. V., Koh, G. Y., Nagy, A., et al. (2004). The gut microbiota as an environmental factor that regulates fat storage. Proc. Natl. Acad. Sci. USA 101, 15718–15723. doi: 10.1073/pnas.0407076101
Baniel, A., Amato, K. R., Beehner, J. C., Bergman, T. J., Mercer, A., Perlman, R. F., et al. (2021). Seasonal shifts in the gut microbiome indicate plastic responses to diet in wild geladas. Microbiome 9:26. doi: 10.1186/s40168-020-00977-9
Byrne, C. S., Chambers, E. S., Morrison, D. J., and Frost, G. (2015). Therole of short chain fatty acids in appetite regulation and energy homeostasis. Int. J. Obes. 39, 1331–1338. doi: 10.1038/ijo.2015.84
Chambers, E. S., Morrison, D. J., and Frost, G. (2015). Control of appetite and energy intake by SCFA: what are the potential underlying mechanisms? Proc. Nutr. Soc. 74, 328–336. doi: 10.1017/S0029665114001657
Chen, H. B., Jia, T., Zhang, H., Wang, Z. K., and Zhu, W. L. (2022). Exogenous melatonin can reduce body mass in Eothenomys miletus by regulating food intake and thermogenesis. Zool. Res. 57, 880–896. doi: 10.13859/j.cjz.202206008
Chen, L. M., Wang, D. M., Garmaeva, S., Kurilshikov, A., Vich Vila, A., Gacesa, R., et al. (2021). The long-term genetic stability and individual specificity of the human gut microbiome. Cell 184, 2302–2315.e12. doi: 10.1016/j.cell.2021.03.024
Dai, X., Han, Y. X., Shen, Q. Y., Tang, H., Cheng, L. Z., Yang, F. P., et al. (2023). Effect of food restriction on food grinding in Brandt's voles. Animals (Basel). 13:3424. doi: 10.3390/ani13213424
Del Valle, J. C., Busch, C., and Mañanes, A. A. L. (2006). Phenotypic plasticity in response to low quality diet in the south American omnivorous rodent Akodon azarae (Rodentia: Sigmodontinae). Comp. Biochem. Physiol. A Mol. Integr. Physiol. 145, 397–405. doi: 10.1016/j.cbpa.2006.07.013
Delzenne, N. M., Cani, P. D., Daubioul, C., and Neyrinck, A. M. (2005). Impact of inulin and oligofructose on gastrointestinal peptides. Br. J. Nutr. 93, S157–S161. doi: 10.1079/bjn20041342
Drissi, F., Raoult, D., and Merhej, V. (2017). Metabolic role of lactobacilli in weight modification in humans and animals. Microb. Pathog. 106, 182–194. doi: 10.1016/j.micpath.2016.03.006
Frias, H., Murga Valderrama, N. L., Flores, G. J., Cornejo, V. G., Del Solar, J. C., and Romani, A. C. (2023). An analysis of the cecum microbiome of three breeds of the guinea pig: Andina, inti, and Peru. Res. Vet. Sci. 161, 50–61. doi: 10.1016/j.rvsc.2023.06.005
Friedman, J. M., and Halaas, J. L. (1998). Leptin and the regulation of body weight in mammals. Nature 395, 763–770. doi: 10.1038/27376
Fukuda, S., Toh, H., Hase, K., Oshima, K., Nakanishi, Y., Yoshimura, K., et al. (2011). Bifidobacteria can protect from enteropathogenic infection through production of acetate. Nature 469, 543–547. doi: 10.1038/nature09646
Galipeau, H. J., Caminero, A., Turpin, W., Bermudez-Brito, M., Santiago, A., Libertucci, J., et al. (2021). Novel fecal biomarkers that precede clinical diagnosis of ulcerative colitis. Gastroenterology 160, 1532–1545. doi: 10.1053/j.gastro.2020.12.004
Geng, X., Qu, C., Zhao, L., Zhang, J., Huang, P., Gao, D., et al. (2023). Effects of high−/low-temperature and high-altitude hypoxic environments on gut microbiota of sports people: a retrospective analysis. Sports Med. Health Sci. 5, 83–90. doi: 10.1016/j.smhs.2023.03.003
Ghesmati, Z., Rashid, M., Fayezi, S., Gieseler, F., Alizadeh, E., and Darabi, M. (2024). An update on the secretory functions of brown, white, and beige adipose tissue: towards therapeutic applications. Rev. Endocr. Metab. Disord. 25, 279–308. doi: 10.1007/s11154-023-09850-0
Gong, X. N., Jia, T., Zhang, H., Wang, Z. K., and Zhu, W. L. (2021). Physiological and behavioral responses of Eothenomys miletus in different elevations of Hengduan mountain to high-sugar diet. Zool. Res. 56, 569–581. doi: 10.13859/j.cjz.202104009
Gong, X. N., Jia, T., Zhang, D., and Zhu, W. L. (2022). Faster response to high-fat diet in body mass regulation from lower altitude population in Eothenomys miletus from Hengduan Mountain regions. Pakist. J. Zool. 54, 167–174. doi: 10.17582/journal.pjz/20200211050216
Gong, Z. D., Wu, H. Y., Duan, X. D., Feng, X. G., Zhang, Y. Z., and Liu, Q. (2001). The species diversity and distribution trends of small mammals in Hengduan mountains, Yunnan. Biodivers. Sci. 9, 319–328. doi: 10.17520/biods.2001048
Greenhill, C. (2024). The role of brown adipose tissue in metabolic health. Nat. Rev. Endocrinol. 20:386. doi: 10.1038/s41574-024-00999-5
Guan, J., Long, K., Ma, J., Zhang, J., He, D., Jin, L., et al. (2017). Comparative analysis of the microRNA transcriptome between yak and cattle provides insight into high-altitude adaptation. Peer. J. 5:e3959. doi: 10.7717/peerj.3959
Hao, Y., Xiong, Y., Cheng, Y., Song, G., Jia, C., Qu, Y., et al. (2019). Comparative transcriptomics of 3 high-altitude passerine birds and their low-altitude relatives. Proc. Natl. Acad. Sci. USA 116, 11851–11856. doi: 10.1073/pnas.1819657116
He, Y. Y., Lin, R. J., Yu, X. M., Ma, Y. K., Li, J. L., and Xie, L. (2023). Simultaneous enhancement on lignocellulose degradation and humic acid formation using the electric field coupled with an iron anode in the co-composting of food waste and agricultural waste. Chem. Eng. J. 475:155846:145846. doi: 10.1016/J.CEJ.2023.145846
Huang, S. J., Hu, S. P., Liu, S., Tang, B., Liu, Y. J., Tang, L., et al. (2022). Lithium carbonate alleviates colon inflammation through modulating gut microbiota and Treg cells in a GPR43-dependent manner. Pharmacol. Res. 175:105992. doi: 10.1016/j.phrs.2021.105992
Kaakoush, N. O. (2015). Insights into the role of Erysipelotrichaceae in the human host. Front. Cell. Infect. Microbiol. 5:84. doi: 10.3389/fcimb.2015.00084
Keen-Rhinehart, E., and Bartness, T. J. (2008). Leptin inhibits food-deprivation-induced increases in food intake and food hoarding. Am. J. Physiol. Regul. Integr. Comp. Physiol. 295, R1737–R1746. doi: 10.1152/ajpregu.90512.2008
Koch, H., Cisarovsky, G., and Schmid-Hempel, P. (2012). Ecological effects on gut bacterial communities in wild bumblebee colonies. J. Anim. Ecol. 81, 1202–1210. doi: 10.1111/j.1365-2656.2012.02004.x
Lamo, D., Gahlawat, G., Kumar, S., Bharti, V. K., Ranjan, P., Kumar, D., et al. (2020). Morphometric, haematological and physio-biochemical characterization of Bactrian (Camelus bactrianus) camel at high altitude. BMC Vet. Res. 16:291. doi: 10.1186/s12917-020-02481-6
Li, H., Qu, J. P., Li, T. T., Wirth, S., Zhang, Y. M., Zhao, X. Q., et al. (2018). Diet simplification selects for high gut microbial diversity and strong fermenting ability in high-altitude pikas. Appl. Microbiol. Biotechnol. 102, 6739–6751. doi: 10.1007/s00253-018-9097-z
Li, D. Y., Xia, W. C., Cui, X. Y., Zhao, M., Huang, K., Wang, X. Y., et al. (2023). The putatively high-altitude adaptation of macaque monkeys: evidence from the fecal metabolome and gut microbiome. Evol. Appl. 16, 1708–1720. doi: 10.1111/eva.13595
Li, S., Young, T., Archer, S., Lee, K., and Alfaro, A. C. (2024). Gut microbiome resilience of green-lipped mussels, Perna canaliculus, to starvation. Int. Microbiol. 27, 571–580. doi: 10.1007/s10123-023-00397-3
Li, H., Zhou, R., Zhu, J. X., Huang, X. D., and Qu, J. P. (2019). Environmental filtering increases with elevation for the assembly of gut microbiota in wild pikas. Microb. Biotechnol. 12, 976–992. doi: 10.1111/1751-7915.13450
Liang, H., and Zhang, Z. B. (2003). Effect of food restriction on physiological conditions of small rodents. Acta. Theriol. Sin. 2, 175–182. doi: 10.16829/j.slxb.2003.02.014
Liu, Y. (2020). High-altitude adaptation in a flutter of sparrows. Natl. Sci. Rev. 7, 130–131. doi: 10.1093/nsr/nwz175
Liu, L. C., Tong, F., Li, H. H., Bin, Y. W., Ding, P., Peng, L., et al. (2023). Maturation, morphology, and function: the decisive role of intestinal flora on microglia: a review. J. Integr. Neurosci. 22:70. doi: 10.31083/j.jin2203070
Liu, J. Y., Zhang, C. H., Zhang, B. Y., Sheng, Y., Xu, W. T., Luo, Y. B., et al. (2020). Comprehensive analysis of the characteristics and differences in adult and newborn brown adipose tissue (BAT): newborn BAT is a more active/dynamic BAT. Cells 9:201. doi: 10.3390/cells9010201
Lozupone, C. A., Stombaugh, J. I., Gordon, J. I., Jansson, J. K., and Knight, R. (2012). Diversity, stability and resilience of the human gut microbiota. Nature 489, 220–230. doi: 10.1038/nature11550
Lynch, J. B., Gonzalez, E. L., Choy, K., Faull, K. F., Jewell, T., Arellano, A., et al. (2023). Gut microbiota turicibacter strains differentially modify bile acids and host lipids. Nat. Commun. 14:3669. doi: 10.1038/s41467-023-39403-7
Mani-López, E., Arrioja-Bretón, D., and López-Malo, A. (2022). The impacts of antimicrobial and antifungal activity of cell-free supernatants from lactic acid bacteria in vitro and foods. Compr. Rev. Food Sci. Food Saf. 21, 604–641. doi: 10.1111/1541-4337.12872
McKee, L. S., La Rosa, S. L., Westereng, B., Eijsink, V. G., Pope, P. B., and Larsbrink, J. (2021). Polysaccharide degradation by the Bacteroidetes: mechanisms and nomenclature. Environ. Microbiol. Rep. 13, 559–581. doi: 10.1111/1758-2229.12980
Montoya-Ciriaco, N., Gómez-Acata, S., Muñoz-Arenas, L. C., Dendooven, L., Estrada-Torres, A., Díaz de la Vega-Pérez, A. H., et al. (2020). Dietary effects on gut microbiota of the mesquite lizard Sceloporus grammicus (Wiegmann,1828) across different altitudes, Dietary effects on gut microbiota of the mesquite lizard Sceloporus grammicus (Wiegmann, 1828) across different altitudes. Microbiome 8:6. doi: 10.1186/s40168-020-0783-6
Morrison, M., and Miron, J. (2000). Adhesion to cellulose by Ruminococcus albus: a combination of cellulosomes and Pil-proteins? FEMS Microbiol. Lett. 185, 109–115. doi: 10.1111/j.1574-6968.2000.tb09047.x
Mu, Y., Ma, Z. Q., Zhu, W. L., Zhang, D., and Wang, Z. K. (2014). Study of body mass, thermogenesis and relative fatness in Eothenomy miletus from Yunnan Province. J. Yunnan Normal Univ. 81, 227–234. doi: 10.1080/11250003.2014.902511
Perakakis, N., Farr, O. M., and Mantzoros, C. S. (2021). Leptin in leanness and obesity: JACC state-of-the-art review. J. Am. Coll. Cardiol. 77, 745–760. doi: 10.1016/j.jacc.2020.11.069
Psichas, A., Sleeth, M. L., Murphy, K. G., Brooks, L., Bewick, G. A., Hanyaloglu, A. C., et al. (2015). The short chain fatty acid propionate stimulates GLP-1 and PYY secretion via free fatty acid receptor 2 in rodents. Int. J. Obes. 39, 424–429. doi: 10.1038/ijo.2014.153
Qian, X. M., Meng, X., Zhang, S., and Zeng, W. (2022). Neuroimmune regulation of white adipose tissues. FEBS J. 289, 7830–7853. doi: 10.1111/febs.16213
Rakoff-Nahoum, S., Foster, K. R., and Comstock, L. E. (2016). The evolution of cooperation within the gut microbiota. Nature 533, 255–259. doi: 10.1038/nature17626
Searing, K. B., Lomolino, M. V., and Rozzi, R. (2023). Melting climates shrink north American small mammals. Proc. Natl. Acad. Sci. USA 120:e2310855120. doi: 10.1073/pnas.2310855120
Serino, M., Luche, E., Gres, S., Baylac, A., Bergé, M., Cenac, C., et al. (2012). Metabolic adaptation to a high-fat diet is associated with a change in the gut microbiota. Gut 61, 543–553. doi: 10.1136/gutjnl-2011-301012
Shao, B., Long, R., Ding, Y., Wang, J., Ding, L., and Wang, H. (2010). Morphological adaptations of yak (Bos grunniens) tongue to the foraging environment of the Qinghai-Tibetan plateau. J. Anim. Sci. 88, 2594–2603. doi: 10.2527/jas.2009-2398
Shi, S. Q., Ge, M. R., Xiong, Y., Zhang, Y. X., Li, W. H., Liu, Z. M. Z., et al. (2024). The novel probiotic preparation based on Lactobacillus spp. mixture on the intestinal bacterial community structure of Cherry Valley duck. World J. Microbiol. Biotechnol. 40:194. doi: 10.1007/s11274-023-03859-y
Slattery, C., Cotter, P. D., and O'Toole, P. W. (2019). Analysis of health benefits conferred by lactobacillus species from kefir. Nutrients 11:1252. doi: 10.3390/nu11061252
Storz, J. F., Cheviron, Z. A., McClelland, G. B., and Scott, G. R. (2019). Evolution of physiological performance capacities and environmental adaptation:insights from high-elevation deer mice (Peromyscus maniculatus). J. Mammal. 100, 910–922. doi: 10.1093/jmammal/gyy173
Su, L. T., Liu, X. X., Jin, G. Y., Ma, Y., Tan, H. X., Khad, M., et al. (2021). Habitat elevation shapes microbial community composition and alter themetabolic functions in wild sable (Martes zibellina) guts. Animals (Basel). 11:865. doi: 10.3390/ani11030865
Waite, D. W., and Taylor, M. W. (2014). Characterizing the avian gut microbiota: membership, driving influences, and potential function. Front. Microbiol. 5:223. doi: 10.3389/fmicb.2014.00223
Walter, J. (2008). Ecological role of lactobacilli in the gastrointestinal tract:implications for fundamental and biomedical research. Appl. Environ. Microbiol. 74, 4985–4996. doi: 10.1128/AEM.00753-08
Wang, Y., Shi, Y., Li, W., Wang, S., Zheng, J., Xu, G., et al. (2022). Gutmicrobiota imbalance mediates intestinal barrier damage in high-altitude exposed mice. FEBS J. 289, 4850–4868. doi: 10.1111/febs.16409
Wang, Z. Y., Zhang, C., Li, G. L., and Yi, X. F. (2022). The influence ofspecies identity and geographic locations on gut microbiota of small rodents. Front. Microbiol. 13:983660. doi: 10.3389/fmicb.2022.983660
Wang, P., Zhao, C., Lu, F. G., Wu, T., Wei, K., Li, L., et al. (2020). Effect of influenza a virus infection on pulmonary flora and chemokines CCL5 and CXCL10 in mice and intervention of maxing Shigan decoction. Chin. Tradit. Herb. Drug 51, 5523–5537. doi: 10.7501/j.issn.0253-2670.2020.21.017
Weiss, S., Van Treuren, W., Lozupone, C., Faust, K., Friedman, J., Deng, Y., et al. (2016). Correlation detection strategies in microbial data sets vary widely in sensitivity and precision. ISME J. 10, 1669–1681. doi: 10.1038/ismej.2015.235
Wu, Y. H., Yao, Y. F., Dong, M. M., Xia, T. R., Li, D. Y., Xie, M., et al. (2020). Characterisation of the gut microbial community of rhesus macaques in high-altitude environments. BMC Microbiol. 20:68. doi: 10.1186/s12866-020-01747-1
Yan, B. W., Jia, T., Wang, Z. K., and Zhu, W. L. (2022). Comparative research of intestinal microbiota diversity and body mass regulation in Eothenomys miletus from different areas of Hengduan mountain regions. Front. Microbiol. 13:1026841. doi: 10.3389/fmicb.2022.1026841
Yang, J. Y., Lee, Y. S., Kim, Y., Lee, S. H., Ryu, S., Fukuda, S., et al. (2017). Gut commensal bacteroides acidifaciens prevents obesity and improves insulin sensitivity in mice. Mucosal Immunol. 10, 104–116. doi: 10.1038/mi.2016.42
Yang, S. C., Zhu, W. L., Zheng, J., Zhang, D., Mu, Y., and Wang, Z. K. (2013). Effect of mild and sever food restriction on body mass and thermogenesis in Eothenomys miletus. Sichuan J. Zool. 32, 508–514. doi: 10.3969/j.issn.1000-7083.2013.04.006
Yoon, Y., Kim, G., Noh, M. G., Park, J. H., Jang, M., Fang, S., et al. (2020). Lactobacillus fermentum promotes adipose tissue oxidative phosphorylation to protect against diet-induced obesity. Exp. Mol. Med. 52, 1574–1586. doi: 10.1038/s12276-020-00502-w
Zha, Y., Eiler, A., Johansson, F., and Svanbäck, R. (2018). Effects of predation stress and food ration on perch gut microbiota. Microbiome 6:28. doi: 10.1186/s40168-018-0400-0
Zhang, Z. Y., Guo, Y. L., Zhuang, M. S., Liu, F. G., Xia, Z. Y., Zhang, Z. H., et al. (2023). Potential role of the gut microbiota of bumblebee Bombus pyrosoma in adaptation to high-altitude habitats. Front. Microbiol. 14:1218560. doi: 10.3389/fmicb.2023.1218560
Zhang, W., Jia, T., Zhang, H., and Zhu, W. L. (2023). Effects of high-fiber food on gut microbiology and energy metabolism in Eothenomys miletus at different altitudes. Front. Microbiol. 14:1264109. doi: 10.3389/fmicb.2023.1264109
Zhang, W., Jiao, L., Liu, R., Zhang, Y., Ji, Q., Zhang, H., et al. (2018). The effect of exposure to high altitude and low oxygen on intestinal microbial communities in mice. PLoS One 13:e0203701. doi: 10.1371/journal.pone.0203701
Zhang, Z. Z., Zhang, X., Zhang, T. T., Li, J. J., Renqing, C. M., Baijiu, Z. X., et al. (2024). Differential gene expression and gut microbiota composition in low-altitude and high-altitude goats. Genomics 116:110890. doi: 10.1016/j.ygeno.2024.110890
Zhou, X. W., Qiao, K. N., Wu, H. M., and Zhang, Y. Y. (2023). The impact of food additives on the abundance and composition of gut microbiota. Molecules 28:631. doi: 10.3390/molecules28020631
Zhu, W. L., Cai, J. H., Lian, X., and Wang, Z. K. (2010). Adaptive character of metabolism in Eothenomys miletus in Hengduan mountains region during cold acclimation. J. Thermal Biol. 35, 417–421. doi: 10.1016/j.jtherbio.2010.09.002
Zhu, W. L., Cai, J. H., Lian, X., and Wang, Z. K. (2011). Effects of photoperiod on energy intake, thermogenesis and body mass in Eothenomys miletus in Hengduan mountain region. J. Thermal. Biol. 36, 380–385. doi: 10.1016/j.jtherbio.2011.06.014
Zhu, W. L., Jia, T., Lian, X., and Wang, Z. K. (2009). Effects of cold acclimation on body mass, serum leptin level, energy metabolism and thermognesis in Eothenomys miletus in Hengduan mountains region. J. Thermal. Biol. 35, 41–46. doi: 10.1016/j.jtherbio.2009.10.006
Keywords: Eothenomys miletus, high altitude, food restriction, gut microbiota, adaptation
Citation: Zhang T, Jia T, Zhu W and Fan L (2024) High-altitude environments enhance the ability of Eothenomys miletus to regulate body mass during food limitation, with a focus on gut microorganisms and physiological markers. Front. Microbiol. 15:1499028. doi: 10.3389/fmicb.2024.1499028
Edited by:
Huan Li, Lanzhou University, ChinaReviewed by:
Satya P. Singh, Saurashtra University, IndiaMian Gul Hilal, Chinese Academy of Agricultural Sciences, China
Copyright © 2024 Zhang, Jia, Zhu and Fan. This is an open-access article distributed under the terms of the Creative Commons Attribution License (CC BY). The use, distribution or reproduction in other forums is permitted, provided the original author(s) and the copyright owner(s) are credited and that the original publication in this journal is cited, in accordance with accepted academic practice. No use, distribution or reproduction is permitted which does not comply with these terms.
*Correspondence: Wanlong Zhu, Mzk2MUB5bm51LmVkdS5jbg==; Lixian Fan, MjA5M0B5bm51LmVkdS5jbg==
 Tianxin Zhang
 Ting Jia
 Wanlong Zhu
 Lixian Fan
