 Jean Mura1
 Magali Ranchou-Peyruse1,2,3
 Marion Guignard2
 Marion Ducousso1,3Marie Larregieu2
 Marie-Pierre Isaure2
 Isabelle Le Hécho2,3
 Guilhem Hoareau4Marie Poulain1,3Mateus de Souza Buruti1Pierre Chiquet3,5Guilhem Caumette3,6Anélia Petit7Pierre Cézac1,3
 Anthony Ranchou-Peyruse2,3*
- 1LaTEP, E2S UPPA, Université de Pau et des Pays de l’Adour, Pau, France
- 2IPREM, CNRS, E2S UPPA, Université de Pau et des Pays de l’Adour, Pau, France
- 3Joint Laboratory SEnGA, E2S UPPA, Pau, France
- 4LFCR, CNRS, E2S UPPA, Université de Pau et des Pays de l’Adour, Pau, France
- 5Geosciences Department, Teréga, Pau, France
- 6Environment Department, Teréga, Pau, France
- 7Geosciences Department, Storengy, Bois-Colombes, France
If dihydrogen (H2) becomes a major part of the energy mix, massive storage in underground gas storage (UGS), such as in deep aquifers, will be needed. The development of H2 requires a growing share of H2 in natural gas (and its current infrastructure), which is expected to reach approximately 2% in Europe. The impact of H2 in aquifers is uncertain, mainly because its behavior is site dependent. The main concern is the consequences of its consumption by autochthonous microorganisms, which, in addition to energy loss, could lead to reservoir souring and alter the petrological properties of the aquifer. In this work, the coinjection of 2% H2 in a natural gas blend in a low-salinity deep aquifer was simulated in a three-phase (aquifer rock, formation water, and natural gas/H2 mix) high-pressure reactor for 3 months with autochthonous microorganisms using a protocol described in a previous study. This protocol was improved by the addition of protocol coupling experimental measures and modeling to calculate the pH and redox potential of the reactor. Modeling was performed to better analyze the experimental data. As in previous experiments, sulfate reduction was the first reaction to occur, and sulfate was quickly consumed. Then, formate production, acetogenesis, and methanogenesis occurred. Overall, H2 consumption was mainly caused by methanogenesis. Contrary to previous experiments simulating H2 injection in aquifers of higher salinity using the same protocol, microbial H2 consumption remained limited, probably because of nutrient depletion. Although calcite dissolution and iron sulfide mineral precipitation likely occurred, no notable evolution of the rock phase was observed after the experiment. Overall, our results suggested that H2 can be stable in this aquifer after an initial loss. More generally, aquifers with low salinity and especially low electron acceptor availability should be favored for H2 costorage with natural gas.
1 Introduction
Shifting toward carbon-free renewable fuels is essential for facing global warming and resource depletion. Dihydrogen (H2) could be a coherent alternative to fossil fuels, as it can be produced by electrolyzers using renewable electricity and does not produce greenhouse gases during its combustion. Thus, excess renewable energy could be used to produce H2 (power-to-gas), which could be stored until use in periods of high demand (Pastore et al., 2022). To achieve carbon neutrality, substantial storage capacity will be needed. In France, most seasonal gas storage is assured by underground gas storage (UGS) in deep aquifers, which could provide a large storage capacity for H2 in large-scale production. The development of H2 production implies that blends of H2 and natural gas will flow in the gas grid and will need to be stored in deep aquifers. The H2 percentage in these blends is expected to reach 2%. Feasibility and site selection studies of H2 storage in porous rock reservoirs and aquifers have been conducted based on the structural characteristics of H2 storage, such as porosity, cap rock, and permeability (Aghaei et al., 2023; Bo et al., 2023; Buscheck et al., 2023; Harati et al., 2023; Lysyy et al., 2023; Wang et al., 2023). Many researchers have investigated the injection/withdrawal cycles of H2 in aquifers (Heinemann et al., 2021; Chai et al., 2023; Pan et al., 2023; Jadhawar and Saeed, 2023a,b; Izadi Amiri et al., 2024; Saeed and Jadhawar, 2024), enabling the determination of optimal strategies for site exploitation. One of the major challenges of massive H2 storage in deep aquifers is its interaction with indigenous microorganisms (Šmigáň et al., 1990; Dopffel et al., 2021; Haddad et al., 2022b; Mura et al., 2024). Indeed, H2 is a reactive molecule that can be used as an energy source and an electron donor by autochthonous lithoautotrophic microorganisms, so called hydrogenotrophs (Šmigáň et al., 1990; Dopffel et al., 2021; Haddad et al., 2022b; Mura et al., 2024). Based on town gas storage experience (Šmigáň et al., 1990; Buzek et al., 1994; Liebscher et al., 2016; Stolten and Emonts, 2016; Pichler, 2019; Tremosa et al., 2023) and experimental studies (Haddad et al., 2022b; Dohrmann and Krüger, 2023; Mura et al., 2024; Vasile et al., 2024), the major reactions to be expected are sulfate reduction, methanogenesis (Vítězová et al., 2023), and acetogenesis with acetate and formate production. The electron acceptors of these reactions (sulfate, CO2, and bicarbonates; Ebrahimiyekta, 2017) can be naturally present at various concentrations in deep aquifers and can be found in aquifers hosting UGS storages. In addition to energy loss through H2 consumption, microbial reactions and growth can cause multiple drawbacks to H2 storage. Biofilm development can lead to pore clogging (Eddaoui et al., 2021) and has been shown to influence sandstone wettability and liquid/gas transfer (Stewart, 2003; Ali et al., 2023). Sulfate reduction produces sulfide and can lead to souring. Physicochemical changes induced by microbial reactions could lead to precipitation and dissolution by equilibrium displacement (Ulrich et al., 2003; Dupraz et al., 2009) or lasting changes in water physicochemistry (i.e., low sulfate concentration; Ranchou-Peyruse et al., 2019). An induced decrease in porosity would lower the storage performance, whereas an increase in porosity could harm the storage integrity. However, microbial activity can be inhibited by inappropriate pH or a lack of nutrients (Dopffel et al., 2023; Mura et al., 2024). The abiotic effects of H2 could also be expected, as H2S could be produced by pyrite reduction (Šmigáň et al., 1990). However, microbial activity could also benefit storage, as microorganisms such as sulfate reducers are known to attenuate aromatic molecules (Mancini et al., 2003).
Despite the development of new experimental studies (Haddad et al., 2022b; Dohrmann and Krüger, 2023; Dopffel et al., 2023; Liu et al., 2023; Mura et al., 2024; Vasile et al., 2024), the feasibility of H2 storage in porous reservoirs remains unclear, mainly because of site-dependent phenomena related notably to its pressure and temperature conditions and its mineralogy. While microorganisms are expected to be present in deep aquifers, their taxonomic diversity and cell concentration could change depending on the studied site. Moreover, there is variability in the physicochemistry and hydrology between aquifers (Fillinger et al., 2023), and temperature and mineralogy can influence microbial activity (Dohrmann and Krüger, 2023; Muller et al., 2023). Thus, site-specific microbiological and geochemical analyses are needed to evaluate the feasibility of H2 coinjection in deep aquifers (Dopffel et al., 2021). For experimental approaches, the modeling of H2 storage in porous rocks has increased (Amid et al., 2016; Hagemann et al., 2016; Hogeweg et al., 2022; Veshareh et al., 2022; Gelencsér et al., 2023; Maniglio et al., 2023; Strobel et al., 2023; Tremosa et al., 2023; Wu et al., 2023). Conceptual kinetic modeling of microbial growth and reactions was performed on various systems ranging from near atmospheric pressure laboratory experiments to reservoir-scale modeling. Both experimental and modeling approaches underscore the need for additional experimental studies and data to better understand the intricate phenomena of H2 in underground storage.
In recent works (Haddad et al., 2022b; Ranchou-Peyruse et al., 2023; Mura et al., 2024), a multidisciplinary protocol to recreate deep aquifers in a three-phase high-pressure reactor was developed and applied to four French aquifers hosting natural gas storages. In this work, a similar approach was applied to another UGS in a deep aquifer to investigate the feasibility of H2 coinjection at this site. The formation water and rock phase were sampled from the studied aquifer, and a gas mixture representing the natural gas storage (with 1% CO2) was added with a final pressure of 60 bar. Two percent H2 was added to the gas phase to simulate its injection in the aquifer. The extent of the reactions was computed based on physicochemical parameters and microbial taxonomic diversity to model the amount of H2 consumed by each microbial reaction. To better quantify the in situ pH and redox potential in the high-pressure reactor, the initial protocol was upgraded with a new sampling protocol coupled with modeling using PHREEQC. Briefly, dissolved gases were quantified at atmospheric pressure to account for their acido-basic and redox effects. The Materials and Methods section describes the experimental protocol and the modeling approach. The outcomes of the experiment and modeling results are presented in the Results section and analyzed and compared in the Discussion section.
2 Materials and methods
2.1 Simulated site characteristics and sampling procedure
The UGS studied in this work is a previously studied deep aquifer operated for seasonal natural gas storage, referred to as Ab_L in the literature (Ranchou-Peyruse et al., 2019, 2024; Haddad et al., 2022a, 2023). This aquifer is in southwestern France and belongs to the South Aquitaine sedimentary basin (582 m depth; Haddad et al., 2022a). The formation water was sampled from a control well close to the gas bubble, ensuring optimal contact between the liquid phase (i.e., formation water) and the stored natural gas. With 0.8% salinity of seawater, the formation water has a low salinity (Haddad et al., 2022a). The porous rock is mainly composed of quartz (80%) and calcite (12%) and contains small amounts of iron sulfide, clays, and barite (Jacquemet et al., 2020; Haddad et al., 2022a). During the sampling campaign on well Ab_L_1, formation water was collected using two bottom hole samplers (Leutert Bottom Hole Positive Displacement Sampler) to ensure sterile conditions, maintenance of anoxia and pressure until the samples reached the laboratory, according to a protocol (Ranchou-Peyruse et al., 2023). From the samplers, 578 mL and 594 mL were slowly depressurized (<1 bar.min−1) in the laboratory, transferred to sterile and anoxic flasks, and stored at 4°C until use. On the day of sampling, wellhead formation water was also sampled and sterilized by filtration (PES 47 mm membranes, 0.1 μm, Sartorius). All water samples were stored at 4°C in darkness until use. On the day the experiment began, the two flasks were mixed with 778 mL of filtered water collected from the wellhead. The procedure was carried out in an anaerobic chamber (GP Campus, Jacomex). One hundred milliliters were sampled to study the microbial taxonomic diversity. The characteristics and composition of the water mix are detailed in Table 1. The rock phase was composed of infra-molassic sands and was recovered from drilling cuttings from the reservoir studied (Ranchou-Peyruse et al., 2019; Haddad et al., 2022a, 2023).
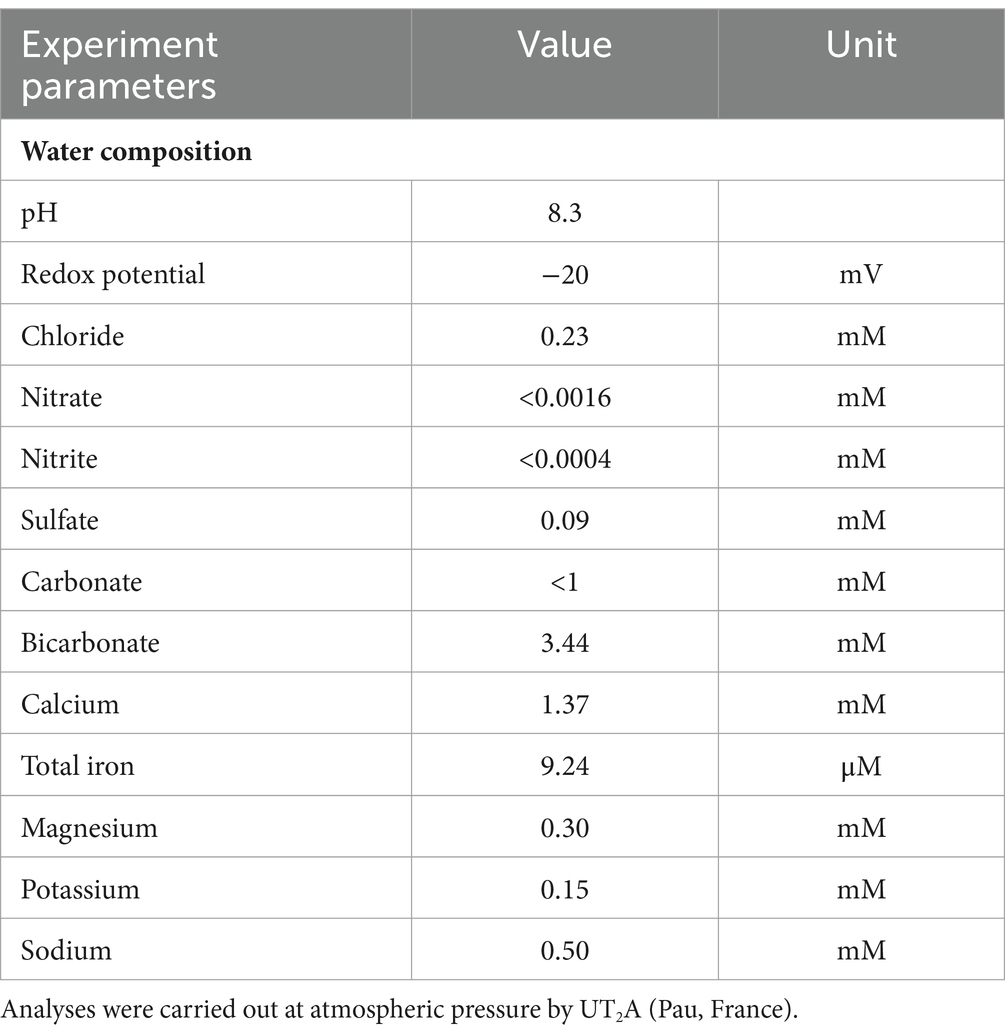
Table 1. Characteristics and composition of the formation water sampled from the studied UGS aquifers.
2.2 Experiment
2.2.1 Experimental protocol
This experiment was carried out in a high-pressure reactor using a protocol to simulate H2 or O2 injection in deep aquifers used previously (Haddad et al., 2022a,b, 2023; Mura et al., 2024). This reactor was made of corrosion-resistant Hastelloy C-276 material and was equipped with pressure and temperature sensors. The solid phase was contained in a Teflon basket sitting in the middle of the reactor to represent the water-gas interface in the porous rock of the aquifer. A piston enables the modification of the reactor volume to compensate for the liquid sampling and manage the height of the water-gas interface throughout the experiment. The liquid and gas phases were stirred at 20 rpm. After the solid basket filled with rock was introduced into the reactor, the reactor was sterilized by moist heat with ultrapure water at 110°C for 24 h under low nitrogen (N2) pressure. Then, the liquid phase was introduced into the reactor previously placed under vacuum from a Teflon bottle prepared in an anaerobic glovebox. A custom gas mixture simulating natural gas (99% CH4, 1% CO2, 7.95 ppm benzene, and 3.57 ppm toluene) was injected into the reactor to reach the target pressure. The height of the piston was set to immerse the solid phase fully. After 7 days, the piston was lowered to immerse 1 cm of solid. The pressure loss induced was compensated by injecting a new amount of the initial gas mixture. After validation of the microbial activity, dihydrogen (CAS: 1333-74-0, purity 99.999%) was injected at a gas phase molar fraction of 2%. The microbial activity was validated by sulfate consumption and cell count (data not shown) based on previous experiments (Haddad et al., 2022a,b, 2023; Mura et al., 2024). Immediately after H2 injection, additional filtered formation water was injected into the reactor to extend the duration of the experiment, which was limited by the quantity of water available to the sample. Each week, the composition of the liquid and gas phases was monitored, and more detailed chemical and biological analyses (qPCR, taxonomic diversity, and benzene/toluene quantification) were performed for key events. Water samples were taken regularly to monitor changes in the taxonomic and functional diversities of the microbial community. Filtered formation water was added to the reactor on day 17 of the experiment to extend its duration. At the end of the experiment, the remaining liquid phase and the solid basket were maintained under anoxic conditions and recovered for further analysis (Haddad et al., 2022a).
2.2.2 Physico-chemical analyses
The anions (fluoride, acetate, formate, chloride, sulfate) were analyzed by ionic chromatography (Dionex Integrion HPIC, Thermo Fisher Scientific) with ±5% precision. The dissolved inorganic carbon, including carbonate, bicarbonate, and dissolved CO2, was quantified using a dedicated chromatography system (ICS-900, Dionex) equipped with an ICE-AS1 IC column. The precision of this measure was ±5%. The metal concentrations (sodium, iron, barium, magnesium, potassium, and calcium) in the liquid samples were determined during all the experiments via inductively coupled plasma-optical emission spectroscopy (ICP–OES, Thermo Scientific iCAP6500 Duo). The instrumental conditions for ICP–OES were as follows: RF power of 1,300 W, plasma gas flow rate of 15 L.min−1, nebulizer gas flow rate of 0.65 L.min−1, and auxiliary gas flow rate of 0.5 L.min−1. All the samples were diluted in a 2% HNO3 solution at a dilution ratio of four. The measurements were performed in triplicate, and the coefficient of variation (relative standard deviation) for each analysis was less than 2% for all measurements.
The gas phase species (H2, O2, CH4, CO2, H2S) were quantified using in-line micro gas phase chromatography with 5% precision (GC-mTCD; Micro GC Fusion; Chemlys; France). The pH and redox potential were measured at atmospheric pressure using Inlab Ultramicro ISM (Mettler Toledo) and Inlab Redox Micro (Mettler Toledo) probes. The specifications of each analysis method were detailed in a previous work (Haddad et al., 2022a).
The use of the compound-specific isotope analysis (CSIA) approach makes it possible to demonstrate or estimate the in situ bioattenuation of organic pollutants such as benzene and toluene (Fischer et al., 2016; Ponsin et al., 2017). This method can be used to directly monitor the biodegradation of aromatic hydrocarbons in groundwater by measuring the isotopic fractionation of the remaining contaminant as degradation proceeds (Mancini et al., 2003). CSIA requires an analytical chain composed of a gas chromatograph (GC, Thermo, Trace 1310) coupled via a combustion interface at 1,000°C (CT, Thermo, GC-Isolink) to an isotope ratio mass spectrometer (IRMS, Thermo Delta V Plus). All δ13C signatures of the analytes were reported relative to Vienna PeeDee Belemnite (δ13CVPDB), and the calibration was achieved by coupling an elemental analyzer (EA, Thermo, Flash 2000) with an isotope ratio mass spectrometer (Berg et al., 2007; Hunkeler et al., 2008). In parallel, the identification and quantification of benzene and toluene in the liquid and gas phases were carried out by coupling gas chromatography to a quadrupole mass spectrometer (MS, Thermo, ISQ). This configuration thus makes it possible to obtain the identification and quantification of benzene/toluene via GC–MS and the determination of isotopic ratios via GC-CT-IRMS during the analysis of a sample, avoiding any problem of correspondence between the CO2 peak and the compound of interest. Preconcentration of benzene and toluene was performed by SPME with a polydimethylsiloxane/carboxene (PDMS/CAR) fiber, and chromatographic separation was performed with a DB-624 column (Agilent). For each sample, two 10 mL water samples were taken and stored at 4°C. prior to the analysis, 90 μL of the 0.5 ppm 1,2,4-trimethylbenzene internal standard was added to each 6.9 g sample. Gas samples were collected in vials at one bar using a needle sampling system controlled by a manometer. The quantification was performed with methane as a reference gas containing 10 mol ppm benzene and toluene (Li et al., 2014; Haddad et al., 2022a).
2.2.3 Molecular biology approaches
2.2.3.1 Nucleic acid extraction and RNA reverse transcription
Aqueous phase samples were used to coextract nucleic acids (DNA and RNA) throughout the experiment. Membrane filters (47 mm PES with 0.1 μm porosity, Sartorius Stedim) were used to filter aqueous samples directly from the reactor. The filters with the samples were kept at −80°C until use. The filters were then ground in liquid nitrogen, and a Fast RNA Prosoil Direct kit (MP BIO) was used to recover the nucleic acids. An AllPrep RNA/DNA kit (Qiagen) was used to separate the DNA and RNA. A Quant-it™ dsDNA HS kit (Invitrogen) and a Quant-it™ RiboGreen kit (Invitrogen) were used to quantify the extracted DNA and RNA, respectively. A BioTEK SYNERGY HTX microplate reader was used to measure the extracted DNA and RNA. M-MLV reverse transcriptase (Invitrogen™) was used to reverse transcribe RNA and obtain complementary DNAs (cDNAs).
2.2.3.2 Polymerase chain reaction, qPCR, and sequencing
The primer pairs 515F-928R (V4-V5 region), dsr2060F-dsr4R, and mlasF-mcrAR (Wagner et al., 1998; Geets et al., 2006; Steinberg and Regan, 2008, 2009; Wang and Qian, 2009) were used to target the 16S rRNA, dsrB and mcrA genes from the obtained DNA and cDNA, respectively. The addition of bovine serum albumin (BSA, NEV-B9200S) to PCR at a concentration of 1 mg.mL−1 reduced the inhibition. A Taq PCR kit (Roche) was used to amplify the 16S rRNA and dsrB genes, while a Fidelio® Hot Start PCR kit (Ozyme) was used to amplify the mcrA gene. Amplifications were obtained using a 2700 Thermal Cycler (Applied Biosystems). Haddad et al. (2022a) described the procedures in greater detail. The quantification of genes, their transcripts and associated standards was performed by quantitative PCR (qPCR; Bio-Rad CFX Connect) and 41 Takyon NO ROX SYBR 2X MasterMix blue dTTP (Eurogentec), as described by Haddad et al. (2022a). The primer pairs used in this work were synthesized with the adaptors GTGYCAGCMGCCGCGGTA (forward) and CCCCGYCAATTCMTTTRAGT (reverse). The raw sequencing data are publicly accessible on the NCBI SRA with bioproject ID PRJNA1117242. The MiSeq sequencing data were processed with QIIME 2 (Bolyen et al., 2019; version 2022.11) to analyze taxonomic diversity. Amplicon sequence variants (ASVs) were obtained with DADA2 (Callahan et al., 2016) after demultiplexing, filtering, denoising, trimming of any eliminating chimera sequences and excluding singletons. The SILVA v138 database (Quast et al., 2012; Yilmaz et al., 2014) was used for taxonomic affiliation. The same treatment was applied to the mcrA and dsrB sequences, as well as the 16S rDNA sequences. For mcrA, the Yang et al. (2014) database was used for ASV affiliation, while for dsrB, we used our own database (Ranchou-Peyruse et al., 2024). Calculations and analyses in R.Studio (version 4.2.2) were performed with the Phyloseq (McMurdie and Holmes, 2013) and ggplot 2 (Wickham, 2016) packages. The ComplexHeatmap package (Gu et al., 2016; Gu, 2022) was used to generate heatmaps, and the Corrplot (Wei and Simko, 2017), FactoMineR (Lê et al., 2008) and factoExtra (Kassambara and Mundt, 2020) packages were used for PCA and PCoA. Bray–Curtis was used for PCoA distance calculations, and covariance analysis was used for PCA.
2.2.4 X-ray diffraction
X-ray diffraction (XRD) was performed to characterize the crystallized mineralogical phases before and after the experiment. At ambient temperature in the anaerobic glove box, samples were collected from the basket at three different depths (surface 0–1 cm, middle 2–5 cm, and bottom 6–7.5 cm). The samples were then dried with N2 gas flux, manually ground, and sieved to <100 μm into a homogeneous powder in the anaerobic chamber to limit oxidation. Solid powders were then mounted on holders and directly analyzed by XRD. The analyses were performed using a Bruker D2 Phaser powder diffractometer equipped with a Cu Kα radiation source. XRD patterns were recorded over a 5° to 90° 2Θ range with a 0.02° step and a 0.5 s counting time per step. DIFFRAC.EVA software was used to identify the mineral phases.
2.2.5 Scanning electron microscopy
Aliquots of the same samples collected at three different depths were subjected to a petrographic study using scanning electron microscopy coupled with energy dispersive spectroscopy (SEM–EDS). Solid pieces were directly mounted on PIN stubs and coated with carbon. Observations and mineral identification were performed with a JEOL JSM 7800F Prime SEM-FEG instrument equipped with an Oxford Instruments AZtecEnergy EDS SDD X-Max 80 mm2 detector at Centre Castaing, Toulouse, France.
2.2.6 Biochemical modeling
To better identify microbial reactions and quantify their effect on H2 consumption, the extent of reactions was computed. The sulfate reduction (van Houten et al., 1994; Reitenbach et al., 2015; Hemme and Van Berk, 2018; Eq. 1), acetogenesis (Gregory et al., 2019; Rabii et al., 2019; Eq. 2), formate production (Logroño et al., 2022; Eq. 3), and methanogenesis (Panfilov, 2010; Hemme and Van Berk, 2018; Thaysen et al., 2021; Eq. 4) reactions were chosen based on literature mechanisms and used in agreement with microbiology analyses. These reactions were combined with the acido-basic reaction of the / couple to consider the buffering of H+ ion consumption/production. The stoichiometric coefficients of HS− and H2S were calculated based on sulfide speciation (Daumas et al., 1993; Mura et al., 2024). The extent of each reaction was determined from the quantification over time of selected species. The extents of sulfate reduction, acetogenesis, formate production, and methanogenesis were calculated based on the experimental changes in the quantities of sulfate, acetate, formate, and CO2, respectively.
To consider the evolution of dissolved gas, the liquid–gas equilibrium was modeled with PHREEQC version 3 software (Parkhurst and Appelo, 2013) using the phreeqc.dat database. This database uses the Peng Robinson equation of state (Peng and Robinson, 1976) to consider the gas phase’s nonideality. Gas solubility was calculated based on the fugacity of gases in the gas phase and the hypothesis of thermodynamic equilibrium between the two phases. This modeling procedure was detailed in a previous work (Mura et al., 2024).
The standard Gibbs energy of reaction ( of formate production (Eq. 3) was computed using the NBS Tables of Chemical Thermodynamics (Wagman, 1982), considering standard conditions of 298.15 K and 1 bar (Eq. 7). Activities were computed using the PHREEQC data from the in situ characterization protocol (section 0.). The Gibbs energy of reaction at the temperature of the experiment [] (36°C) was computed using the Gibbs-Helmoltz equation (Eq. 8). The theoretical equilibrium concentration of formate in the reactor was obtained by computing the activity of formate at equilibrium with dissolved H2 and bicarbonate using the formate production mass action law (Eq. 9). The theoretical equilibrium concentration of formate at atmospheric pressure was calculated considering the activity of dissolved H2 in equilibrium with a gas phase containing the molar fraction of H2 measured on day 21 at 1 bar.
2.2.7 In situ characterization protocol
In this work, a protocol combining experimental measures and modeling was developed to determine the in situ pH and redox potential of a reactor. A 10 mL liquid sample was collected from the reactor in a gas-tight glass syringe (SGE, 50 mL) closed by a manual valve to retain the gases that were degassed due to a change in pressure. The total released gas quantity was quantified by directly reading its volume via syringe graduation. The uncertainty of this measure was ±5% compared to a reference value measured by a manual gasometer (results not shown; VINCI Technologies). The sample temperature was measured by a CheckTemp thermometer (± 0.2°C; HANNA instruments). Both the liquid and gas phases were injected into a rubber-sealed vial placed under an N2 atmosphere for analysis. The gas composition in the vial was determined using the micro gas chromatography setup described in section 2.2.2. It was assumed that the gas composition did not change between the syringe and the vial, except for the dilution in N2. The liquid phase was analyzed using the methods described in section 2.2.2.
The in situ conditions were then modeled using PHREEQC with the BRGM database Thermoddem (Blanc et al., 2012). This database was modified by removing redox couples linked by slow redox reactions (carbon, nitrogen, and sulfur) to model redox disequilibrium in solution (Gelencsér et al., 2023; Tremosa et al., 2023). This modeling was composed of three steps. First, the liquid and the released gas at atmospheric pressure were modeled using experimentally collected data. Using the ideal gas law, each gas quantity was computed from the gas composition, pressure, temperature, and volume. It was assumed that the sample in the syringe was at atmospheric pressure. In the second step, the thermodynamic equilibrium between the gas and liquid phases in the syringe was modeled using the composition of the syringe gas phase to quantify the dissolved gas concentrations in the syringe. At this stage, the calculated and measured pH values were close. Finally, the pressurization of the two phases at the reactor pressure and temperature was modeled to return to the reactor conditions.
The pH under these conditions was determined by the default PHREEQC calculations, assuming acido-basic equilibrium among all acid–base species in the solution. In the absence of redox equilibrium in solution, it is possible to only compute the theoretical Nernst potential of each redox couple (Lindberg and Runnells, 1984; Stefánsson et al., 2005; Ioka et al., 2011). Using Thermoddem.dat parameters, the redox potentials of the H+/H2 and CO2/CH4 couples were calculated (Eqs. 5, 6):
with
: Redox potential of couple i relative to the standard hydrogen electrode (V).
: Equilibrium constant of the half equation of couple i.
: activity of species i.
: gas constant (8.314 kg m2 s−2 mol−1 K−1).
: temperature (K).
: Faraday constant (9.6485∙104 A s mol−1).
with
: Stoichiometric coefficient of species i in the reaction.
: Standard Gibbs energy of formation of species i.
: Standard state temperature.
: Temperature of the experiment.
: Standard enthalpy of reaction.
: Equilibrium constant.
: Activity of species i.
3 Results
3.1 Physicochemical monitoring of the gas phase evolution during the experiment
The CH4-CO2-benzene/toluene gas mixture was first injected to a total pressure of 62.0 ± 0.6 bar at 36°C, corresponding to 4.54 ± 4.5∙10−2 moles of CH4 (results not shown) and 4.58∙10–2 ± 4.6∙10–4 moles of CO2 (Figure 1A). After 7 days, mainly due to solubilization, the CO2 quantity decreased to 3.1∙10−2 ± 1.5∙10−3 mol, while the CH4 quantity remained within the error margin due to its low solubility. On day 7, the piston was lowered to immerse only 1 cm of the solid basket. To compensate for the pressure drop caused by the increase in the cell volume, the initial gas was injected again, resulting in a total quantity of 4.7 ± 2.3∙10−1 moles of CH4 and 3.3∙10−2 ± 1.7∙10−3 moles of CO2. Dihydrogen was injected on day 9, with a molar fraction of 2.2 ± 0.1%, corresponding to 1.06∙10−1 ± 5.3∙10−3 moles (Figure 1A). On day 17, 353 g of formation water was added to the reactor to prolong the experiment. Following this injection, on day 21, only CO2 solubilization was significant (2.7∙10−2 ± 1.4∙10−3 moles). From day 21 to the end of the experiment (day 105), the H2 and CO2 concentrations slowly decreased to 7.6∙10−2 ± 3.8∙10−3 and 1.95∙10−2 ± 9.8∙10−4 mole, respectively. No significant evolution of CH4 was noted.
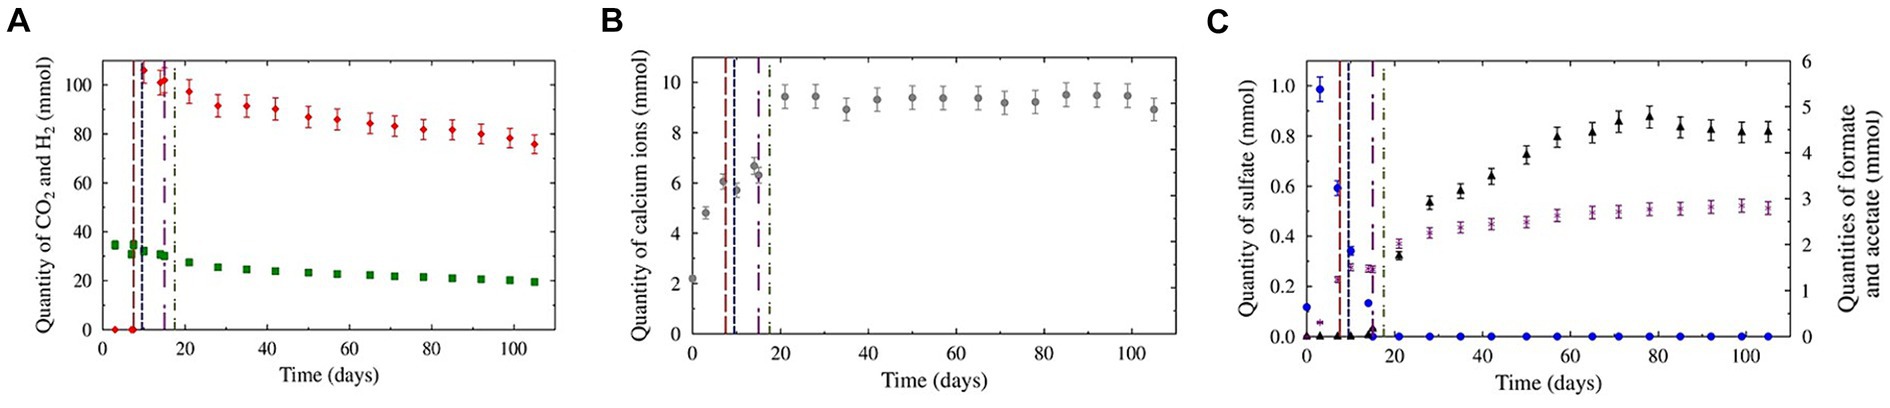
Figure 1. Evolution of the aqueous and gaseous phase compositions during the experiments. The red, blue, purple, and green dotted lines represent CH4 + CO2 gas reinjection, H2 injection, total sulfate consumption, and formation water addition, respectively. Panel (A) represents the evolution of H2 (red diamonds) and CO2 (green squares) in the gas phase. Panel (B) represents the evolution of sulfate (blue dots), formate (black triangles), and acetate (purple crosses) in the liquid phase. Panel (C) represents the evolution of calcium ions in the liquid phase.
3.2 Physicochemical monitoring of the liquid phase evolution during the experiment
Before injection into the reactor, the formation water contained mostly bicarbonate (2.4∙10−3 ± 1.2∙10−4 mol.kg−1) and calcium (Figure 1B; 1.31∙10−3 ± 6.5∙10−5 mol.kg−1). Sodium (6.0∙10−4 ± 3.0∙10−5 mol.kg−1), magnesium (4.4∙10−4 ± 2.2∙10−5 mol.kg−1), chloride (3.0∙10−4 ± 1.5∙10−5 mol.kg−1), and sulfate (Figure 1C; 7.0∙10−4 ± 3.5∙10−5 mol.kg−1) were also present initially at lower concentrations. Iron and barium were detected at trace levels (6.5∙10−6 ± 3.2∙10−7 mol.kg−1 and 1.0∙10−6 ± 5.0∙10−7 mol.kg−1, respectively). Acetate and formate were not detected. On day 3, after contact between the liquid and solid phases, significant increases in bicarbonate (3.1∙10−3 ± 1.5∙10−4 mol.kg−1), calcium (2.88∙10−3 ± 1.4∙10−4 mol.kg−1), chloride (1.97∙10−3 ± 9.84∙10−5 mol.kg−1) and sulfate (5.9∙10−4 ± 2.9∙10−5 mol.kg−1) concentrations were observed. Acetate was first detected on this day (1.82∙10−4 ± 9∙10−6 mol.kg−1). From days 3 to 9, before H2 injection, sulfate molality decreased to 3.7∙10−4 ± 1.8∙10−5 mol.kg−1. Furthermore, the bicarbonate, calcium, and acetate concentrations increased to 4.9∙10−3 ± 2.4∙10−4 mol.kg−1, 4.1∙10−3 ± 2.1∙10−4 mol.kg−1, and 7.0∙10−4 ± 3.5∙10−5 mol.kg−1, respectively. The other ion concentrations remained within the margin of error.
After H2 injection, sulfate molality continued to decrease until total consumption on day 15. On day 21, after the addition of the formation water, several ion molalities increased: Bicarbonate (6.6∙10−3 ± 3.3∙10−4 mol.kg−1), calcium (4.8∙10−3 ± 2.4∙10−4 mol.kg−1), acetate (1.08∙10−3 ± 5.4∙10−5 mol.kg−1) and formate (1.12∙10−3 ± 5.6∙10−5 mol.kg−1). After day 21, the bicarbonate and calcium concentrations continued to increase until they reached a plateau on day 28 (7.1∙10−2 ± 3.6∙10−4 mol.kg−1 and 4.9∙10−3 ± 2.4∙10−4 mol.kg−1, respectively). From detection on day 14, formate molality steadily increased to a maximum molality of 3.4∙10−3 ± 1.7∙10−4 mol.kg−1 before slightly decreasing at the end of the experiment (3.1∙10−3 ± 1.5∙10−4 mol.kg−1). Acetate production continued after H2 injection but at a diminishing rate. At the end of the experiment, the acetate molality stabilized at 1.74∙10−3 ± 8.7∙10−5 mol.kg−1. The iron and barium concentrations steadily increased during the experiment, reaching 1.83∙10−4 ± 9.14∙10−6 mol.kg−1 and 1.95∙10−5 ± 9.7∙10−7 mol.kg−1, respectively, at the end of the experiment.
3.3 Benzene and toluene evolution
The quantities of benzene and toluene measured followed the same trends. Benzene and toluene levels in the gases slightly decreased over the first 21 days (−7∙10−3 ± 4∙10−3 mmol between day 3 and day 21 for both benzene and toluene; Figure 2). Afterward, the concentrations obtained were held constant, considering the standard deviations. In the liquid phase, the quantities measured were constant throughout the experiment, considering the standard deviations. A closer look at the behavior of benzene and toluene in the aqueous phase shows that the carbon isotope values for benzene and toluene did not vary within the standard deviations (Table 2). From day 21 onward, the carbon isotope ratios of benzene and toluene slightly changed compared with those determined between day 3 and day 15, when benzene and toluene were enriched by gaseous inputs.
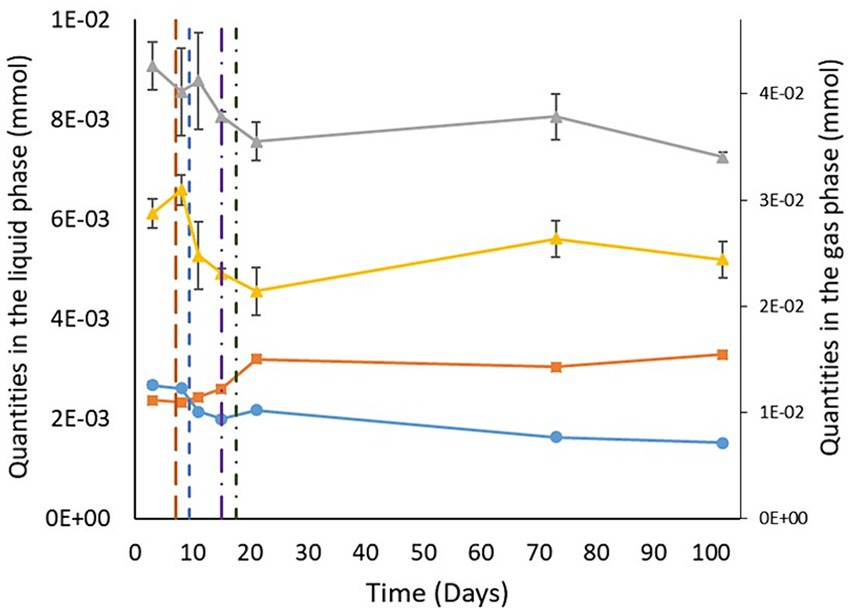
Figure 2. Variations in benzene and toluene quantities in the liquid and gas phases. The gray and yellow curves show the evolution of the quantity of benzene and toluene in the gas phase, respectively. The light blue and orange curves correspond to the quantity of benzene and toluene in the liquid phase, respectively. The brown, blue, purple, and green vertical lines indicate CH4 + CO2 injection, H2 injection, sulfate total consumption, and formation water reinjection, respectively.
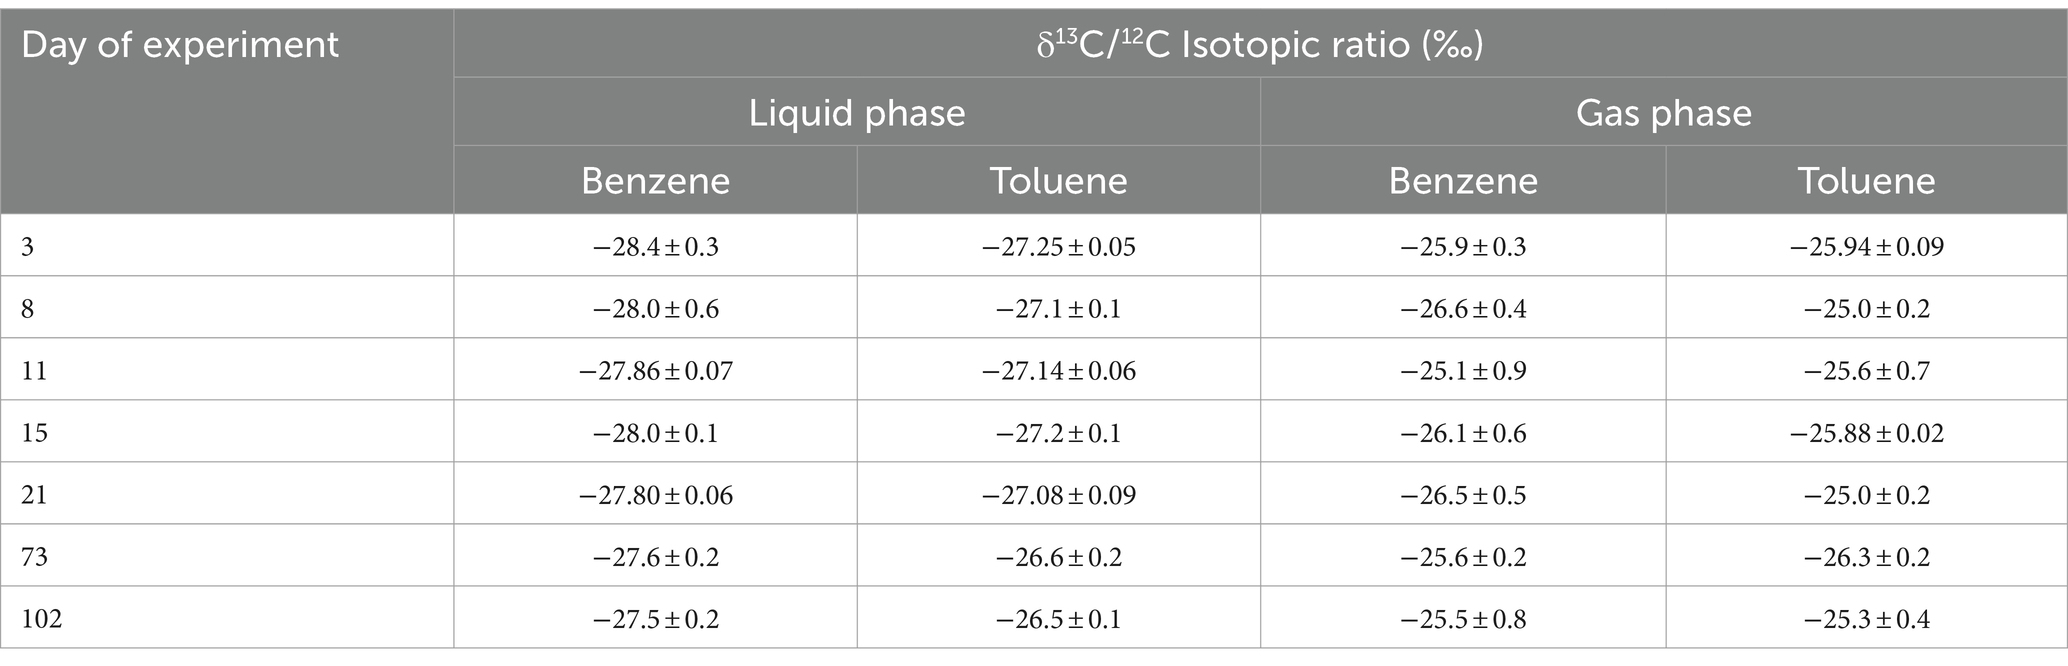
Table 2. Isotopic ratios of benzene and toluene during the experiment.
3.4 Microbial community evolution during the experiment
During the experiment, the prokaryotic concentration increased from 2.4∙104 ± 4.3∙103 copies of 16S rRNA genes.mL−1 at the beginning of the experiment to a maximum of 7.4∙105 ± 2.2∙105 copies of 16S rRNA genes.mL−1 after 21 days of incubation (Figure 3A). After 105 days of incubation, the average concentration of 16S rRNA genes was 2.7∙105 ± 8.8∙104 copies.mL−1. Based on the results of the dsrB gene quantification, sulfate reducers were present throughout the experiment despite the total sulfate consumption after day 20. A complementary experiment using Desulforamulus profundi Bs107 as a model sulfate reducer demonstrated dsrB gene expression even in the absence of sulfate (data not shown). After H2 injection on day 9, the concentration of sulfate-reducers continuously increased from 4.4∙102 ± 6.0∙101 (day 9) to 1.0∙105 ± 3.1∙104 copies of the dsrB genes.mL−1 (day 43). Based on the mcrA gene, methanogens began to be detected on day 10 (1 day after H2 injection), with 1.8∙101 ± 7.7∙100 copies of the mcrA gene.mL−1. The concentrations of these archaea remained quite low until day 21 (<2.4 101 copies of the mcrA gene.mL−1). Then, they reached a maximum on day 71, with 1.0∙104 ± 3.3∙103 copies of the mcrA gene.mL−1. Their concentrations remained stable until the end of the experiment. Microbial activity decreased throughout the incubation period (Figure 3B), as did the sulfate-reducing activity. From day 43 onward, methanogens showed increased activity within the microbial community.
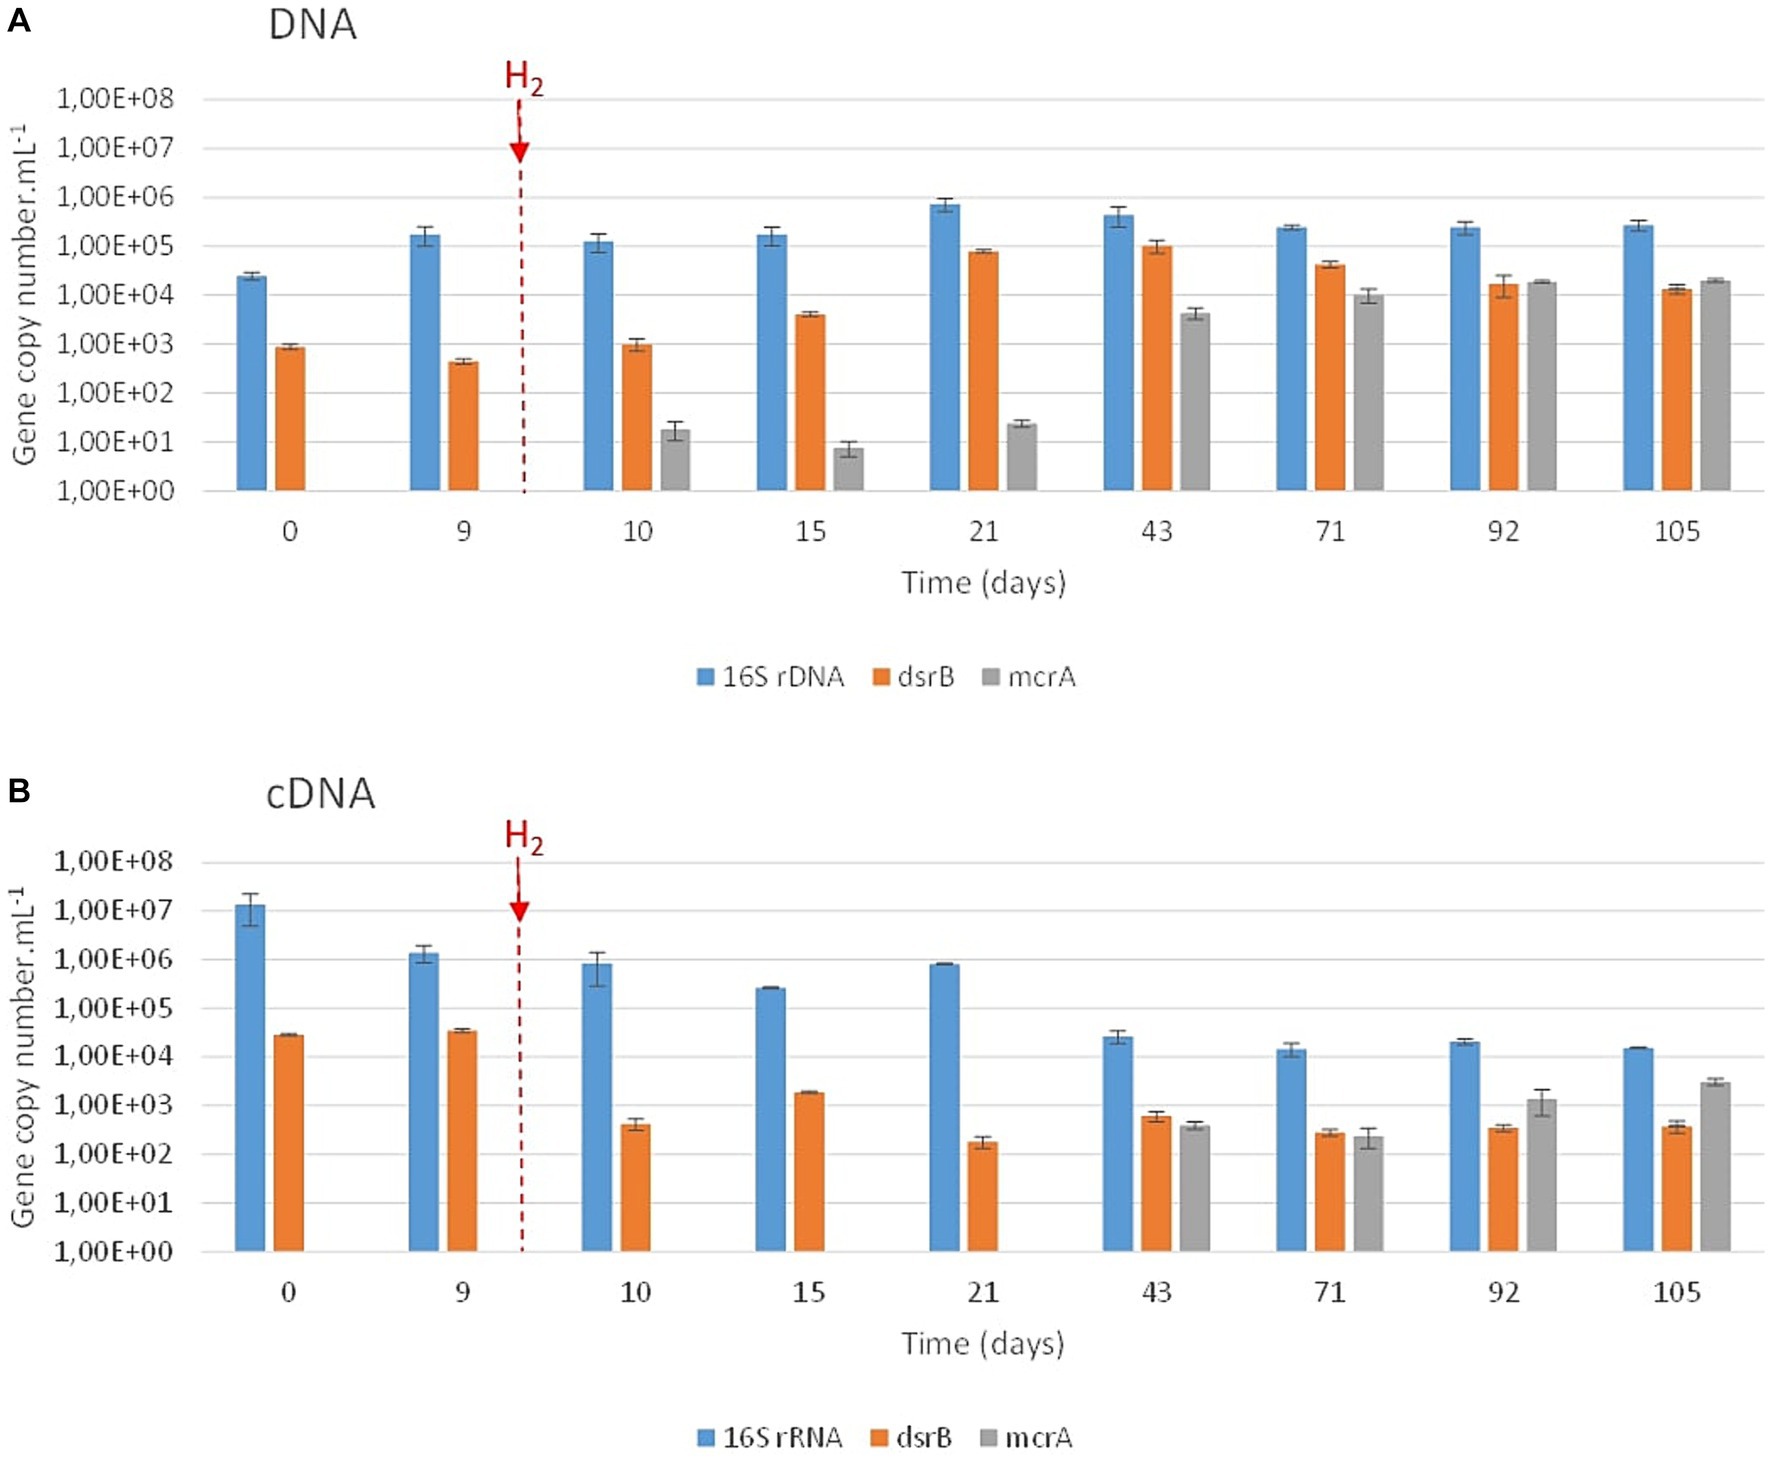
Figure 3. qPCR quantification of prokaryotes, sulfate reducers and methanogens over incubation time. The various microbial groups were targeted via the 16S rRNA (prokaryotes; in blue), dsrB (sulfate reducers; in orange) and mcrA (methanogens; in gray) genes (A) and their transcripts (B). H2 injection is indicated by the vertical red hatched line.
The taxonomic diversity of the microbial community was monitored during the experiment by high-throughput sequencing of the 16S rRNA gene (Figure 4). Initially, the microbial community was dominated by the Peptococcaceae (54% relative representativeness), Gracilibacteraceae (30%), Rhizobiaceae (4%), and Tannerallaceae (2%) families (Figure 4A). Just before H2 injection (day 9) and 1 day after, the largely dominant family was Peptococcaceae, with 95% and 94% relative representativeness, respectively. After 21 days of incubation, i.e., 12 days after H2 injection, the microbial community was dominated by the Peptococcaceae (50%), Spirochaetaceae (fermentative bacteria; 23%) and Tannerellaceae (20%) families. Among the Spirochaetaceae, the most abundant ASV could be affiliated with Rectinema cohabitans HM (100% identity on 366 nt). By day 43, members of three other families began to grow until day 105: Anaerosomataceae (OPB41; 3%), Moorellaceae (2%) and Methanobacteriaceae (8%). The Peptococcaceae family was almost exclusively represented by sulfate-reducing bacteria close to the Desulforamulus reducens species until day 10. From day 15, the detection of formate led us to analyze the microbial diversity to identify the producer of this molecule. At this time, bacteria affiliated with a second taxonomic group of Peptococcaceae began to grow. This group is phylogenetically close to a strain previously isolated from the same aquifer, Ab_L_15_s1 (377 nt; 100% identity), which has not been described and whose closest genus is Phosphitispora (1,348 nt; 94%; personal communication). As incubation progresses, these bacteria became dominant within Peptocococcaceae, representing 44 to 81% of the sequences affiliated with this family. Finally, a third group of Peptococcaceae, close to the sulfate-reducing species Desulforamulus profundi Bs107 (377 nt; 100%), developed from day 21 and represented 9 to 13% of the representatives of this family until the end of incubation. Regarding active microorganisms (Figure 4B), in addition to the described families, there were two other families active after H2 injection: Tannerellaceae (fermentative bacteria), Spirochaetaceae (fermentative bacteria), Peptococcaceae (sulafe reducers and fermenters), Moorellaceae (acetogens), Eubacteriaceae (fermentative bacteria) and Desulfurisporaceae (sulfate reducers). Throughout the experiment, the microbial community was largely dominated by bacteria, and methanogenic archaea accounted for only 8% of the relative representativeness at the end of incubation. Most members of the Methanobacteriaceae family are affiliated with the species Methanobacterium flexile (381 nt; 100%; accession #NR_116276).
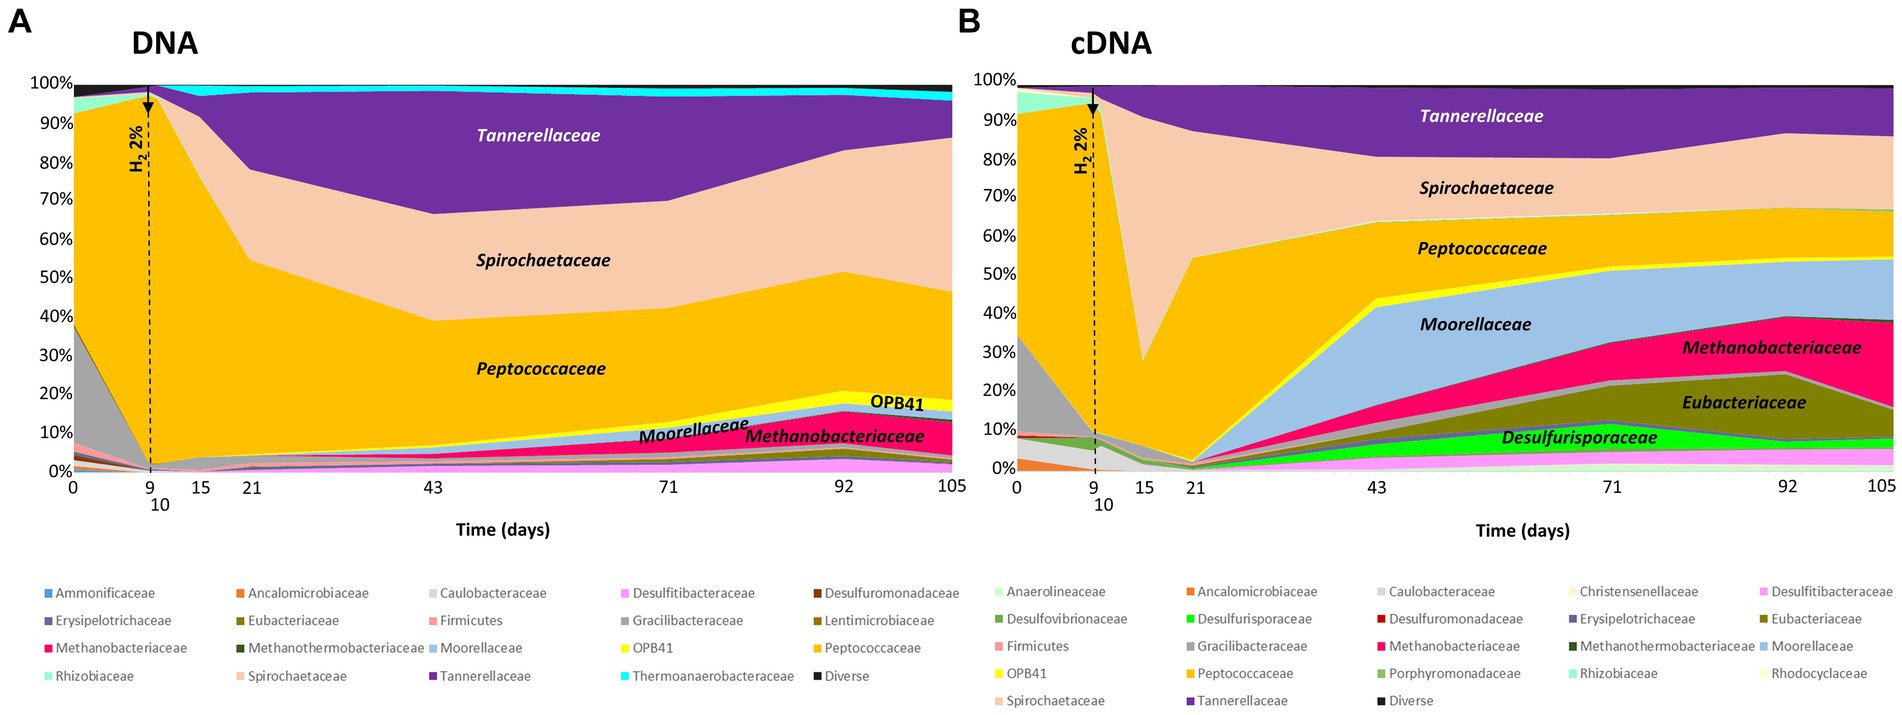
Figure 4. Monitoring the taxonomic diversity of microorganisms evolving in the high-pressure reactor during simulated H2 injection in a deep aquifer used as a UGS. (A) Analysis of prokaryotic diversity based on the 16S rRNA gene; (B) Analysis of prokaryotic diversity based on transcripts of the same gene. The results are expressed as relative proportions. The vertical hatched line indicates the day of H2 injection. The names of the major families are indicated in the figures.
3.5 Solid phase evolution during the experiment
XRD revealed quartz in the initial rock (80%) with calcite (12%), muscovite (4%), and clay minerals, including illite and kaolinite, as well as traces of iron sulfite (marcasite; Figure 5). At the end of the experiment, the same phases were detected. Note that illite clay minerals seemed to increase slightly at the bottom of the basket, while iron sulfides increased in the middle.
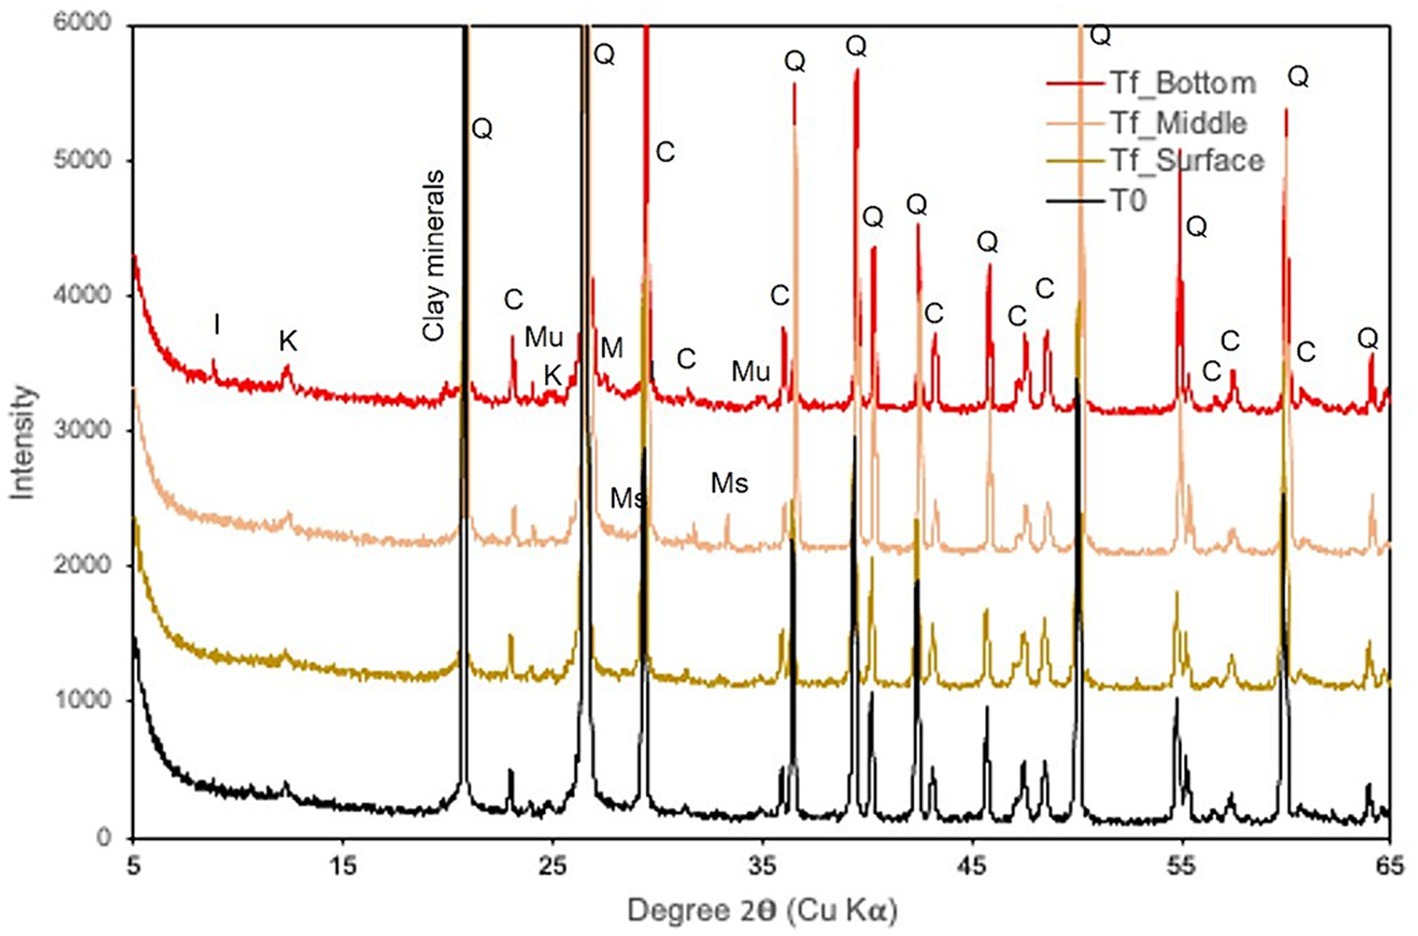
Figure 5. X-ray diffraction patterns of samples collected at the beginning (T0) and at the end of the experiment (Tf) at various reactor depths. I, illite; K, kaolinite; Q, quartz; C, calcite; Mu, muscovite; Ms., Marcasite.
SEM–EDS observations showed that the solid phase was mainly composed of quartz (Figure 6). The grains were variably coated with micritic calcite and, to a lesser extent, clays, with both phases commonly mixed. The molding of former micrite grains on the surface of several quartz grains indicated an episode of quartz overgrowth after micrite emplacement. Other minerals presented in trace amounts included iron sulfides and, more rarely, K-rich silicates (identified as muscovite by XRD), barite, rutile, and iron oxides. All these phases were observed as parts of the coatings. Although the well-preserved euhedral morphology of the micrites might have suggested authigenic growth, most of the iron sulfide grains were interpreted as being of detrital origin. No marked changes could be observed before or after the experiment.
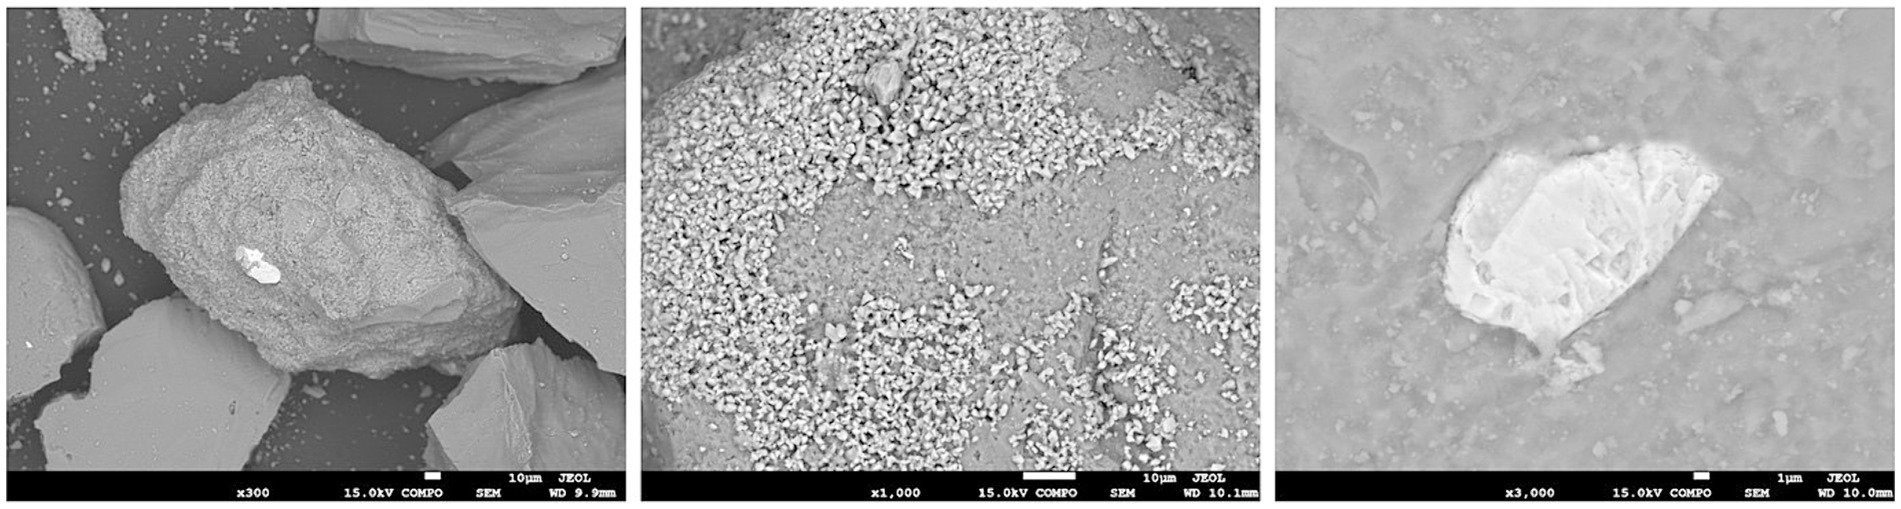
Figure 6. SEM image of variably coated quartz grains. Note the presence of an iron sulfide grain in white (left). Close-up of micrite grains forming a quartz grain coating, with molds of former micrite grains on the quartz surface (middle). Close-up of an iron sulfide grain of detrital origin partially embedded in quartz (right).
3.6 Biochemical modeling
To calculate the extent of each metabolic reaction, the reactions cited in section 2.2.6 were considered during the periods when the microorganisms used were detected. Sulfate reduction, acetogenesis, formate production, and methanogenesis were considered from days 9 to 15, 9 to 105, 9 to 105, and 35 to 105, respectively. From H2 injection on day 9 to total sulfate consumption, H2 was consumed only by sulfate reducers (3.5∙10−3 ± 1.8∙10−4 mol; Figure 7). From day 15, H2 was consumed through acetogenesis (5.4∙10−3 ± 2.7∙10−4 mol) and formate production (4.5∙10−3 ± 2.2∙10−4 mol). From day 35 to the end of the experiment, methanogenesis explained most of the H2 consumption (2.5∙10−2 ± 5.0∙10−3 mol). Overall, methanogenesis was the primary source of H2 consumption. While H2S was not detected in the gas phase, based on sulfate reduction after day 9, 8.8∙10−4 ± 4.4∙10−4 mol of sulfide should have been produced.
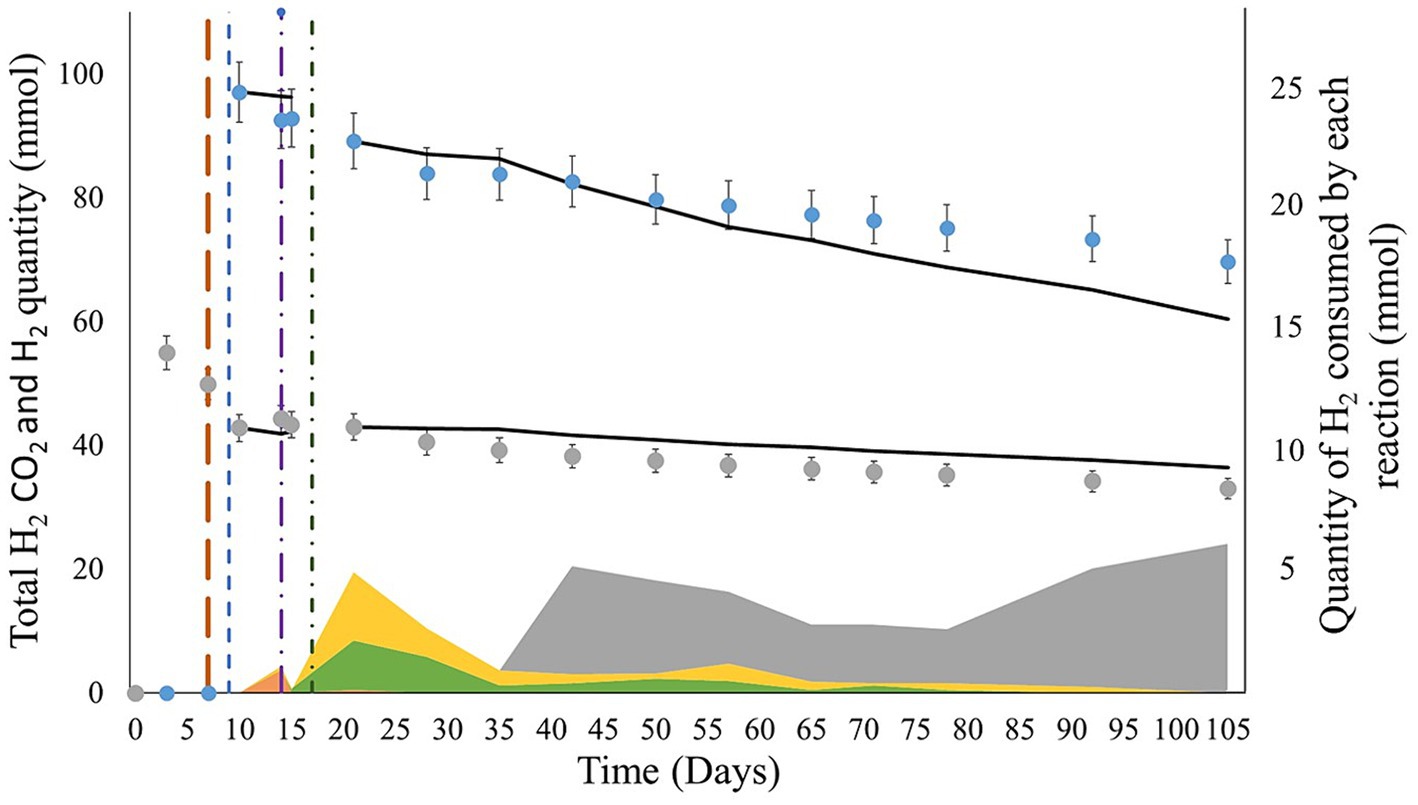
Figure 7. Comparison of the evolution of the experimental and modeled H2 and CO2 quantities during the experiments. The blue and gray dots represent the evolution of the total experimental quantities of H2 and CO2 (liquid + gas phase), respectively. The black curves show the quantities of H2 and CO2 modeled by calculating the extent of the reaction. The brown, blue, purple, and green vertical lines indicate the CH4 + CO2 gas mix reinjection, H2 injection, total sulfate consumption, and formation water reinjection, respectively. The orange, yellow, green, and gray areas correspond to the H2 quantities consumed by sulfate reduction, acetogenesis, formate production, and methanogenesis, respectively, between each measuring point.
3.7 In situ characterization protocol
On the first sampling with this protocol, on day 28, the pH obtained was 6.0 (Figure 8). This value did not significantly evolve throughout the experiment, as the evolution of the solution composition was slow. All the pH values were between 6.0 and 6.1. The values measured at atmospheric pressure were between 6.6 and 7.2. Gas solubilization caused acidification of the solution. The carbon and hydrogen Nernst potentials were distinct, directly showing the lack of equilibrium among the redox couples. For pH, the values were stable for each potential. The carbon and hydrogen ranged from −439 to −430 mV and −577 and −572 mV, respectively. The uncertainty of these values was calculated with the combined uncertainties of the measures used in this protocol. The uncertainty of the pH was ±0.1 and was mainly due to the uncertainty in the quantity of CO2 and bicarbonate. The uncertainty of the Nernst potential was ±10 mV, which was caused mainly by the uncertainty of the pH.
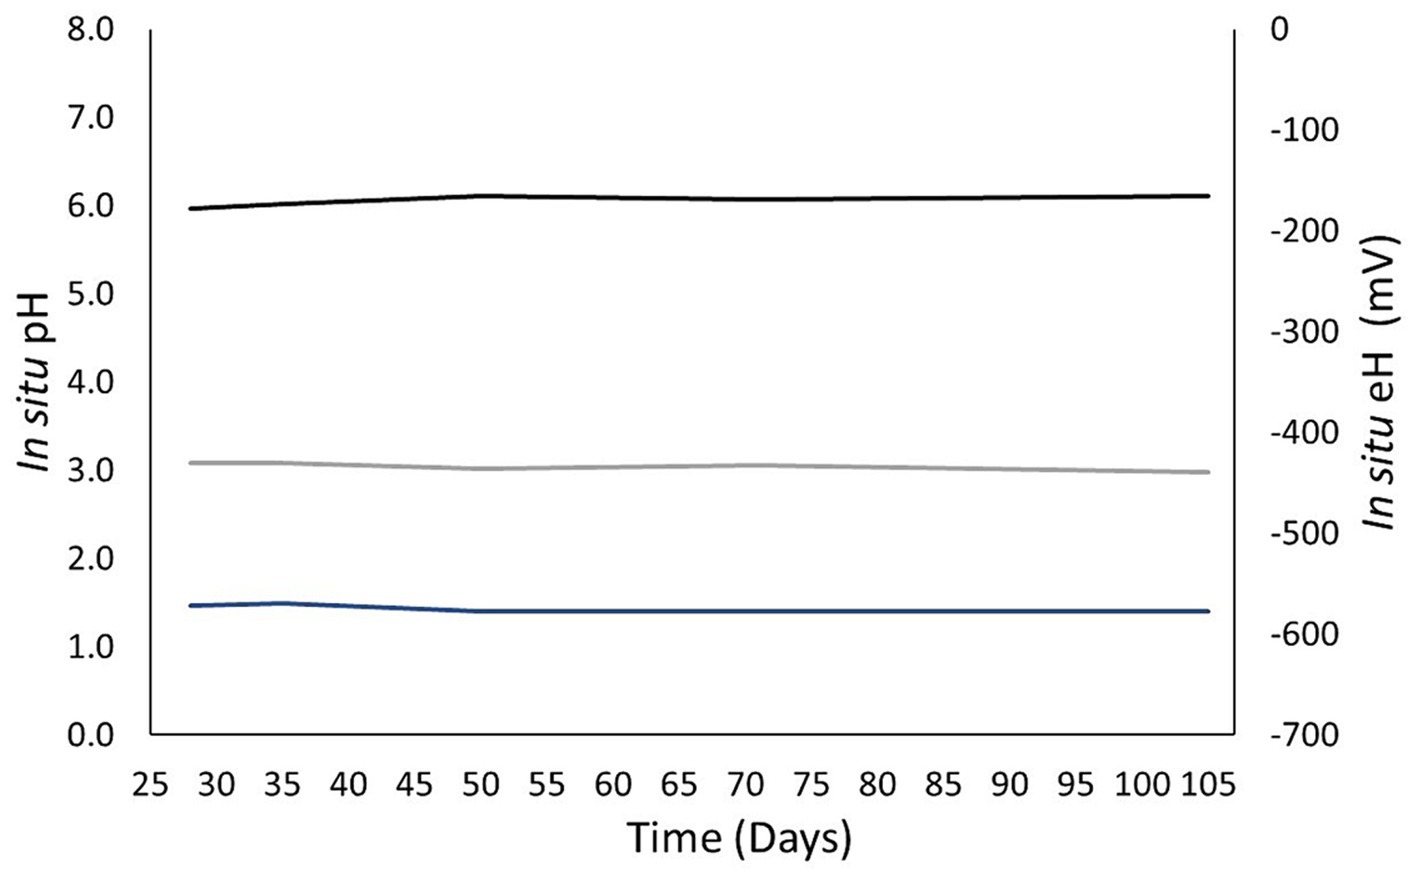
Figure 8. Evolution of the in situ pH and oxidoreduction potential computed with the in situ characterization protocol developed in this work. The black curve represents the calculated pH. The gray and blue curves correspond to the carbon and hydrogen redox potentials calculated by the Nernst equation.
4 Discussion
The H2 geological storage simulated in this experiment has the particularity of targeting a low-salt aquifer (Ab_L_1) with sulfate concentrations below 7 mg. L−1 (Haddad et al., 2022a, 2023). At the beginning of incubation, the gas phase consisted of 99% CH4, 1% CO2, 7.95 ppm benzene, and 3.57 ppm toluene at a pressure of 60 bar and a temperature of 36°C. Some of the CO2 rapidly solubilized in water. Storage of the aquifer formation water containing the microorganisms most certainly resulted in an evolution in its taxonomic composition, although the sample was kept at 4°C to slow metabolism.
4.1 Sulfate and acetate evolution
In the formation water, sulfate was the main external electron acceptor available to microorganisms and was most certainly depleted, explaining why, at the beginning of the experiment, the microbial community was largely dominated by bacteria capable of fermenting the organic molecules present or necromass. Among these microorganisms, the amplicon sequence variants (ASVs) grouped in the Peptococcaceae family were, for the most part, affiliated with the sulfate-reducing Desulforamulus reducens species, described as being capable of fermenting simple compounds, such as pyruvate (Visser et al., 2016). At the beginning of incubation, the microbial community returned to conditions close to those in situ (temperature, pressure, rock, etc.) with a gas phase simulating natural gas storage. D. reducens was the main sulfate reducer present, completely consuming 0.99 mmol of sulfate in just 15 days. This sulfate reducer likely operated mainly heterotrophically prior to H2 injection. This species has been shown to incompletely oxidize organic molecules serving as carbon sources (Visser et al., 2016) and could therefore be one of the sources of acetate. Furthermore, the measured sulfate consumption (0.6 mmol) and acetate production (1.2 mmol) between days 3 and 10 are consistent with this metabolic stoichiometry (Daumas et al., 1993). This metabolic activity could also partly explain bicarbonate production in the incubation phase. Members of the Gracillibacteriaceae and Spirochaetaceae (i.e., Rectinema cohabitans) families also participate in acetate production via fermentation (Lee et al., 2006; Haddad et al., 2022b). As soon as sulfate was depleted, the relative abundance of D. ramulus species declined sharply from almost 100% of the relative abundance of Peptococcaceae to 7%.
4.2 Formate evolution
Formate began to be detected on day 15, i.e., 6 days after H2 injection. Previous studies have shown that formate appears very quickly after H2 addition under conditions similar to those in our experiment (Haddad et al., 2022b; Mura et al., 2024). In this study, however, sulfate was depleted by day 15. Based on the work of Visser and collaborators (2016), we hypothesize that D. reducens can use formate produced between days 9 and 15 as a carbon source as long as sulfate is present as an electron acceptor. This would explain the apparent delay in formate production in this experiment and the sharp increase between days 15 and 21. For the formate source, Peptococcaceae, close to strain Ab_L_15_s1, developed from day 15 and remained active until the end of incubation. As hypothesized, pressure incubation with CO2 is thought to promote formate production during acetogenesis (Haddad et al., 2022b; Mura et al., 2024). The Peptococcaceae strain Ab_L_15_s1 could therefore be a good candidate in the search for the microorganism responsible for formate production in this study. The low equilibrium constant for formate production (Stams, 1994) could explain why formate was not observed in near atmospheric pressure experiments. Formate production at high pressure could be triggered by equilibrium displacement due to high H2 partial pressure. Under the conditions of this study, the calculated equilibrium molality of formate enabled by thermodynamic equilibrium just after H2 injection (day 14) was 6.7 mmol.kg−1, whereas this value would be negligible for the same H2 molar fraction at atmospheric pressure (0.1 mmol.kg−1). This could explain why formate is not detected in near atmospheric pressure experiments. The decrease in the formate production rate observed at the end of the experiment could be caused by thermodynamic constraints as the reaction approaches equilibrium (Jin and Bethke, 2005). Finally, the species Methanobacterium flexile, family Methanobacteriaceae, has been described to utilize H2/CO2 or formate (Zhu et al., 2011). Moreover, methanogenesis is an alkalinity-producing metabolic process. It was previously described that H2 or formate utilization in Methanococcus thermolithotrophicus was pH dependent, with formate utilization favored at higher pH (Belay et al., 1986). However, pH monitoring in the bulk appeared to be constant throughout the experiment (pH 6.0–6.1). Different pH values cannot be ruled out in microniches with different rock porosities, but this cannot be verified. Another hypothesis could be that formate consumers need time to adapt. Notably, the members of the OPB41 taxon (family Anaerosomataceae), detected from day 43 onward, have been shown to grow lithotrophically on H2 or formate (Khomyakova et al., 2022).
4.3 Evolution of CO2, H2, CH4, and H2S
The physicochemical monitoring of CO2, H2, CH4 and H2S throughout the experiment revealed no substantial changes. Although it was not possible to measure the production of CH4 and H2S, it is nevertheless certain that these molecules were produced by microbial metabolism. Fermentation products include CO2, H2, and organic acids such as acetate. Furthermore, the modeled H2 consumption based on sulfate-reduction, methanogenesis, acetogenesis and formate production extents of reaction was overestimated, which could support the fact that fermenters produced H2. Methanogens produced methane, as the calculated extent of acetogenesis was insufficient to explain the global CO2 consumption. As for methanogens, they obviously produced methane, as the calculated acetogenesis extent of reaction was insufficient to explain the global CO2 consumption. Extents of reaction calculations suggest that methanogenesis was responsible for the major part of H2 consumption. As in a study (Haddad et al., 2022b) with a similar sulfate concentration before H2 injection (1.2 mM), H2S was not detected in the gas phase. The low but continuous release of iron during the experiment and the detection of a potentially greater amount of marcasite at the end of the experiment suggest the attenuation of sulfide by iron sulfide precipitation. We hypothesize that this release could occur by partial dissolution of iron-bearing minerals, possibly aluminosilicates and/or clays.
4.4 Calcite dissolution
Calcium and bicarbonate release in the aqueous phase occurred only during the incubation phase, implying that calcite dissolution was triggered by the equilibration of the formation water with the rock. Indeed, the calculated in situ pH was two units lower than the measured pH of the initial water mix at atmospheric pressure, mainly because of CO2 degassing during the depressurization of the bottom hole samplers. We hypothesize that calcite precipitated during formation water sampling and dissolved after the initial CO2 injection. Thus, this phenomenon was not linked to H2 injection and should not lead to porosity changes in the reservoir. Globally, changes in mineralogy remain small and do not indicate a risk of variation in the petrological properties during storage.
4.5 Benzene and toluene evolution
Benzene and toluene were added to the gas phase to obtain conditions similar to those in the field (Aüllo et al., 2016). These monoaromatic compounds are also present in water due to thermodynamic equilibrium. These compounds were monitored in both the liquid and gas phases. The variations observed during the first few days could be caused by adsorption on the solid surface and the liquid–vapor equilibrium. The isotopic values of carbon fluctuate around −27.9 ± 0.3 ‰ and – 27.0 ± 0.3 ‰ for benzene and toluene, respectively, in water, which does not indicate enrichment or depletion. The conditions of the experiment (duration and addition of water and gas containing benzene and toluene) impact the evidence of biodegradation, as the concentration of benzene and toluene in the water depends on the thermodynamic equilibrium with the gas phase (Darracq et al., 2009). The experiment did not last long enough to demonstrate biodegradation, as benzene degradation by sulfate-reducing bacteria is slow compared to other metabolic processes (Mancini et al., 2003).
4.6 Fate of a UGS coinjected with 2% H2
In this study, the scenario tested was the coinjection of 2% H2 with a gas mixture simulating natural gas (99% CH4, 1% CO2, traces of BT). Without an anomaly, the storage site we experimentally simulated is in a low-salt water and, therefore, has a very low sulfate concentration. Deep aquifers are oligotrophic, and the presence of natural gas in the vicinity has been shown to increase microbial activity, particularly sulfate reduction, due to the dissolved organic molecules of the gas in the formation water, even if some of these molecules are recalcitrant to biodegradation (Ranchou-Peyruse et al., 2019). Thus, even the sulfate renewed by the slow recharge of water could not compensate for the decrease in its concentration over the years. During massive H2 injection, it is therefore expected that the only two electron acceptors will be sulfate and CO2. In view of the results presented here, it seems likely that sulfate will be depleted very quickly since there are few sulfated minerals (Figure 1). A nonnegligible proportion of the sulfide will remain trapped in the rock as iron sulfide (Figure 6). This means that the last available electron acceptor remaining, and therefore a limiting growth factor, will be CO2. Dihydrogen and CO2 are then consumed by acetogenic and methanogenic microorganisms. In our case, this consumption appeared to be limited over the incubation period of approximately 3 months. There are other limiting nutrients that slow microbial development and seem to prevent it from exceeding a maximum concentration of microorganisms (Figure 3). The low metabolic efficiency of sulfate reduction, acetogenesis, and methanogenesis observed here contrasts with results for other UGSs simulated in high-pressure reactors and showing alkalinization phenomena (Haddad et al., 2023; Mura et al., 2024).
5 Conclusion
In this study, the injection of a natural gas/H2 blend (98% / 2%) in a low-salinity aquifer was simulated in a high-pressure reactor. This work provides more data for understanding H2 behavior in deep aquifers and helps researchers understand the parameters affecting site variations. Overall, this experiment suggested that H2 coinjection with natural gas in this UGS could be viable due to several factors:
• Contrary to experiments using the same protocol, while sulfate reducers and methanogens were active, only a minor amount of H2 was consumed over the 3 months of the experiment. This probably occurred due to a lack of nutrients.
• Dissolution and precipitation of minerals likely occurred but were not formally detected. As for other experiments, the impact of H2 on the aquifer porous rock is negligible, as no significant changes were observed in the XRD and SEM analyses.
• After initial CO2 solubilization from the injected CH4/CO2/benzene/toluene gas mixture, no significant changes in the reactor in situ pH or redox potential were observed due to low microbial activity. Thus, calcium or magnesium carbonate precipitation was prevented.
Although we identified key parameters for viable H2 costorage in deep aquifers, quantitative extrapolation of these results to the reservoir remains a challenge due to scale effects. Notably, the conditions simulated in the reactor represent those encountered near the gas bubble, but due to transport phenomena, the conditions far from the gas bubble could be very different. Thus, the modeling of pilot-scale studies will be essential for accurate feed reservoir simulations of H2 costorage in aquifers.
Data availability statement
The datasets presented in this study can be found in online repositories. The names of the repository/repositories and accession number(s) can be found at: https://www.ncbi.nlm.nih.gov/, PRJNA1117242.
Author contributions
JM: Writing – review & editing, Writing – original draft, Visualization, Software, Methodology, Investigation, Formal analysis, Data curation. MR-P: Writing – review & editing, Writing – original draft, Visualization, Validation, Supervision, Methodology, Investigation, Formal analysis, Data curation, Conceptualization. MG: Writing – original draft, Methodology, Investigation, Formal analysis, Data curation. MD: Writing – original draft, Supervision, Methodology, Data curation. ML: Writing – original draft, Methodology, Investigation, Data curation. M-PI: Writing – review & editing, Writing – original draft, Visualization, Validation, Methodology, Investigation, Data curation. IH: Writing – review & editing, Writing – original draft, Validation, Methodology, Investigation, Data curation. GH: Writing – review & editing, Writing – original draft, Validation, Methodology, Investigation, Data curation. MP: Writing – original draft, Methodology, Investigation, Data curation. MdSB: Writing – original draft, Methodology, Investigation, Data curation. PCh: Writing – original draft, Validation, Resources, Funding acquisition, Conceptualization. GC: Writing – original draft, Validation, Resources, Funding acquisition, Conceptualization. AP: Writing – original draft, Validation, Resources, Investigation, Funding acquisition, Conceptualization. PCe: Writing – review & editing, Writing – original draft, Validation, Supervision, Resources, Project administration, Methodology, Investigation, Funding acquisition, Conceptualization. AR-P: Writing – review & editing, Writing – original draft, Visualization, Validation, Supervision, Resources, Project administration, Methodology, Investigation, Funding acquisition, Formal analysis, Conceptualization.
Funding
The author(s) declare that financial support was received for the research, authorship, and/or publication of this article. MR-P salary was supported by E2S-UPPA.
Acknowledgments
Teréga and Storengy are acknowledged for funding this research project. We are grateful to the Genotoul platform (genotoul.fr) for the sequencing analyses.
Conflict of interest
PCh, GC, and AP were employed by two French companies specialized in geological natural gas storage which are Teréga and Storengy.
The remaining authors declare that the research was conducted in the absence of any commercial or financial relationships that could be construed as a potential conflict of interest.
Publisher’s note
All claims expressed in this article are solely those of the authors and do not necessarily represent those of their affiliated organizations, or those of the publisher, the editors and the reviewers. Any product that may be evaluated in this article, or claim that may be made by its manufacturer, is not guaranteed or endorsed by the publisher.
References
Aghaei, H., Al-Yaseri, A., Toorajipour, A., Shahsavani, B., Yekeen, N., and Edlmann, K. (2023). Host-rock and caprock wettability during hydrogen drainage: implications of hydrogen subsurface storage. Fuel 351:129048. doi: 10.1016/j.fuel.2023.129048
Ali, M., Arif, M., Sedev, R., Sánchez-Román, M., Keshavarz, A., and Iglauer, S. (2023). Underground hydrogen storage: the microbiotic influence on rock wettability. J. Energy Storage 72:108405. doi: 10.1016/j.est.2023.108405
Amid, A., Mignard, D., and Wilkinson, M. (2016). Seasonal storage of hydrogen in a depleted natural gas reservoir. Int. J. Hydrogen Energy 41, 5549–5558. doi: 10.1016/j.ijhydene.2016.02.036
Aüllo, T., Berlendis, S., Lascourrèges, J.-F., Dessort, D., Duclerc, D., Saint-Laurent, S., et al. (2016). New bio-indicators for long term natural attenuation of Monoaromatic compounds in deep terrestrial aquifers. Front. Microbiol. 7:122. doi: 10.3389/fmicb.2016.00122
Belay, N., Sparling, R., and Daniels, L. (1986). Relationship of formate to growth and methanogenesis by Methanococcus thermolithotrophicus. Appl. Environ. Microbiol. 52, 1080–1085. doi: 10.1128/aem.52.5.1080-1085.1986
Berg, M., Bolotin, J., and Hofstetter, T. B. (2007). Compound-specific nitrogen and carbon isotope analysis of nitroaromatic compounds in aqueous samples using solid-phase microextraction coupled to GC/IRMS. Anal. Chem. 79, 2386–2393. doi: 10.1021/ac0622577
Blanc, P., Lassin, A., Piantone, P., Azaroual, M., Jacquemet, N., Fabbri, A., et al. (2012). Thermoddem: a geochemical database focused on low temperature water/rock interactions and waste materials. Appl. Geochem. 27, 2107–2116. doi: 10.1016/j.apgeochem.2012.06.002
Bo, Z., Boon, M., Hajibeygi, H., and Hurter, S. (2023). Impact of experimentally measured relative permeability hysteresis on reservoir-scale performance of underground hydrogen storage (UHS). Int. J. Hydrogen Energy 48, 13527–13542. doi: 10.1016/j.ijhydene.2022.12.270
Bolyen, E., Rideout, J. R., Dillon, M. R., Bokulich, N. A., Abnet, C. C., Al-Ghalith, G. A., et al. (2019). Reproducible, interactive, scalable and extensible microbiome data science using QIIME 2. Nat. Biotechnol. 37, 852–857. doi: 10.1038/s41587-019-0209-9
Buscheck, T. A., Goodman, A., Lackey, G., De Toledo Camargo, J., Huerta, N., Haeri, F., et al. (2023). Underground storage of hydrogen and hydrogen/methane mixtures in porous reservoirs: influence of reservoir factors and engineering choices on deliverability and storage operations. Int. J. Hydrogen Energy 49, 1088–1107. doi: 10.1016/j.ijhydene.2023.07.073
Buzek, F., Onderka, V., Vancura, P., and Wolf, I. (1994). Carbon isotope study of methane production in a town gas storage reservoir. Fuel 73, 747–752. doi: 10.1016/0016-2361(94)90019-1
Callahan, B. J., McMurdie, P. J., Rosen, M. J., Han, A. W., Johnson, A. J. A., and Holmes, S. P. (2016). DADA2: high-resolution sample inference from Illumina amplicon data. Nat. Methods 13, 581–583. doi: 10.1038/nmeth.3869
Chai, M., Chen, Z., Nourozieh, H., and Yang, M. (2023). Numerical simulation of large-scale seasonal hydrogen storage in an anticline aquifer: a case study capturing hydrogen interactions and cushion gas injection. Appl. Energy 334:120655. doi: 10.1016/j.apenergy.2023.120655
Darracq, G., Couvert, A., Couriol, C., Amrane, A., and Le Cloirec, P. (2009). Absorption and biodegradation of hydrophobic volatile organic compounds: determination of Henry’s constants and biodegradation levels. Water Sci. Technol. 59, 1315–1322. doi: 10.2166/wst.2009.124
Daumas, S., Magot, M., and JL, C. (1993). Measurement of the net production of acidity by a sulphate-reducing bacterium: experimental checking of theoretical models of microbiaily influenced corrosion. Res. Microbiol. 144, 327–332.
Dohrmann, A. B., and Krüger, M. (2023). Microbial H2 consumption by a formation fluid from a natural gas Field at high-pressure conditions relevant for underground H2 storage. Environ. Sci. Technol. 57, 1092–1102. doi: 10.1021/acs.est.2c07303
Dopffel, N., Jansen, S., and Gerritse, J. (2021). Microbial side effects of underground hydrogen storage – knowledge gaps, risks and opportunities for successful implementation. Int. J. Hydrogen Energy 46, 8594–8606. doi: 10.1016/j.ijhydene.2020.12.058
Dopffel, N., Mayers, K., Kedir, A., Alagic, E., An Stepec, B., Djurhuus, K., et al. (2023). Microbial hydrogen consumption leads to a significant pH increase under high-saline-conditions: implications for hydrogen storage in salt caverns. Sci. Rep. 13:10564. doi: 10.1038/s41598-023-37630-y
Dupraz, S., Parmentier, M., Ménez, B., and Guyot, F. (2009). Experimental and numerical modeling of bacterially induced pH increase and calcite precipitation in saline aquifers. Chem. Geol. 265, 44–53. doi: 10.1016/j.chemgeo.2009.05.003
Ebrahimiyekta, A. (2017). Characterization of geochemical interactions and migration of hydrogen in sandstone sedimentary formations: Application to geological storage. (Doctoral dissertation, Université d’Orléans)
Eddaoui, N., Panfilov, M., Ganzer, L., and Hagemann, B. (2021). Impact of pore clogging by Bacteria on underground hydrogen storage. Transp. Porous Media 139, 89–108. doi: 10.1007/s11242-021-01647-6
Fillinger, L., Griebler, C., Hellal, J., Joulian, C., and Weaver, L. (2023). “Chapter 9—microbial diversity and processes in groundwater” in Groundwater ecology and evolution. eds. F. Malard, C. Griebler, and S. Rétaux. 2nd ed (San Diego: Academic Press), 211–240.
Fischer, A., Manefield, M., and Bombach, P. (2016). Application of stable isotope tools for evaluating natural and stimulated biodegradation of organic pollutants in field studies. Curr. Opin. Biotechnol. 41, 99–107. doi: 10.1016/j.copbio.2016.04.026
Geets, J., Borremans, B., Diels, L., Springael, D., Vangronsveld, J., van der Lelie, D., et al. (2006). DsrB gene-based DGGE for community and diversity surveys of sulfate-reducing bacteria. J. Microbiol. Methods 66, 194–205. doi: 10.1016/j.mimet.2005.11.002
Gelencsér, O., Árvai, C., Mika, L., Breitner, D., Leclair, D., Szabo, C., et al. (2023). Effect of hydrogen on calcite reactivity in sandstone reservoirs: experimental results compared to geochemical modeling predictions. J. Energy Storage 61:106737. doi: 10.1016/j.est.2023.106737
Gregory, S. P., Barnett, M. J., Field, L. P., and Milodowski, A. E. (2019). Subsurface microbial hydrogen cycling: natural occurrence and implications for industry. Microorganisms 7:53. doi: 10.3390/microorganisms7020053
Gu, Z., Eils, R., and Schlesner, M. (2016). Complex heatmaps reveal patterns and correlations in multidimensional genomic data. Bioinformatics 32, 2847–2849. doi: 10.1093/bioinformatics/btw313
Haddad, P. G., Mura, J., Castéran, F., Guignard, M., Ranchou-Peyruse, M., Sénéchal, P., et al. (2022a). Biological, geological and chemical effects of oxygen injection in underground gas storage aquifers in the setting of biomethane deployment. Sci. Total Environ. 806:150690. doi: 10.1016/j.scitotenv.2021.150690
Haddad, P. G., Ranchou-Peyruse, M., Guignard, M., Mura, J., Casteran, F., Ronjon-Magand, L., et al. (2022b). Geological storage of hydrogen in deep aquifers – an experimental multidisciplinary study. Energ. Environ. Sci. 15, 3400–3415. doi: 10.1039/D2EE00765G
Haddad, P. G., Ranchou-Peyruse, M., Guignard, M., Mura, J., Castéran, F., Sénéchal, P., et al. (2023). Physicochemical and microbiological effects of geological biomethane storage in deep aquifers: introduction of O 2 as a cocontaminant. Environ. Sci. Adv. 2, 1727–1738. doi: 10.1039/D3VA00086A
Hagemann, B., Rasoulzadeh, M., Panfilov, M., Ganzer, L., and Reitenbach, V. (2016). Hydrogenization of underground storage of natural gas: impact of hydrogen on the hydrodynamic and bio-chemical behavior. Comput. Geosci. 20, 595–606. doi: 10.1007/s10596-015-9515-6
Harati, S., Rezaei Gomari, S., Ramegowda, M., and Pak, T. (2023). Multi-criteria site selection workflow for geological storage of hydrogen in depleted gas fields: a case for the UK. Int. J. Hydrogen Energy. doi: 10.1016/j.ijhydene.2023.10.345
Heinemann, N., Scafidi, J., Pickup, G., Thaysen, E. M., Hassanpouryouzband, A., Wilkinson, M., et al. (2021). Hydrogen storage in saline aquifers: the role of cushion gas for injection and production. Int. J. Hydrogen Energy 46, 39284–39296. doi: 10.1016/j.ijhydene.2021.09.174
Hemme, C., and Van Berk, W. (2018). Hydrogeochemical modeling to identify potential risks of underground hydrogen storage in depleted gas fields. Appl. Sci. 8:2282. doi: 10.3390/app8112282
Hogeweg, S., Strobel, G., and Hagemann, B. (2022). Benchmark study for the simulation of underground hydrogen storage operations. Comput. Geosci. 26, 1367–1378. doi: 10.1007/s10596-022-10163-5
Hunkeler, D., Meckenstock, R. U., Sherwood Lollar, B., Schmidt, T. C., Wilson, J. T., Schmidt, T., et al. (2008). Report NO: EPA 600/R-08/148. A guide for assessing biodegradation and source identification of organic ground water contaminants using compound specific isotope analysis (CSIA) : US EPA Ada.
Ioka, S., Sakai, T., Igarashi, T., and Ishijima, Y. (2011). Long-term continuous in situ potentiometrically measured redox potential in anoxic groundwater with high methane and iron contents. Environ. Earth Sci. 64, 143–149. doi: 10.1007/s12665-010-0830-x
Izadi Amiri, I., Zivar, D., Ayatollahi, S., and Mahani, H. (2024). The effect of gas solubility on the selection of cushion gas for underground hydrogen storage in aquifers. J. Energy Storage 80:110264. doi: 10.1016/j.est.2023.110264
Jacquemet, N., Chiquet, P., and Grauls, A. (2020). Hydrogen reactivity with (1) a well cement-PHREEQC geochemical thermodynamics calculations. In: 1st geoscience & engineering in energy transition conference. Vol. 2020 European Association of Geoscientists & Engineers. 1–5.
Jadhawar, P., and Saeed, M. (2023a). Mechanistic evaluation of the reservoir engineering performance for the underground hydrogen storage in a deep North Sea aquifer. Int. J. Hydrogen Energy 50, 558–574. doi: 10.1016/j.ijhydene.2023.07.272
Jadhawar, P., and Saeed, M. (2023b). Optimizing the operational efficiency of the underground hydrogen storage scheme in a deep North Sea aquifer through compositional simulations. J. Energy Storage 73:108832. doi: 10.1016/j.est.2023.108832
Jin, Q., and Bethke, C. M. (2005). Predicting the rate of microbial respiration in geochemical environments. Geochim. Cosmochim. Acta 69, 1133–1143. doi: 10.1016/j.gca.2004.08.010
Kassambara, A., and Mundt, F. (2020). factoextra: Extract and Visualize the Results of Multivariate Data Analyses. Available at: https://cran.r-project.org/web/packages/factoextra/index.html (Accessed 30 January 2024).
Khomyakova, M. A., Zavarzina, D. G., Merkel, A. Y., Klyukina, A. A., Pikhtereva, V. A., Gavrilov, S. N., et al. (2022). The first cultivated representatives of the actinobacterial lineage OPB41 isolated from subsurface environments constitute a novel order Anaerosomatales. Front. Microbiol. 13:1047580. doi: 10.3389/fmicb.2022.1047580
Lê, S., Josse, J., and Husson, F. (2008). FactoMineR: An R package for multivariate analysis. J. Stat. Softw. 25:i01. doi: 10.18637/jss.v025.i01
Lee, Y.-J., Romanek, C. S., Mills, G. L., Davis, R. C., Whitman, W. B., and Wiegel, J. (2006). Gracilibacter thermotolerans gen. Nov., sp. nov., an anaerobic, thermotolerant bacterium from a constructed wetland receiving acid sulfate water. Int. J. Syst. Evol. Microbiol. 56, 2089–2093. doi: 10.1099/ijs.0.64040-0
Li, Z., Wang, X., Li, L., Zhang, M., Tao, M., Xing, L., et al. (2014). Development of new method of δ13C measurement for trace hydrocarbons in natural gas using solid phase micro-extraction coupled to gas chromatography isotope ratio mass spectrometry. J. Chromatogr. A 1372, 228–235. doi: 10.1016/j.chroma.2014.10.089
Liebscher, A., Wackerl, J., and Streibel, M. (2016). “Geologic storage of hydrogen—fundamentals, processing, and projects” in Hydrogen science and engineering: Materials, processes, systems and technology. eds. D. Stolten and B. Emonts (USA: Wiley), 629–658.
Lindberg, R. D., and Runnells, D. D. (1984). Ground water redox reactions: An analysis of equilibrium state applied to eh measurements and geochemical modeling. Science 225, 925–927. doi: 10.1126/science.225.4665.925
Liu, N., Kovscek, A. R., Fernø, M. A., and Dopffel, N. (2023). Pore-scale study of microbial hydrogen consumption and wettability alteration during underground hydrogen storage. Front. Energy Res. 11:1124621. doi: 10.3389/fenrg.2023.1124621
Logroño, W., Nikolausz, M., Harms, H., and Kleinsteuber, S. (2022). Physiological effects of 2-Bromoethanesulfonate on Hydrogenotrophic pure and mixed cultures. Microorganisms 10:355. doi: 10.3390/microorganisms10020355
Lysyy, M., Fernø, M. A., and Ersland, G. (2023). Effect of relative permeability hysteresis on reservoir simulation of underground hydrogen storage in an offshore aquifer. J. Energy Storage 64:107229. doi: 10.1016/j.est.2023.107229
Mancini, S. A., Ulrich, A. C., Lacrampe-Couloume, G., Sleep, B., Edwards, E. A., and Lollar, B. S. (2003). Carbon and hydrogen isotopic fractionation during anaerobic biodegradation of benzene. Appl. Environ. Microbiol. 69, 191–198. doi: 10.1128/AEM.69.1.191-198.2003
Maniglio, M., Rivolta, G., Elgendy, A., Panfili, P., and Cominelli, A. (2023). Evaluating the impact of biochemical reactions on H2 storage in depleted gas fields., (OnePetro). In: Paper presented at the SPE Annual Technical Conference and Exhibition, San Antonio, Texas, USA
McMurdie, P. J., and Holmes, S. (2013). Phyloseq: An R package for reproducible interactive analysis and graphics of microbiome census data. PLoS One 8:e61217. doi: 10.1371/journal.pone.0061217
Muller, E., Julia, G., Sissmann, O., Tafit, A., and Poirier, S. (2023). Changes in hydrogen conversion kinetics and microbial response to variations in temperature and mineralogy., in Goldschmidt 2023 Conference, (GOLDSCHMIDT).
Mura, J., Ranchou-Peyruse, M., Guignard, M., Haddad, P. G., Ducousso, M., Casteran, F., et al. (2024). Comparative study of three H2 geological storages in deep aquifers simulated in high-pressure reactors. Int. J. Hydrogen Energy 63, 330–345. doi: 10.1016/j.ijhydene.2024.02.322
Pan, B., Liu, K., Ren, B., Zhang, M., Ju, Y., Gu, J., et al. (2023). Impacts of relative permeability hysteresis, wettability, and injection/withdrawal schemes on underground hydrogen storage in saline aquifers. Fuel 333:126516. doi: 10.1016/j.fuel.2022.126516
Panfilov, M. (2010). Underground storage of hydrogen: in situ self-organisation and methane generation. Transp. Porous Media 85, 841–865. doi: 10.1007/s11242-010-9595-7
Parkhurst, D. L., and Appelo, C., and others (2013). Description of input and examples for PHREEQC version 3—a computer program for speciation, batch-reaction, one-dimensional transport, and inverse geochemical calculations. US Geol. Surv. Tech. Methods 6:497.
Pastore, L. M., Lo Basso, G., Quarta, M. N., and de Santoli, L. (2022). Power-to-gas as an option for improving energy self-consumption in renewable energy communities. Int. J. Hydrogen Energy 47, 29604–29621. doi: 10.1016/j.ijhydene.2022.06.287
Peng, D.-Y., and Robinson, D. B. (1976). A new two-constant equation of state. Ind. Eng. Chem. Fundam. 15, 59–64. doi: 10.1021/i160057a011
Pichler, M. (2019). “Underground sun storage results and outlook” in EAGE/DGMK joint workshop on underground storage of hydrogen (Celle, Germany: European Association of Geoscientists & Engineers), 1–4.
Ponsin, V., Buscheck, T. E., and Hunkeler, D. (2017). Heart-cutting two-dimensional gas chromatography–isotope ratio mass spectrometry analysis of monoaromatic hydrocarbons in complex groundwater and gas-phase samples. J. Chromatogr. A 1492, 117–128. doi: 10.1016/j.chroma.2017.02.060
Quast, C., Pruesse, E., Yilmaz, P., Gerken, J., Schweer, T., Yarza, P., et al. (2012). The SILVA ribosomal RNA gene database project: improved data processing and web-based tools. Nucleic Acids Res. 41, D590–D596. doi: 10.1093/nar/gks1219
Rabii, A., Aldin, S., Dahman, Y., and Elbeshbishy, E. (2019). A review on anaerobic co-digestion with a focus on the microbial populations and the effect of multi-stage digester configuration. Energies 12:1106. doi: 10.3390/en12061106
Ranchou-Peyruse, M., Auguet, J.-C., Mazière, C., Restrepo-Ortiz, C. X., Guignard, M., Dequidt, D., et al. (2019). Geological gas-storage shapes deep life. Environ. Microbiol. 21, 3953–3964. doi: 10.1111/1462-2920.14745
Ranchou-Peyruse, M., Guignard, M., Chiquet, P., Caumette, G., Cézac, P., and Ranchou-Peyruse, A. (2024). Assessment of the in situ biomethanation potential of a deep aquifer used for natural gas storage. FEMS Microbiol. Ecol. 100:66. doi: 10.1093/femsec/fiae066
Ranchou-Peyruse, M., Guignard, M., Haddad, P. G., Robin, S., Boesch, F., Lanot, M., et al. (2023). A deep continental aquifer downhole sampler for microbiological studies. Front. Microbiol. 13:1012400. doi: 10.3389/fmicb.2022.1012400
Reitenbach, V., Ganzer, L., Albrecht, D., and Hagemann, B. (2015). Influence of added hydrogen on underground gas storage: a review of key issues. Environ. Earth Sci. 73, 6927–6937. doi: 10.1007/s12665-015-4176-2
Saeed, M., and Jadhawar, P. (2024). Optimizing underground hydrogen storage in aquifers: the impact of cushion gas type. Int. J. Hydrogen Energy 52, 1537–1549. doi: 10.1016/j.ijhydene.2023.08.352
Šmigáň, P., Greksák, M., Kozánková, J., Buzek, F., Onderka, V., and Wolf, I. (1990). Methanogenic bacteria as a key factor involved in changes of town gas stored in an underground reservoir. FEMS Microbiol. Lett. 73, 221–224. doi: 10.1016/0378-1097(90)90733-7
Stams, A. J. M. (1994). Metabolic interactions between anaerobic bacteria in methanogenic environments. Antonie Van Leeuwenhoek 66, 271–294. doi: 10.1007/BF00871644
Stefánsson, A., Arnórsson, S., and Sveinbjörnsdóttir, Á. E. (2005). Redox reactions and potentials in natural waters at disequilibrium. Chem. Geol. 221, 289–311. doi: 10.1016/j.chemgeo.2005.06.003
Steinberg, L. M., and Regan, J. M. (2008). Phylogenetic comparison of the methanogenic communities from an acidic, oligotrophic fen and an anaerobic digester treating municipal wastewater sludge. Appl. Environ. Microbiol. 74, 6663–6671. doi: 10.1128/AEM.00553-08
Steinberg, L. M., and Regan, J. M. (2009). mcrA-targeted real-time quantitative PCR method to examine methanogen communities. Appl. Environ. Microbiol. 75, 4435–4442. doi: 10.1128/AEM.02858-08
Stewart, P. S. (2003). Diffusion in biofilms. J. Bacteriol. 185, 1485–1491. doi: 10.1128/JB.185.5.1485-1491.2003
Stolten, D., and Emonts, B. (2016). Hydrogen science and engineering, 2 volume set: Materials, processes, systems, and technology Weinheim, Germany: John Wiley & Sons.
Strobel, G., Hagemann, B., Lüddeke, C. T., and Ganzer, L. (2023). Coupled model for microbial growth and phase mass transfer in pressurized batch reactors in the context of underground hydrogen storage. Front. Microbiol. 14:1150102. doi: 10.3389/fmicb.2023.1150102
Thaysen, E., McMahon, S., Strobel, G. J., Butler, I., Heinemann, N., Ngwenya, B., et al. (2021). Estimating microbial growth and hydrogen consumption in hydrogen storage in porous media. Renew. Sustain. Energy Rev. 151:111481. doi: 10.1016/j.rser.2021.111481
Tremosa, J., Jakobsen, R., and Le Gallo, Y. (2023). Assessing and modeling hydrogen reactivity in underground hydrogen storage: a review and models simulating the Lobodice town gas storage. Front. Energy Res. 11:978. doi: 10.3389/fenrg.2023.1145978
Ulrich, G. A., Breit, G. N., Cozzarelli, I. M., and Suflita, J. M. (2003). Sources of sulfate supporting anaerobic metabolism in a contaminated aquifer. Environ. Sci. Technol. 37, 1093–1099. doi: 10.1021/es011288a
van Houten, R. T., Pol, L. W. H., and Lettinga, G. (1994). Biological sulphate reduction using gas-lift reactors fed with hydrogen and carbon dioxide as energy and carbon source. Biotechnol. Bioeng. 44, 586–594. doi: 10.1002/bit.260440505
Vasile, N. S., Bellini, R., Bassani, I., Vizzarro, A., Abdel Azim, A., Coti, C., et al. (2024). Innovative high pressure/high temperature, multi-sensing bioreactors system for microbial risk assessment in underground hydrogen storage. Int. J. Hydrogen Energy 51, 41–50. doi: 10.1016/j.ijhydene.2023.10.245
Veshareh, J., Thaysen, E. M., and Nick, H. M. (2022). Feasibility of hydrogen storage in depleted hydrocarbon chalk reservoirs: assessment of biochemical and chemical effects. Appl. Energy 323:119575. doi: 10.1016/j.apenergy.2022.119575
Visser, M., Stams, A. J. M., Frutschi, M., and Bernier-Latmani, R. (2016). Phylogenetic comparison of Desulfotomaculum species of subgroup 1a and description of Desulfotomaculum reducens sp. nov. Int. J. Syst. Evol. Microbiol. 66, 762–767. doi: 10.1099/ijsem.0.000786
Vítězová, M., Onderka, V., Urbanová, I., Molíková, A., Hanišáková, N., Buriánková, I., et al. (2023). In situ field experiment shows the potential of methanogenic archaea for biomethane production from underground gas storage in natural rock environment. Environ. Technol. Innov. 32:103253. doi: 10.1016/j.eti.2023.103253
Wagman, D. D. (1982). The NBS tables of chemical thermodynamic properties selected values for inorganic and C1 and C2 organic substances in SI units. J. Phys. Chem. Ref. Data Monogr. 11, 2–391.
Wagner, M., Roger, A. J., Flax, J. L., Brusseau, G. A., and Stahl, D. A. (1998). Phylogeny of dissimilatory sulfite reductases supports an early origin of sulfate respiration. J. Bacteriol. 180, 2975–2982. doi: 10.1128/JB.180.11.2975-2982.1998
Wang, Y., and Qian, P.-Y. (2009). Conservative fragments in bacterial 16S rRNA genes and primer design for 16S ribosomal DNA amplicons in metagenomic studies. PLoS One 4:e7401. doi: 10.1371/journal.pone.0007401
Wang, J., Wu, R., Wei, M., Bai, B., Xie, J., and Li, Y. (2023). A comprehensive review of site selection, experiment and numerical simulation for underground hydrogen storage. Gas Sci. Eng. 118:205105. doi: 10.1016/j.jgsce.2023.205105
Wei, T., and Simko, V. (2017). R Package “Corrplot”: Visualization of a Correlation Matrix (Version 0.84). Available at: https://github.com/taiyun/corrplot
Wickham, H. (2016). ggplot2: Elegant graphics for data analysis. 2nd Edn. Cham: Springer International Publishing: Imprint: Springer.
Wu, L., Hou, M. Z., Luo, Z., Huang, L., Xiong, Y., Mehmood, F., et al. (2023). Efficiency assessment of underground biomethanation with hydrogen and carbon dioxide in depleted gas reservoirs: a biogeochemical simulation. Energy 283:128539. doi: 10.1016/j.energy.2023.128539
Yang, S., Liebner, S., Alawi, M., Ebenhöh, O., and Wagner, D. (2014). Taxonomic database and cut-off value for processing mcrA gene 454 pyrosequencing data by MOTHUR. J. Microbiol. Methods 103, 3–5. doi: 10.1016/j.mimet.2014.05.006
Yilmaz, P., Parfrey, L. W., Yarza, P., Gerken, J., Pruesse, E., Quast, C., et al. (2014). The SILVA and “all-species living tree project (LTP)” taxonomic frameworks. Nucleic Acids Res. 42, D643–D648. doi: 10.1093/nar/gkt1209
Keywords: dihydrogen, UGS, deep aquifer, microbial community, gas storage, methanogens, sulfate reducers
Citation: Mura J, Ranchou-Peyruse M, Guignard M, Ducousso M, Larregieu M, Isaure M-P, Le Hécho I, Hoareau G, Poulain M, Buruti MdS, Chiquet P, Caumette G, Petit A, Cézac P and Ranchou-Peyruse A (2024) Experimental simulation of H2 coinjection via a high-pressure reactor with natural gas in a low-salinity deep aquifer used for current underground gas storage. Front. Microbiol. 15:1439866. doi: 10.3389/fmicb.2024.1439866
Edited by:
William J. Brazelton, The University of Utah, United StatesReviewed by:
Noura Eddaoui, UMR7327 Institut des sciences de la Terre d’Orléans (ISTO), FranceGion Strobel, Clausthal University of Technology, Germany
Copyright © 2024 Mura, Ranchou-Peyruse, Guignard, Ducousso, Larregieu, Isaure, Le Hécho, Hoareau, Poulain, Buruti, Chiquet, Caumette, Petit, Cézac and Ranchou-Peyruse. This is an open-access article distributed under the terms of the Creative Commons Attribution License (CC BY). The use, distribution or reproduction in other forums is permitted, provided the original author(s) and the copyright owner(s) are credited and that the original publication in this journal is cited, in accordance with accepted academic practice. No use, distribution or reproduction is permitted which does not comply with these terms.
*Correspondence: Anthony Ranchou-Peyruse, YW50aG9ueS5yYW5jaG91LXBleXJ1c2VAdW5pdi1wYXUuZnI=