 Chuyi Zhang
 Zhen Zhang
 Feng Zhang
 Bin Zeng
 Xin Liu
 Lei Wang
- Big Data Innovation and Entrepreneurship Education Center of Hunan Province, Changsha University, Changsha, China
Introduction: Accumulating evidence shows that human health and disease are closely related to the microbes in the human body.
Methods: In this manuscript, a new computational model based on graph attention networks and sparse autoencoders, called GCANCAE, was proposed for inferring possible microbe–disease associations. In GCANCAE, we first constructed a heterogeneous network by combining known microbe–disease relationships, disease similarity, and microbial similarity. Then, we adopted the improved GCN and the CSAE to extract neighbor relations in the adjacency matrix and novel feature representations in heterogeneous networks. After that, in order to estimate the likelihood of a potential microbe associated with a disease, we integrated these two types of representations to create unique eigenmatrices for diseases and microbes, respectively, and obtained predicted scores for potential microbe–disease associations by calculating the inner product of these two types of eigenmatrices.
Results and discussion: Based on the baseline databases such as the HMDAD and the Disbiome, intensive experiments were conducted to evaluate the prediction ability of GCANCAE, and the experimental results demonstrated that GCANCAE achieved better performance than state-of-the-art competitive methods under the frameworks of both 2-fold and 5-fold CV. Furthermore, case studies of three categories of common diseases, such as asthma, irritable bowel syndrome (IBS), and type 2 diabetes (T2D), confirmed the efficiency of GCANCAE.
1 Introduction
Microorganisms are very important to human health (Gill et al., 2006; Integrative HMP (iHMP) Research Network Consortium, 2014; Proctor et al., 2019). Human body is inhabited by a vast number of microorganisms which form a complex ecological community and influence the human physiology in the aspect of both health and diseases (Dekaboruah et al., 2020). The interplay between the commensal microbiota and the mammalian immune system development and function includes multifold interactions in homeostasis and disease (Zheng, 2020). Moreover, microbiome may contribute to immune dysfunction of human body and the emergence of human diseases (Shi et al., 2017), changes in the composition of microbiota may be linked to the pathogenesis of different neurological disorders (Kim et al., 2018), and almost all digestive tract diseases are related to the gut microbiota (Kim et al., 2019). In recent years, research studies show that microbiota is closely related to the development and progression of human gastrointestinal diseases (Ohkusa et al., 2002), cancers (Luu et al., 2017), neurodegenerative diseases (Sampson et al., 2016), and cardiovascular diseases (Toya et al., 2020). Certainly, microbes can help to improve human health. For instance, numerous clinical studies have reported that prebiotics, or probiotics, can reduce symptoms of autism, depression, and other neurological disorders of human body (Guarner and Malagelada, 2003). Moreover, a simple approach for creating new treatments for complicated illnesses of the central nervous system may be the modification of microbiota (Cryan and Dinan, 2012; El-Sayed et al., 2021). Furthermore, it has been demonstrated that the microbiome and its particular metabolites may contribute to the pathophysiology and/or development of a number of human diseases (Illiano et al., 2020).
In the past few years, due to the rapid development of high-throughput sequencing technologies and advanced histological methods, numerous databases of known microbe–disease association have been created by worldwide researchers for further exploring potential connections between microbes and diseases. For instance, Ma et al. established a microbe–disease association database called HMDAD by gathering 483 known associations between 39 diseases and 292 microorganisms from 61 academic papers in 2016 (Ma et al., 2017). In 2018, a new microbe–disease association database named Disbiome was built by Janssens et al. (2018) through compiling 10,922 known associations between 372 diseases and 1,622 microorganisms from experimental records of 1,191 published literature studies. Based on these two databases, in 2020, Yao et al. created another more complicated microbe–disease association database known as MicroPhenoDB, which contains 696,934 known associations between 27,277 branch-specific core genes and 685 microorganisms and 5,677 known associations between 1,781 microbes and 542 human disease phenotypes extracted from 22 newly collected human sections (Yao et al., 2020). In 2021, Wu et al. built a novel microbe–disease association database called MDIDB by selecting 44,900 known associations between 1,065 microorganisms and 1,198 diseases from 8,458 publications (Wu et al., 2021). In addition, G. skoufos et al. constructed a Peryton-based microbe–disease association database in 2021 by collecting 7,977 known associations between 43 diseases and 1,396 microorganisms from 314 academic articles (Skoufos et al., 2021).
Based on the above databases, various computational models have been proposed in recent years, to infer possible associations between microbes and diseases, which can be roughly divided into four categories depending on the technical tools they used, such as the network/graph-based methods, the matrix decomposition-based methods, the conventional machine learning methods, and the deep learning-based methods. Among them, the network/graph-based methods tend to analyze the likelihood of possible microbe–disease associations according to the topological and attribute features of nodes in a heterogeneous network, or a graph is constructed based on known associations between microbes and diseases. For instance, Chen et al. proposed a prediction model named KATZHMDA in 2017 (Chen et al., 2017), which translated the challenge of predicting potential microbe–disease associations into calculating the similarity between nodes based on the length and number of paths linking them in a heterogeneous network. Different from the above network/graph-based methods, the approaches are based on matrix decomposition concentrate on optimizing the product of two potential information matrices to approximate an association matrix with various constraints. For example, Shen et al. designed an identification model CMFHMDA based on collaboration matrix decomposition (Xu et al., 2022). Peng L. et al. proposed a prediction model LDA-VGHB based on singular value decomposition and variational graph autoencoder (Peng et al., 2024a). In addition, traditional machine learning-based approaches focus on training efficient classifiers to detect latent microbe–disease associations based on known associations between microbes and diseases. For instance, Wang et al. introduced a detection model called LRLSHMDA, in which topological information of known microbe–disease pairs was combined with the Laplace regularized least square to build two objective functions and trained an ideal classifier to infer possible disease-associated microbes (Wang et al., 2017). Finally, deep learning-based prediction models aim to discover possible relationships between diseases and microorganisms by developing different deep learning frameworks. For example, Long et al. designed a predictive model to detect latent associations between diseases and microbes by adopting a double-interaction aggregator to improve the representation and aggregation of similar neighborhoods (Long et al., 2021). Moreover, in 2020, Long et al. also proposed a calculative model based on graph attention networks (Veličković et al., 2017), to infer possible human microbe–drug associations (Long et al., 2020). In addition, L. Dayun et al. recommended a computational model MGATMDA to infer possible microbe–disease associations via a multi-component graph attention network (Dayun et al., 2021). In 2023, Peng L et al. proposed a network model based on tree augmentation algorithm and classifier to calculate mediation between ligand receptors (Peng et al., 2024c) and joint scoring based on integrated deep learning and single-cell transcriptomic data, to decrypt ligand receptor-mediated cell-to-cell communication (Peng et al., 2023). In addition, they also devised a bidirectional intentional network named BINDTI based on the attention mechanism, to recognize drug–target interactions in 2024. In the same year, they proposed another dual-net neural architecture and deep neural network to recognize lncRNA-disease association (Peng et al., 2024b). Jiang et al. presented an ensemble approach named SAEROF for large-scale drug–disease association prediction through incorporating the rotation forest and the deep neural network of sparse autoencoder (Jiang et al., 2020). L. Guanghui et al. developed a node-adaptive graph transformer with structural encoding, to predict the association between lncRNA and diseases (Li et al., 2024).
Most of the above methods take multiple features of nodes into account and input them into the same model for learning, ignoring the fact that different models are suitable for learning different types of features. In this study, we introduced two different features such as the attribute features and the topological features of diseases and microbes, respectively, and the difference between these two features is that topological features focus on the spatial relationship and connection in the newly constructed microbe–disease network, emphasizing the structural nature of disease and microbe nodes, whereas the attribute features focus on the attributes and feature vectors of diseases and microbes, describing the specific characteristics of diseases and microbes. To extract these two types of features for diseases and microbes, we designed an improved graph convolutional network (GCAN) and the multi-channel convolutional autoencoder (CSAE) separately. Among them, in GCAN, different from traditional GCNs, we designed an improved transfer matrix, which can aggregate the neighbor information between node pairs, spatialize the constructed heterogeneous network, and extract the relationship between nodes in the space more efficiently. Moreover, during the training process of GCAN, we extracted the features in the form of topological graphs so that we can better obtain the potential topological features in the heterogeneous network. The model CSAE extracts the attribute features of microorganisms mainly through the convolutional and linear layers, and the more important features of the drug itself are more focused on the data itself and can better extract the attribute features of both. In summary, considering that GCAN can propagate information from local neighbors to learn effective representations and has been widely and successfully used in the field of association prediction, we chose GCAN to learn the topological features, while CSAE is selected to learn the attribute features, since CSAE can extract relatively sparse and useful features by introducing a sparsity penalty term on the autoencoder. By using these two different models, we can combine the topological features of spatial associations with the attribute features in the actual data, to more comprehensively assess and predict the association between microbe–disease pairs.
In this article, we improve the transfer matrix for GCN (Kipf and Welling, 2016). The transfer matrix and weighted coefficient are generally used for feature learning in graph propagation neural networks. GCN (Kipf and Welling, 2016) and GAT (Veličković et al., 2017) can be regarded as a special case in graph diffusion-based models using the first-order power of transition matrix. Many graph neural network models such as TAGCN (Du et al., 2017), MixHop (Abu-El-Haija et al., 2019), and DAGNN (Liu et al., 2020) use symmetrically normalized adjacency matrix in GCN as transition matrix. DAGN (Wang et al., 2020) uses attention matrix as transition matrix. PAN (Ma et al., 2019) uses the transition matrix of maximal entropy random walks. Two popular weighting coefficients are personalized PageRank (PPR) (Page et al., 1999; Klicpera et al., 2018) and the heat kernel (Kondor and Lafferty, 2002; Xu et al., 2020), following the previous that more distant neighboring nodes have less influences. PPNP (Klicpera et al., 2018) acts as a post-processing method to propagate output probability generated by an arbitrary model in the graph with PPR. GDC (Klicpera et al., 2019) works as a preprocessing method to recover meaningful neighborhoods from noisy graphs. GraphHeat (Xu et al., 2020) uses the heat kernels as weighting coefficients. Attention walk (Abu-El-Haija et al., 2018) jointly optimizes the node embeddings and weighting coefficients θk. However, the numeric form of weighting coefficients is invariant for each node, which is not flexible. Additionally, some of them are just pre-processing or post-processing methods, which somehow limits their usages. In this study, we used the combination of attention matrix and normalized adjacency matrix as the transition matrix of GCAN. In addition, the GCN layer consists of two parts such as the neighborhood aggregation module and the linear transformation module, which acts as a first-order spectral low-pass type filter because of the addition of self-loops to the re-normalization trick that precedes the symmetric normalization of the transfer matrix. The aggregation operation can be viewed as a matrix multiplication between the weighted adjacency matrix and the node identity matrix. The weighted adjacency matrix is the symmetric normalized adjacency matrix in the GCN. In GAT, the weighted adjacency matrix is the attention matrix with attention scores as entries, which are calculated with representation vectors of directly connected nodes. The improved transfer matrix combines the features of the transfer matrices of the above two models and better combines the attention between the nodes and the neighbor node correlation for feature propagation, and its advantages include GCN that uses the normalized adjacency matrix as a transfer matrix, our weighting matrix is learnable and more flexible, and the predicted results were better at the same time.
Therefore, we use GCAN and CSAE to design a new prediction model GCANCAE. In GCANCAE, a heterogeneous network is constructed by combining the Gaussian interaction profile (GIP) similarity of microorganisms and diseases with the Hamming interaction profile (HIP) similarity of microorganisms and diseases. Then, we introduce GCAN and CSAE to learn the unique topological and attribute representations of microbial and disease nodes in a heterogeneous network, respectively. Later, node heterogeneous networks with different feature matrices obtain the final prediction scores for potential microbial disease associations by integrating these two representations with various microbial and disease features, such as disease functional similarity and microbial functional similarity. Finally, intensive comparative experiments and case studies were conducted to validate the predictive performance of GCANCAE based on HMDAD and Disbiome separately. As a result, the prediction performance of GCANCAE was demonstrated to be better than that of eight state-of-the-art competing methods, which suggested that GCANCAE can not only achieve satisfactory predictive performance but also serve as a useful tool for latent microbe–disease association prediction in the future.
2 Materials and methods
2.1 Materials
Considering that these two databases such as the HMDAD and the Disbiome have been widely used in the field of microbe–disease association prediction, most of the existing state-of-the-art methods in the field of microbe–disease association prediction adopted these two databases as the basis for their experiments, which may facilitate the comparison between the GCANCAE and these competitive methods. Hence, in this section, we first downloaded known microbe–disease associations from the HMDAD.1 After removing duplicated records, we obtained 450 non-redundant experimentally verified microbe–disease associations between 292 microbes and 39 diseases. In addition, 4,351 non-redundant known microbe–disease associations between 1,052 microbes and 218 diseases were further downloaded from the Disbiome.2 As a result, the detailed information of these two newly downloaded datasets is presented in the following Table 1.
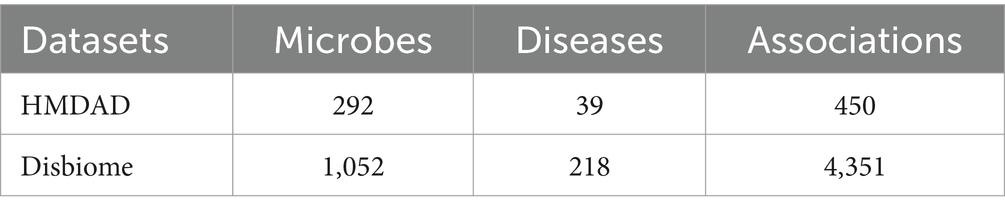
Table 1. The statistics of datasets downloaded from HMDAD and Disbiome.
For simplicity, for any given newly downloaded dataset Ω, let and denote the numbers of different diseases and microbes in Ω, respectively, and it is obvious that we can construct a dimensional microbe–disease association adjacency matrix A as follows: if the i-th disease has a known association with the j-th microbe, then there is , otherwise, there is .
2.2 Methods
As shown in Figure 1, GCANCAE mainly consists of the following five steps:
Step1: Constructing a heterogeneous network HN based on multiple similarity metrics of microorganisms and diseases.
Step2: Introducing an improved GCN model to extract topological feature representations for microbial and disease nodes in HN.
Step3: Adopting the CSAE model to capture attribute feature representations for microbial and disease nodes in HN separately.
Step4: After combining the above two types of feature representations with multiple original features of microbes and diseases, we will construct two integrated feature matrices for diseases and microorganisms, respectively.
Step5: Predicted scores for potential microbe–disease associations will be obtained based on the above two feature representations of microbes and diseases.
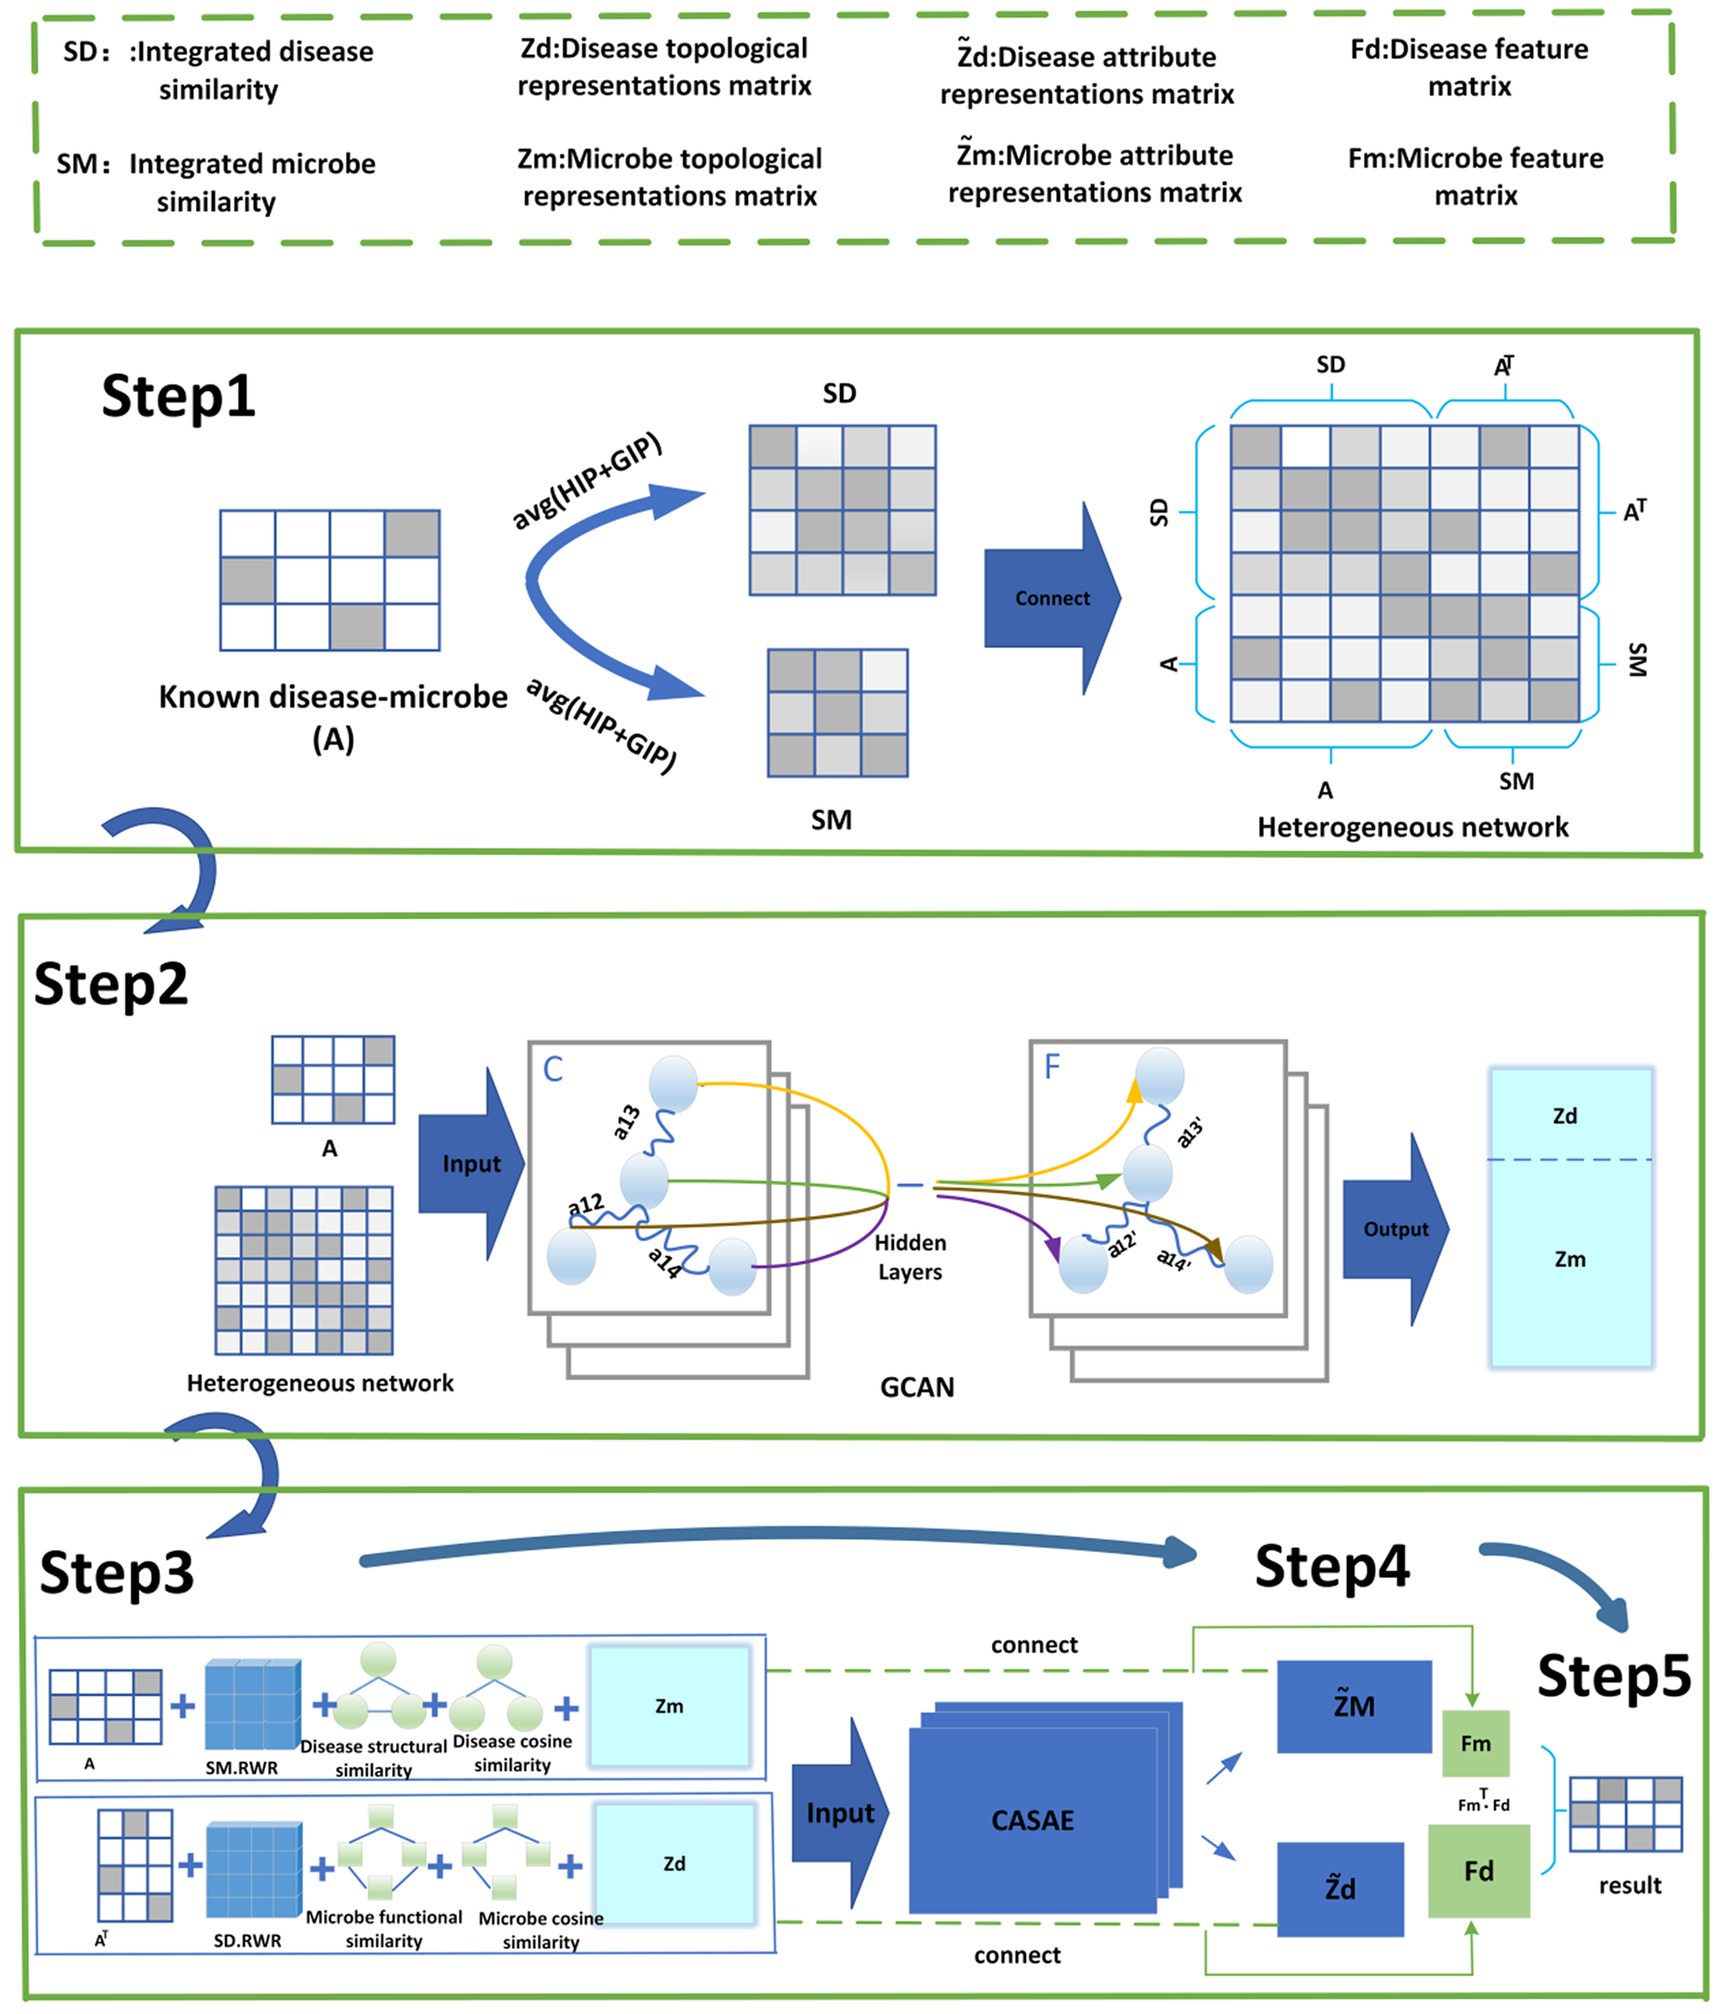
Figure 1. Flowchart of GCANCAE.
2.2.1 Construction of the heterogeneous network HN
In this section, we will construct a heterogeneous network HN by combining the adjacency matrix A with multiple similarity measures of microbes and diseases, including the Hamming similarity and the Gaussian Interaction Profile (GIP) kernel similarity as follows:
First, let and represent the i-th column and the j-th column of separately, and then for any two given microbes and , we will estimate the GIP kernel similarity between these two microbes by the following Equations (1, 2):
Here, || · || is the Frobenius norm.
In addition, inspired by the study proposed by Xu et al. (2021), for any two given microbes and , the Hamming similarity between them can be calculated according to the Equation (3):
Next, in a similar way, let and denote the i-th row and the j-th row of , respectively, and then for any two given diseases and , we can obtain the GIP kernel similarity between them by the following equations (4, 5):
Furthermore, it was obvious that we can also obtain the Hamming similarity between and according to the Equation (6):
Thus, it is easy to observe that we can synthesize an integrated microbe similarity matrix and an integrated disease similarity matrix through combining the GIP kernel similarity matrix and the HIP similarity matrix of microbe or diseases separately according to the following Equations (7, 8):
Finally, based on the above newly obtained matrices and , it is obvious that we can construct a heterogeneous network based on the Equation (9):
2.2.2 Extraction of topological feature representations for nodes in HN via GCN
In this section, inspired by the idea proposed by Sun and Wu (2020), in order to better extract the topological feature representations for nodes in the heterogeneous network , as shown in Figure 2, we will first design an improved transition matrix of GCN according to the Equation (10):
where IN is a dimensional identity matrix, and the matrices , , and D are defined by the following Equations (11-13) respectively:
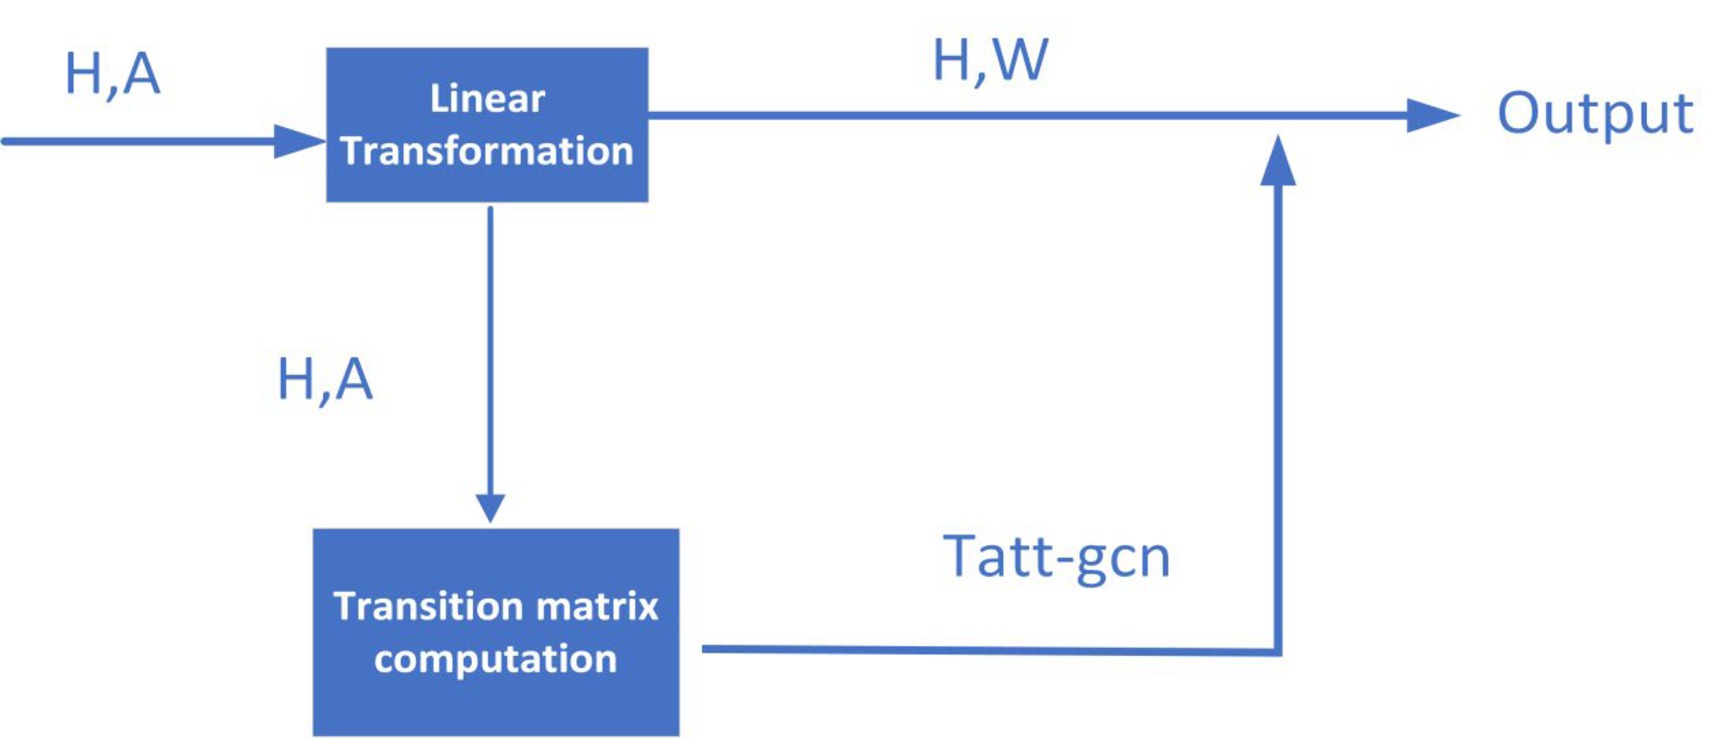
Figure 2. Flowchart of the improved GCN.
In the above equations, is a dimensional zero matrix, IN + D means the degree matrix after adding the self-loop, is the set of adjacent nodes of the i-th node in HN, “.” denotes the inner product, “||” indicates the connection operation, Hi means the representation vector of the i-th node in HN, and a is the attention vector.
Next, we will adopt the transition matrix Tatt-gcn, to participate in the layer-by-layer propagation of GCN according to the Equation (14):
where σ is the activation function, l denotes the number of layers in GCN, indicates the trainable weights of the l-th layer in GCN, and represents the input of the l-th layer in GCN. In this study, we will take the heterogeneous network HN as the original input .
Obviously, based on the above newly constructed GCN, we can easily obtain a new output matrix , where and represent the disease and microbial features newly extracted by GCN, respectively.
Moreover, based on the above newly-obtained matrix Z, we will further design a decoder based on the Equation (15):
After that, we will adopt the MSE loss function to calculate the mean of the sum of squares of the differences between ZZ and the HN based on the Equation (16):
where and denote the i-th row of and , respectively.
Finally, we will select the Adam optimizer (Kingma and Adam, 2014) to optimize the predicted results and apply the final trained and to future prediction tasks.
2.2.3 Extraction of attribute representations for nodes in HN via CSAE
In this section, we will further adopt the Random Walk with Restart (RWR) (Köhler et al., 2008), cosine similarity, and functional similarity, to obtain the local and global intrinsic attribute features of nodes in HN efficiently.
First, we will apply RWR on SM and SD to discover the correlation and importance between nodes in HN according to the Equation (17):
where is the restart probability and will be set to 0.1 according to traditional experimental result (Tan et al., 2022) and is a vector in which the i-th element holds the probability of being at the node i during the t-th time slot. M denotes the transfer probability matrix and is the initial probability vector of node i, which is defined by the Equation (18):
Obviously, based on the above equations, after applying RWR on SM and SD separately, we can obtain a novel dimensional matrix and a new dimensional matrix successively.
Next, for any two given disease nodes and in HN, we will calculate the cosine similarity between them according to the Equation (19):
Moreover, in the similar way, for any two given microbe nodes and in HN, we will calculate the cosine similarity between them by the Equation (20):
Obviously, based on the above equations, we can obtain two matrices and simultaneously.
Furthermore, based on the method proposed by Kamneva OK (Kamneva, 2017), as shown in Figure 3, for any two given microbes and , we will calculate the functional similarity between them as well, and as a result, we can obtain a novel dimensional microbe functional similarity matrix based on these different newly downloaded microbes in Ω.
After that, based on the assumption that functionally similar diseases tend to be in contact with functionally similar genes (Xu and Li, 2006), in this method, Human PPI datasets were downloaded from the Online Predicted Human Interaction Database (OPHID) (Brown and Jurisica, 2005) that is used to establish the PPI network. The resulting features are input into the KNN classifier to obtain the disease functional similarity. We found the functional similarity between the corresponding diseases to establish the disease similarity matrix. After that, we can obtain a new dimensional disease functional similarity matrix based on these different newly downloaded diseases in Ω.
Obviously, based on the above newly obtained matrices , , and , we can finally construct a new disease attribute matrix based on the Equation (21):
In a similar way, based on the above newly obtained matrices , , and , we can also construct a new microbe attribute matrix based on the Equation (22):
Based on the above two matrices and , in order to extract more important attribute representations for disease and microbial nodes in HN, as shown in Figure 4, we will input and to the CSAE separately according to the following steps:
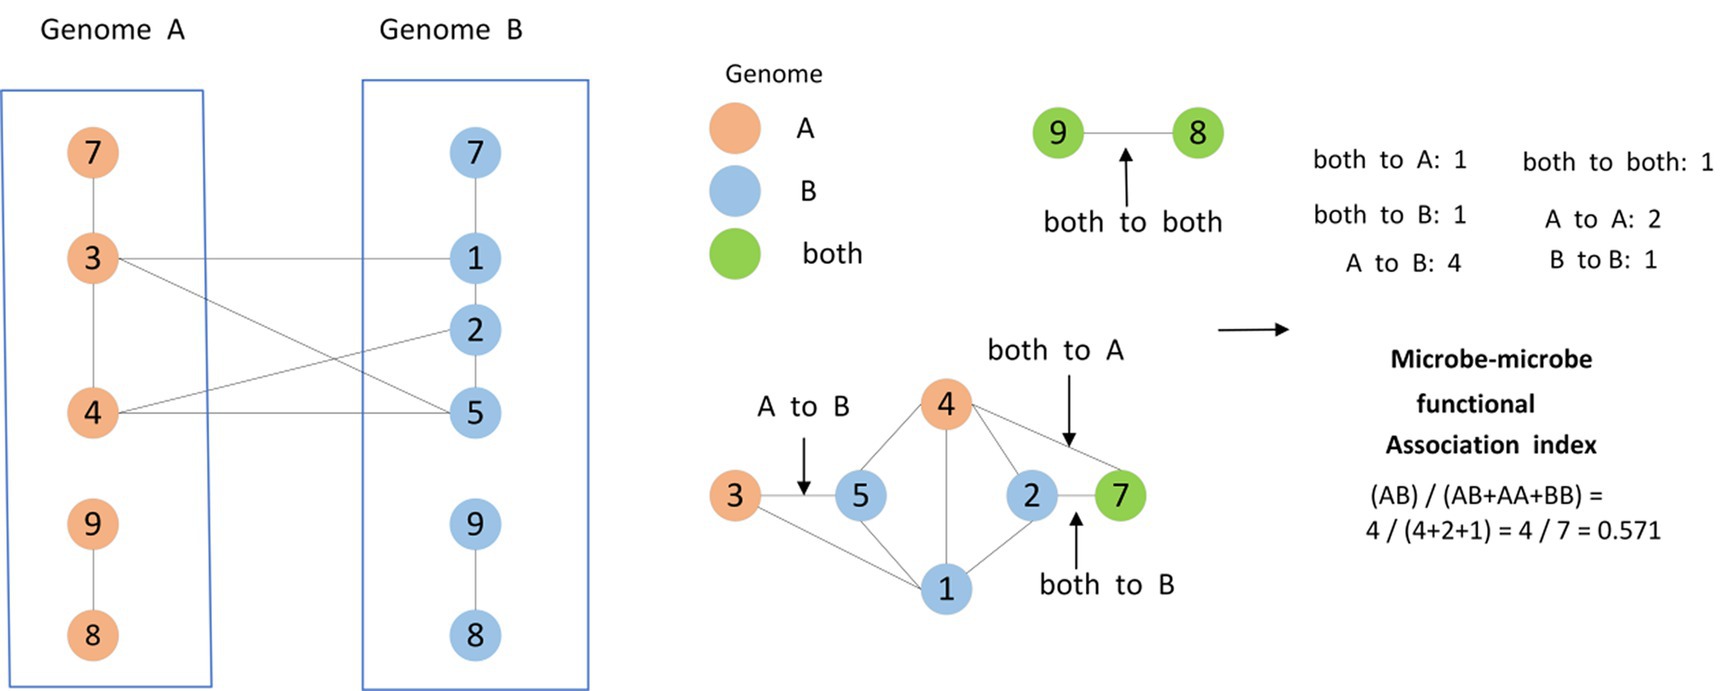
Figure 3. Two microbial species A and B were defined, containing five and six gene families, respectively, while two gene families occur only in A (3, 4), three gene families occur only in B (1, 2, 5), and three gene families occur in both species A and species B (7, 8, 9). These three types of gene families mark the nodes of the protein functional association network. Moreover, the edges connecting the gene families were categorized into six classes, namely, both to A, both to A and B, both to B, A to A, B to B, A to B. As shown in the figure, the similarity of different edges was calculated by counting the number of different edges.
Step 1 (Convolutional Encoder): First, in order to realize the convolutional coding, we will input and to the CSAE, respectively, based on the Equation (23):
where { } represents the input of the CSAE, “ "indicates a convolutional operation, and denotes the convolution kernel used for each channel. In this study, we will set the convolution kernel size to 3 * 3. In addition, represents the offset, means the activation function. Hence, it is easy to know that there is , where and denote the lengths of the rows and columns in the input matrix , respectively, and l represents the number of convolution kernels in the CSAE.
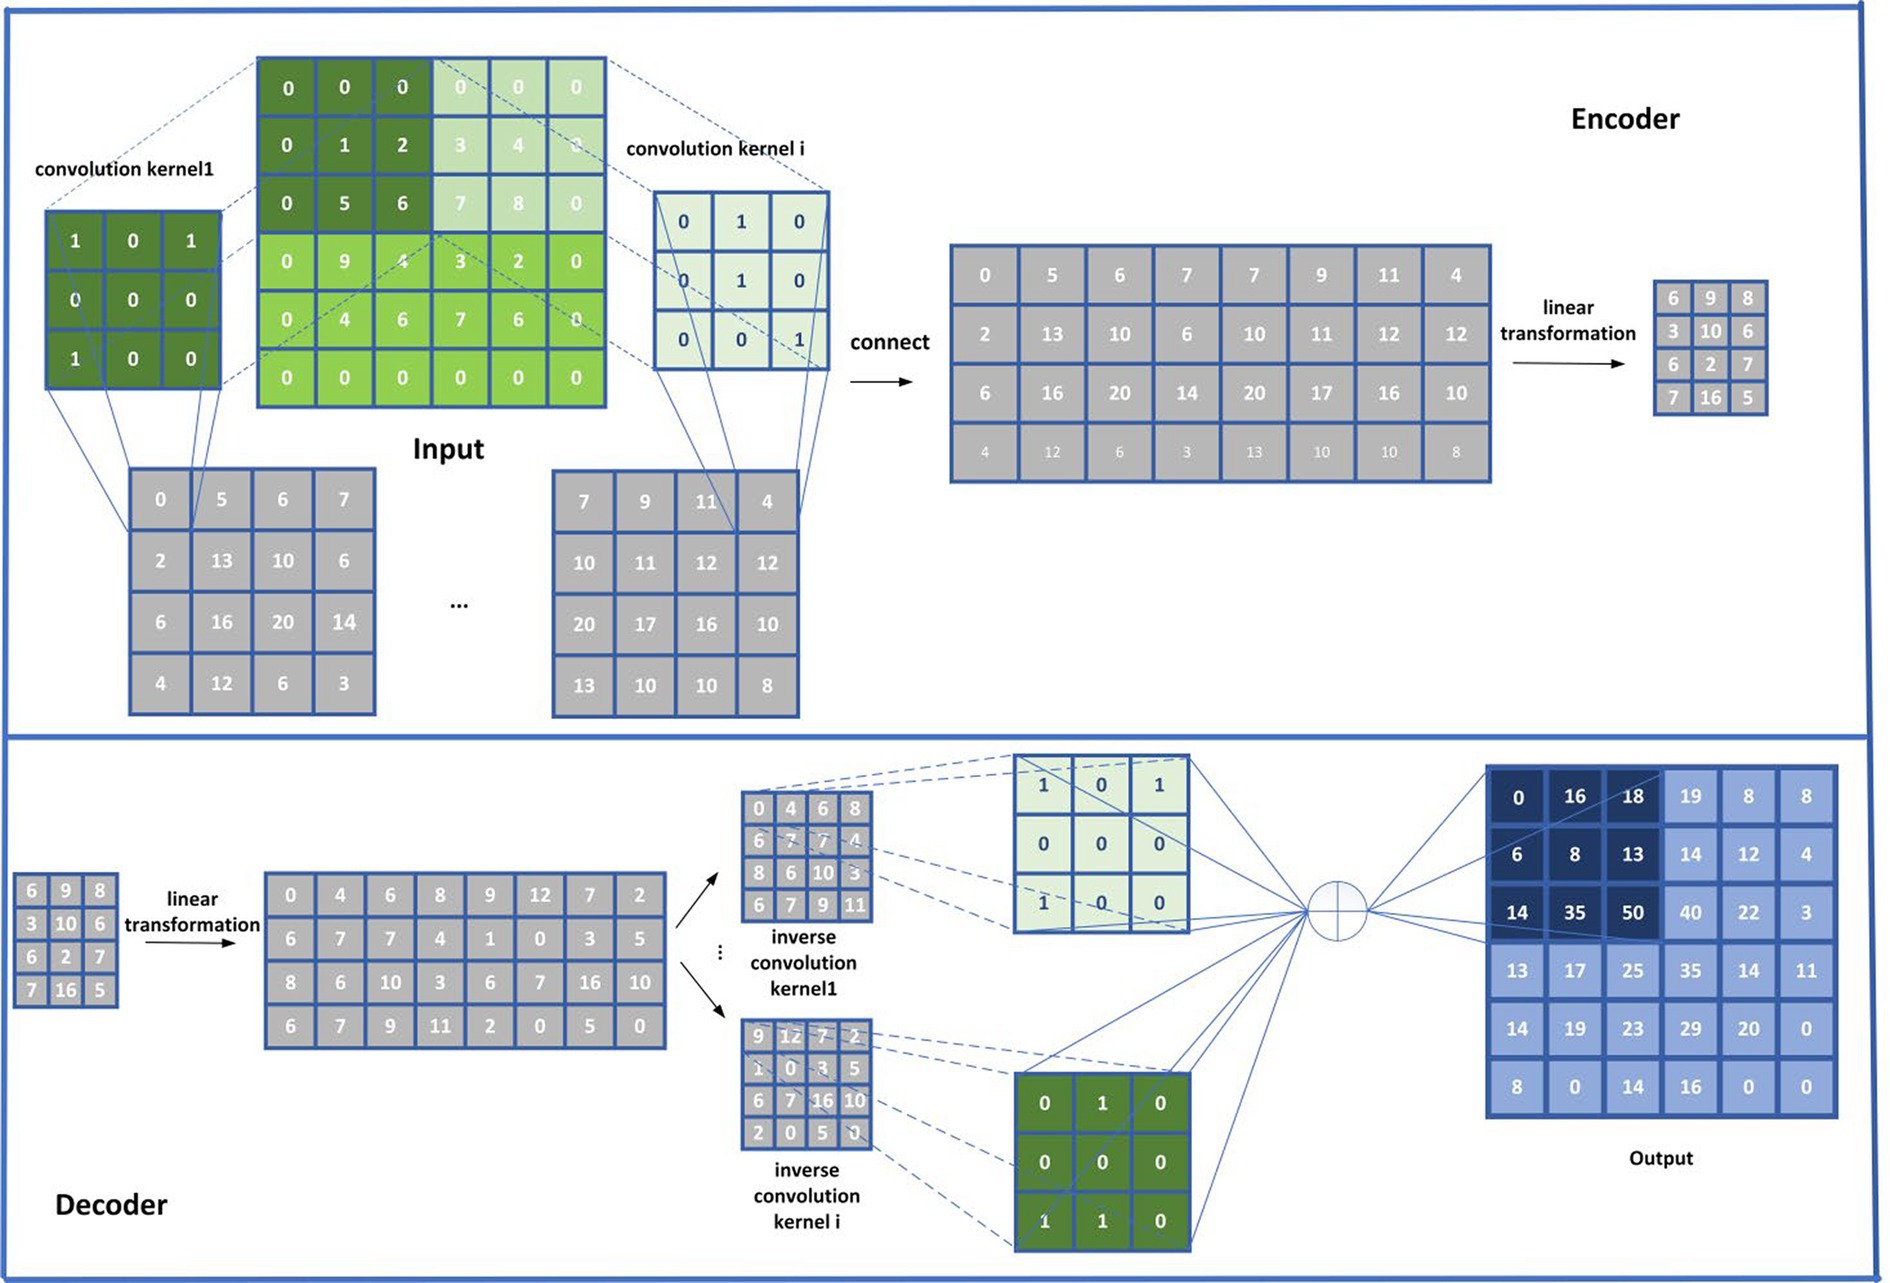
Figure 4. Flowchart of the CSAE.
Step 2 (Linear Encoder): In this step, the will be performed the linear sparse coding on after dimensionality reduction splicing of the based on the Equations (24, 25):
Where is the function used to flatten the matrix to a two-dimensional vector . Besides, is the activation function, represents the encoding weight, denotes the bias term, and means the intermediate hidden layer.
Step 3 (Linear Decoder): In this step, will be decoded linearly based on the Equation (26):
where indicates that the weight at decoding is the decoding bias term.
Step 4 (Convolutional Decoder): In this step, based on the newly obtained , we will construct a multi-channel feature matrix first, and then, we input it to the deconvolution layer for multi-channel convolution decoding based on the Equations (27, 28):
where denotes the i-th channel of the matrix obtained by transversal partitioning, “ ” Indicates the splice operation, “◉” represents the deconvolution operation, and represents the convolution kernel in the deconvolution layer. In this study, we will set the convolution kernel size to 3 * 3. In addition, represents the offset, indicates the activation function, and l represents the number of convolution kernels in the CSAE.
Obviously, based on the above Eq. 27, we can first obtain a 3D tensor by partitioning the original 2D matrix to l channels according to the transversal dimension of the , and then, based on the above Eq. 28, the decoded feature representation F of nodes in HN can be obtained.
Step 5: In this step, in order to ensure the sparsity of the hidden layer, we will further add the following penalty items defined in the Equation (29) to the CSAE as well:
where represents the number of hidden layer neurons in the CSAE, stands for the average activity of a hidden neuron , and denotes the relative entropy between two Bernoulli random variables with means of and respectively, which is defined by the Equation (30):
Based on the above steps, it is obvious that we can obtain two output matrices and after inputting and to the CSAE separately.
Step 6: Finally, similar to the implementation of GCAN, we will also utilize the Adam optimizer and MSE loss function for the optimization of the CSAE. Using the disease attribute representation as an example, the sparse penalty terms will be introduced into the loss function throughout the optimization phase according to the Equation (31):
Here, β is the weight of the sparse penalty and will be set to 0.1 in this manuscript. and denote the k-th row of and , respectively.
According to the above steps, it is easy to observe that a low-dimensional drug attribute representation matrix and a low-dimensional microbe attribute representation matrix can be obtained simultaneously by adopting the CSAE after it has been well trained.
2.2.4 Construction of the eigenmatrix of disease and microbe
Inspired by the method proposed by Xuan et al. (2021), in this study, we first spliced the functional similarity and the cosine similarity to maintain the original attributes of the nodes. Then, we combined the random wandering with the topological and attribute features extracted by GCAN and CSAE, to obtain the neighbor information of nodes and the learned new features. Thus, the integrated feature matrix would be more conducive to the prediction of potential microbe–disease associations. Finally, based on the above newly obtained disease-related matrices , , , , and the adjacency matrix A, we can construct a new disease eigenmatrix based on the Equation (32):
In a similar way, by combining the above newly obtained microbe-related matrices , , , , and the transposed adjacency matrix , we can create a novel microbe eigenmatrix according to the Equation (33):
2.2.5 Calculation of the predicted scores
Based on the above two newly constructed eigenmatrices and , for any given disease and microbe , it was obvious that we could estimate the possibility of potential association between them by adopting the following inner product according to the Equation (34):
Here, denotes the i-th row of , while denotes the j-th row of .
3 Results
3.1 Comparison with advanced methods
In this section, in order to evaluate the prediction performance of GCANCAE, we would compare it with eight different types of cutting-edge microbe–disease association prediction methods, such as KATZHMDA (Chen et al., 2017), which used KATZ to speculate on potential microbe–disease correlations, LRLSHMDA (Wang et al., 2017), which used the Laplacian-based regularized least-squares framework to estimate the possible associations between microbes and diseases, NTSHMDA (Luo and Long, 2020), which adopted the random walk with restart to forecast potential microbe–disease connections, BiRWMP (Wang et al., 2019), which introduced double random walk to forecast microbiological infections, NBLPIHMDA (Fan et al., 2020), which utilized a two-way marker transmission approach to detect probable microbe–disease correlations, HMDA-pred (Li et al., 2021), which adopted the network consensus projection and multi-data integration to identify microbe-related diseases, BPNNHMDA (Cai et al., 2021), which was developed based on backpropagation neural networks to deduce possible correlations between microbes and diseases, and GATMDA (Long et al., 2021), which used a graph attention network with a full inductive matrix to detect associations between microbe and disease pairs.
During experiments, for a fair comparison, we would test all these competing algorithms based on their original optimal parameters. In addition, intensive comparison experiments would be implemented based on two different databases of HMDAD and Disbiome under the k-fold cross-validation (CV) framework developed by Cai et al. (2021). In this case, we randomly selected 20% of known associations and 20% of unknown associations as the test set, while we selected the remaining 80% of known and unknown associations as the training set. Then, we implemented the 5-fold CV 10 times to obtain the final prediction results. Based on HMDAD and Disbiome, the final comparison results were shown in the following Tables 2, 3 separately.
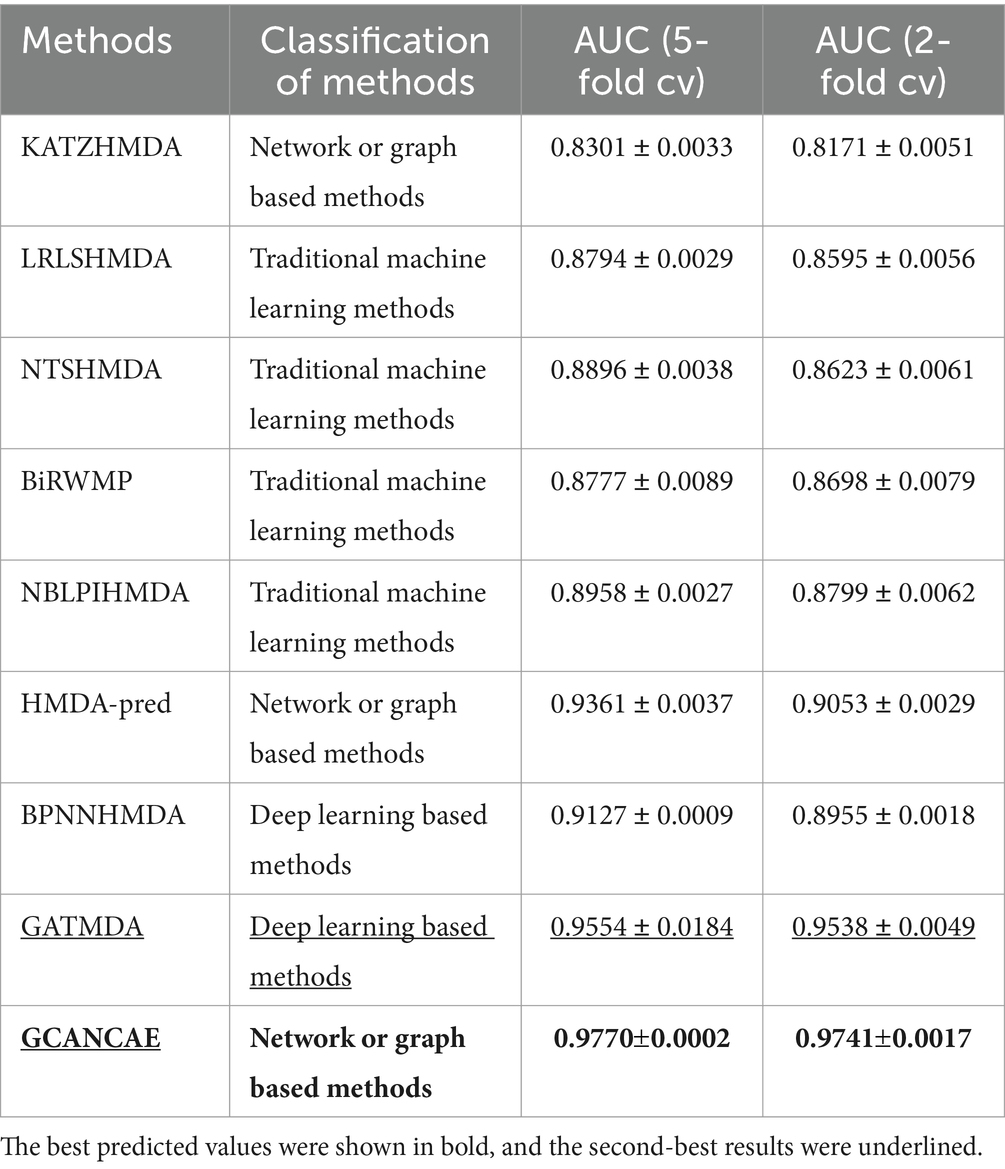
Table 2. Comparison results of performance between GCANCAE and eight competitive approaches based on the HMDAD database in the 5-fold CV and the 2-fold CV.
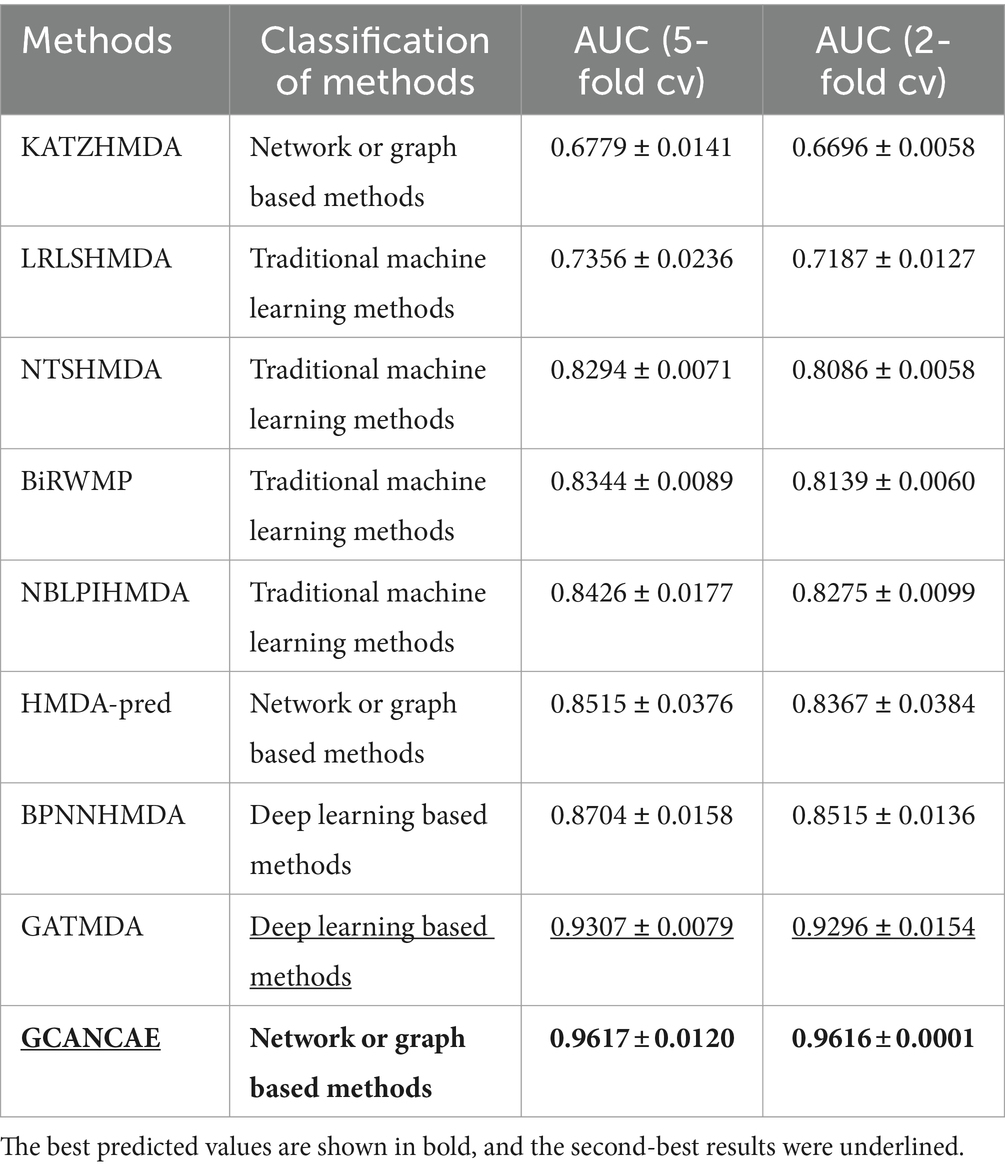
Table 3. Comparison results of performance between GCANCAE and eight competitive approaches based on the Disbiome database in the 5-fold CV and the 2-fold CV.
After observing the Table 2, it is easy to observe that GCANCAE can achieve the best predictive performance with an average AUC of 0.9770 0.0002 in the 5-fold CV and 0.9741 0.0017 in the 2-fold CV, respectively, which are superior to that achieved by all these eight competing approaches.
After observing the Table 3, it is obvious that GCANCAE can obtain the best predictive performance with an average AUC of 0.9617 ± 0.0120 in the 5-fold CV and 0.9616 ± 0.0001 in the 2-fold CV separately, which further demonstrates that GCANCAE outperforms all those state-of-the-art prediction models.
3.2 Sensitivity analysis of hyperparameters
In GCANCAE, we introduced some hyperparameters, such as the learning rates lr1 and lr2, the dimensionality k1 of the node topological representation, the dimension k2 of the node attribute representation, the number of channels l, and the number of layers GCAN_l of GCAN. In this section, we would determine suitable values for these hyperparameters based on the 5-fold CV and the HMDAD database.
For the hyperparameters k1 and k2, we compared the experimental results while k1 and k2 varied from 32, 64, 128 to 256, respectively, and found that GCANCAE could obtain the best performance when k1 was set to 128 and k2 was set to 32. In addition, for the learning rates lr1 and lr2, we compared the experimental results, while lr1 and lr2 varied in the range of 0.001, 0.05, 0.01, and 0.1, respectively. For the channel number l, we compared the experimental results, while l varied between 3, 6, and 9. On the layers of GCAN, we calculated the values of the model when GCAN_l is 1, 2, and 3. It was finally found that GCANCAE could achieve the best AUC values when lr1 was set to 0.01, lr2 was set to 0.1, channel number l was set to 6, and GCAN_l was set to 1.
We further analyzed the effectiveness of components on the prediction performance of GCANCAE and showed the AUCs achieved by GCANCAE without one of these following components such as GCAN, CSAE, or cosine similarity, as shown in Table 4. From observing Table 4, we found that GCANCAE can achieve better prediction performance when adopting both GCAN and CSAE than adopting GCAN or CSAE alone. Moreover, it can improve the prediction performance of GCANCAE by integrating GCAN and CSAE with the cosine similarity as well (Figures 5–10).
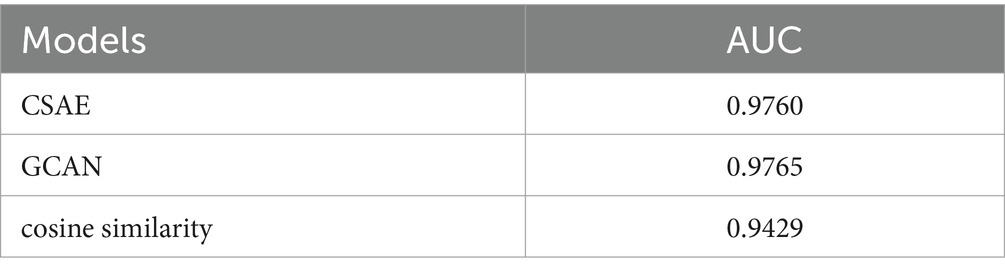
Table 4. Ablation study.
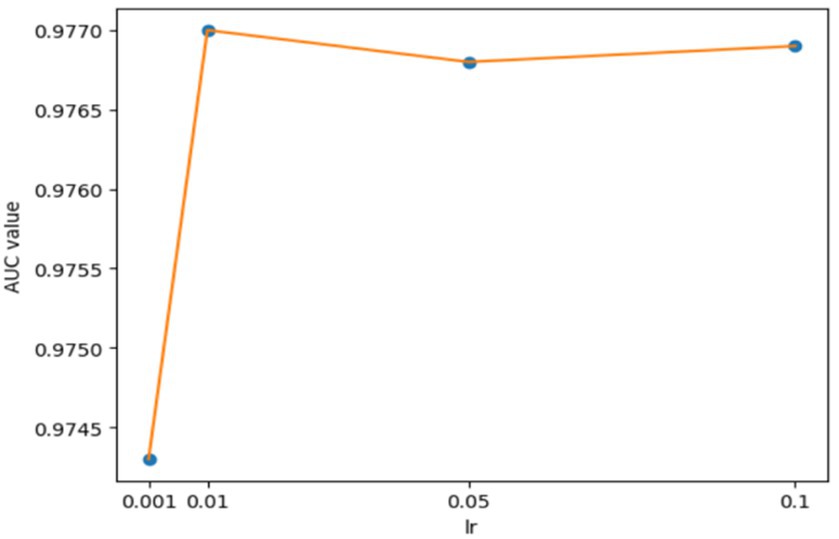
Figure 5. AUCs achieved by GCANCAE with different learning rates lr1 (GCAN).
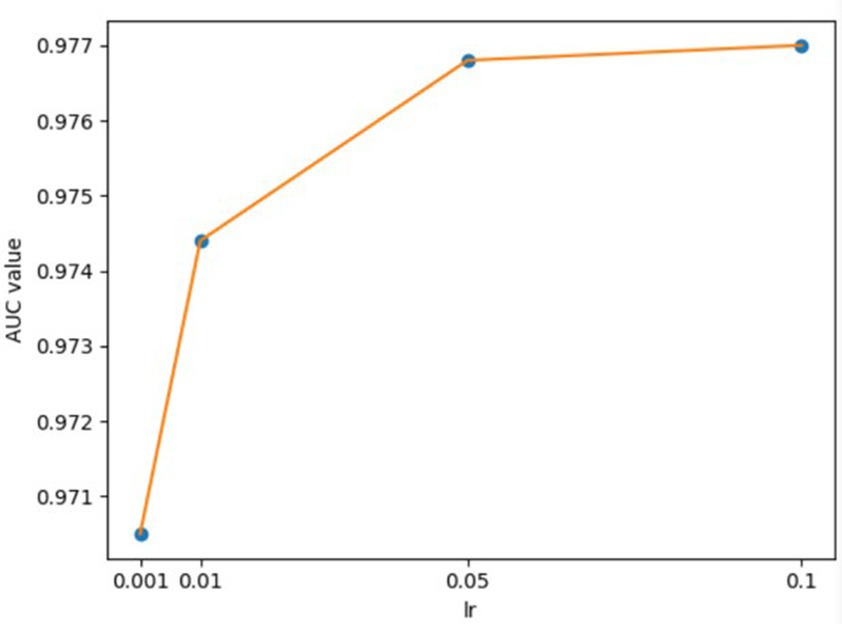
Figure 6. AUCs achieved by GCANCAE with different learning rates lr2 (CSAE).
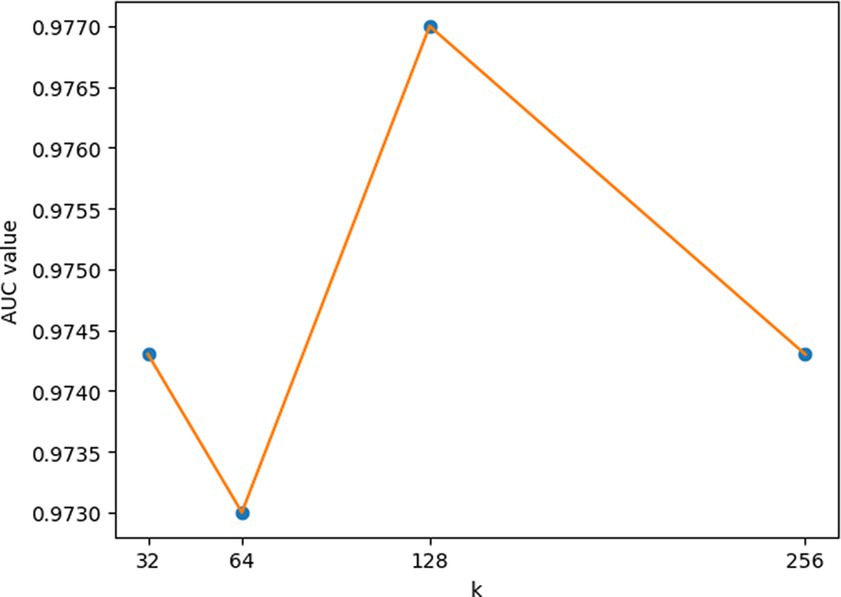
Figure 7. AUCs achieved by GCANCAE with different dimensions of node attribute representation (k2).
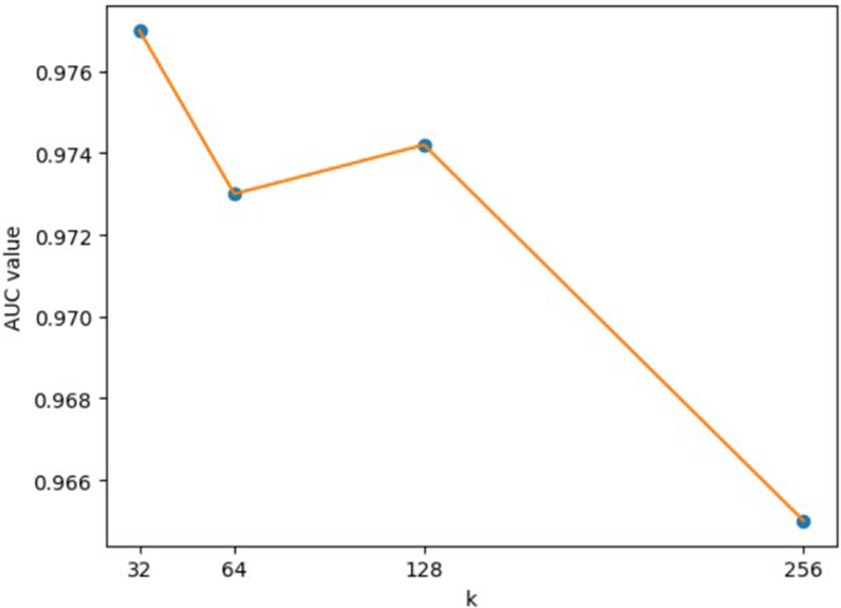
Figure 8. AUCs achieved by GCANCAE with different dimensions of node topological of node topological representation (k1).
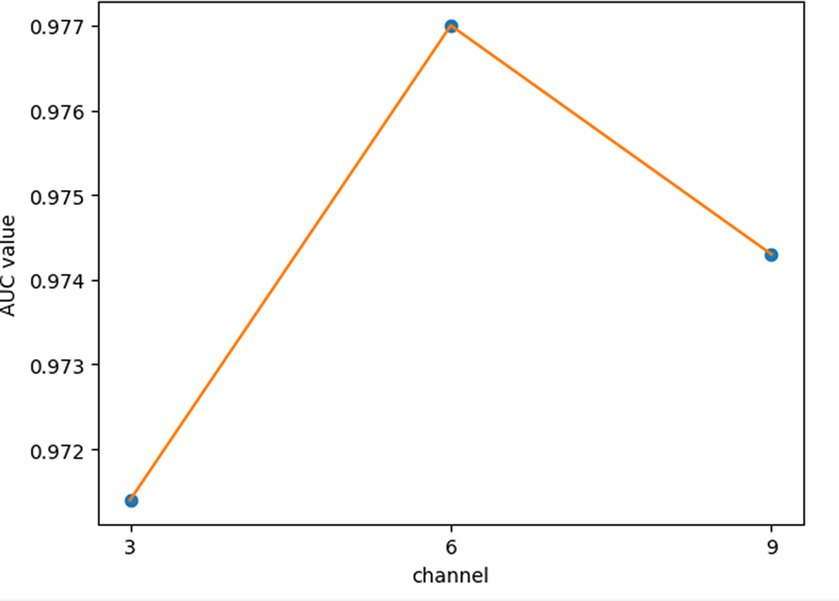
Figure 9. AUCs achieved by GCANCAE with different channels of node attribute representation.
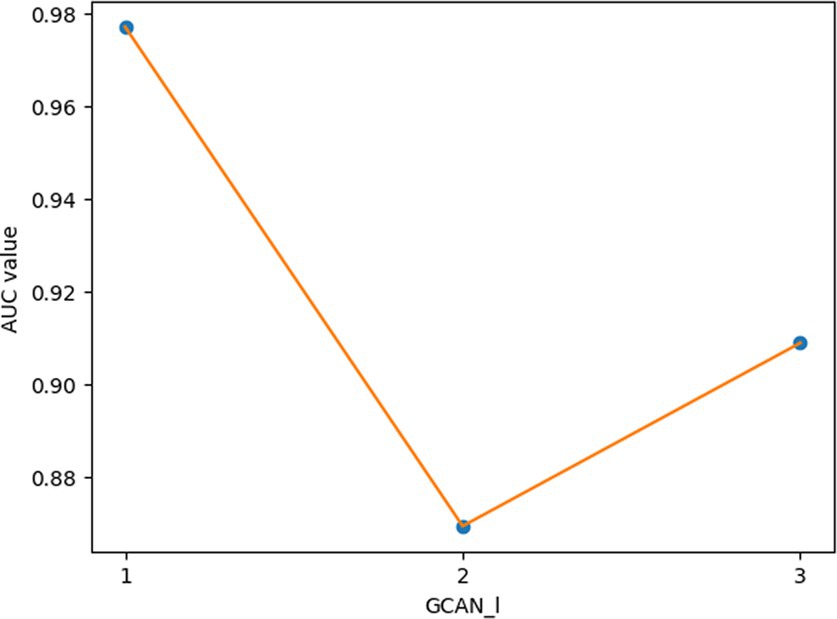
Figure 10. AUCs achieved by GCANCAE with different layers of GCAN.
3.3 Case study
In this section, to further evaluate the prediction performance of GCANCAE, we studied the connections between human microorganisms and three types of well-known human respiratory and digestive diseases, such as asthma, obesity, and type 2 diabetes (T2D) based on the HMDAD database and used the publicly available literature to confirm the top 20 predicted microorganisms.
Among these three categories of common diseases, asthma is a heterogeneous disease, accompanied by recurrent wheezing, chest tightness, dyspnea, cough, and other symptoms (Al-Moamary et al., 2021) and has been shown to be closely related to microorganisms (Çalışkan et al., 2013). For example, hemophilia in the lungs of asthmatic patients has been demonstrated to be closely related to the increased risk of neonatal oropharyngeal asthma, and staphylococcus has been found in the respiratory tract of asthmatic children (Sullivan et al., 2016). Table 5 showed the top 20 candidate asthma-associated microbes predicted by GCANCAE, from which it is easy to observe that among these top 20 predicted asthma-related microbes, there are 19 microbes confirmed by previous publications.

Table 5. 19 out of the top 20 candidate asthma-associated microbes predicted by GCANCAE have been confirmed by previous publications.
Then, according to statistics, there are currently more than 1.9 billion people obese or overweight in the world. The total prevalence of childhood obesity is 5.0%, and the adult prevalence rate is as high as 12.0% (GBD 2015 Obesity Collaborators, 2017; Saltiel and Olefsky, 2017). Obesity is more likely to cause health complications such as insulin resistance, type 2 diabetes, cardiovascular disease, liver disease, cancer, and neurodegeneration (Saltiel and Olefsky, 2017). Table 6 showed the top 20 candidate obesity-related microbes predicted by GCANCAE, from which, it is easy to observe that among these top 20 predicted obesity-related microbes, there are 19 microbes confirmed by previous publications.
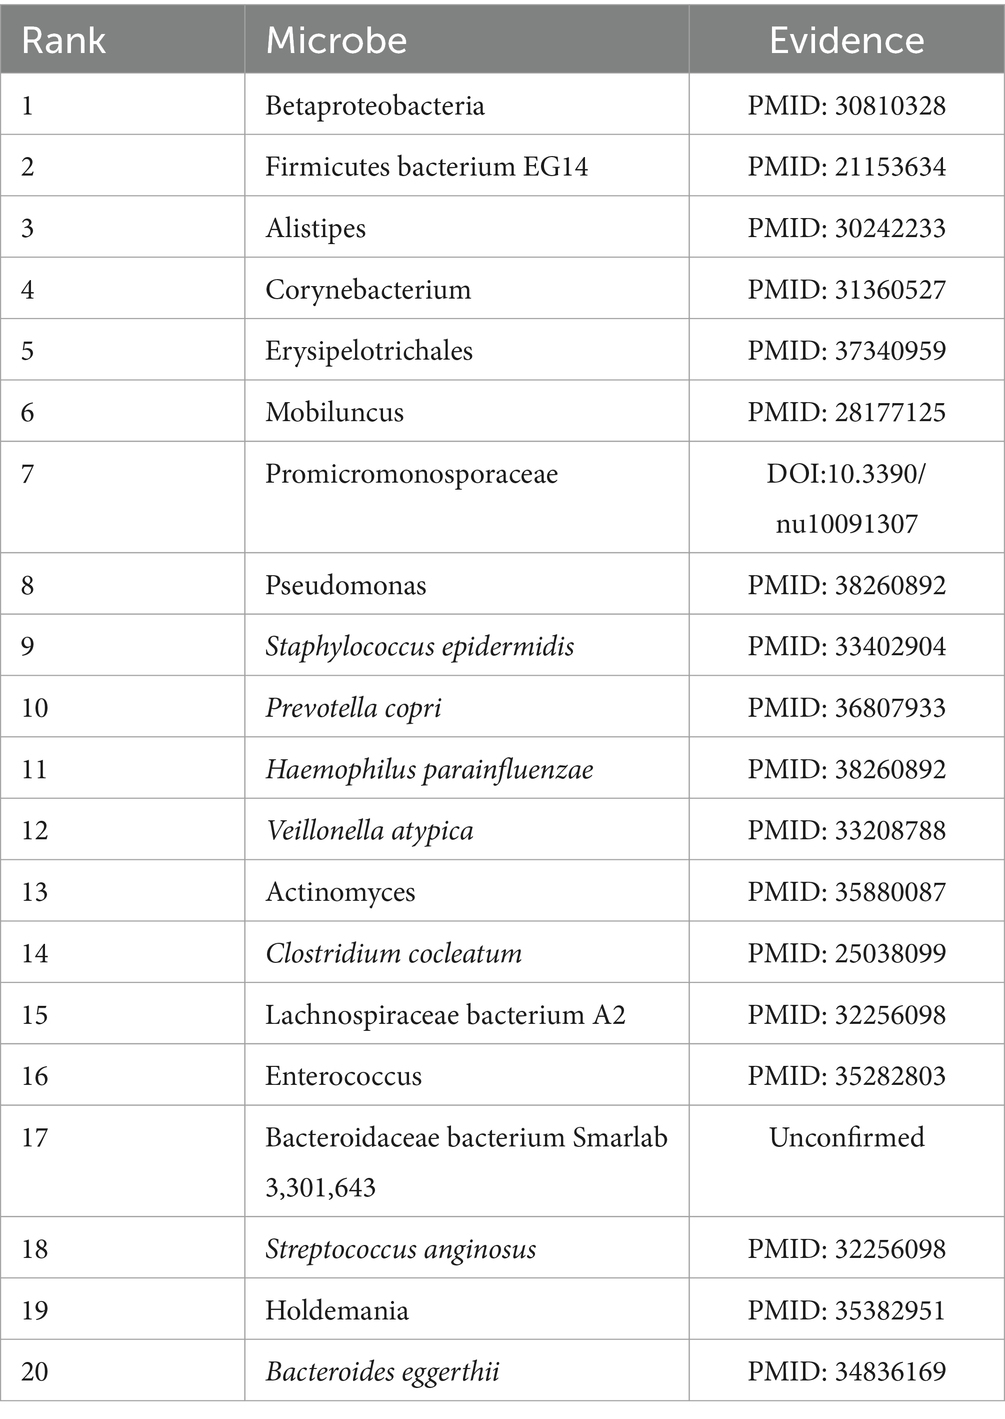
Table 6. 19 out of the top 20 candidate obesity-related microbes predicted by GCANCAE have been confirmed by published literature studies.
Finally, type 2 diabetes mellitus (T2D), as a complicated chronic condition characterized by hyperglycemia, relative insulin insufficiency, and insulin resistance, has been demonstrated that over 90% of persons with diabetes will have T2D (Sullivan et al., 2016). Common signs and symptoms of T2D include binge eating, excessive drinking, frequent urination, and unexplained weight loss. Although the exact cause of T2D is currently unknown, a combination of lifestyle factors and obesity is likely to be the culprit (Tuomilehto et al., 2001). Table 7 showed the top 20 candidate T2D-related microbes predicted by GCANCAE, from which, it is easy to observe that among these top 20 predicted T2D-related microbes, there are 18 microbes verified by published literature studies.
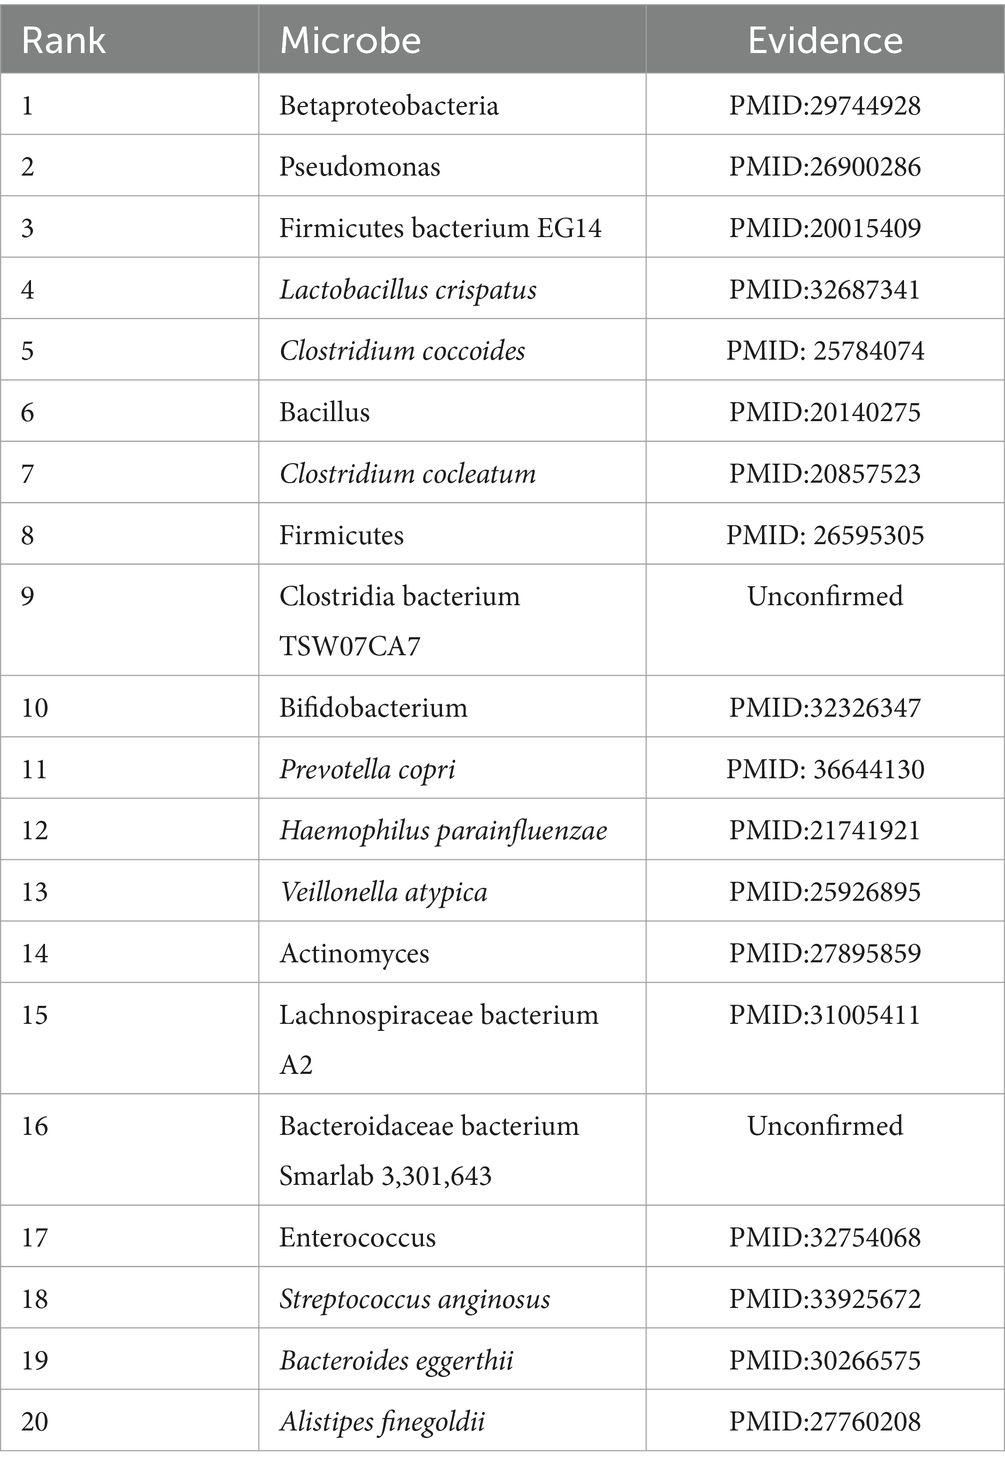
Table 7. 18 out of the top 20 candidate T2D-related microbes predicted by GCANCAE have been confirmed by published literature studies.
In this section, we selected asthma for comparing GCANCAE with the baseline model. During experiments, among the top 15 microorganisms most associated with asthma predicted by GCANCAE and BPNNHMDA, respectively, GCANCAE and BPNNHMDA achieved the same prediction accuracy of 93.3%. Moreover, among the top 20 microorganisms most associated with asthma predicted by GCANCAE and GATMDA separately, the prediction accuracy was 95% for GCANCAE while 90% for GATMDA. Overall, in all microorganisms predicted by GCANCAE, the prediction score of the potential microorganism mostly correlated with asthma was 1.0 and that of the microorganism least correlated with asthma was 0.71.
4 Conclusion
The search for treatments and prevention of diseases is crucial when virus-based pandemics are putting human health in risk on a global scale. There is mounting proof that microbes significantly affect human health. Therefore, it is evident that the identification of potential microbe–disease associations from the viewpoint of human microbes and drugs can offer crucial information for comprehending underlying disease mechanisms, which may aid in the study of disease pathogenesis, make early diagnosis easier, and increase the effectiveness of taking drugs.
In this article, we present the GCANCAE model using two models GCAN and CSAE, respectively, to extract the global topology of microbes and diseases and the attribute representations of multiple channels, to predict potential associations between microbes and diseases. Compared with the traditional state-of-the-art methods, the main advance of GCANCAE is to improve the transfer matrix of GCN to pay more attention to the characteristics of the more important nodes. Moreover, the use of multi-channel convolution autoencoder can provide richer feature information, which can help the network to capture more complex data features. Each channel can learn different feature representations, increasing the expression ability of the model. Two different models are used to extract topology and attribute features, which solves the problem that the general model has poor prediction effect on big data and can make better predictions. The results from both comparative experiments and case studies show that GCANCAE outperformed existing representative competing methods and might be a potential efficient tool for future disease prevention. However, while GCANCAE has some advantages over other methods, it has some limitations as well. For example, the convolution channel is time-consuming, and less evidence is used to predict the association between a specific microorganism and a specific disease. To solve the above problems, we will further study and improve the algorithm to reorganize the prediction task based on more public datasets.
Data availability statement
The original contributions presented in the study are included in the article/supplementary material, further inquiries can be directed to the corresponding authors.
Author contributions
CZ: Conceptualization, Data curation, Methodology, Software, Writing – original draft. ZZ: Conceptualization, Methodology, Project administration, Resources, Supervision, Writing – review & editing. FZ: Data curation, Resources, Software, Writing – review & editing. BZ: Investigation, Methodology, Visualization, Writing – review & editing. XL: Formal analysis, Software, Validation, Visualization, Writing – review & editing. LW: Funding acquisition, Project administration, Supervision, Writing – review & editing.
Funding
The author(s) declare financial support was received for the research, authorship, and/or publication of this article. This work was partly sponsored by the National Natural Science Foundation of China (No. 62272064), the Natural Science Foundation of Hunan Province (No. 2023JJ60185), and the Key Project of Changsha Science and technology Plan (No. KQ2203001).
Acknowledgments
The authors thank the referees for suggestions that helped improve the article substantially.
Conflict of interest
The authors declare that the research was conducted in the absence of any commercial or financial relationships that could be construed as a potential conflict of interest.
Publisher’s note
All claims expressed in this article are solely those of the authors and do not necessarily represent those of their affiliated organizations, or those of the publisher, the editors and the reviewers. Any product that may be evaluated in this article, or claim that may be made by its manufacturer, is not guaranteed or endorsed by the publisher.
Footnotes
References
Abu-El-Haija, S., Perozzi, B., Al-Rfou, R., and Alemi, A. A. (2018). “Watch your step: learning node embeddings via graph attention” in Advances in neural information processing systems, Mit press. 9180–9190.
Abu-El-Haija, S., Perozzi, B., Kapoor, A., Alipourfard, N., Lerman, K., Harutyunyan, H., et al. (2019). Mixhop: higher-order graph convolutional architectures via sparsified neighborhood mixing. arXiv preprint arXiv:1905.00067.
Al-Moamary, M. S., Alhaider, S. A., Alangari, A. A., Idrees, M. M., Zeitouni, M. O., al Ghobain, M. O., et al. (2021). The Saudi initiative for asthma – 2021 update: guidelines for the diagnosis and management of asthma in adults and children. Ann. Thorac. Med. 16, 4–56. doi: 10.4103/atm.ATM_697_20
Brown, K. R., and Jurisica, I. (2005). Online predicted human interaction database. Bioinformatics. 21, 2076–82.
Cai, L., Lu, C., Xu, J., Meng, Y., Wang, P., Fu, X., et al. (2021). Drug repositioning based on the heterogeneous information fusion graph convolutional network. Brief. Bioinform. 22:bbab319. doi: 10.1093/bib/bbab319
Çalışkan, M., Bochkov, Y. A., Kreiner-Møller, E., Bønnelykke, K., Stein, M. M., du, G., et al. (2013). Rhinovirus wheezing illness and genetic risk of childhood-onset asthma. N. Engl. J. Med. 368, 1398–1407. doi: 10.1056/NEJMoa1211592
Chen, X., Huang, Y.-A., You, Z.-H., Yan, G.-Y., and Wang, X.-S. (2017). A novel approach based on KATZ measure to predict associations of human microbiota with non-infectious diseases. Bioinformatics 33, 733–739. doi: 10.1093/bioinformatics/btw715
Cryan, J. F., and Dinan, T. G. (2012). Mind-altering microorganisms: the impact of the gut microbiota on brain and behaviour. Nat. Rev. Neurosci. 13, 701–712. doi: 10.1038/nrn3346
Dayun, L., Junyi, L., Yi, L., Qihua, H., and Deng, L. (2021). MGATMDA: predicting microbe-disease associations via multi-component graph attention network. IEEE/ACM Trans. Comput. Biol. Bioinform. 19:1. doi: 10.1109/TCBB.2021.3116318
Dekaboruah, E., Suryavanshi, M. V., Chettri, D., and Verma, A. K. (2020). Human microbiome: an academic update on human body site specific surveillance and its possible. Arch. Microbiol. 202, 2147–2167. doi: 10.1007/s00203-020-01931-x
Du, J., Zhang, S., Wu, G., Moura, J. M. F., and Kar, S. (2017). Topology adaptive graph convolutional networks. arXiv preprint arXiv:1710.10370.
El-Sayed, A., Aleya, L., and Kamel, M. (2021). Microbiota’s role in health and diseases. Environ. Sci. Pollut. Res. 28, 36967–36983. doi: 10.1007/s11356-021-14593-z
Fan, Y., Chen, M., Zhu, Q., and Wang, W. (2020). Inferring disease-associated microbes based on multi-data integration and network consistency projection. Front. Bioeng. Biotechnol. 8:831. doi: 10.3389/fbioe.2020.00831
GBD 2015 Obesity Collaborators (2017). Health effects of overweight and obesity in 195 countries over 25 years. N. Engl. J. Med. 377, 13–27. doi: 10.1056/NEJMoa1614362
Gill, S. R., Pop, M., DeBoy, R. T., Eckburg, P. B., Turnbaugh, P. J., Samuel, B. S., et al. (2006). Metagenomic analysis of the human distal gut microbiome. Science 312, 1355–1359. doi: 10.1126/science.1124234
Guarner, F., and Malagelada, J.-R. (2003). Gut flora in health and disease. Lancet 361, 512–519. doi: 10.1016/S0140-6736(03)12489-0
Illiano, P., Brambilla, R., and Parolini, C. (2020). The mutual interplay of gut microbiota, diet and human disease. FEBS J. 287, 833–855. doi: 10.1111/febs.15217
Integrative HMP (iHMP) Research Network Consortium (2014). The Integrative Human Microbiome Project: dynamic analysis of microbiome-host omics profiles during periods of human health and disease. Cell Host Microbe 16, 276–289. doi: 10.1016/j.chom.2014.08.014
Janssens, Y., Nielandt, J., Bronselaer, A., Debunne, N., Verbeke, F., Wynendaele, E., et al. (2018). Disbiome database: linking the microbiome to disease. BMC Microbiol. 18:50. doi: 10.1186/s12866-018-1197-5
Jiang, H.-J., Huang, Y.-A., and You, Z.-H. (2020). SAEROF: an ensemble approach for large-scale drug-disease association prediction by incorporating rotation forest and sparse autoencoder deep neural network. Sci. Rep. 10:4972. doi: 10.1038/s41598-020-61616-9
Kamneva, O. K. (2017). Genome composition and phylogeny of microbes predict their co-occurrence in the environment. PLOS Comput. Biol. 13:e1005366. doi: 10.1371/journal.pcbi.1005366
Kim, S.-K., Guevarra, R. B., Kim, Y. T., Kwon, J., Kim, H., Cho, J. H., et al. (2019). Role of probiotics in human gut microbiome-associated diseases. J. Microbiol. Biotechnol. 29, 1335–1340. doi: 10.4014/jmb.1906.06064
Kim, N., Yun, M., Oh, Y. J., and Choi, H.-J. (2018). Mind-altering with the gut: modulation of the gut-brain axis with probiotics. J. Microbiol. 56, 172–182. doi: 10.1007/s12275-018-8032-4
Kingma, D. P., and Adam, J. B. (2014). A method for stochastic optimization. arXiv e-prints arXiv:1412.6980.
Kipf, T. N., and Welling, M. (2016). Semi-supervised classification with graph convolutional networks. arXiv preprint arXiv:1609.02907.
Klicpera, J., Bojchevski, A., and Günnemann, S. (2018). Predict then propagate: graph neural networks meet personalized pagerank. arXiv preprint arXiv:1810.05997.
Klicpera, J., Weißenberger, S., and Günnemann, S. (2019). “Diffusion improves graph learning” in Advances in neural information processing systems, Mit Press. 13354–13366.
Köhler, S., Bauer, S., Horn, D., and Robinson, P. N. (2008). Walking the Interactome for prioritization of candidate disease genes. Am. J. Hum. Genet. 82, 949–958. doi: 10.1016/j.ajhg.2008.02.013
Kondor, Risi Imre, and Lafferty, John. Diffusion kernels on graphs and other discrete structures. In Proceedings of the 19th international conference on machine learning, volume 2002, ACM Press. 315–322, (2002).
Li, G., Bai, P., Liang, C., and Luo, J. (2024). Node-adaptive graph transformer with structural encoding for accurate and robust lncRNA-disease association prediction. BMC Genomics 25:73. doi: 10.1186/s12864-024-09998-2
Li, H., Wang, Y., Zhang, Z., Tan, Y., Chen, Z., Wang, X., et al. (2021). Identifying microbe-disease association based on a novel Back-propagation neural network model. IEEE/ACM Trans. Comput. Biol. Bioinform. 18, 2502–2513. doi: 10.1109/TCBB.2020.2986459
Liu, Meng, Gao, Hongyang, and Ji, Shuiwang. Towards deeper graph neural networks. In Proceedings of the 26th ACM SIGKDD International Conference on Knowledge Discovery & Data Mining, ACM Press. 338–348, (2020).
Long, Y., Luo, J., Zhang, Y., and Xia, Y. (2021). Predicting human microbe–disease associations via graph attention networks with inductive matrix completion. Brief. Bioinform. 22:bbaa146. doi: 10.1093/bib/bbaa146
Long, Y., Wu, M., Liu, Y., Kwoh, C. K., Luo, J., and Li, X. (2020). Ensembling graph attention networks for human microbe–drug associationprediction. Bioinformatics 36, i779–i786. doi: 10.1093/bioinformatics/btaa891
Luo, J., and Long, Y. (2020). NTSHMDA: prediction of human microbe-disease association based on random walk by integrating network topological similarity. IEEE/ACM Trans. Comput. Biol. Bioinform. 17, 1341–1351. doi: 10.1109/TCBB.2018.2883041
Luu, T. H., Michel, C., Bard, J.-M., Dravet, F., Nazih, H., and Bobin-Dubigeon, C. (2017). Intestinal proportion of Blautia sp. is associated with clinical stage and Histoprognostic grade in patients with early-stage breast Cancer. Nutr. Cancer 69, 267–275. doi: 10.1080/01635581.2017.1263750
Ma, Z., Li, M., and Wang, Y. (2019). Pan: path integral based convolution for deep graph neural networks. arXiv preprint arXiv:1904.10996.
Ma, W., Zhang, L., Zeng, P., Huang, C., Li, J., Geng, B., et al. (2017). An analysis of human microbe–disease associations. Brief. Bioinform. 18, 85–97. doi: 10.1093/bib/bbw005
Ohkusa, T., Sato, N., Ogihara, T., Morita, K., Ogawa, M., and Okayasu, I. (2002). Fusobacterium varium localized in the colonic mucosa of patients with ulcerative colitis stimulates species-specific antibody. J. Gastroenterol. Hepatol. 17, 849–853. doi: 10.1046/j.1440-1746.2002.02834.x
Page, L., Brin, S., Motwani, R., and Winograd, T. (1999). The pagerank citation ranking: bringing order to the web. Stanford University, USA: Technical report, Stanford InfoLab.
Peng, L., Huang, L., Su, Q., Tian, G., Chen, M., and Han, G. (2024a). LDA-VGHB: identifying potential lncRNA–disease associations with singular value decomposition, variational graph auto-encoder and heterogeneous Newton boosting machine. Brief. Bioinform. 25:bbad466. doi: 10.1093/bib/bbad466
Peng, L., Liu, X., Yang, L., Liu, L., Bai, Z., Chen, M., et al. (2024b). BINDTI: a bi-directional intention network for drug-target interaction identification based on attention mechanisms. IEEE J. Biomed. Health Inform. 28, 1–11. doi: 10.1109/JBHI.2024.3375025
Peng, L., Tan, J., Xiong, W., Zhang, L., Wang, Z., Yuan, R., et al. (2023). Deciphering ligand–receptor-mediated intercellular communication based on ensemble deep learning and the joint scoring strategy from single-cell transcriptomic data. Comput. Biol. Med. 163:107137. doi: 10.1016/j.compbiomed.2023.107137
Peng, L., Xiong, W., Han, C., Li, Z., and Chen, X. (2024c). CellDialog: a computational framework for ligand-receptor-mediated cell-cell communication analysis. IEEE J. Biomed. Health Inform. 28, 580–591. doi: 10.1109/JBHI.2023.3333828
Proctor, L. M., Creasy, H. H., Fettweis, J. M., Lloyd-Price, J., and Huttenhower, C. (2019). The Integrative human microbiome project. Nature 569, 641–648. doi: 10.1038/s41586-019-1238-8
Saltiel, A. R., and Olefsky, J. M. (2017). Inflammatory mechanisms linking obesity and metabolic disease. J. Clin. Invest. 127, 1–4. doi: 10.1172/JCI92035
Sampson, T. R., Debelius, J. W., Thron, T., Janssen, S., Shastri, G. G., Ilhan, Z. E., et al. (2016). Gut microbiota regulate motor deficits and Neuroinflammation in a model of Parkinson’s disease. Cell 167, 1469–1480.e12. doi: 10.1016/j.cell.2016.11.018
Shi, N., Li, N., Duan, X., and Niu, H. (2017). Interaction between the gut microbiome and mucosal immune system. Mil. Med. Res. 4:14. doi: 10.1186/s40779-017-0122-9
Skoufos, G., Kardaras, F. S., Alexiou, A., Kavakiotis, I., Lambropoulou, A., Kotsira, V., et al. (2021). Peryton: a manual collection of experimentally supported microbe-disease associations. Nucleic Acids Res. 49, D1328–D1333. doi: 10.1093/nar/gkaa902
Sullivan, A., Hunt, E., MacSharry, J., and Murphy, D. M. (2016). The microbiome and the pathophysiology of asthma. Respir. Res. 17:163. doi: 10.1186/s12931-016-0479-4
Sun, C., and Wu, G. (2020). Adaptive graph diffusion networks with hop-wise attention. arXiv preprint arXiv:2012.15024v1.
Tan, Y., Zou, J., Kuang, L., Wang, X., Zeng, B., Zhang, Z., et al. (2022). GSAMDA: a computational model for predicting potential microbe–drug associations based on graph attention network and sparse autoencoder. BMC Bioinformatics 23:492. doi: 10.1186/s12859-022-05053-7
Toya, T., Corban, M. T., Marrietta, E., Horwath, I. E., Lerman, L. O., Murray, J. A., et al. (2020). Coronary artery disease is associated with an altered gut microbiome composition. PLoS One 15:e0227147. doi: 10.1371/journal.pone.0227147
Tuomilehto, J., Lindström, J., Eriksson, J. G., Valle, T. T., Hämäläinen, H., Ilanne-Parikka, P., et al. (2001). Prevention of type 2 diabetes mellitus by changes in lifestyle among subjects with impaired glucose tolerance. N. Engl. J. Med. 344, 1343–1350. doi: 10.1056/NEJM200105033441801
Veličković, P., Cucurull, G., Casanova, A., Romero, A., Liò, P., and Bengio, Y. (2017). Graph attention networks. arXiv preprint arXiv:1710.10903.
Wang, F., Huang, Z. A., Chen, X., Zhu, Z., Wen, Z., Zhao, J., et al. (2017). LRLSHMDA: Laplacian regularized least squares for human microbe–disease association prediction. Sci. Rep. 7:7601. doi: 10.1038/s41598-017-08127-2
Wang, L., Wang, Y., Li, H., Feng, X., Yuan, D., and Yang, J. (2019). A bidirectional label propagation based computational model for potential microbe-disease association prediction. Front. Microbiol. 10:684. doi: 10.3389/fmicb.2019.00684
Wang, G., Ying, R., Huang, J., and Leskovec, J. (2020). Direct multi-hop attention based graph neural network. arXiv preprint arXiv:2009.14332.
Wu, C., Xiao, X., Yang, C., Chen, J., Yi, J., and Qiu, Y. (2021). Mining microbe–disease interactions from literature via a transfer learning model. BMC Bioinformatics 22:432. doi: 10.1186/s12859-021-04346-7
Xu, J., and Li, Y. (2006). Discovering disease-genes by topological features in human protein–protein interaction network. Bioinformatics 22, 2800–2805. doi: 10.1093/bioinformatics/btl467
Xu, B., Shen, H., Cao, Q., Cen, K., and Cheng, X. (2020). Graph convolutional networks using heat kernel for semi-supervised learning. arXiv preprint arXiv:2007.16002.
Xu, D., Xu, H., Zhang, Y., and Gao, R. (2022). Novel collaborative weighted non-negative matrix factorization improves prediction of disease-associated human microbes. Front. Microbiol. 13:834982. doi: 10.3389/fmicb.2022.834982
Xu, D., Xu, H., Zhang, Y., Wang, M., Chen, W., and Gao, R. (2021). MDAKRLS: predicting human microbe-disease association based on Kronecker regularized least squares and similarities. J. Transl. Med. 19:66. doi: 10.1186/s12967-021-02732-6
Xuan, P., Gao, L., Sheng, N., Zhang, T., and Nakaguchi, T. (2021). Graph convolutional autoencoder and fully-connected autoencoder with attention mechanism based method for predicting drug-disease associations. IEEE J. Biomed. Health Inform. 25, 1793–1804. doi: 10.1109/JBHI.2020.3039502
Yao, G., Zhang, W., Yang, M., Yang, H., Wang, J., Zhang, H., et al. (2020). MicroPhenoDB associates metagenomic data with pathogenic microbes, microbial Core genes, and human disease phenotypes. Genomics Proteomics Bioinformatics 18, 760–772. doi: 10.1016/j.gpb.2020.11.001
Keywords: graph attention networks, sparse autoencoders, microbe–disease associations, computational model, prediction model
Citation: Zhang C, Zhang Z, Zhang F, Zeng B, Liu X and Wang L (2024) A computational model for potential microbe–disease association detection based on improved graph convolutional networks and multi-channel autoencoders. Front. Microbiol. 15:1435408. doi: 10.3389/fmicb.2024.1435408
Edited by:
Lihong Peng, Chinese PLA General Hospital, ChinaReviewed by:
Guanghui Li, East China Jiaotong University, ChinaWang-Ren Qiu, Jingdezhen Ceramic Institute, China
Li ZeJun, Hunan Institute of Technology, China
Peng Wang, Hainan Normal University, China
Copyright © 2024 Zhang, Zhang, Zhang, Zeng, Liu and Wang. This is an open-access article distributed under the terms of the Creative Commons Attribution License (CC BY). The use, distribution or reproduction in other forums is permitted, provided the original author(s) and the copyright owner(s) are credited and that the original publication in this journal is cited, in accordance with accepted academic practice. No use, distribution or reproduction is permitted which does not comply with these terms.
*Correspondence: Zhen Zhang, MTU1Mjk5MjQzQHFxLmNvbQ==; Xin Liu, eGluLmxpdUBjY3N1LmVkdS5jbg==; Lei Wang, d2FuZ2xlaUB4dHUuZWR1LmNu