
94% of researchers rate our articles as excellent or good
Learn more about the work of our research integrity team to safeguard the quality of each article we publish.
Find out more
ORIGINAL RESEARCH article
Front. Microbiol., 22 July 2024
Sec. Systems Microbiology
Volume 15 - 2024 | https://doi.org/10.3389/fmicb.2024.1423428
 Ye-hao Luo1,2,3†
 Da-wei Wang4,5†
 Jia Yao6
 Yue Hu1
 Ling Zhao2Jian-xuan Wen2
 Jin-ming Zhang2Lu-Lu Wu2Guan-jie Fan1,2,3*
 Wei Song1,2,3*
Objective: Tangbi capsule (TBC) is a traditional Chinese medicine prescription, which has the potential to improve the vascular insufficiency of lower extremities and limb numbness in diabetes. However, the potential mechanism remains unknown. This study aims to investigate the pharmacological effects and mechanism of TBC on rats with diabetic lower extremities arterial disease (LEAD).
Methods: The mechanism of TBC on diabetic LEAD was investigated through metabolomics and transcriptomics analysis, and the main components of TBC were determined by mass spectrometry. The efficacy and mechanism of TBC on diabetic LEAD rats were investigated through in vitro experiments, histopathology, blood flow monitoring, western blot, and real-time polymerase chain reaction.
Results: Mass spectrometry analysis identified 31 active chemical components in TBC including (2R)-2,3-Dihydroxypropanoic acid, catechin, citric acid, miquelianin, carminic acid, salicylic acid, formononetin, etc. In vitro analysis showed that TBC could reduce endothelial cell apoptosis and promote angiogenesis. Histopathological analysis showed that TBC led to an obvious improvement in diabetic LEAD as it improved fibrous tissue proliferation and reduced arterial wall thickening. In addition, TBC could significantly increase the expression levels of HIF-1α, eNOS, and VEGFA proteins and genes while reducing that of calpain-1 and TGF-β, suggesting that TBC can repair vascular injury. Compared with the model group, there were 47 differentially expressed genes in the whole blood of TBC groups, with 25 genes upregulated and 22 downregulated. Eighty-seven altered metabolites were identified from the serum samples. Combining the changes in differentially expressed genes and metabolites, we found that TBC could regulate arginine biosynthesis, phenylalanine metabolism, pyrimidine metabolism, arachidonic acid metabolism, pyrimidine metabolism, arachidonic acid metabolism, nucleotide metabolism, vitamin B6 metabolism and other metabolic pathways related to angiogenesis, immune-inflammatory response, and cell growth to improve diabetic LEAD.
Conclusion: TBC improved vascular endothelial injury, apoptosis, lipid accumulation, liver and kidney function, and restored blood flow in the lower extremities of diabetic LEAD rats. The mechanism of TBC in the treatment of diabetic LEAD may be related to the modulation of inflammatory immunity, lipid metabolism, and amino acid metabolism. This study presented preliminary evidence to guide the use of TBC as a therapy option for diabetic LEAD.
Diabetic lower extremity vascular disease refers to lower extremity arterial disease (LEAD), a main component of peripheral arterial disease. Currently, nearly half a billion people worldwide suffer from diabetes, and the prevalence is expected to increase by more than 50 percent in 25 years. It is estimated that LEAD affects more than 200 million people worldwide (Lazzarini et al., 2018). LEAD is the main cause of foot pain, rupture, gangrene, and amputation in diabetic patients. Early-stage LEAD is often asymptomatic, with only mild limb extremity coldness, numbness, and discomfort. As the lesion progresses, intermittent claudication of the lower extremities may occur. When lower limb ischemia is further aggravated, resting pain and even ischemic ulceration and necrosis of the feet or toes can occur, reducing the quality of life of patients and increasing the risk of myocardial infarction, stroke, and other cardiovascular events (Nativel et al., 2018a).
The pathogenesis of diabetic LEAD involves many aspects, including atherosclerotic thrombosis due to metabolic abnormalities, pathological activation of coagulation mechanism, platelet dysfunction and plaque rupture, excessive production of advanced glycosylation end products (AGEs), endothelial dysfunction, oxidative stress, and inflammatory response (Buso et al., 2019) (Figure 1). Current clinical treatment of diabetic LEAD is mainly surgery, anticoagulation, and antiplatelet therapy. Unfortunately, those therapies can only temporarily alleviate the clinical symptoms and fail to restore the function of the lower extremities (LoGerfo and Gibbons, 1996). In addition, most diabetic LEAD patients choose conservative treatment due to the economic burden, and there is no definitive therapeutical regimen that delays the progression of the disease and amputation due to limb gangrene (Weiss and Sumpio, 2006).
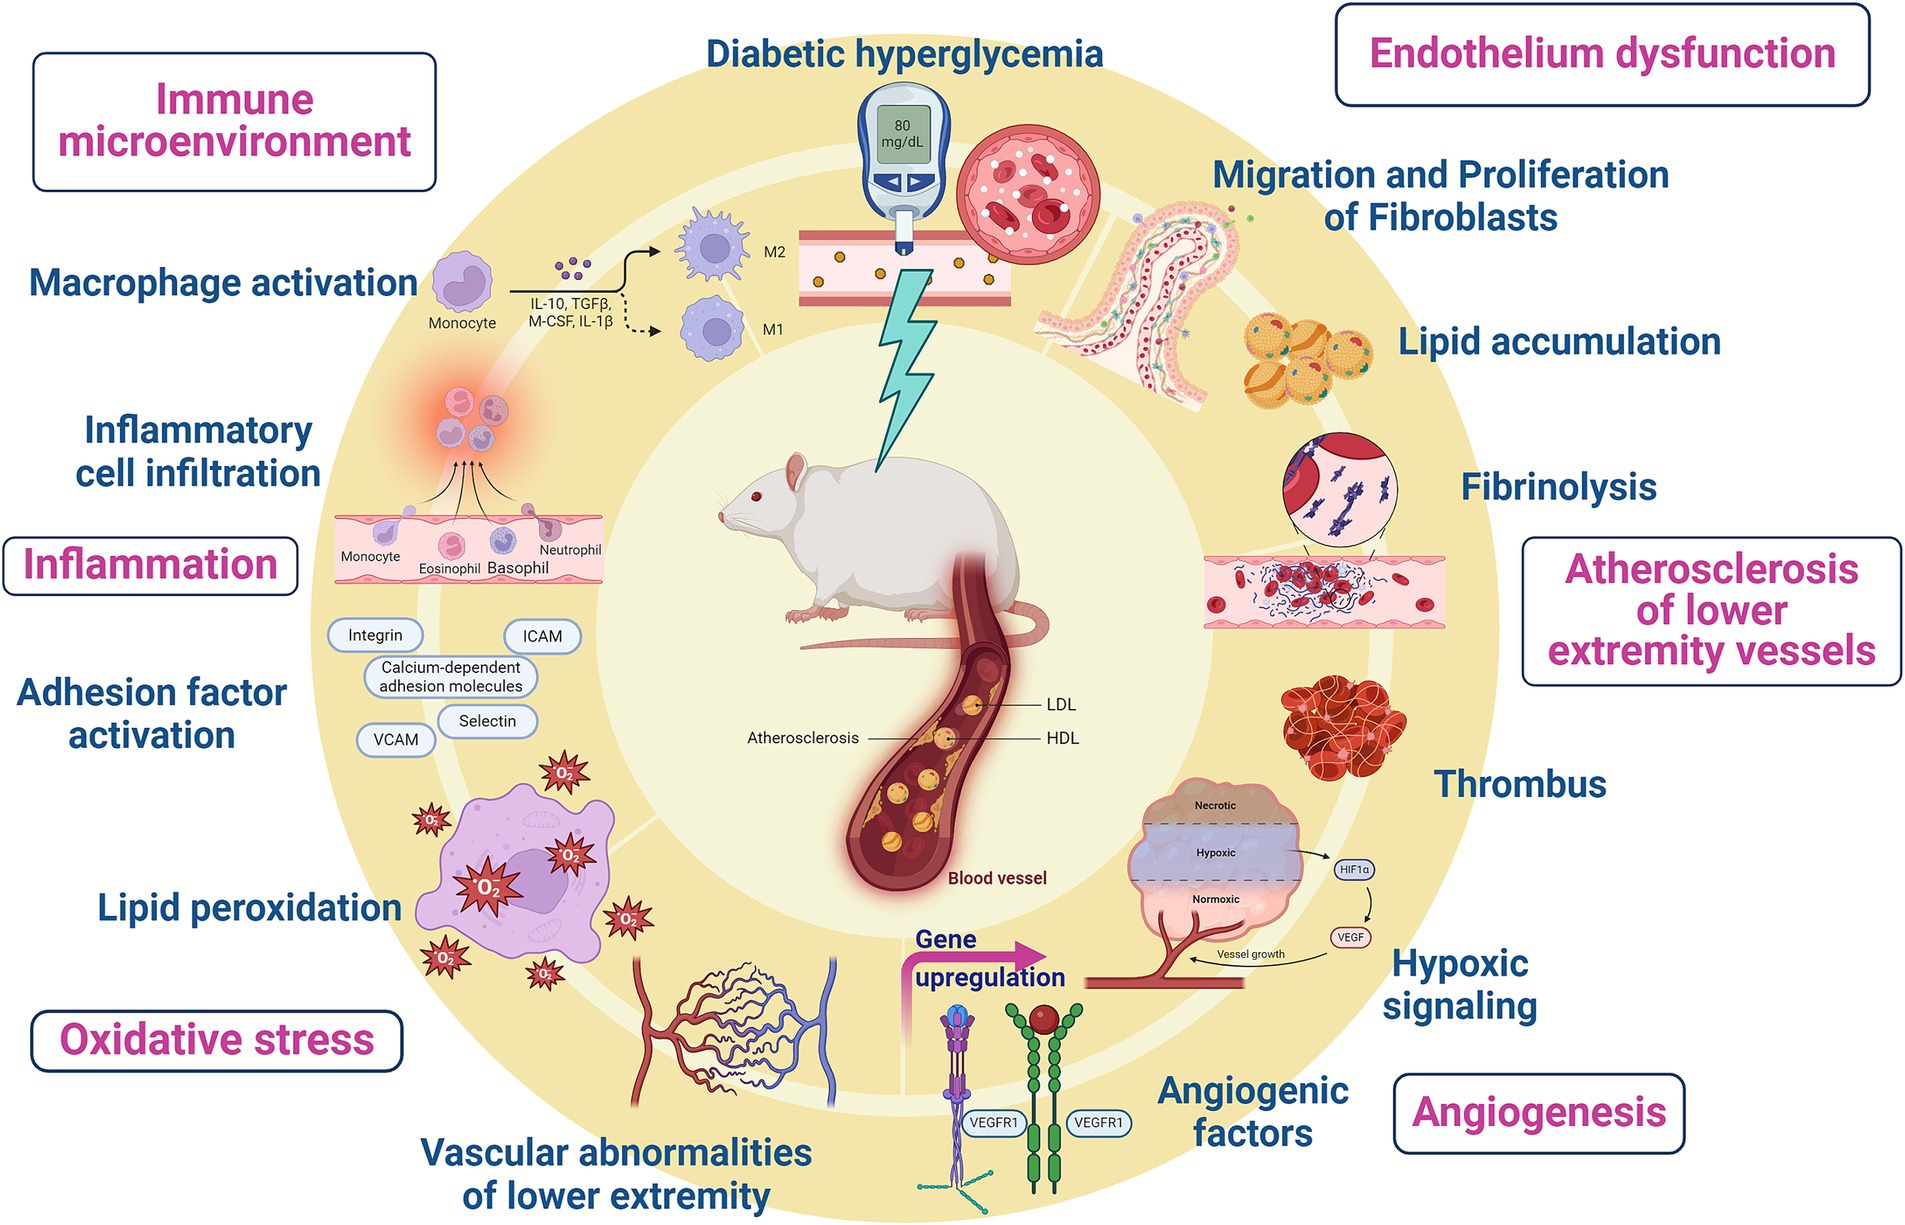
Figure 1. Pathogenesis of diabetic lower extremity vascular disease.
Tangbi capsule is a traditional Chinese medicinal preparation for the treatment of diabetic LEAD, which consists of Astragalus membranaceus, Cinnamomum cassiae, Radix Angelicae sinensis, Radix Paeoniae alba, Salviae miltiorrhizae, Radix Rehmanniae praeparata, Lutetiae, Leeches, and Digitoninum. Previous clinical studies have shown that TBC can improve clinical symptoms such as limb coldness, numbness, pain, burning, and skin dryness in diabetic LEAD patients (Hongxia et al., 2007). However, the active ingredients and mechanism of TBC for LEAD are not elucidated. The liquid chromatograph-mass spectrometer (LC-MS) is of great significance for the study of active ingredients in traditional Chinese medicine (Wu et al., 2012). In addition, multi-omics analysis is frequently used to identify potential biomarkers and elucidate disease-related pathogenesis and drug mechanisms of action. Previous studies have shown that the combination of transcriptomics and metabolomics can reveal the distribution and changes of metabolites and genes in serum, contributing to the development of effective therapeutic strategies (Russell et al., 2013).
Therefore, this study aims to clarify the active ingredients of TBC through LC-MS, investigate the therapeutic efficacy and mechanism of TBC on diabetic LEAD through ex vivo experiments, and evaluate the role of TBC in regulating the metabolites and the expression of related genes in diabetic LEAD through metabolomics and transcriptomics analysis.
TBC (Guangdong Pharmaceutical Preparation Approval No. Z20070871, Preparation by Guangdong Provincial Hospital of Traditional Chinese Medicine, Batch No. 06062902) Cilostazol (Chengdu Lier Pharmaceuticals, NMPA Approval No. H20056723), Cilostazol (Chengdu Lier Pharmaceuticals, NMPA Approval No. H20056723), LC/MS grade acetonitrile, methanol, water and formic acid were from Thermo Fisher Scientific (China) Co. Streptomycin and ammonium acetate were from Sigma-Aldrich. Cell Counting Kit-8 (CCK-8) was from Dojindo (Japan). Annexin-V FITC Apoptosis Kit (#556547) was from BD Biosciences Pharmingen (United States). Anti-HIF-1 alpha antibody (ab1), Anti-VEGF Antibody (ab46154), Anti-eNOS antibody (ab300071), Anti-Calpain 1 antibody (ab108400), Anti-iNOS antibody (ab178945), and Anti-TGF beta 1 antibody (ab215715) were from Abcam (United Kingdom).
0.1 g content powder of TBC was dissolved in 1,000 μL of 80% methanol for a 10-min vortex. The solution was centrifuged at 20,000 × g for 10 min at 4°C. The supernatant was analyzed on a Q Exactive Orbitrap LC-MS system via a ΜLtiMate 3000 RS chromatograph and a Q Exactive high-resolution mass spectrometer.
Mass spectrometry conditions: electrospray ionization source (ESI) detection for FμLl mass/dd-MS2, resolution of 70,000 (fμLl mass), 17,500 (dd-MS2); scan range: 100.0–500.0 m/z; electrospray voltage: 3.2 kV (Positive, Negative); capillary temperature: 300°C; collision gas: high purity argon (purity ≥99.999%); collision energy (N): 30, 40, 60; sheath gas: nitrogen (purity ≥99.999%), 40 Arb; auxiliary gas: nitrogen (purity ≥99.999%), 15 Arb, 350°C; data acquisition time: 30.0 min.
Chromatographic conditions: the column was AQ-C18, 150 × 2.1 mm, 1.8 μm, Welch, at 35°C, flow rate 0.30 mL/min, gradient elution aqueous phase was 0.1% formic acid/water solution (A), the organic phase was methanol (B), the injection volume was 5.00 μL. Chromatographic gradients were (1 min, 2% B; 5 min, 20% B; 10 min, 50% B; 15 min, 80% B; 20–27 min, 95% B; 28–30 min, 2% B). The initial organization of data for high-resolution liquid-quality acquisitions was completed via CD 3.3 (Compound Discoverer 3.3) (Thermo Fisher), and retention time and peak area were used for comparative database (mzCloud) search to determine the main components in TBC (Supplementary Figure S1 and Supplementary Table S1). Detailed sample preparation and instrumental parameter settings can be found in the Supplementary material.
Human umbilical vein endothelial cells (HUVEC) were obtained from the China Infrastructure of Cell Line Resources and grown under standard conditions (37°C and 5% CO2) in DMEM containing 10% (v/v) fetal bovine serum and 100 U/mL penicillin/streptomycin. Subsequent studies were performed at 80% cell fusion. After the successful construction of the cell proliferation model induced by high glucose (25 mmol/L), the cells were divided into normal group, model group, and TBC-containing serum high-, medium- and low-dose groups. The effects of cell survival, angiogenic ability, and apoptosis were investigated.
HUVECs were inoculated in 96-well plates, cultured separately according to the experimental grouping. HUVECs were put into the incubator for a 24 h culture, after which 10 μL of CCK-8 solution was added to each well for another 1 h incubation in the incubator. Then, absorbance values at 450 nm were determined by an enzyme counter, and the cell activity was calculated. Cell viability (%) = (OD experimental group − OD blank group)/(OD control group − OD blank group) × 100%.
HUVEC was intervened with high glucose for 24 h, followed by treatment with TBC-containing serum for 24 h. HUVEC with and without pretreatment (3 × 10⁴ cells/well) were inoculated into matrix gel plates (containing 200 μL of matrix gel; BD Biosciences, San Jose, CA, United States) and incubated at 37°C in 5% CO2 for 18 h. Capillary-like structures were evident and counted via an inverted microscope. The vascular network formed by HUVEC was quantified via the Image J plug-in Angiogenesis Analyzer. Data were summarized as mean ± standard deviation (SD).
Apoptosis was detected by flow cytometry (BD Accuri C6, United States), and HUVECs in 6-well plates were stained with PI and Membrane Associated Protein V-Fluorescein Isothiocyanate according to the manufacturer’s protocols (Zhu et al., 2018). Apoptotic HUVECs were analyzed via FlowJo_V10 software.
This animal experiment was ethically approved by the Experimental Animal Ethics Committee of Guangdong Hospital of Chinese Medicine (Approval No. 2023033). Sixty SPF-grade SD male rats, 7 weeks old, weighing 220 ± 10 g, purchased from Guangdong Animal Experiment Center (License No. SYXK(Yue)2018-0094) were used. The experiment was carried out as follows: (1) Twelve rats were evenly divided into blank group, TBC high-dose group 0.316 g/kg, TBC medium-dose group 0.158 g/kg, and TBC low-dose group 0.079 g/kg, and drug-containing serums were prepared to be used for subsequent cellular assays. (2) Eight rats in the control group were fed with conventional feed. Forty rats in the model group were fed with high-fat diet (GD60, mass ratio: 26.2% protein, 26.3% carbohydrate, 34.9% fat; energy supply ratio: 20% protein, 20% carbohydrate, 60% fat). After 8 weeks, the 40 rats were given low-dose STZ (35 mg/kg) intraperitoneally for 2 weeks, after which their right lower limb femoral artery was ligated to establish the model of diabetic LEAD. After the establishment of the model, the rats were randomly divided into model group, positive control group (cilostazol 10 mg/kg−1), TBC high-dose group (0.316 g/kg−1), TBC medium dose group (0.158 g/kg−1) and TBC low-dose group (0.079 g/kg−1), with 8 rats in each group. Rats in the control group and model group were given the same amount of purified water once a day for 6 consecutive weeks. At the end of the study, the femoral artery, liver, and kidney tissues of rats in each group were divided into two parts. The first part was rapidly stored at −80°C for WB and qPCR assays, and the second part was fixed with 4% formaldehyde, embedded in paraffin wax, and stained with hematoxylin-eosin (HE) staining, immunofluorescence, and flow cytometry. Serum and whole blood were used for biochemical assays, metabolomics, and transcriptomics analysis.
Serum alanine transaminase (ALT), aspartate transaminase (AST), triglyceride (TG), total cholesterol (TC), low-density lipoprotein cholesterol (LDL-C), creatinine (Cr), glucose (GLU), and nitric oxide (NO) levels were measured with commercially available kits (Jiancheng Institute of Bioengineering, Nanjing, China) via a Hitachi 7020 automated biochemical analyzer (Hitachi High-Tech Corporation, Tokyo, Japan). Interleukin-6 (IL-6) (ab234570), tumor necrosis factor-α (TNF-α) (ab236712), IL-1β (ab255730), and endothelin-1 (ET-1) (ab133030) were analyzed with ELISA kits purchased from Abcam (United Kingdom).
Freshly collected vascular tissues were fixed in 4% paraformaldehyde (Solarbio, Beijing, China) before embedded in paraffin. Subsequently, the vascular tissue slides were stained with HE according to the manufacturer’s instructions (Solarbio, Beijing, China). A research-grade electric microscope imaging system was used for observation.
Lower limb blood flow was detected 28 days after femoral artery ligation modeling. The perfusion unit (PU) of both lower extremities was recorded by a laser scattering microcirculation detection system (PeriCam PSI System) under anesthesia, at constant temperature, and in constant light. Following the anesthesia of 2% pentobarbital sodium intraperitoneal injection, a laser Doppler probe was placed on the soles of the rats, and an area of 3 cm × 5 cm was scanned with the laser diffusion microcirculation imaging. The Doppler effect generated by the movement of blood cells in blood vessels within 1 mm under the skin was converted into current values to draw two-dimensional color perfusion images, where red indicates the maximum perfusion volume, dark blue the minimum, yellow in between, and darker color means smaller perfusion volume. The degree of perfusion in the operated limb was expressed by the blood flow ratio of operated limb/healthy limb for data analysis.
Protein samples (25 μg) were separated by 10% SDS-PAGE. Solubilized proteins were transferred to PVDF membranes and blocked in TBST solution containing 5% skimmed milk for 1 h. The cell membranes were incubated with Anti-HIF-1 alpha antibody (1:2,000), Anti-VEGF antibody (1:2,000), Anti-eNOS antibody (1:2,000), Anti-Calpain 1 antibody (1:2,000), Anti-iNOS antibody (1:2,000), and Anti-TGF beta 1 antibody (1:2,000) overnight before being exposed to a secondary antibody at room temperature for 1 h. Cell membranes were visualized via Image Quant LAS-4000 (Genetal Electric, Boston, United States), and relative protein expression levels were determined using Image J.
Total RNA was extracted from femoral artery with Trizol reagent and then reverse transcribed to cDNA with Primescript RT reagent Kit (Takara, Shiga, Japan) according to the manufacturer’s instructions. SYBR Premix Ex Taq (TaKaRa) was applied in a 7500 Real-time PCR System for Real-time PCR analysis (Applied Biosystems, Waltham, United States). Delta–delta Ct was used to calculate the relative mRNA expression. The primer sequences are shown in Table 1.

Table 1. The primer sequences.
The samples (100 μL) were placed in the EP tubes and resuspended with prechilled 80% methanol by well vortex. Samples were then incubated on ice for 5 min and centrifuged at 15,000 g, 4°C for 20 min. Some of the supernatant was diluted to a final concentration containing 53% methanol by LC-MS grade water. The samples were subsequently transferred to a fresh Eppendorf tube and centrifuged at 15,000 g, 4°C for 20 min. Finally, the supernatant was injected into the LC-MS/MS system for analysis. To investigate the stability of the instrument and the reproducibility of the samples, quality control samples were prepared by aliquot pooling. An equal volume of samples was taken from each experimental sample and mixed as quality control samples. Blank samples were prepared with 53% aqueous methanol solution, and the pretreatment process was the same as that of the experimental samples. The mobile phases were A (water +0.1% formic acid +5 mM ammonium acetate) and B (acetonitrile), and a Vanquish LC ultra-high-performance liquid chromatography system (UHPLC) Hypesil Gold column (2.1 × 100 mm, 1.9 μm) (Thermo Fisher, United States) was used to separate the samples.
UHPLC-MS/MS analyses were performed with a Vanquish UHPLC system (Thermo Fisher, Germany) coupled with an Orbitrap Q Exactive™ HF-X mass spectrometer (Thermo Fisher, Germany). Samples were injected onto a Hypesil Gold column (100 × 2.1 mm, 1.9 μm) via a 12-min linear gradient at a flow rate of 0.2 mL/min. The eluents for the positive polarity mode were eluent A (0.1% FA in Water) and eluent B (Methanol). The eluents for the negative polarity mode were eluent A (5 mM ammonium acetate, pH 9.0) and eluent B (Methanol). The solvent gradient was set as follows: 2% B, 1.5 min; 2–85% B, 3 min; 85–100% B, 10 min; 100–2% B, 10.1 min; 2% B, 12 min. Q Exactive™ HF-X mass spectrometer was operated in positive/negative polarity mode with a spray voltage of 3.5 kV, capillary temperature of 320°C, sheath gas flow rate of 35 psi, and aux gas flow rate of 10 L/min, S-lens RF level of 60, Aux gas heater temperature of 350°C.
Raw LC-MS data were converted to m/z file format using the online platform Wekemo Bioincloud.1 Combined with the high-quality mzCloud database constructed from standards paired with mzVault and MassList databases, the molecular signature peaks were matched for identification, which was able to identify as many metabolites as possible in the biological system and maximize the reflection of total metabolite information. Multidimensional statistical analyses (PCA, PLS-DA, and OPLS-DA) were performed using SIMCA-P, and the validity of the OPLS-DA model was verified by the 200-permutation test and evaluated by the Q2 value. Potential metabolites were screened according to the criteria of variable projection importance (VIP) >1.0 and p < 0.05 and evaluated by the HMDB database2 and LIPID Maps database3 for structural identification. The identified potential metabolites were imported into the online platform Wekemo Bioincloud and based on the KEGG database to reveal the key metabolic pathways.4
Total RNA was extracted from whole blood of the control group, model group, and TBC-H groups using TRIzol reagent (Invitrogen, CA, United States). The concentration and quality of extracted RNA were measured with an Agilent 2100 bioanalyzer (Agilent Technologies, CA, United States) and Nano Photometer spectrophotometer. The cDNA libraries were constructed and sequenced by Wekemo Tech Guoup Co., Ltd. Shenzhen China using the Illumina NovaSeq platform. The raw data (raw reads) in fastq format were firstly processed through in-house perl scripts. In this step, clean data were obtained by removing low-quality reads and reads containing adapter and ploy-N. At the same time, Q20, Q30, and GC content of the clean data were calculated. All subsequent analyses were based on high-quality clean data. An index of the reference genome was constructed using HISAT2 and paired-end clean reads were also aligned to the rat genome using HISAT2. Transcript abundances were measured as fragments per kilobase of transcript per million fragments mapped (FPKM) using the StringTie. Differentially expressed genes (DEGs) were screened via DESeq2 (version 1.16.1) using the criteria |log2Fold Change| ≥1 and p-value <0.05. Gene Ontology (GO) and Kyoto Encyclopedia of Genes and Genomes (KEGG) pathway enrichment analysis of differentially expressed genes was performed with the clusterProfiler R package. PPI analysis of differentially expressed genes was based on the STRING database. A multi-omics correlation heatmap analysis of transcriptome differential genes and differential metabolites was conducted based on the online platform Wekemo Bioincloud (see text footnote 1). The raw RNA sequencing data were deposited in the NCBI database (accession number: PRJNA1088278).
All data were expressed as mean ± standard deviation (SD) and statistical analyses were performed on GraphPad Prism 8.3.0 and SPSS 21.0. The Dunnett t-test and the Dunnett T3 test were used respectively to test chi-square and heterogeneity of variance. Non-normally distributed data were analyzed using non-parametric tests, and p < 0.05 was considered significant.
LC/MS technology was used to identify the components of TBC. Nine hundred twenty-eight compounds were identified in ESI+ and ESI− modes, with 531 compounds in the mzCloud best match achieving a comprehensive score greater than 60. Thirty-one active compounds were identified based on the Chinese Pharmacopoeia and a review of relevant literature on diabetic LEAD. These chemicals included succinic semialdehyde, D-(+)-Maltose, (2R)-2,3-Dihydroxypropanoic acid, citric acid, catechin, etc. Detailed information on identified compounds is provided in Supplementary Figure S1 and Supplementary Table S1.
To determine whether TBC is involved in HUVEC angiogenesis, high glucose induction was used for modeling endothelial injury caused by lower extremity vascular disease. Results showed that the blank control group had normal vascular structure, while the model group had a significant decrease in the average number of tubular structures. A significant increase was observed in the number of tubular structures in the TBC-containing serum high-, medium-, and low-dose groups (0.316 g/kg, 0.158 g/kg, and 0.079 g/kg) compared with that in the model group, suggesting that TBC may induce vasculature proliferation and promote HUVEC vascularization (Figures 2A–D). In high glucose-treated HUVECs, TBC improved the apoptosis rate, suggesting a protective effect against high glucose-induced apoptosis (Figures 2B,E).
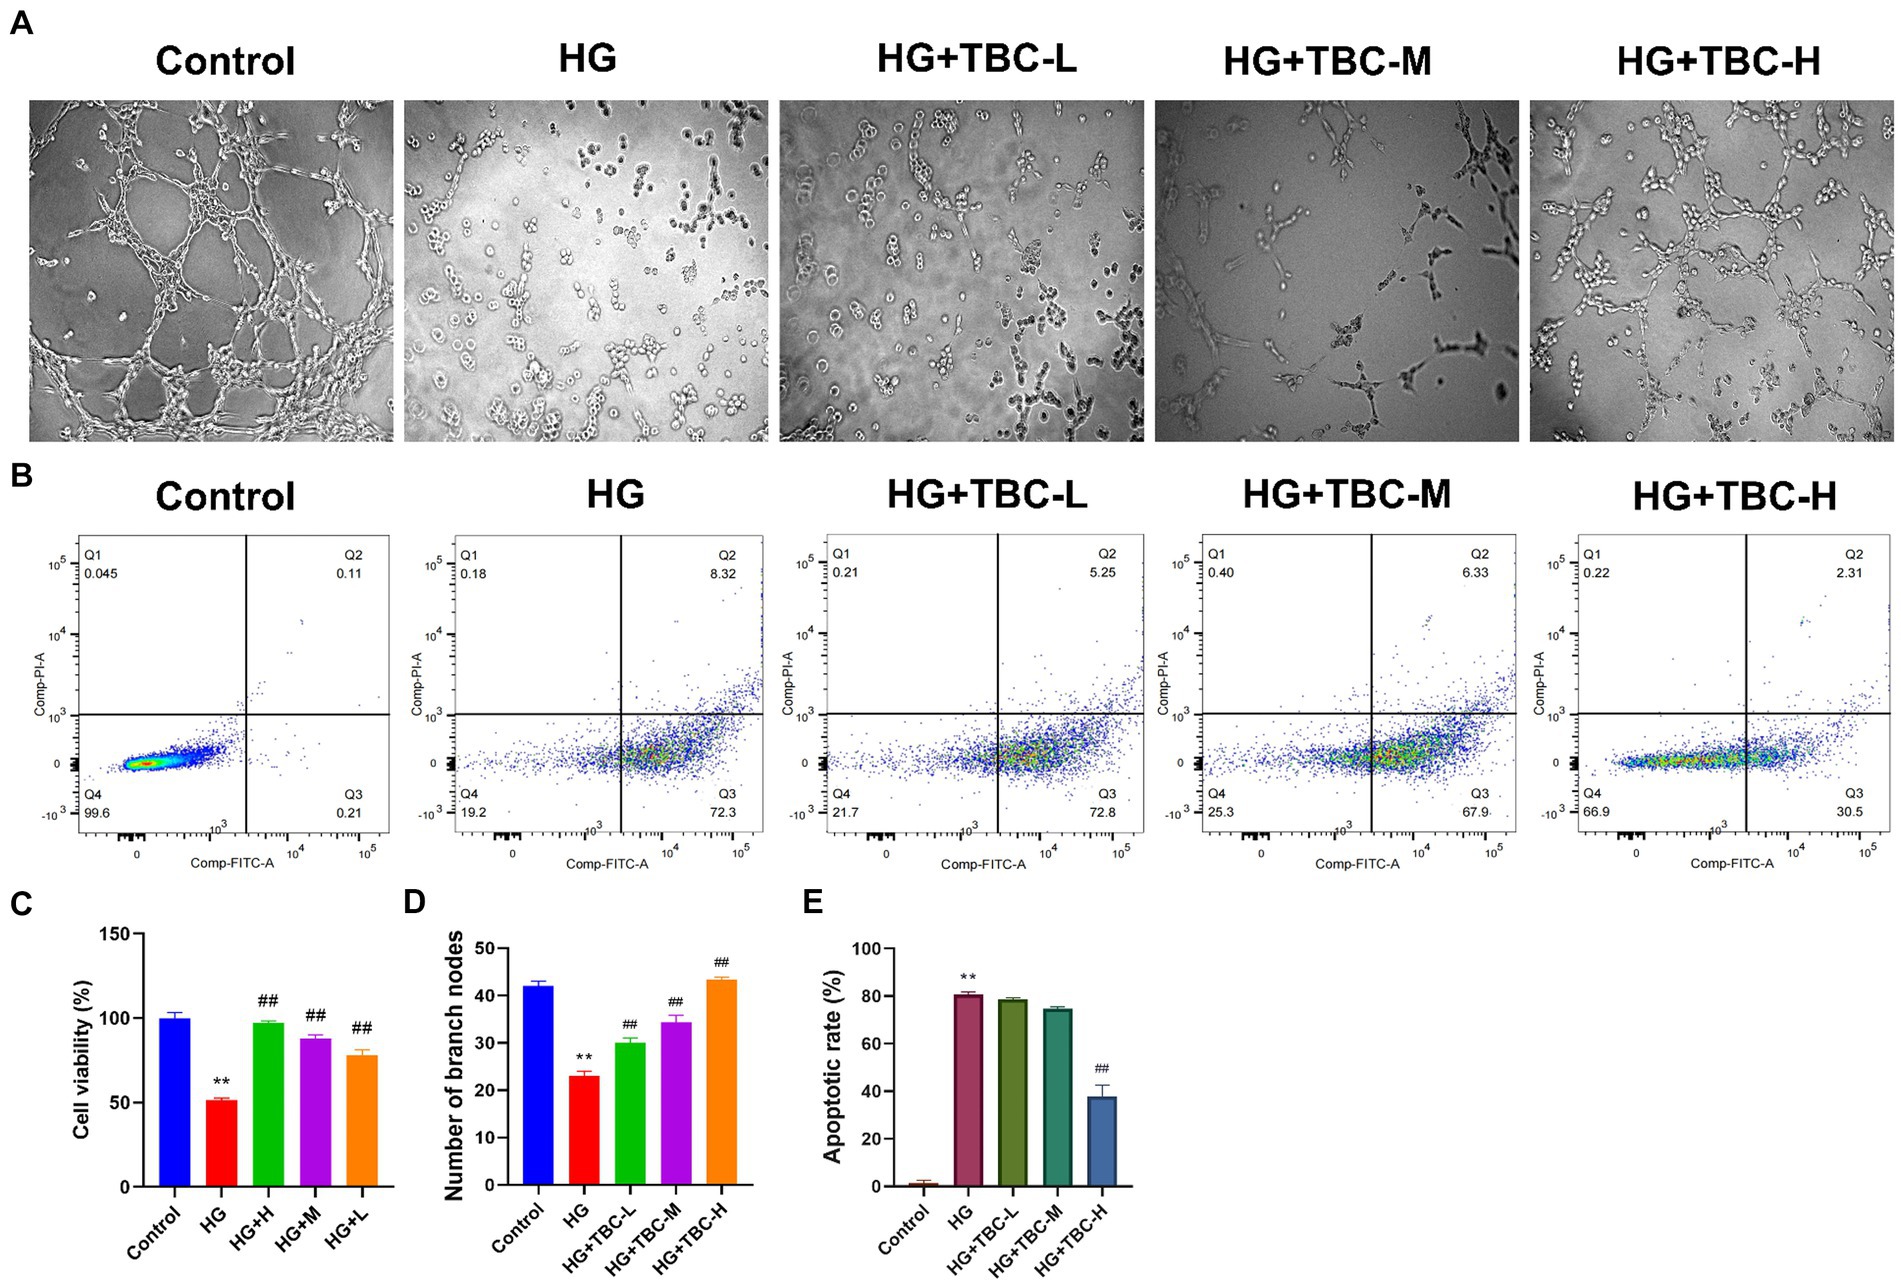
Figure 2. Effect of TBC on HUVEC angiogenesis, cell viability and apoptosis. (A) Tube-forming test of sugar paralysis capsule-containing serum. (B) Change of apoptosis of sugar paralysis capsule-containing serum by flow cytometry. (C) Viability rate of CCK8 cells. (D) Bar graph of the tube-forming test. (E) Bar graph of apoptosis. Compared with the control group, *p < 0.05 and **p < 0.01 vs. normal group. #p < 0.05 and ##p < 0.01 vs. model group.
After 24 h of TBC intervention, the Cell Counting Kit-8 (CCK-8) was used to assess the impact on HUVEC viability under high glucose conditions. The results showed that cell viability was significantly reduced to 51.39% in the high glucose-treated model group compared to the control group (p < 0.05). However, compared to the high glucose-treated model group, cell viability was elevated by 45.67% (p < 0.01), 36.38% (p < 0.01), and 26.7% (p < 0.01) in HUVECs intervened with high, medium, and low doses of TBC, respectively (Figure 2C).
Results showed that the serum ALT, AST, TG, TC, LDL-C, CR and GLU levels in the model group were significantly higher than those in the blank group, while NO levels were significantly lower than those in the blank group. After 6 weeks of intervention, the levels of ALT, AST, TG, TC, LDL-C, and CR were significantly reduced, as were the inflammatory factors IL-6, TNFα, and IL-1β. However, NO levels were significantly elevated. There was no significant change in serum GLU levels (Figure 3). In addition, HE staining of femoral artery tissue sections showed that the femoral artery wall was not thickened in the normal group, with no plaque formation or detachment. In the model group, there was plaque accumulation in the arterial wall, marked thickening of the vessel wall, disorganized cell arrangement, and marked intimal hyperplasia. There was slight arterial wall thickening in the low-dose group of TBC, and the cell arrangement was poor. There were no necrotic cells in the middle-dose group of TBC, and the proliferative fibrous tissues were improved. There were no necrotic cells in the high-dose group of TBC and the group of cilostazol, and the cells were neatly arranged and structurally intact (Figure 4A). In addition, diabetic lower extremity blood flow was significantly increased in the cilostazol, TBC-H, TBC-M, and TBC-L groups compared with the model group (Figure 4B).
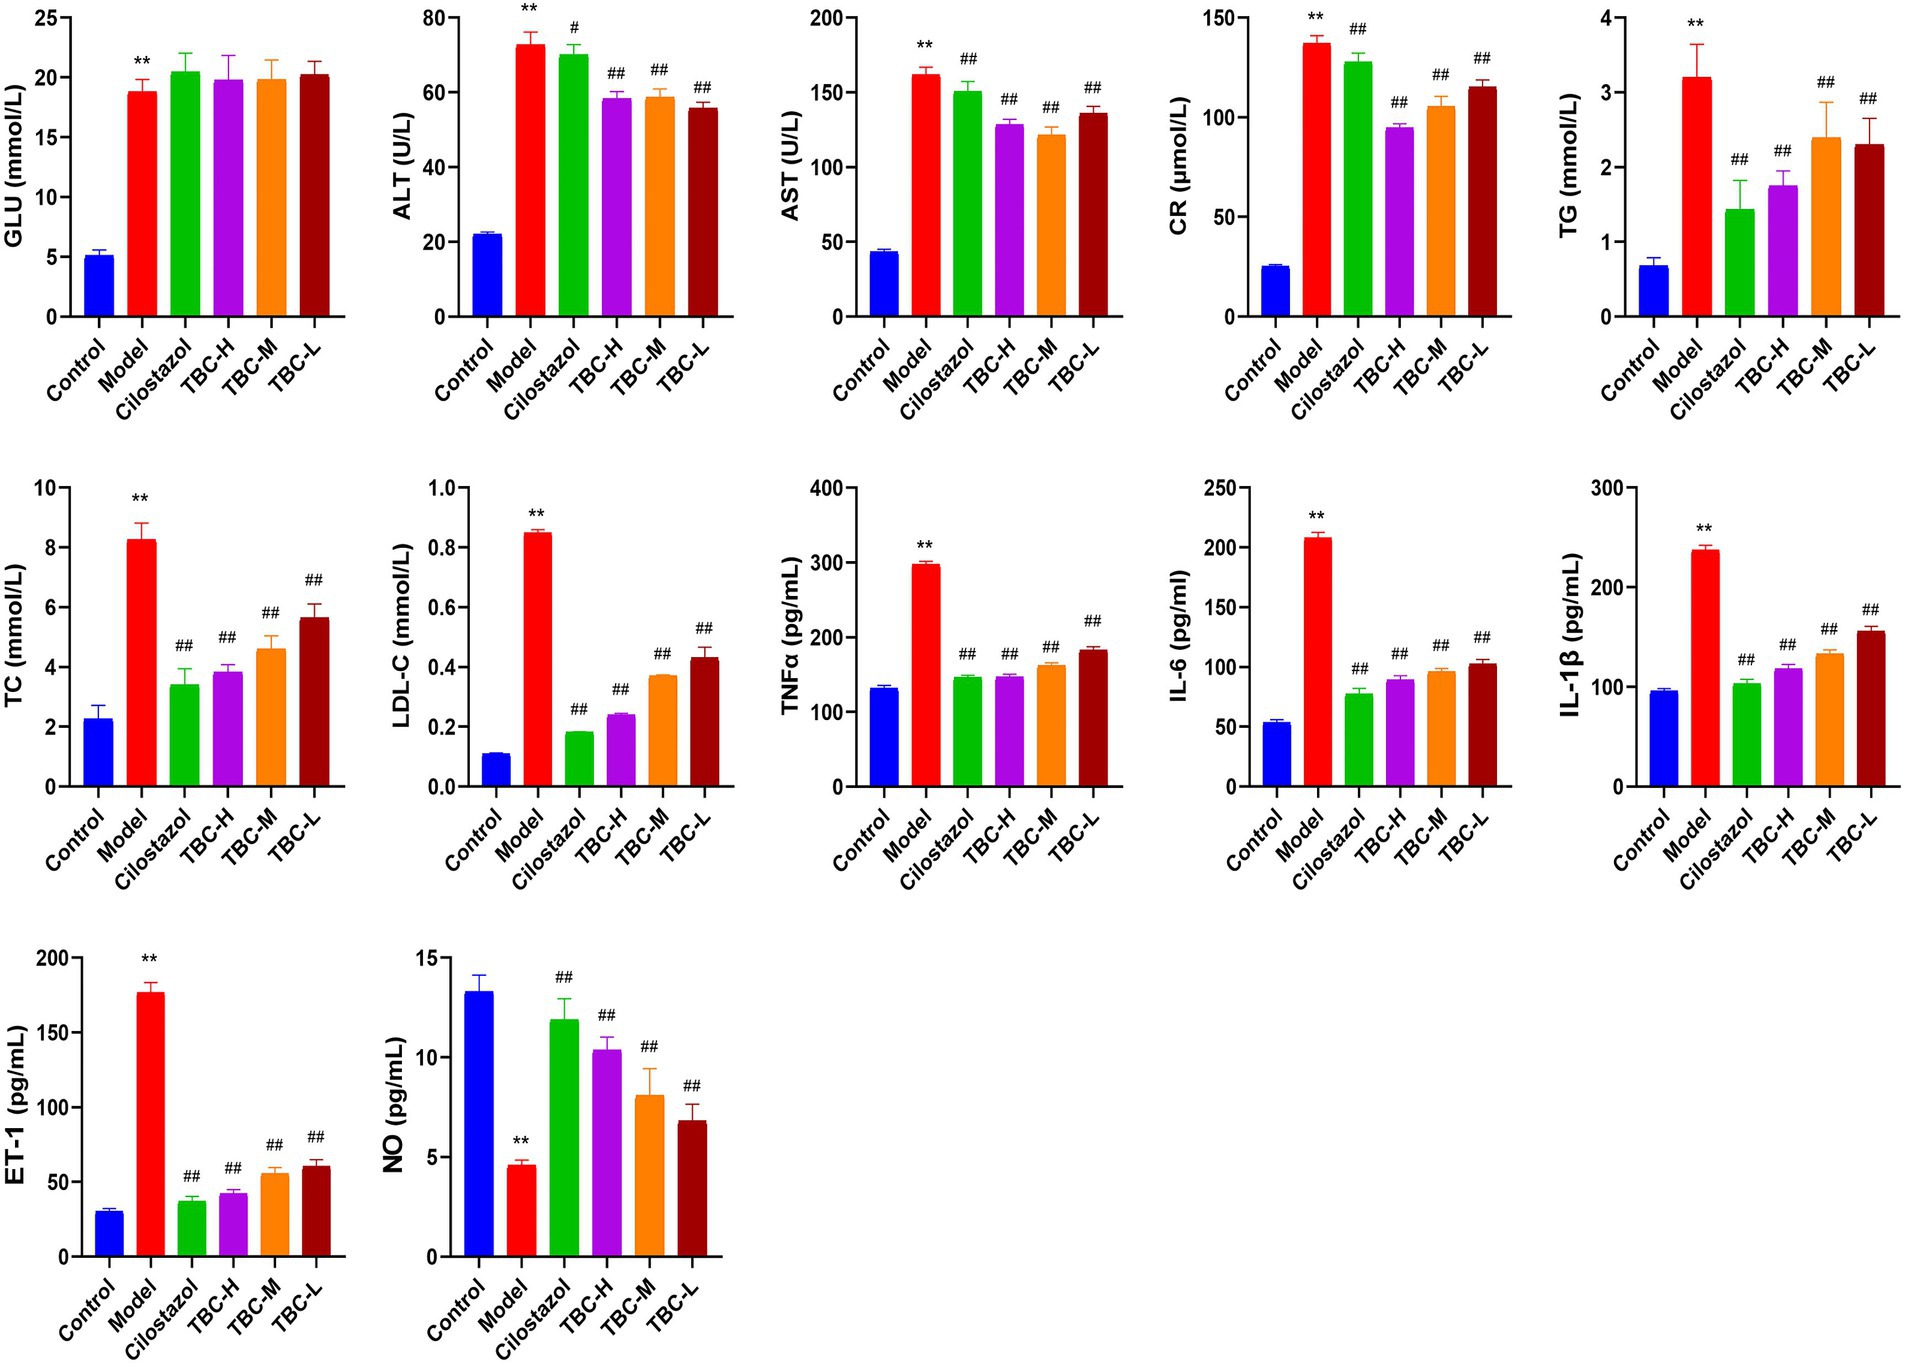
Figure 3. Effect of TBC on biochemical and inflammatory indices in rats with diabetic lower limb vasculopathy. *p < 0.05 and **p < 0.01 vs. normal group. #p < 0.05 and ##p < 0.01 vs. model group.
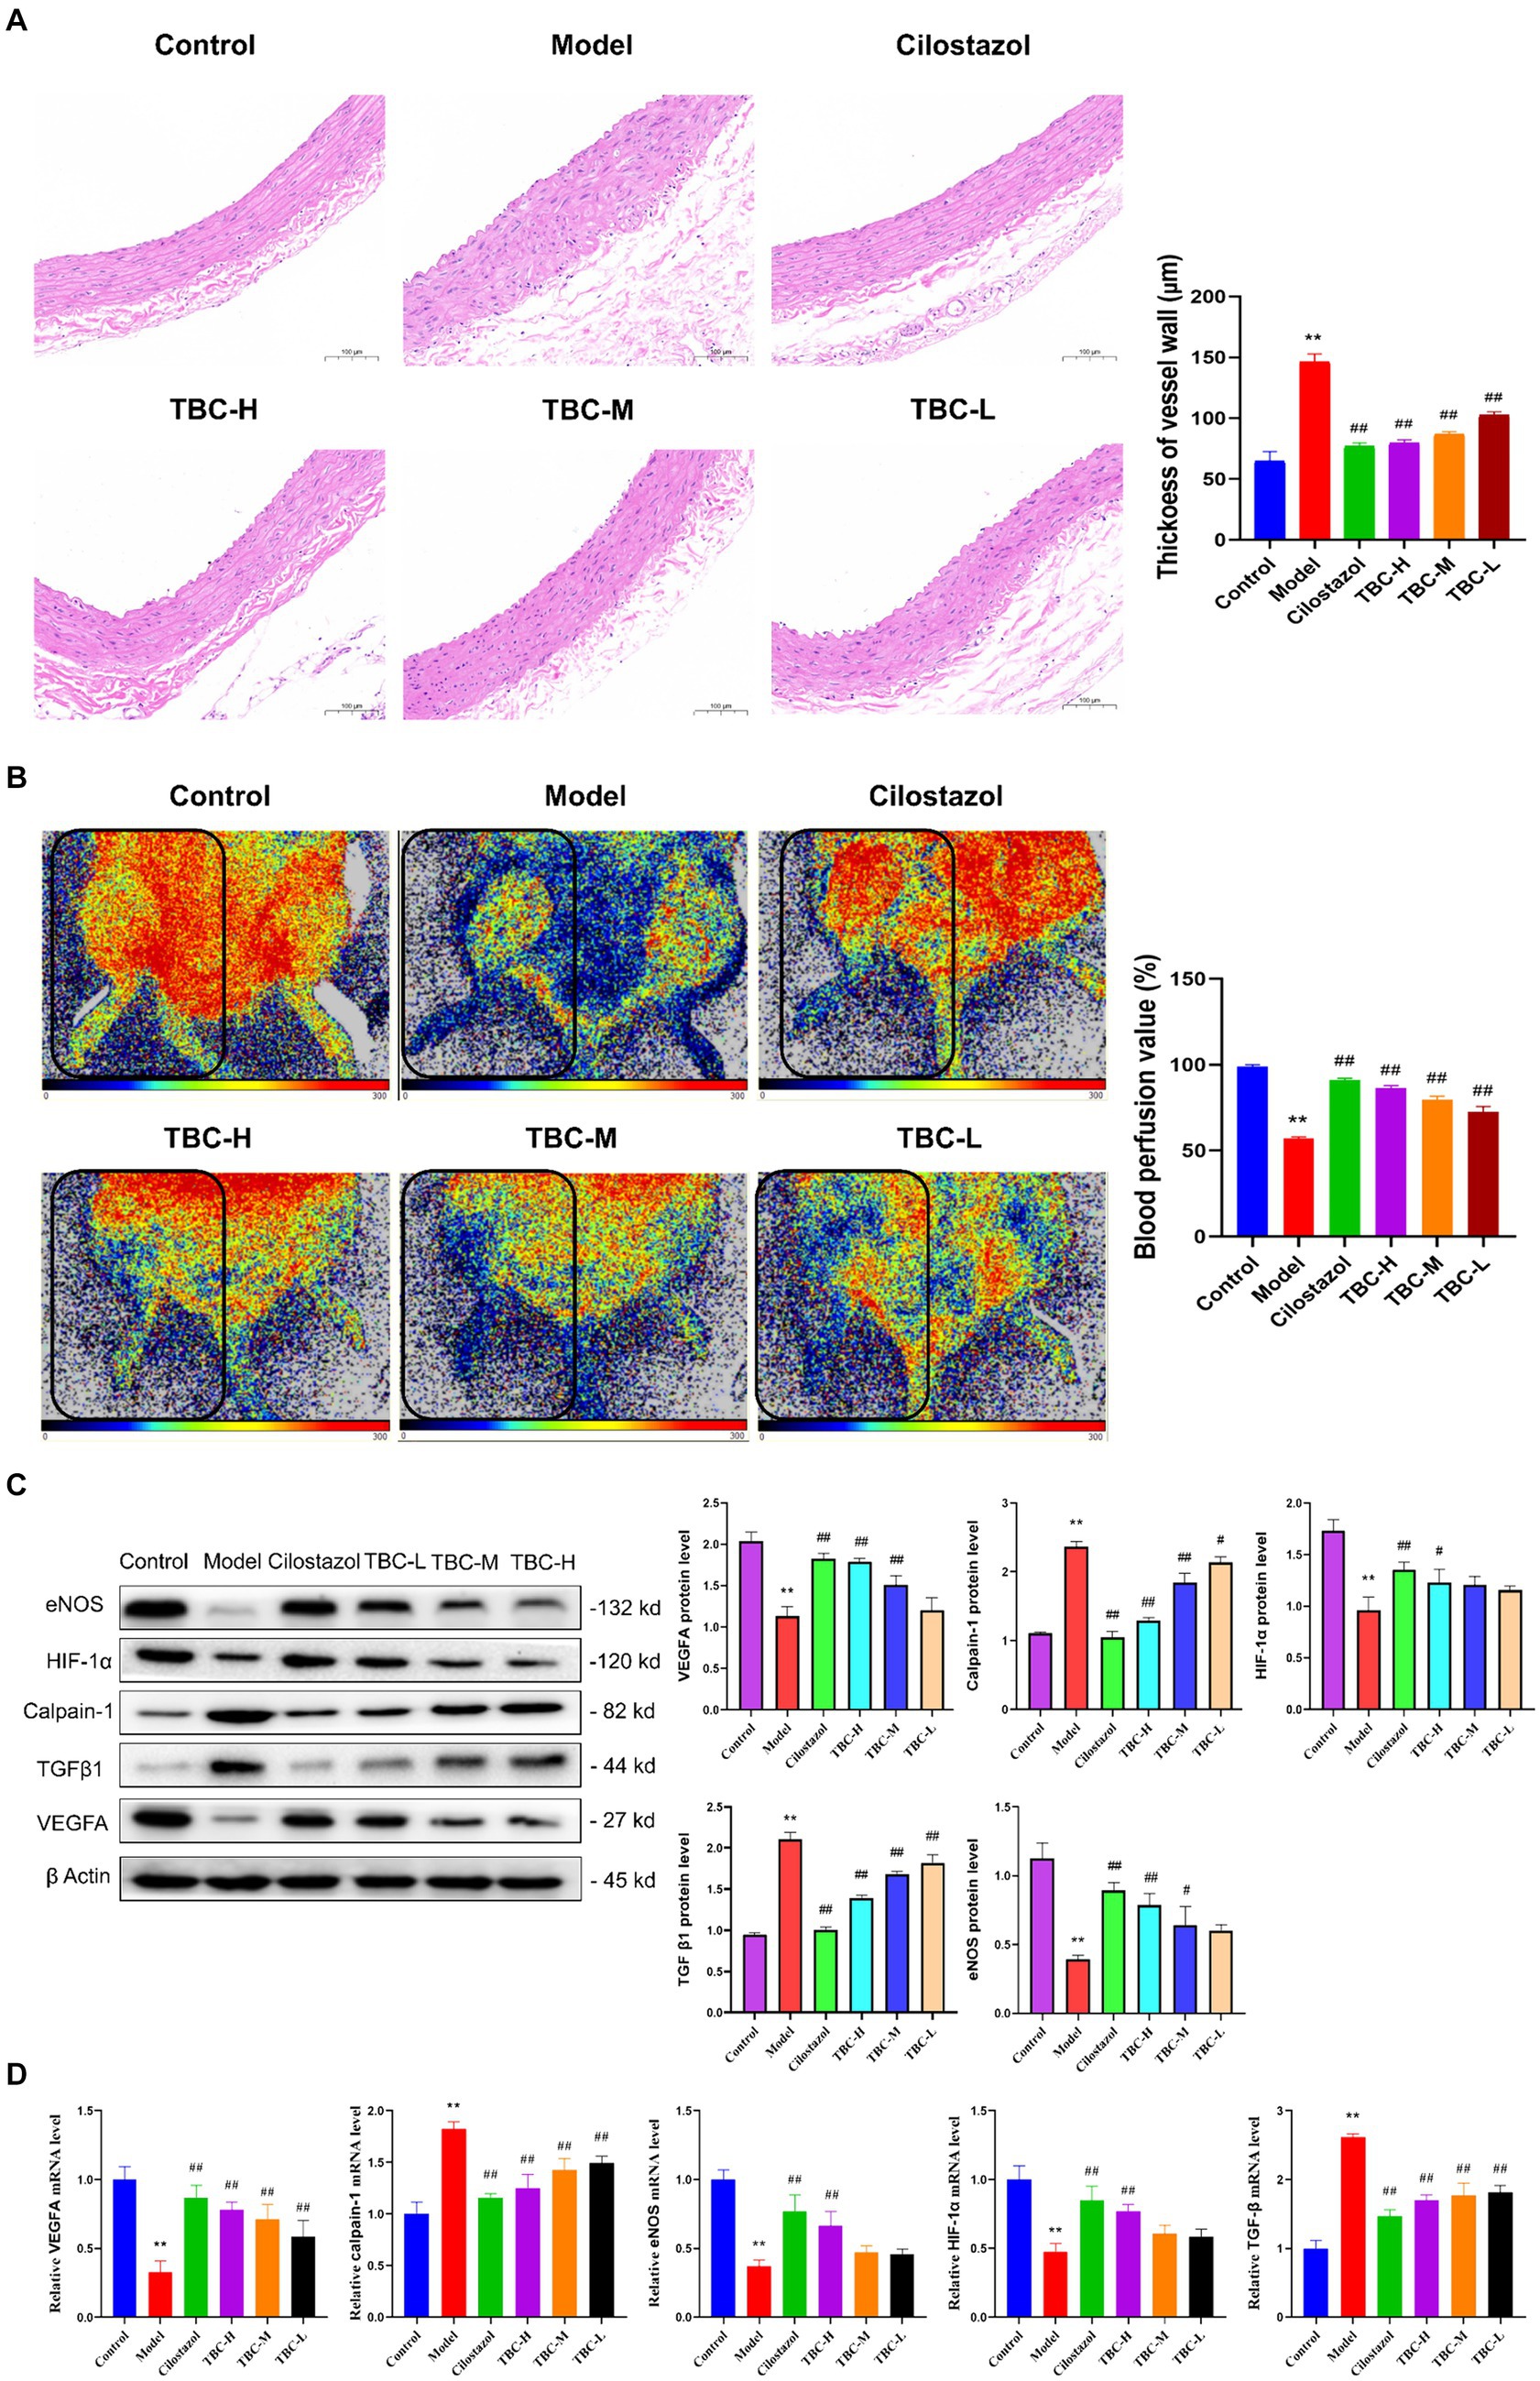
Figure 4. Effect of TBC on histopathology, perfusion volume and related factors in diabetic LEAD rats. (A) Pathologic histogram. (B) Perfusion after treatment. (C) Protein expression. (D) Gene expression levels. *p < 0.05 and **p < 0.01 vs. normal group. #p < 0.05 and ##p < 0.01 vs. model group.
To further explore the effects of TBC on diabetic LEAD rats, Western blot and PCR were used to detect the levels of related proteins and gene expression in the lower extremity femoral artery tissue. The results showed that after 6 weeks, the expression levels of HIF-1α, eNOS, VEGFA proteins and genes were significantly increased in the TBC-H, TBC-M, TBC-L, and positive control groups compared with the model group, but calpain-1 and TGFβ were significantly decreased (Figures 4C,D).
These results suggest that TBC improves vascular injury and promotes blood flow recovery in diabetic LEAD rats.
Both animal and cellular results showed that the TBC high-dose group was more effective than the medium and low-dose groups in a concentration-dependent manner. To further explore the mechanism of TBC in the treatment of diabetic lower extremity arterial disease, the blank group, model group, and TBC-H (8 samples in each group) group were selected for metabolomic analysis of serum through an untargeted metabolomics approach. PCA modeling was used to obtain data overview, detect outliers, and evaluate metabolomic differences. The PCA score plot in positive and negative ion mode showed a clear trend of separation in the blank group and the model group, indicating that the metabolites were significantly disturbed. 6-week TBC treatment was significantly separated from the model group, suggesting that TBC altered the metabolic status of diabetic lower extremity arterial disease (Figures 5A,B). An OPLS-DA model was constructed to investigate differential metabolites. One thousand substitution tests yielded intercept values of R2 = 0.998 and Q2 = −0.966 in the positive ion mode and R2 = 0.988 and Q2 = 0.952 in the negative ion mode, indicating that the model had significant discriminative and predictive capability. (Figures 5C–F). Comparison of metabolite composition structures between subgroups showed that there were mainly 1-Palmitoyl-Sn-Glycero-3-Phosphocholine, Lysopc (18:2, 20:4, 18:3), L-Norleucine, Betaine, L-Phenylalanine dominant compounds (Figure 5G) in the positive ion mode, and Lysopc (16:0, 18:0, 20:4, 18:1, 17:0), LysoPE 18:0 and Arachidonic acid dominant compounds in the negative ion mode (Figure 5H). The biological functions of these metabolites were mainly related to peptides, nucleic acids, steroids, vitamins and cofactors, organic acids, and lipids (Figures 5I,J). To observe the distribution of metabolites in each sample, a heat map of top 30 relative metabolites was generated, and it was found that the samples in different subgroups clustered to different positions, indicating that significant differences in the metabolite compositions of the three groups, and significant structural alterations in some of the metabolite compositions (Figures 5K,L).
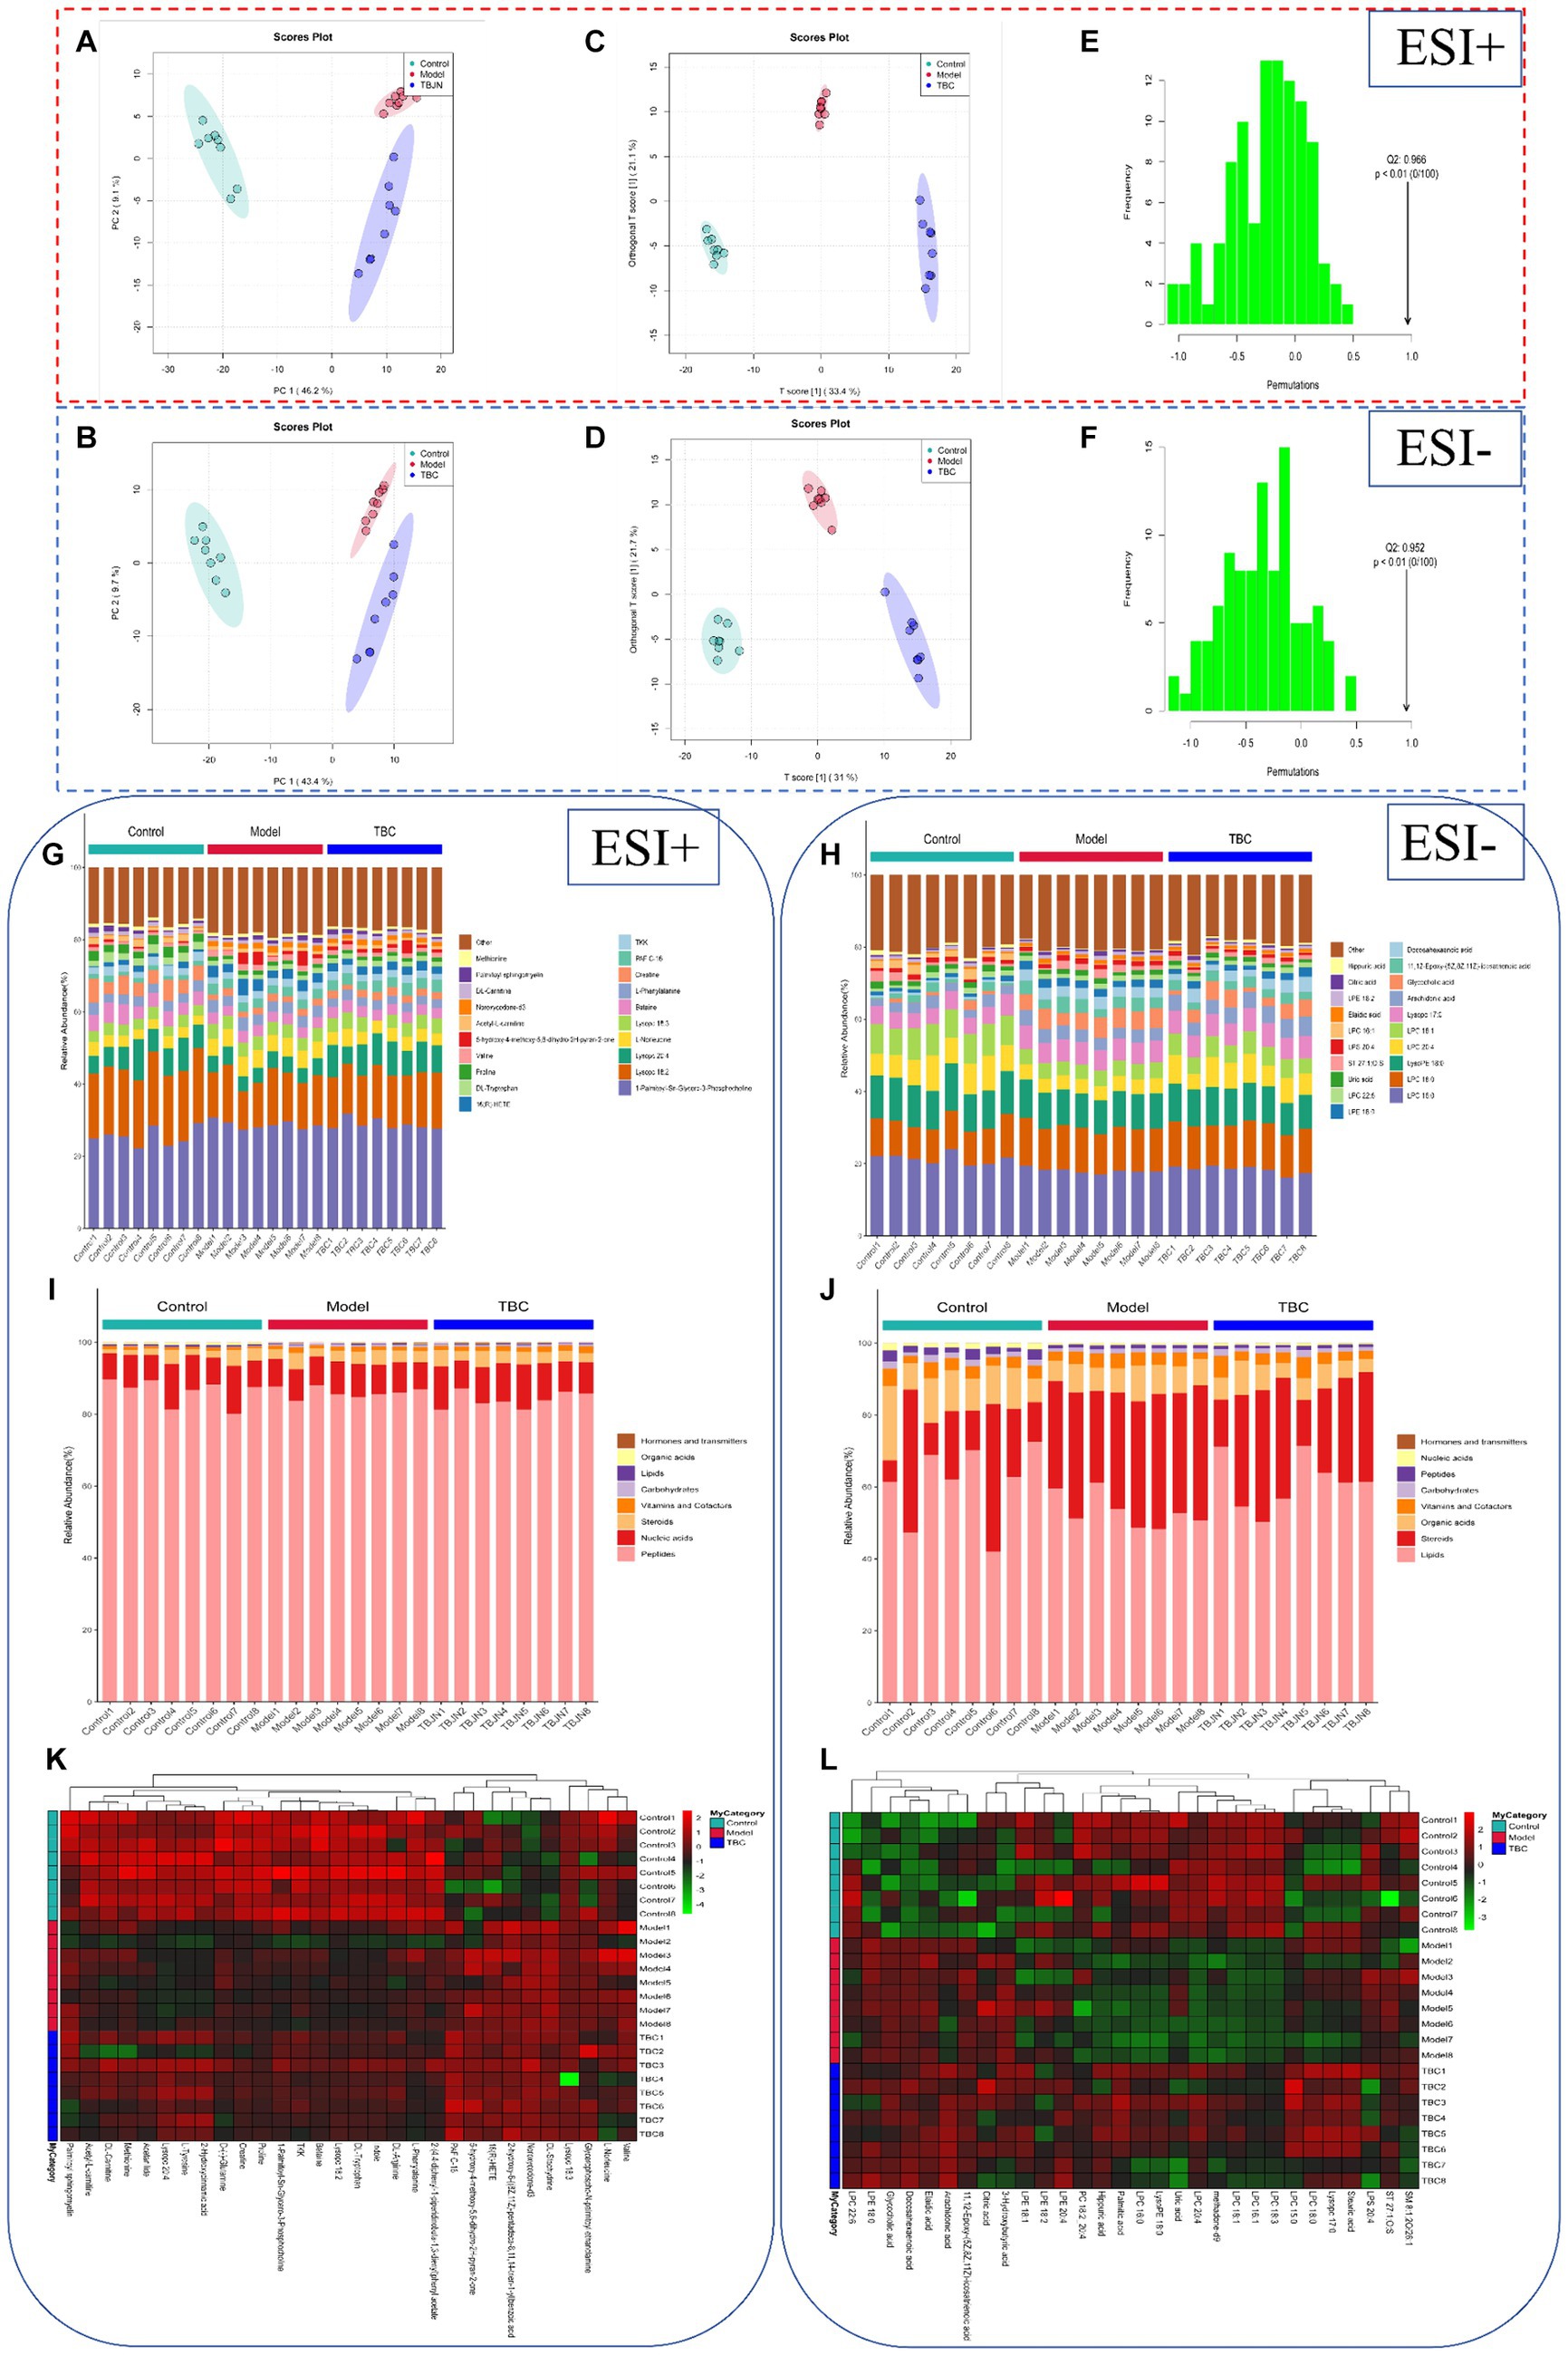
Figure 5. Effect of TBC on serum metabolomic profiles in diabetic LEAD rats. (A,B) Establishment of the principal component analysis score plot based on the metabolites of serum in the control, model, and TBC groups (student’s t-test, p < 0.05, FC >1.0). (A) Positive ion. (B) Negative ion. (C,D) In situ partial least squares discriminant analysis scoring plots. (C) Positive ion. (D) Negative ion. (E,F) Alignment test for OPLS-DA scoring plots. (E) Positive ion. (F) Positive ion. Positive-negative ion mode: (G,H) top 20 metabolite percentage stacked histograms. (I,J) Metabolite percentage stacked histograms that play biological roles. (K,L) Metabolite heat map clustering results.
Volcano plots, and metabolite importance plots were constructed to better capture the metabolic changes. Volcano plots showed the trends of differential metabolite expression between the control group and the model group and between the model group and TBC group (Figures 6A,B). The metabolite importance plots showed the trends of differential metabolite expression in the positive and negative modes (Figures 6C,D), with compounds meeting the conditions of VIP >1, p < 0.05, FC ≥1 condition considered differential metabolites. To visualize the differences in metabolites between groups, box plots of the top-ranked representative differential metabolites were constructed (Figures 6E,F). In both negative and positive ion modes, a total of 472 dysregulated metabolites were identified in the model group compared with the control group, with 202 metabolites up-regulated and 270 down-regulated compared. Eighty-seven dysregulated metabolites were identified in the TBC group compared with the model group, with 49 metabolites up-regulated and 38 metabolites down-regulated (Figures 7A,B). Based on the metabolites shared in the Con, model, and TBC groups, TBC intervention in diabetic LEAD mainly regulated LPC 20:3, Dl-Indole-3-lactic acid, Deoxycholic acid, Tetranor-12R-HETE, Prostaglandin D2, Ergosta-5,7,9(11),22-Tetraen-3-beta-Ol, Ouabain glutathione disulfide, LNH, Cytidine 5′-Monophosphate-N-Acetylneuraminic Acid and 59 other differential metabolites (Table 2). Significant differential metabolites were selected and overrepresentation analysis (ORA) was used to identify KEGG pathways significantly enriched in these metabolites and to measure topological effects. The results showed that differential metabolites between control and model groups were associated with pathways such as phenylalanine, tyrosine, and tryptophan biosynthesis, taurine and hypotaurine metabolism, riboflavin metabolism, phenylalanine metabolism, nucleotide metabolism, and arginine biosynthesis (Figures 7C,D). After TBC intervention, TBC restored arginine biosynthesis, phenylalanine metabolism, pyrimidine metabolism, arachidonic acid metabolism, and nucleotide metabolism. Vitamin B6 metabolism pathway was also regulated (Figures 7E,F).
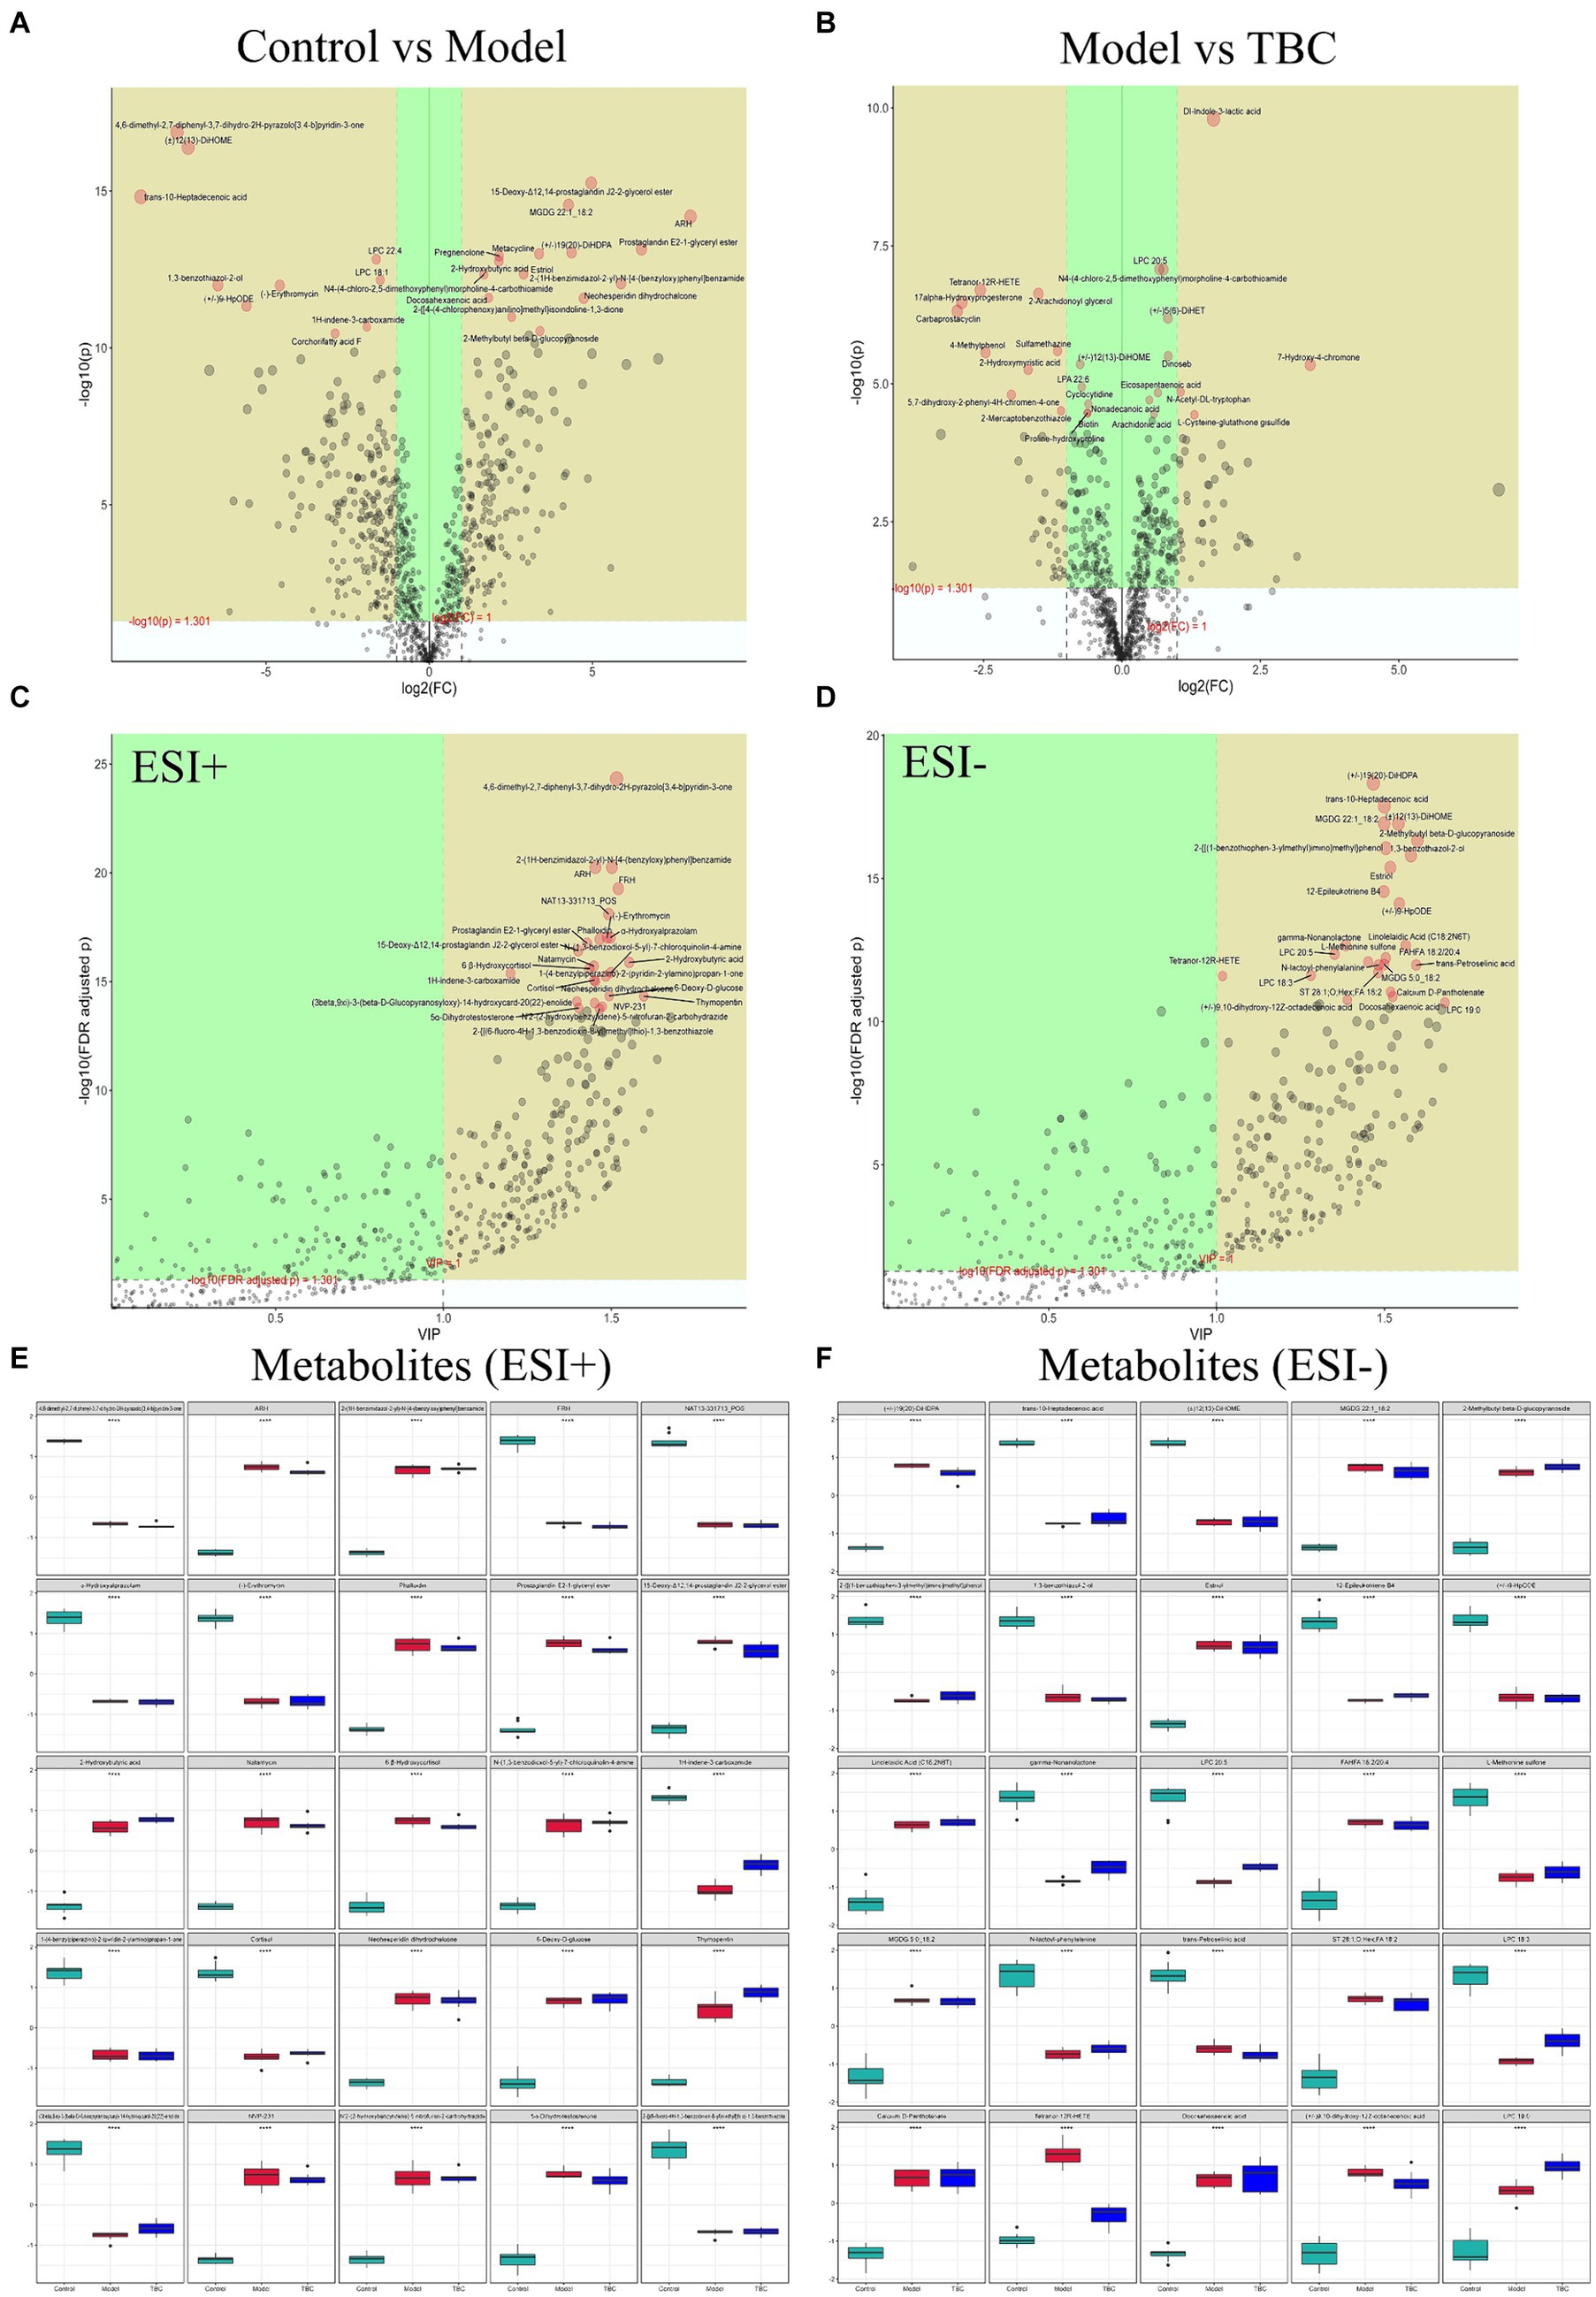
Figure 6. Screening of TBC for differential metabolites in diabetic LEAD rats. Positive and negative ion mode: (A) Volcano plot of differential metabolite changes in model and control groups. (B) Volcano plots of differential metabolite changes in TBC and model groups. (C,D) PLS-DA metabolite significance plots. (C) Positive ion. (D) Negative ion. (E,F) Metabolite difference box plots. (E) Positive ion. (F) Negative ion.
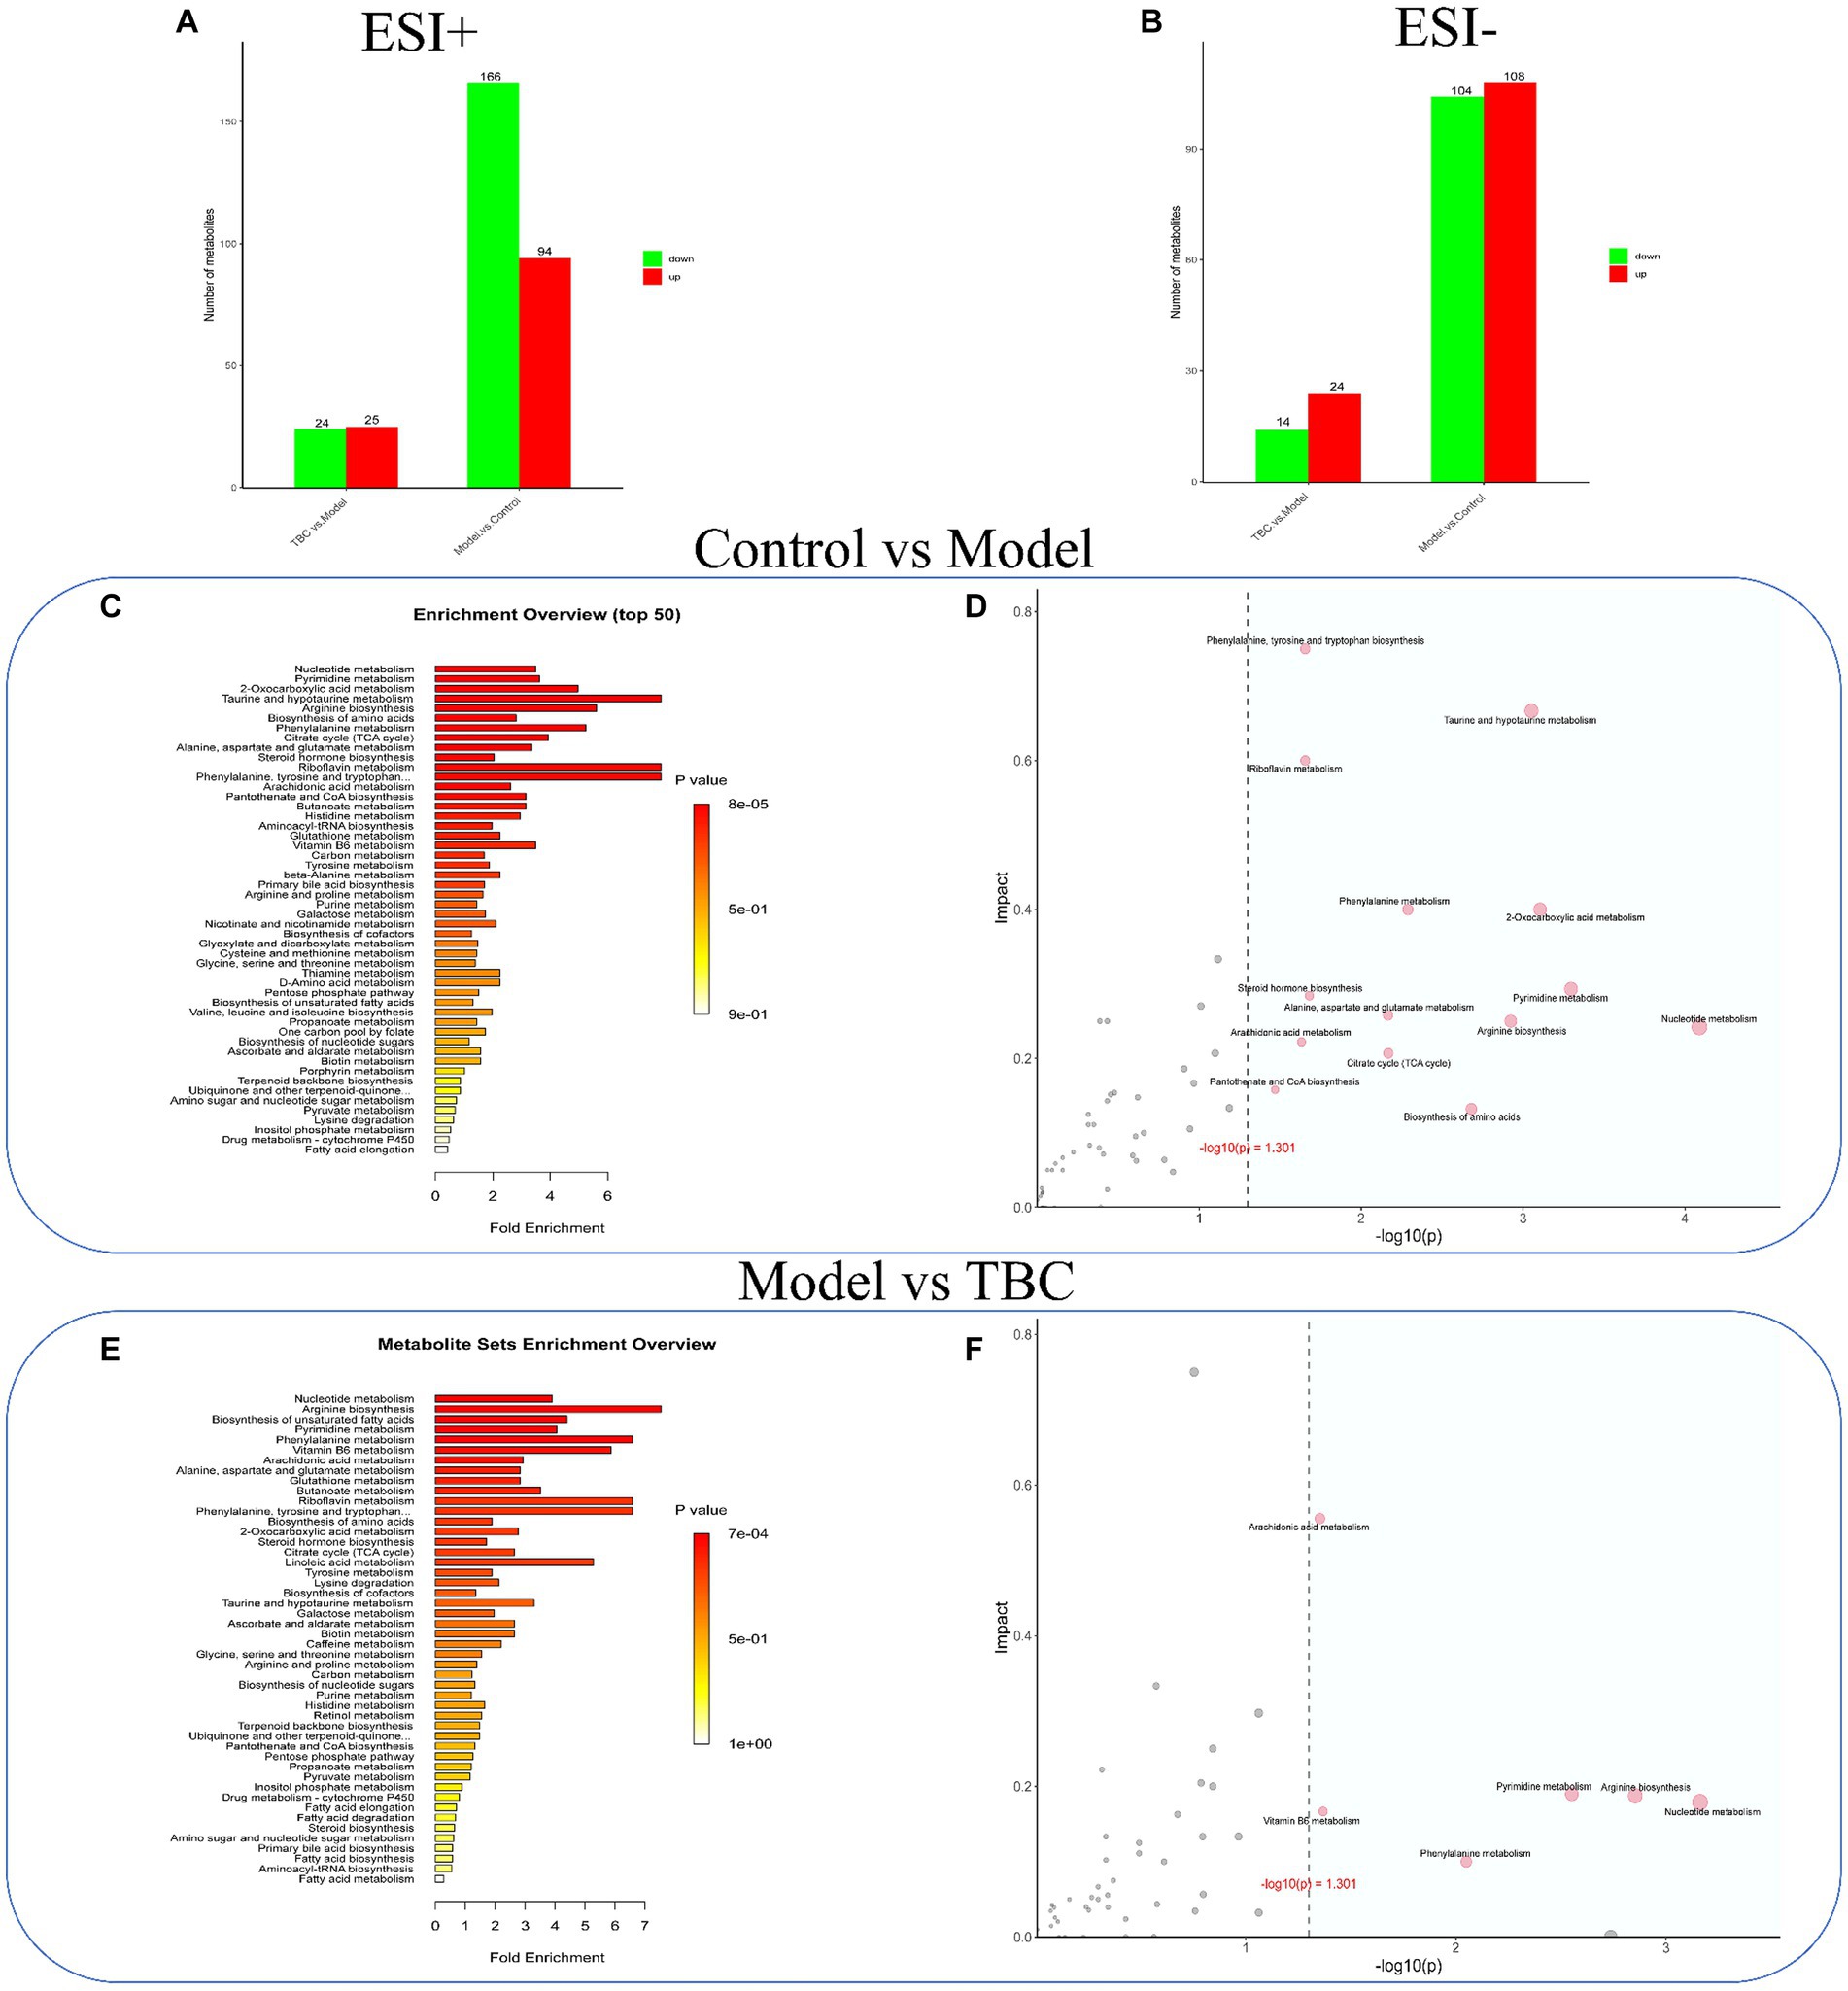
Figure 7. Effect of TBC on serum metabolic pathways in diabetic LEAD rats. Positive and negative ion modes: (A,B) Number and trend of metabolites regulated by TBC. (A) Positive ion. (B) Negative ion. (C,D) Metabolic pathway analyses of KEGG-enriched differential serum metabolites in model and control groups (p < 0.05). (E,F) Metabolic pathway analysis of KEGG-enriched differential serum metabolites in TBC and model groups (p < 0.05).

Table 2. Differential metabolites in serum samples in positive and negative ion modes.
To explore the potential mechanism of TBC treatment in diabetic LEAD rats, a transcriptomic analysis of whole blood was conducted. The TBC-H group was selected as a representative of the TBC intervention group for transcriptomic analysis. PCA score plot showed clear separation between the three groups, with the TBC group showing a trend to recovery compared with the control group, suggesting that there was a significant alteration in the whole blood transcriptome of the TBC-intervened diabetic LEAD rats (Figure 8A). The genes with a Q value ≤0.05 and |fold change| >1 were considered differentially expressed genes. The results showed that a total of 3,249 DEGs were identified in the model group compared with the control group, of which 1,805 genes were up-regulated and 1,444 genes were down-regulated. Forty-seven DEGs were detected in the TBC group compared with the model group, of which 25 were up-regulated and 22 were down-regulated (Figure 8B). The Venn diagram displayed 2,267 overlapping genes, among which 29 significantly up-or down-regulated genes in the model group were significantly restored by the TBC intervention (Figure 8C). The volcano plot captured the overall trend change in the number of DEGs in each group (Figure 8D). To clearly observe the changes in the differential genes in each group, the heatmap of the top 25 DEGs with the lowest Q values reversed by TBC treatment was drawn (Figure 8E). The DEGs were considered potential therapeutic targets of TBC in this study. Further KEGG pathway enrichment analysis and Gene Ontology (GO) analysis were performed on all DEGs. Compared with the control group, the model group mainly regulate the signaling pathways associated with human infectious diseases (coronavirus disease - COVID-19, tuberculosis, leishmaniasis, salmonella infection), immune regulation and inflammatory responses (NOD-like receptor signaling pathway, Toll-like receptor signaling pathway, HIF-1 signaling pathway, NF-kappa B signaling pathway), cell activation and synthesis processes (osteoclast differentiation, hematopoietic cell lineage), apoptosis, lipid and atherosclerosis-related (Figure 8F), involving various biosynthetic processes such as angiogenesis, immune-inflammatory response and cell growth (Figure 8G). Compared with the model group, the TBC intervention group was primarily involved in immunomodulation (antigen processing and presentation, intestinal immune network for IgA production), immune cell differentiation (Th1 and Th2 cell differentiation, Th17 cell differentiation, hematopoietic cell lineage), type I diabetes mellitus, and immune-related diseases (human T-cell leukemia virus 1 infection, systemic lupus erythematosus, rheumatoid arthritis, and autoimmune thyroid disease) (Figure 8H). Additionally, GO analysis showed that immune regulation, inflammatory response, and cell differentiation were significantly enriched in biological processes after TBC intervention, suggesting that TBC mainly treats diabetic LEAD rats by attenuating inflammatory response, promoting angiogenesis, and modulating immune response (Figure 8I).
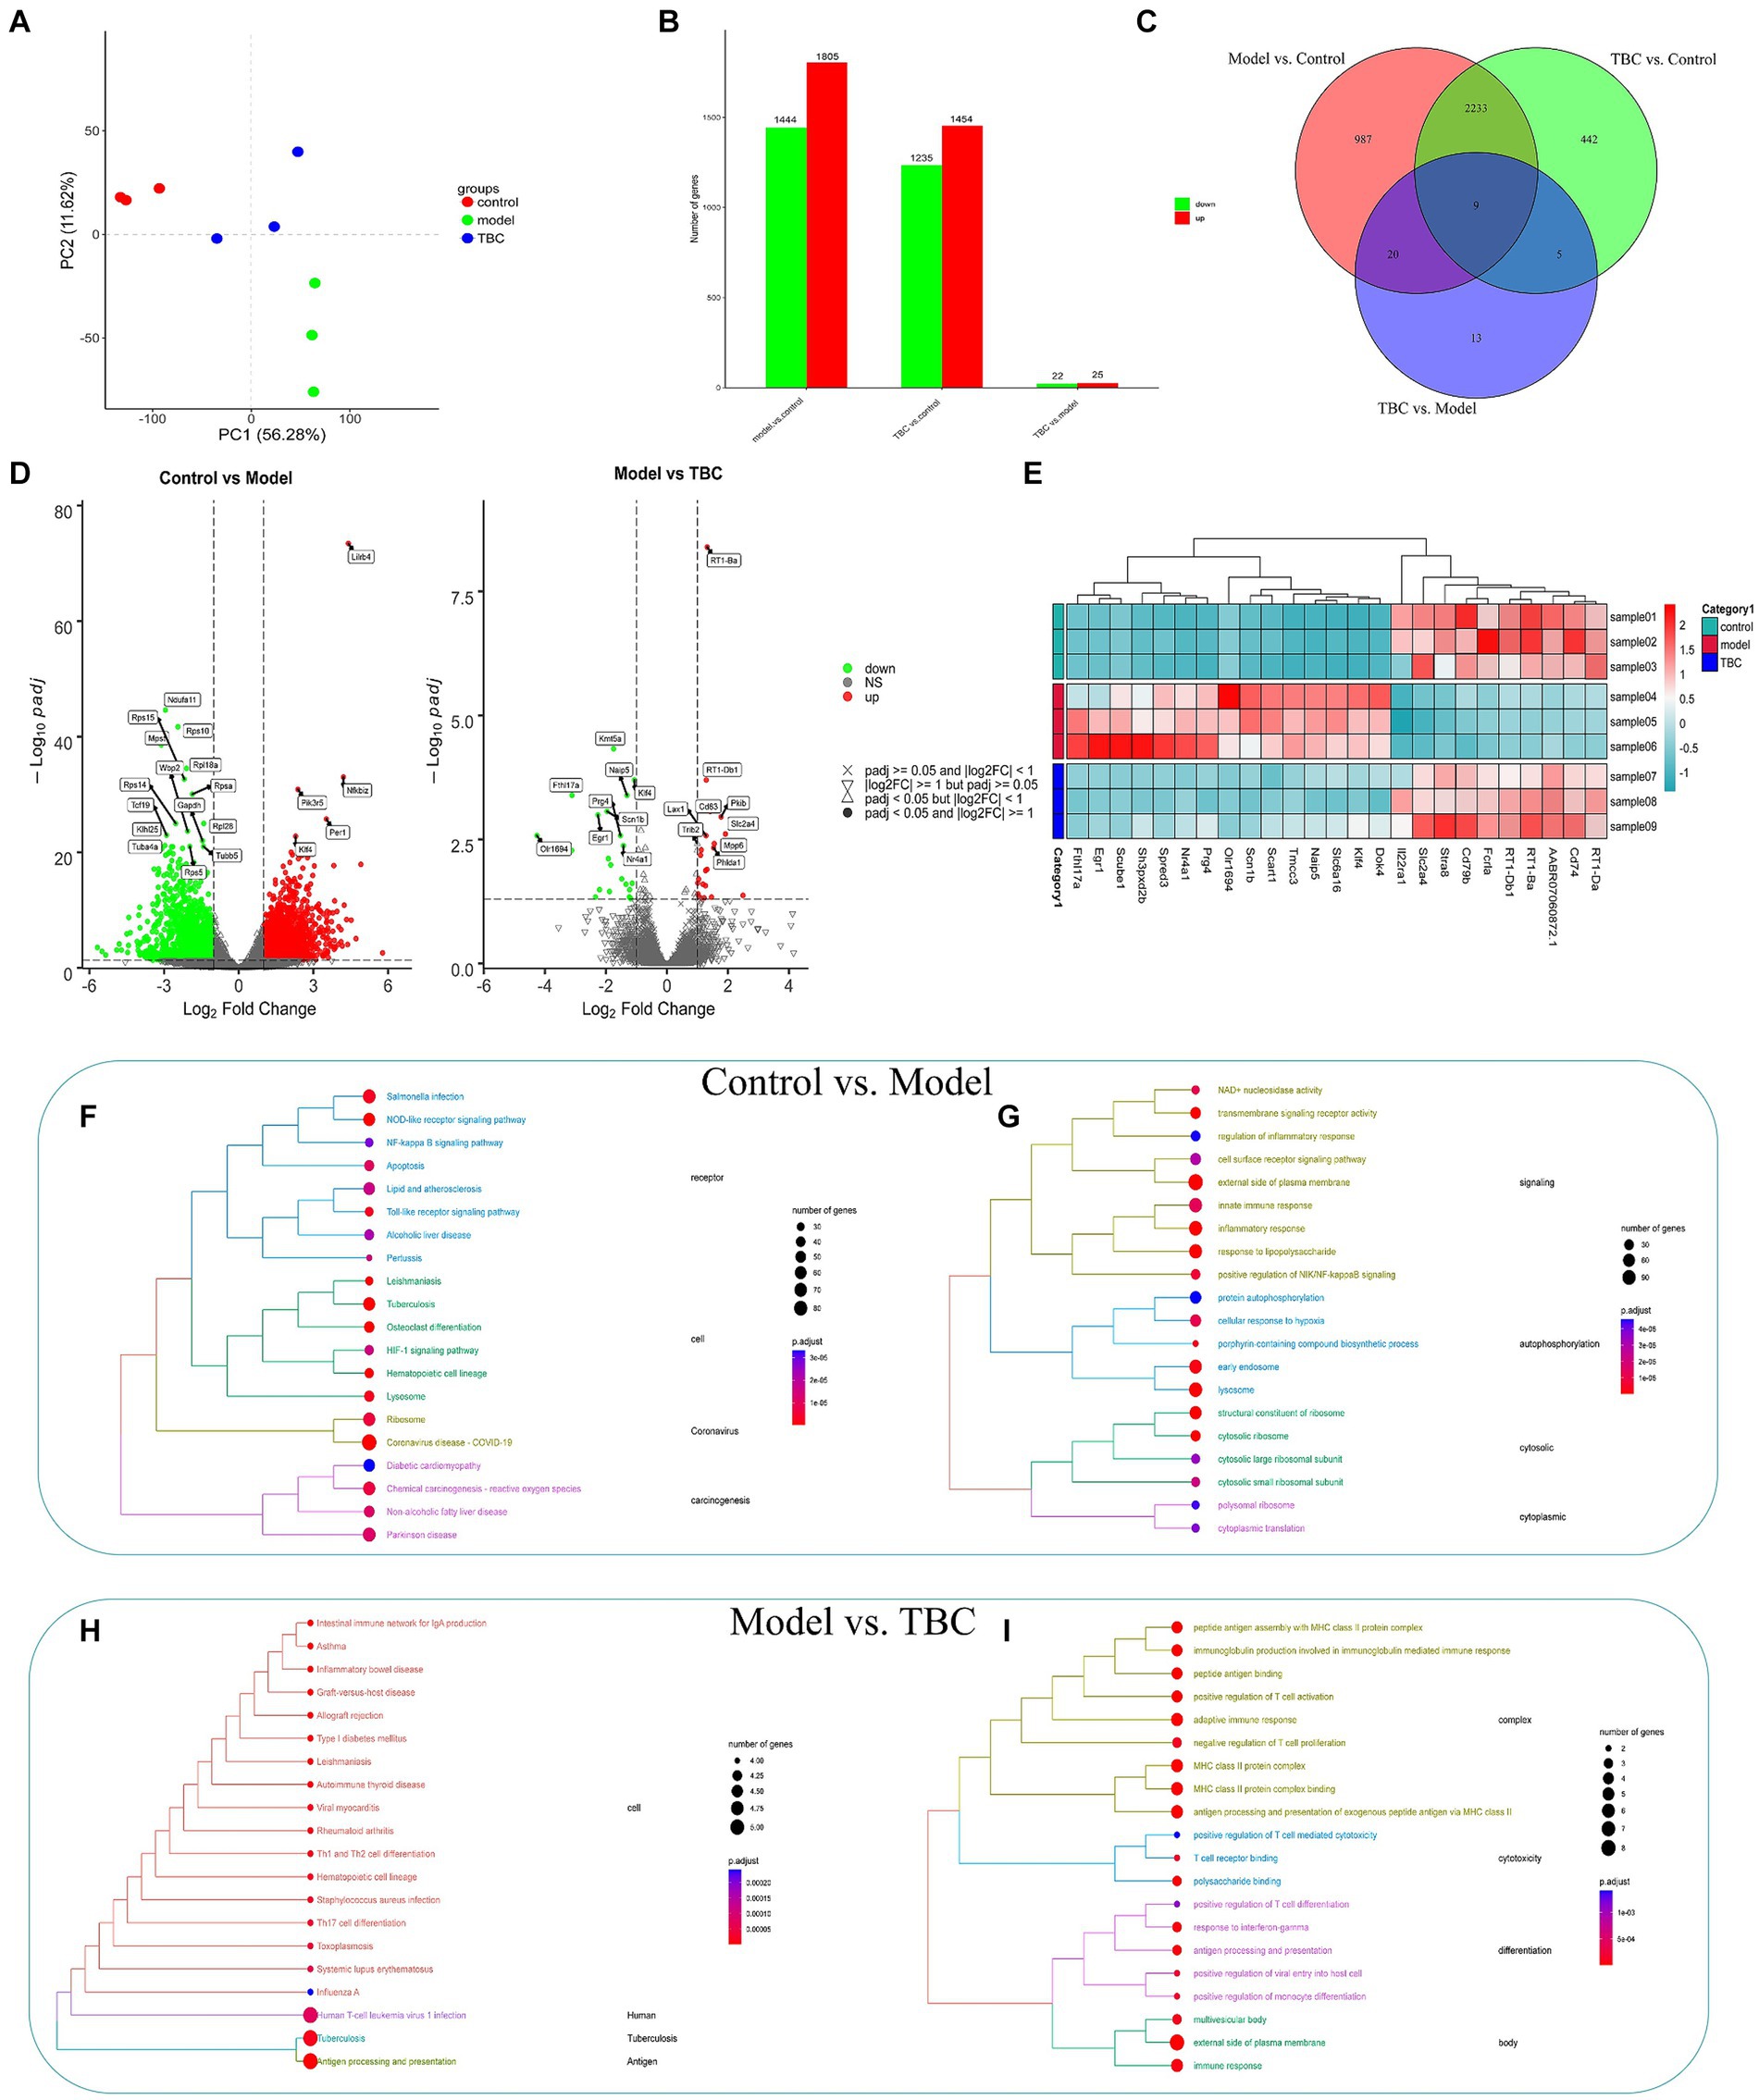
Figure 8. Effect of TBC on whole blood transcriptomics in diabetic LEAD rats. (A) Results of principal component analysis. (B,C) Number of TBC-regulated genes and number of intersections. (D) Differential gene volcano map. (E) Differential gene heat map. (F,G) KEGG and GO enrichment analysis of DEG in Model and Control groups (p < 0.05). (F) KEGG analysis. (G) GO enrichment analysis. (H,I) KEGG and GO enrichment analysis of DEG in TBC and model groups (p < 0.05). (H) KEGG analysis. (I) GO enrichment analysis.
Correlation heatmap analysis was performed based on relevant differential metabolites in the positive-negative ion model of metabolomics and the top 25 DEGs of potential reversal value in transcriptomics of diabetic LEAD rats with TBC intervention. The results showed that among the metabolites in positive ion mode, 2-Arachidonoyl glycerol showed a strong positive correlation with genes such as Dok4, Klf4, Naip5, Slc6a16, Scn1b, Tmcc3, and Spred3 (p < 0.01). Levothyroxine showed a strong positive correlation with Cd79b, RT1-Da, Fcrla, and Cd74 (p < 0.01). Epigallocatechin and L-Glutathione oxidized showed a strong positive correlation with Slc2a4 and Stra8 (p < 0.01), and 3-Methoxy prostaglandin F1α, Lysopc 20:0 showed a strong positive correlation with genes such as Slc2a4, Stra8, RT1-Db1 and RT1-Ba (p < 0.01). Naringin dihydrochalcone was in a strong negative correlation with genes such as Scube1 (p < 0.01). 5,7-dihydroxy-2-phenyl-4H-chromen-4-one was in strong negative correlation with Stra8 (p < 0.01) (Figure 9A).
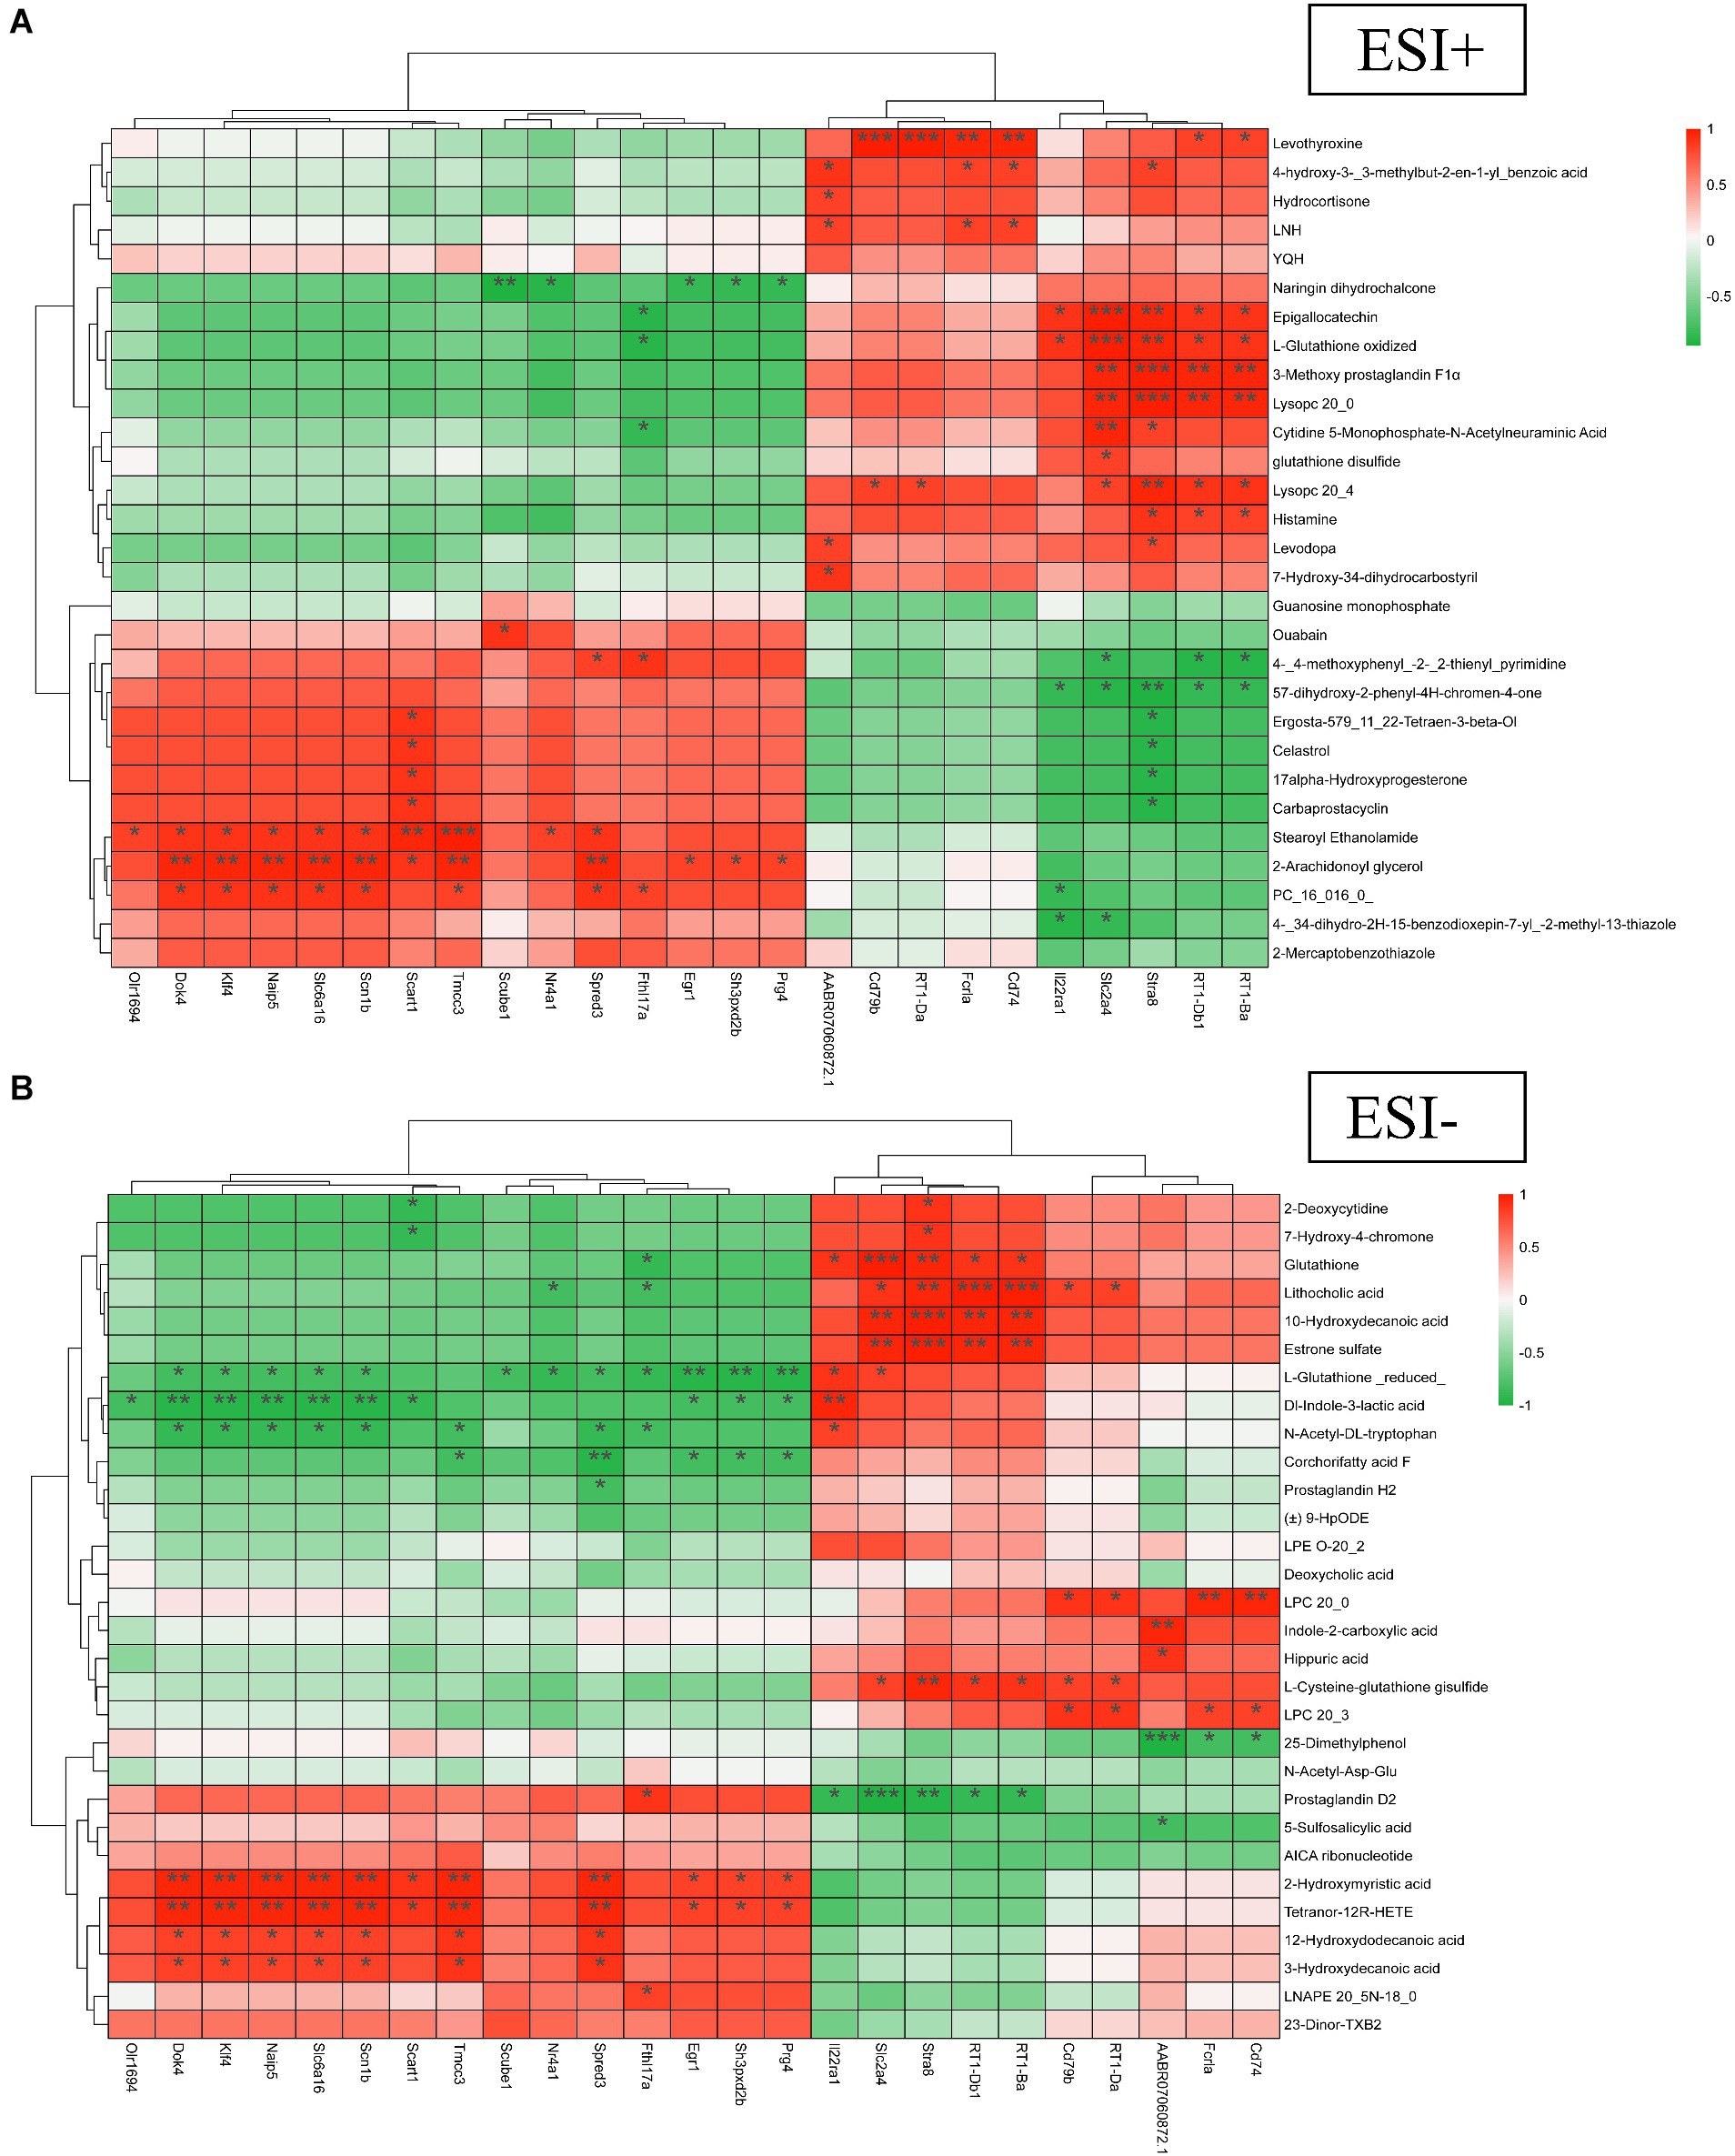
Figure 9. Multi-group correlation heatmap analysis of TBC on diabetic LEAD rats. (A) Positive ion. (B) Negative ion. Red for high positive correlation, green for high negative correlation. *p < 0.05, **p < 0.01, and ***p < 0.001.
In the negative ion mode, 10-Hydroxydecanoic acid and Estrone sulfate showed a strong positive correlation with genes such as Slc2a4, Stra8, RT1-Db1, and RT1-Ba (p < 0.01). Lithocholic acid showed strong positive correlation with Stra8, RT1-Db1, RT1-Ba, and other genes (p < 0.01). Glutathione showed strong positive correlation with Slc2a4 and Stra8 (p < 0.01). LPC 20:0 showed strong positive correlation with Fcrla and Cd74 (p < 0.01). 2-Hydroxymyristic acid and Tetranor-12R-HETE showed strong positive correlation with genes such as Dok4, Klf4, Naip5, Slc6a16, Scn1b, Tmcc3, and Spred3 (p < 0.01). L-Glutathione (reduced) showed a strong negative correlation with genes such as Egr1, Sh3pxd2b, and Prg4 (p < 0.01). Dl-Indole-3-lactic acid showed a strong negative correlation with genes such as Dok4, Klf4, Naip5, Slc6a16, and Scn1b (p < 0.01). Prostaglandin D2 showed strong negative correlation with genes such as Slc2a4, and Stra8 (p < 0.01) (Figure 9B). The correlation analysis revealed a close relationship between differential genes and metabolites.
Diabetic LEAD is a serious complication of diabetes mellitus patients, which seriously affects their life and health. The development of Diabetic LEAD is closely related to oxidative stress, dyslipidemia, atherosclerosis, chronic inflammatory injury, and vascular endothelial dysfunction (Brevetti et al., 2008; Nativel et al., 2018b). Increasing clinical and experimental evidence suggests that TCM plays an important role in the treatment of diabetes and diabetic LEAD. Nevertheless, the involvement of traditional Chinese medicine in diabetic LEAD mostly concentrates on investigating monomeric substances and falls short of offering a thorough assessment of treatment outcomes. Furthermore, angiogenesis is frequently used to examine the potential therapeutic benefits of traditional Chinese medicine formulae like Danshen Injection for diabetic LEAD (Li et al., 2004; He et al., 2016). The synergistic effect of multiple traditional Chinese medicine ingredients may provide a comprehensive therapeutic effect and lessen the limitations of single drug treatment. TBC can treat diabetic LEAD by improving blood circulation, anti-inflammatory response, and antioxidant mechanisms. This study investigated the efficacy, chemical composition, mechanism, and metabolic regulation of the TCM formula TBC in diabetic LEAD rats (Figure 10). The results showed that TBC improved vascular endothelial injury, apoptosis, lipid accumulation, liver and kidney functions, and restored lower extremity blood flow in diabetic LEAD rats. In addition, the mechanism of TBC in the treatment of diabetic LEAD may be related to the modulation of inflammatory immunity, lipid metabolism, and amino acid metabolism. The active chemical components of TBC include (2R)-2,3-Dihydroxypropanoic acid, catechin, citric acid, miquelianin, carminic acid, salicylic acid, and formononetin.
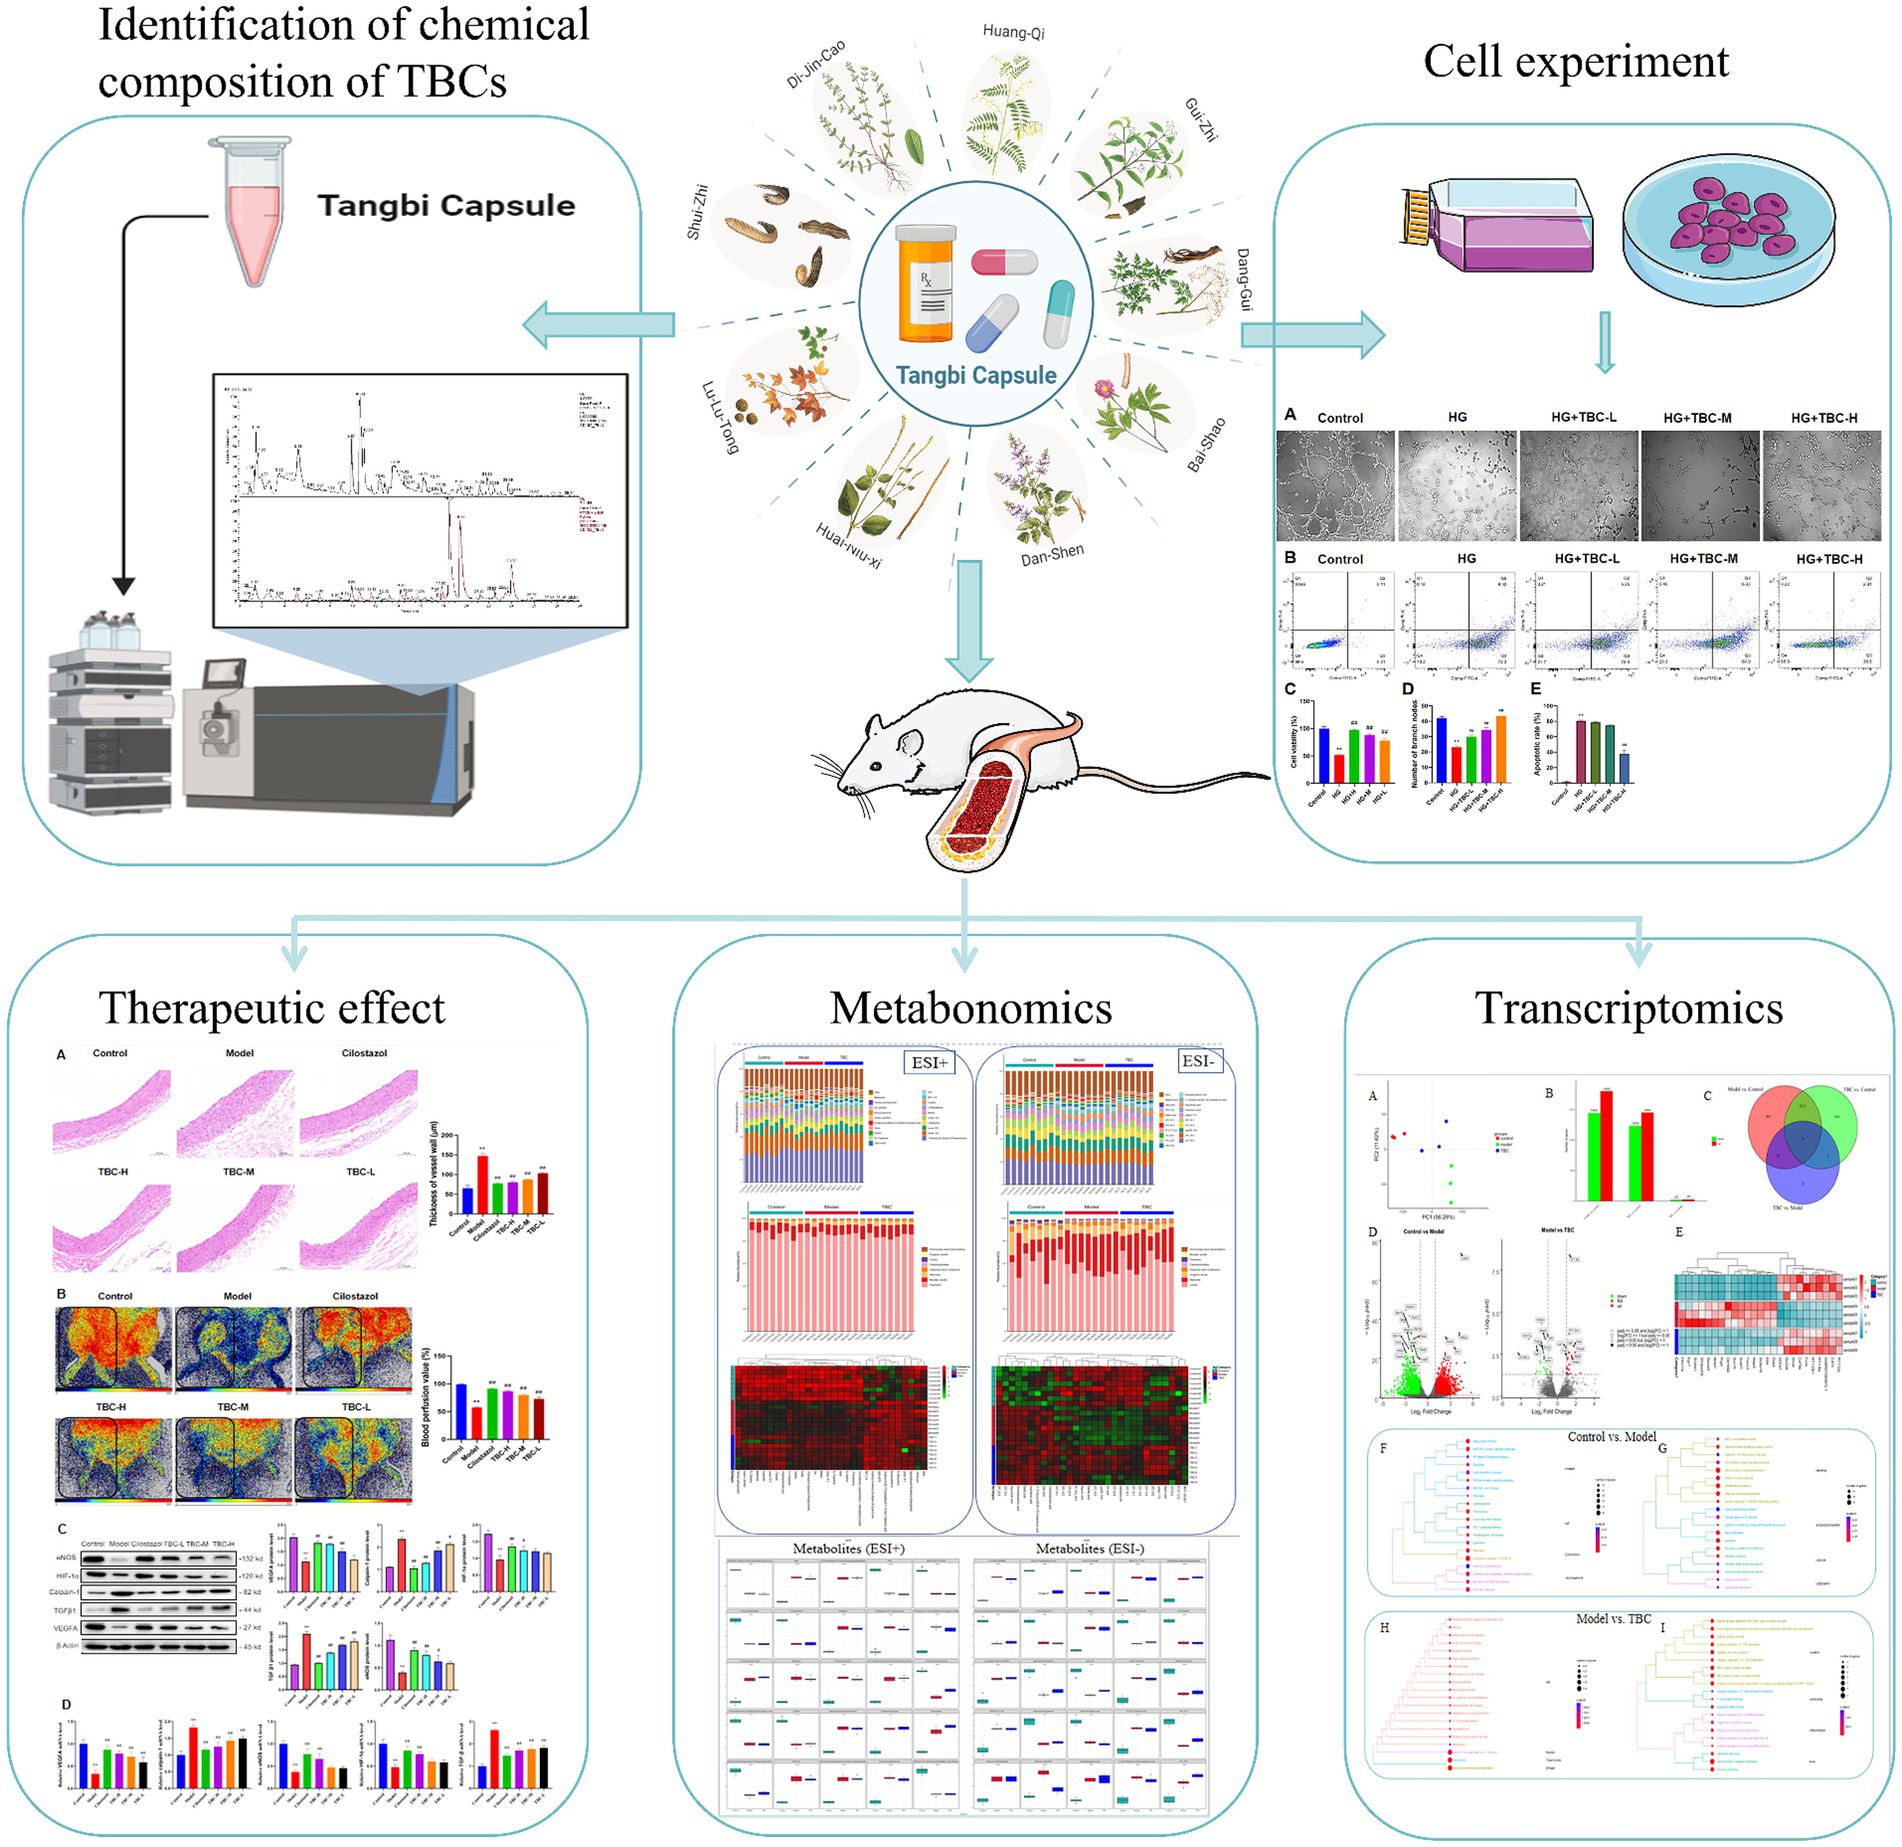
Figure 10. The flowchart of this study of Tangbi capsule on diabetic lower extremity vascular disease.
Results demonstrated that TBC improved vascular endothelial damage and restored blood flow to the lower extremities in rats with diabetic LEAD. Histologic and biochemical experiments on the femoral artery confirmed that TBC improved vascular injury, lipid accumulation, and liver and kidney function. In addition, TBC reduced the expression of inflammatory factors (IL-6, TNF-α, IL-1β) and attenuated the inflammatory response. Chronic inflammatory damage promotes the formation of glycosylation products, which in turn causes abnormal protein cross-linking, leading to vascular wall thickening, decreased vascular elasticity, and vascular lumen narrowing. IL-6 plays an important role in regulating the inflammatory response that causes damage to the vascular wall and accelerates atherosclerosis (Zegeye et al., 2018). TNF-α is an important pro-inflammatory factor, and previous studies have shown that TNF-α can impair endothelial function, induce atherosclerosis and insulin resistance, accelerate the proliferation of smooth muscle cells, and promote the release of platelet growth factor from platelets, accelerating the progression of vascular lesions (Buckley et al., 2005). IL-1β is a pleiotropic cytokine that increases collagen production in a dose-dependent manner and modulates innate immunity by inducing the release of other inflammatory mediators (Wang et al., 2011). Thus, TBC can reduce the inflammatory response by decreasing the expression of inflammatory factors such as IL-6, TNF-α, and IL-1β, which in turn improves vascular injury and stenosis and restores the blood flow in the lower extremities.
Results also showed that TBC significantly increased the levels of protein and expression of angiogenesis-related factors including HIF-1α, eNOS, and VEGFA. However, the protein and gene expression of Calpain-1 and TGFβ were significantly inhibited, indicating that TBC promoted angiogenesis, regulated reactive oxygen species, and attenuated endothelial damage. Results of in vitro cellular experiments showed that TBC intervention enhanced endothelial cell activity, reduced apoptosis, and enhanced endothelial cell angiogenesis. Angiogenesis refers to the formation of new blood vessels from pre-existing vascular systems and it is controlled by various angiogenic and anti-angiogenic factors in addition to multiple signaling pathways (Dudley and Griffioen, 2023). VEGF is a potent angiogenic factor, and VEGFR2 on the surface of endothelial cells triggers endothelial cell proliferation, survival, and migration to induce angiogenesis (Lopes-Coelho et al., 2021). One of the most important functions of atherogenesis is to increase arterial diameter by upregulating smooth muscle cell proliferation through MCP-1 recruitment of immune cells and triggering inflammation. Immune cells recruited to sites of inflammation are a source of atherogenic factors (e.g., TGFβ and HIF-1α) that promote vascular smooth muscle cell proliferation to form new arteries and restore limb perfusion (Niu et al., 2008). Studies have shown that administration of an adenovirus encoding a constitutively active form of HIF-1α increases blood flow recovery in aged mice to levels similar to young mice (Bosch-Marce et al., 2007). In addition, another important factor in collateral formation is eNOS, whose expression is significantly increased in collateral vessels during arteriogenesis. eNOS-mediated NO release plays an important role in maintaining vascular homeostasis (Zhang et al., 2022). Clinical studies demonstrated that impaired NO-induced vasodilatation mediated by eNOS led to structural and functional changes in subcutaneous arterioles and thickened vessel walls (Hsu et al., 2016). In conclusion, in rats with diabetic LEAD, TBC intervention can promote angiogenesis by regulating the expression of angiogenesis-related factors such as HIF-1α, eNOS, and VEGFA.
Metabolomic analysis elucidated the complex pathophysiological processes involved in the treatment of diabetic LEAD with TBC and 87 different metabolites were identified in this study through serum untargeted metabolomic analysis. Pathway enrichment analysis showed that these metabolites may be involved in the treatment of diabetic LEAD by regulating core metabolic pathways such as arginine biosynthesis, phenylalanine metabolism, pyrimidine metabolism, arachidonic acid metabolism, nucleotide metabolism, and vitamin B6 metabolism. Arginine biosynthesis can be converted into NO and indirectly dilate blood vessels and promote the restoration of blood circulation (Morris, 2016). Phenylalanine metabolism can promote glycolipid metabolism and reduce lipid accumulation (Shrode et al., 2022). Pyrimidine is an important biomolecule involved in cellular energy metabolism and DNA synthesis. Regulation of pyrimidine metabolism improves endothelial cell damage and death. Arachidonic acid metabolism regulates cholesterol levels, reduces thrombosis, and lowers lipid levels (Ward, 1991). Vitamin B6 metabolism can protect vascular endothelial cells, reduce endothelial cell activation and platelet damage, inhibit platelet agglutination, blood coagulation, platelet production of prostaglandins, and promote the production of cyclic prostaglandins in vascular endothelial cells (Austin et al., 2004). The results of this study showed that TBC improved dyslipidemia and vascular injury in rats with diabetic LEAD. Transcriptomic analysis further explored the effect of TBC on diabetic LEAD, revealing that TBC could affect immune-related functional pathways. GO results suggested that TBC could promote angiogenesis and reduce inflammatory response. In addition, correlation analysis showed that the differential key genes and key metabolites were significantly associated with glucose-lipid metabolism and amino acid metabolic processes, indicating that TBC treatment improved the metabolic processes of the diabetic LEAD rats.
With liquid mass spectrometry, this study clarified the active chemical components of TBC to investigate its mechanism of action. Identified components include (2R)-2,3-Dihydroxypropanoic acid, catechin, citric acid, miquelianin, carminic acid, salicylic acid, and formononetin. Among them, (2R)-2,3-Dihydroxypropanoic acid can increase arterial blood flow and improve blood supply by acting on vascular smooth muscle and causing vasodilatation, particularly in arteries (Lourenco et al., 2009). The phenolic hydroxyl group of catechin can terminate the reaction with reactive oxygen and nitrogen species, breaking the cycle of generation of new free radicals to stop the free radical chain reaction and prevent the oxidation of cellular lipids (Fraga et al., 2010), and reducing the accumulation of cholesterol and its oxidized products in the arterial wall to improve blood circulation (Suzuki et al., 2005). Catechin also alleviates conditions associated with vascular dysfunction, including vascular inflammation, smooth muscle cell proliferation, platelet aggregation, lipoprotein oxidation, lipid alterations, and vascular reactivity (Velayutham et al., 2008). In addition, catechin reduces the expression of cytokines of inflammation, NF-κB, intercellular adhesion molecule 1, and TNF-α, thereby improving the inflammatory response (Suzuki et al., 2007). Citric acid is thought to have anticoagulant properties due to its ability to chelate Ca2+ ions (Oudemans-van Straaten and Ostermann, 2012). Citric acid can reduce endothelial dysfunction and inflammation and promote endothelial cell sprouting and angiogenic factor production (Binu et al., 2013). Miquelianin has antidiabetic potential such as antioxidant, antiglycation, and aldose reductase inhibition (Zuo et al., 2021). Carminic acid possesses a variety of bioactivities that protect erythrocytes and DNA from free radical-induced oxidation (Li et al., 2009). Carminic acid can scavenge free radicals by mediating the TNF-α/TNFRs and Nrf-2 signaling pathways to inhibit inflammation and oxidative stress and reduce lipid deposition (Li et al., 2022). Salicylic acid is one of the most commonly used anti-inflammatory reagents and is the major in vivo metabolite of aspirin, known to inhibit the inflammatory response and protect endothelial cells by preventing endothelial mitochondrial fragmentation (Forrester et al., 2020). Formononetin is a bioactive isoflavone with antioxidant and anti-inflammatory properties (Aladaileh et al., 2019). Interestingly, formononetin can improve arterial endothelial function by up-regulating eNOS via the estrogen receptor and mitogen-activated protein kinase pathways and may play an active role in reducing thrombosis in the lower extremities (Sun et al., 2016).
The study investigated the efficacy and mechanism of TBC on diabetic LEAD through ex vivo experiments, chemical composition analysis, metabolomics, and transcriptomics, offering preliminary evidence to guide the use of TBC as a therapy option for diabetic LEAD. However, certain limitations should be considered. Firstly, this study was qualitative and quantitative test was not performed to analyze the specific components. Secondly, in-depth validation results of transcriptomics was not applied and the effects of differential genes on diabetic LEAD rats should be further investigated.
TBC improved vascular endothelial injury, apoptosis, lipid accumulation, liver and kidney function, and restored blood flow in the lower extremities of diabetic LEAD rats. The mechanism of TBC in the treatment of diabetic LEAD may be related to the modulation of inflammatory immunity, lipid metabolism, and amino acid metabolism. The active ingredients of TBC include (2R)-2,3-Dihydroxypropanoic acid, catechin, citric acid, miquelianin, carminic acid, salicylic acid, and formononetin. This study offers preliminary evidence to guide the application of TBC as a therapy for diabetic LEAD. However, quantified detection of specific drug components was not performed and the transcriptomics results were not fully validated. Given the limitations, the results should be established or confirmed on a larger scale with more precise instructions in future investigations.
The datasets presented in this study can be found in online repositories. The names of the repository/repositories and accession number(s) can be found in the article/Supplementary material.
The animal study was approved by Experimental Animal Ethics Committee of Guangdong Hospital of Chinese Medicine. The study was conducted in accordance with the local legislation and institutional requirements.
Y-hL: Conceptualization, Data curation, Formal analysis, Methodology, Writing – original draft. D-wW: Formal analysis, Visualization, Writing – original draft. JY: Resources, Visualization, Writing – original draft. YH: Formal analysis, Writing – original draft. LZ: Formal analysis, Investigation, Resources, Writing – original draft. J-xW: Investigation, Writing – review & editing. J-mZ: Investigation, Writing – review & editing. L-LW: Resources, Writing – original draft. G-jF: Methodology, Project administration, Resources, Writing – review & editing. WS: Conceptualization, Formal analysis, Funding acquisition, Methodology, Project administration, Resources, Supervision, Writing – review & editing.
The author(s) declare that financial support was received for the research, authorship, and/or publication of this article. This study was supported by the 2021 Guangdong Basic and Applied Basic Research Fund Joint Fund Key Project (No. 2021B1515120085); Project jointly funded by Guangzhou Science and Technology Bureau and Municipal Academy of Sciences (No. 2024A03J0036; the Guangdong Provincial Hospital of Chinese Medicine Science and Technology Research Project (No. YN2020ZWB03).
The authors declare that the research was conducted in the absence of any commercial or financial relationships that could be construed as a potential conflict of interest.
All claims expressed in this article are solely those of the authors and do not necessarily represent those of their affiliated organizations, or those of the publisher, the editors and the reviewers. Any product that may be evaluated in this article, or claim that may be made by its manufacturer, is not guaranteed or endorsed by the publisher.
The Supplementary material for this article can be found online at: https://www.frontiersin.org/articles/10.3389/fmicb.2024.1423428/full#supplementary-material
Aladaileh, S. H., Hussein, O. E., Abukhalil, M. H., Saghir, S. A. M., Bin-Jumah, M., Alfwuaires, M. A., et al. (2019). Formononetin upregulates Nrf2/HO-1 signaling and prevents oxidative stress, inflammation, and kidney injury in methotrexate-induced rats. Antioxidants 8:430. doi: 10.3390/antiox8100430
Austin, R. C., Lentz, S. R., and Werstuck, G. H. (2004). Role of hyperhomocysteinemia in endothelial dysfunction and atherothrombotic disease. Cell Death Differ. 11, S56–S64. doi: 10.1038/sj.cdd.4401451
Binu, S., Soumya, S. J., and Sudhakaran, P. R. (2013). Metabolite control of angiogenesis: angiogenic effect of citrate. J. Physiol. Biochem. 69, 383–395. doi: 10.1007/s13105-012-0220-9
Bosch-Marce, M., Okuyama, H., Wesley, J. B., Sarkar, K., Kimura, H., Liu, Y. V., et al. (2007). Effects of aging and hypoxia-inducible factor-1 activity on angiogenic cell mobilization and recovery of perfusion after limb ischemia. Circ. Res. 101, 1310–1318. doi: 10.1161/circresaha.107.153346
Brevetti, G., Schiano, V., and Chiariello, M. (2008). Endothelial dysfunction: a key to the pathophysiology and natural history of peripheral arterial disease? Atherosclerosis 197, 1–11. doi: 10.1016/j.atherosclerosis.2007.11.002
Buckley, C. D., Rainger, G. E., Nash, G. B., and Raza, K. (2005). Endothelial cells, fibroblasts and vasculitis. Rheumatology 44, 860–863. doi: 10.1093/rheumatology/keh542
Buso, G., Aboyans, V., and Mazzolai, L. (2019). Lower extremity artery disease in patients with type 2 diabetes. Eur. J. Prev. Cardiol. 26, 114–124. doi: 10.1177/2047487319880044
Dudley, A. C., and Griffioen, A. W. (2023). The modes of angiogenesis: an updated perspective. Angiogenesis 26, 477–480. doi: 10.1007/s10456-023-09895-4
Forrester, S. J., Preston, K. J., Cooper, H. A., Boyer, M. J., Escoto, K. M., Poltronetti, A. J., et al. (2020). Mitochondrial fission mediates endothelial inflammation. Hypertension 76, 267–276. doi: 10.1161/hypertensionaha.120.14686
Fraga, C. G., Galleano, M., Verstraeten, S. V., and Oteiza, P. I. (2010). Basic biochemical mechanisms behind the health benefits of polyphenols. Mol. Asp. Med. 31, 435–445. doi: 10.1016/j.mam.2010.09.006
He, S., Zhao, T., Guo, H., Meng, Y., Qin, G., Goukassian, D. A., et al. (2016). Coordinated activation of VEGF/VEGFR-2 and PPARd pathways by a multi-component Chinese medicine DHI accelerated recovery from peripheral arterial disease in type 2 diabetic mice. PLoS One 11:e0167305. doi: 10.1371/journal.pone.0167305
Hongxia, C., Xiuyun, M., Youhua, G., Hongxia, G., and Xueliang, G. (2007). Clinical observation on 50 cases of diabetic lower extremities arterial disease with qi deficiency and blood stasis treated by Tangbi capsule. J. Tradit. Chin. Med. 10, 901–903. doi: 10.13288/j.11-2166/r.2007.10.013
Hsu, C.-P., Zhao, J.-F., Lin, S.-J., Shyue, S.-K., Guo, B.-C., Lu, T.-M., et al. (2016). Asymmetric dimethylarginine limits the efficacy of simvastatin activating endothelial nitric oxide synthase. J. Am. Heart Assoc. 5:e003327. doi: 10.1161/jaha.116.003327
Lazzarini, P. A., Pacella, R. E., Armstrong, D. G., and van Netten, J. J. (2018). Diabetes-related lower-extremity complications are a leading cause of the global burden of disability. Diabet. Med. 35, 1297–1299. doi: 10.1111/dme.13680
Li, L., Fang, B., Zhang, Y., Yan, L., He, Y., Hu, L., et al. (2022). Carminic acid mitigates fructose-triggered hepatic steatosis by inhibition of oxidative stress and inflammatory reaction. Biomed. Pharmacother. 145:112404. doi: 10.1016/j.biopha.2021.112404
Li, G.-X., Liu, Z.-Q., and Wu, D. (2009). Carminic acid: an antioxidant to protect erythrocytes and DNA against radical-induced oxidation. J. Phys. Org. Chem. 22, 883–887. doi: 10.1002/poc.1536
Li, W. L., Zheng, H. C., Bukuru, J., and De Kimpe, N. (2004). Natural medicines used in the traditional Chinese medical system for therapy of diabetes mellitus. J. Ethnopharmacol. 92, 1–21. doi: 10.1016/j.jep.2003.12.031
LoGerfo, F. W., and Gibbons, G. W. (1996). Vascular disease of the lower extremities in diabetes mellitus. Endocrinol. Metab. Clin. N. Am. 25, 439–445. doi: 10.1016/s0889-8529(05)70332-7
Lopes-Coelho, F., Martins, F., Pereira, S. A., and Serpa, J. (2021). Anti-angiogenic therapy: current challenges and future perspectives. Int. J. Mol. Sci. 22:3765. doi: 10.3390/ijms22073765
Lourenco, E. C., Maycock, C. D., and Ventura, M. R. (2009). Synthesis of potassium (2R)-2-O-α-d-glucopyranosyl-(1→6)-α-d-glucopyranosyl-2,3-dihydroxypropanoate a natural compatible solute. Carbohydr. Res. 344, 2073–2078. doi: 10.1016/j.carres.2009.06.037
Morris, S. M. Jr. (2016). Arginine metabolism revisited. J. Nutr. 146, 2579S–2586S. doi: 10.3945/jn.115.226621
Nativel, M., Potier, L., Alexandre, L., Baillet-Blanco, L., Ducasse, E., Velho, G., et al. (2018a). Lower extremity arterial disease in patients with diabetes: a contemporary narrative review. Cardiovasc. Diabetol. 17:138. doi: 10.1186/s12933-018-0781-1
Nativel, M., Schneider, F., Saulnier, P.-J., Gand, E., Ragot, S., Meilhac, O., et al. (2018b). Prognostic values of inflammatory and redox status biomarkers on the risk of major lower-extremity artery disease in individuals with type 2 diabetes. Diabetes Care 41, 2162–2169. doi: 10.2337/dc18-0695
Niu, J., Azfer, A., Zhelyabovska, O., Fatma, S., and Kolattukudy, P. E. (2008). Monocyte chemotactic protein (MCP)-1 promotes angiogenesis via a novel transcription factor, MCP-1-induced protein (MCPIP). J. Biol. Chem. 283, 14542–14551. doi: 10.1074/jbc.M802139200
Oudemans-van Straaten, H. M., and Ostermann, M. (2012). Bench-to-bedside review: citrate for continuous renal replacement therapy, from science to practice. Crit. Care 16:249. doi: 10.1186/cc11645
Russell, C., Rahman, A., and Mohammed, A. R. (2013). Application of genomics, proteomics and metabolomics in drug discovery, development and clinic. Ther. Deliv. 4, 395–413. doi: 10.4155/tde.13.4
Shrode, R. L., Cady, N., Jensen, S. N., Borcherding, N., and Mangalam, A. K. (2022). Isoflavone consumption reduces inflammation through modulation of phenylalanine and lipid metabolism. Metabolomics 18:84. doi: 10.1007/s11306-022-01944-1
Sun, T., Cao, L., Ping, N.-N., Wu, Y., Liu, D.-Z., and Cao, Y.-X. (2016). Formononetin upregulates nitric oxide synthase in arterial endothelium through estrogen receptors and MAPK pathways. J. Pharm. Pharmacol. 68, 342–351. doi: 10.1111/jphp.12519
Suzuki, J.-I., Ogawa, M., Futamatsu, H., Kosuge, H., Sagesaka, Y. M., and Isobe, M. (2007). Tea catechins improve left ventricular dysfunction, suppress myocardial inflammation and fibrosis, and alter cytokine expression in rat autoimmune myocarditis. Eur. J. Heart Fail. 9, 152–159. doi: 10.1016/j.ejheart.2006.05.007
Suzuki, J., Ogawa, M., Izawa, A., Sagesaka, Y. M., and Isobe, M. (2005). Dietary consumption of green tea catechins attenuate hyperlipidaemia-induced atherosclerosis and systemic organ damage in mice. Acta Cardiol. 60, 271–276. doi: 10.2143/ac.60.3.2005003
Velayutham, P., Babu, A., and Liu, D. (2008). Green tea catechins and cardiovascular health: an update. Curr. Med. Chem. 15, 1840–1850. doi: 10.2174/092986708785132979
Wang, J.-G., Williams, J. C., Davis, B. K., Jacobson, K., Doerschuk, C. M., Ting, J. P. Y., et al. (2011). Monocytic microparticles activate endothelial cells in an IL-1β-dependent manner. Blood 118, 2366–2374. doi: 10.1182/blood-2011-01-330878
Ward, P. A. (1991). Mechanisms of endothelial cell killing by H2O2 or products of activated neutrophils. Am. J. Med. 91, S89–S94. doi: 10.1016/0002-9343(91)90290-e
Weiss, J. S., and Sumpio, B. E. (2006). Review of prevalence and outcome of vascular disease in patients with diabetes mellitus. Eur. J. Vasc. Endovasc. Surg. 31, 143–150. doi: 10.1016/j.ejvs.2005.08.015
Wu, Y.-T., Wu, M.-T., Lin, C.-C., Chien, C.-F., and Tsai, T.-H. (2012). Pharmacokinetic studies of Chinese medicinal herbs using an automated blood sampling system and liquid chromatography-mass spectrometry. J. Tradit. Complement. Med. 2, 33–40. doi: 10.1016/S2225-4110(16)30068-2
Zegeye, M. M., Lindkvist, M., Falker, K., Kumawat, A. K., Paramel, G., Grenegard, M., et al. (2018). Activation of the JAK/STAT3 and PI3K/AKT pathways are crucial for IL-6 trans-signaling-mediated pro-inflammatory response in human vascular endothelial cells. Cell Commun. Signal 16:55. doi: 10.1186/s12964-018-0268-4
Zhang, G., Han, S., Wang, L., Yao, Y., Chen, K., and Chen, S. (2022). A ternary synergistic eNOS gene delivery system based on calcium ion and L-arginine for accelerating angiogenesis by maximizing NO production. Int. J. Nanomedicine 17, 1987–2000. doi: 10.2147/ijn.S363168
Zhu, X., Lei, Y., Tan, F., Gong, L., Gong, H., Yang, W., et al. (2018). Vaccarin protects human microvascular endothelial cells from apoptosis via attenuation of HDAC1 and oxidative stress. Eur. J. Pharmacol. 818, 371–380. doi: 10.1016/j.ejphar.2017.09.052
Zuo, G.-L., Kim, H. Y., Guillen Quispe, Y. N., Wang, Z.-Q., Hwang, S. H., Shin, K.-O., et al. (2021). Efficient separation of phytochemicals from Muehlenbeckia volcanica (Benth.) Endl. by polarity-stepwise elution counter-current chromatography and their antioxidant, antiglycation, and aldose reductase inhibition potentials. Molecules 26:224. doi: 10.3390/molecules26010224
Keywords: diabetic lower extremities arterial disease, integrated metabolomics, transcriptomics, Tangbi capsule, angiogenesis, vascular endothelial injury
Citation: Luo Y-h, Wang D-w, Yao J, Hu Y, Zhao L, Wen J-x, Zhang J-m, Wu L-L, Fan G-j and Song W (2024) Integrated metabolomics and transcriptomics analysis reveals the mechanism of Tangbi capsule for diabetic lower extremities arterial disease. Front. Microbiol. 15:1423428. doi: 10.3389/fmicb.2024.1423428
Edited by:
Nelson da Cruz Soares, University of Sharjah, United Arab EmiratesReviewed by:
Tarique Hussain, Nuclear Institute for Agriculture and Biology, PakistanCopyright © 2024 Luo, Wang, Yao, Hu, Zhao, Wen, Zhang, Wu, Fan and Song. This is an open-access article distributed under the terms of the Creative Commons Attribution License (CC BY). The use, distribution or reproduction in other forums is permitted, provided the original author(s) and the copyright owner(s) are credited and that the original publication in this journal is cited, in accordance with accepted academic practice. No use, distribution or reproduction is permitted which does not comply with these terms.
*Correspondence: Guan-jie Fan, ZmFuZ3VhbmppZUBnenVjbS5lZHUuY24=; Wei Song, d2Vpd2Vpd2luZHlAZ3p1Y20uZWR1LmNu
†These authors have contributed equally to this work
Disclaimer: All claims expressed in this article are solely those of the authors and do not necessarily represent those of their affiliated organizations, or those of the publisher, the editors and the reviewers. Any product that may be evaluated in this article or claim that may be made by its manufacturer is not guaranteed or endorsed by the publisher.
Research integrity at Frontiers
Learn more about the work of our research integrity team to safeguard the quality of each article we publish.