 Bin Diao
 Zhixiang Xu
 Min Liu
 Guangyuan Wang
 Xuemei Tian
- Shandong Province Key Laboratory of Applied Mycology, College of Life Sciences, Qingdao Agricultural University, Qingdao, China
Germplasm resources of edible mushrooms are essential for the breeding of varieties with improved traits. Analysis of the genetic diversity of Grifola frondosa germplasm resources and clarification of the genetic relationships among strains can provide valuable information for the selection of breeding parents. A total of 829,488 high-quality SNP loci were screened from 2,125,382 SNPs obtained by sequencing 60 G. frondose. Phylogenetic analysis, PCA, and population structure analysis based on the high-quality SNPs showed that the 60 strains could be divided into five subgroups, and the clustering results were consistent with the geographical distributions of these strains. Based on high-quality SNP loci, a core collection containing 18 representative germplasm resources was constructed, and 1,473 Kompetitive Allele-Specific PCR markers were obtained. A total of 722 SNP markers in the exonic regions were screened using KASP-genotyping experiments, and 50 candidate SNP markers and 12 core SNP markers were obtained. Genetic fingerprints of G. frondosa germplasm resources were constructed based on the selected SNP markers; these fingerprints provide an accurate, rapid, convenient, and efficient method for the identification of G. frondosa germplasm resources. The results of this study have important implications for the preservation and utilization of G. frondosa germplasm resources and the identification of varieties.
1 Introduction
Grifola frondosa is a rare edible and medicinal mushroom that belongs to the phylum Basidiomycota and the family Polyporaceae (Dai, 2009; Dai et al., 2010). Its fruiting body is flavorful and rich in nutrients, such as proteins, minerals, polysaccharides, sterols, and triterpenes; it has also been shown to have anti-tumor, antioxidant, and immunomodulatory properties (Wu et al., 2021; Tripodi et al., 2022). The cultivation of this rare edible mushroom has increased rapidly in recent years in China because of its nutritional value, pharmacological functions, and broad market prospects.
The artificial domestication and cultivation of G. frondosa in China began in the 1980s. The factory production of G. frondosa is necessary to meet the continuous growth in demand for G. frondosa (Li, 2021; Li and Xu, 2022). Existing strains have mainly been domesticated in the wild or introduced from Japan; these strains have various shortcomings such as their poor adaptability, high vulnerability to being contaminated with mold, low biotransformation rate, and inability to be used for factory cultivation. These strains have been used for the cultivation of mushrooms; their poor traceability coupled with the widespread presence of mixed varieties poses a threat to the future productivity of mushroom farming operations and breeding efforts (Li et al., 2019a). Moreover, the genetic background of cultivated germplasm is narrow, and the diversity of favorable alleles in wild germplasm has not been fully utilized in breeding programs. The identification of mushroom strains is a challenge due to the low number of morphological differences between mushroom varieties. This poses challenges for the establishment of protections for edible mushroom varieties; there is thus an urgent need to develop efficient and accurate technologies for the identification of different mushroom varieties (Li et al., 2019a). There is also a need to preserve and improve existing G. frondosa germplasm resources; improved methods for the accurate identification of varieties are also needed, especially for the identification of specific germplasm materials and the selection of parents with desirable traits. An increasing number of technologies, including molecular marker technologies, have been used in studies of edible and medicinal mushrooms (Xu, 2006; Su et al., 2008; Liu et al., 2018; Zhang et al., 2019).
The core collection refers to a limited set of accessions that are selected to maximize the genetic diversity of the population with the lowest genetic redundancy. The core collection generally comprises a genetically representative sample of the population. Core collections have been constructed for various plants, such as Oryza sativa (Chung et al., 2009), Phaseolus vulgaris (Perseguini et al., 2015), Lagenaria siceraria (Wang et al., 2021b), and Juglans regia (Mahmoodi et al., 2021). Few core collections of fungi have been constructed; to date, core collections have been generated for the following fungal species: Lentinus edodes (Liu et al., 2015), Flammulina velutipes (Liu et al., 2018), Pleurotus citrinopileatus Singer (Zhang et al., 2012), and Saccharomyces cerevisiae (Liu et al., 2021).
Kompetitive Allele-Specific PCR (KASP) is based on touch-down PCR technology, which utilizes universal fluorescent probes for accurate double allele typing of target SNPs against a wide range of genomic DNA samples, including complex genomic DNA samples (Wang et al., 2022). KASP technology has various advantages compared with other SNP detection methods, including its high accuracy, high site adaptability, low cost, and suitability for detecting SNP sites in a large number of samples; these properties make KASP useful for the identification of crop genes, genetic diversity analysis, and fingerprinting (Li et al., 2019b; Yang et al., 2022).
The construction of DNA fingerprints based on SNP marker technology is important for ensuring their varietal specificity and utility for varieties or species authenticity issues; DNA fingerprints are also important for genetic breeding programs, the identification of germplasm resources, and the discovery of new genes (Omar et al., 2023).
Whole genome resequencing is to find the difference between sequence information by comparing with existing genomes, so that the population variation information can be quickly obtained, such as SNP, InDel, SV, CNV and other variation sites (Bau and Lu, 2017; Huang et al., 2018). Compared with other SNP detection methods, KASP technology has the advantages of high accuracy and site adaptability, relatively low cost, and suitable for high-throughput detection of a large number of samples, and has a variety of applications in genetic diversity analysis and fingerprint construction. At present, it has been widely used in the construction of fingerprint of different species, such as cabbage (Li et al., 2018), bottle gourd (Wang et al., 2021b), grape (Wang et al., 2021a) and so on.
In this study, whole-genome resequencing technology was used to screen high-quality SNP loci, establish a core collection, and develop KASP markers from G. frondosa germplasm resources. Principal component analysis (PCA), population genetic structure analysis, and phylogenetic analysis based on developed KASP molecular markers were used to verify their discriminatory power. Our findings will enhance the efficiency of the management and utilization of G. frondosa germplasm resources, provide a valuable source of genetic information, and aid the genetic breeding of G. frondosa in China.
2 Materials and methods
2.1 Strains, DNA extraction, and whole-genome sequencing
A total of 60 strains of G. frondosa were used in this study, including 49 cultivars, 3 wild strains, and 8 aerospace mutagenic strains (Table 1). The mycelia were grown in Potato Dextrose Agar (PDA) medium at 25°C until they reached maturity. Genomic DNA was extracted from mycelia using the CTAB method (Doyle and Doyle, 1987). A Nanodrop spectrophotometer and 1.0% agarose gel electrophoresis were used to assess the concentration and integrity of the DNA. After the DNA was fragmented via ultrasound. The DNA fragments were purified and end-repaired, a single “A” nucleotide was added to the 3′ ends of the blunt fragments, sequencing adapters were ligated to the A-tailed fragments, and then size selection was performed using agarose gel electrophoresis; this was followed by PCR amplification to generate sequencing libraries. The constructed libraries were first subjected to library quality control, and the qualified libraries were sequenced using the Illumina NovaSeq 6000 platform (Li et al., 2024).
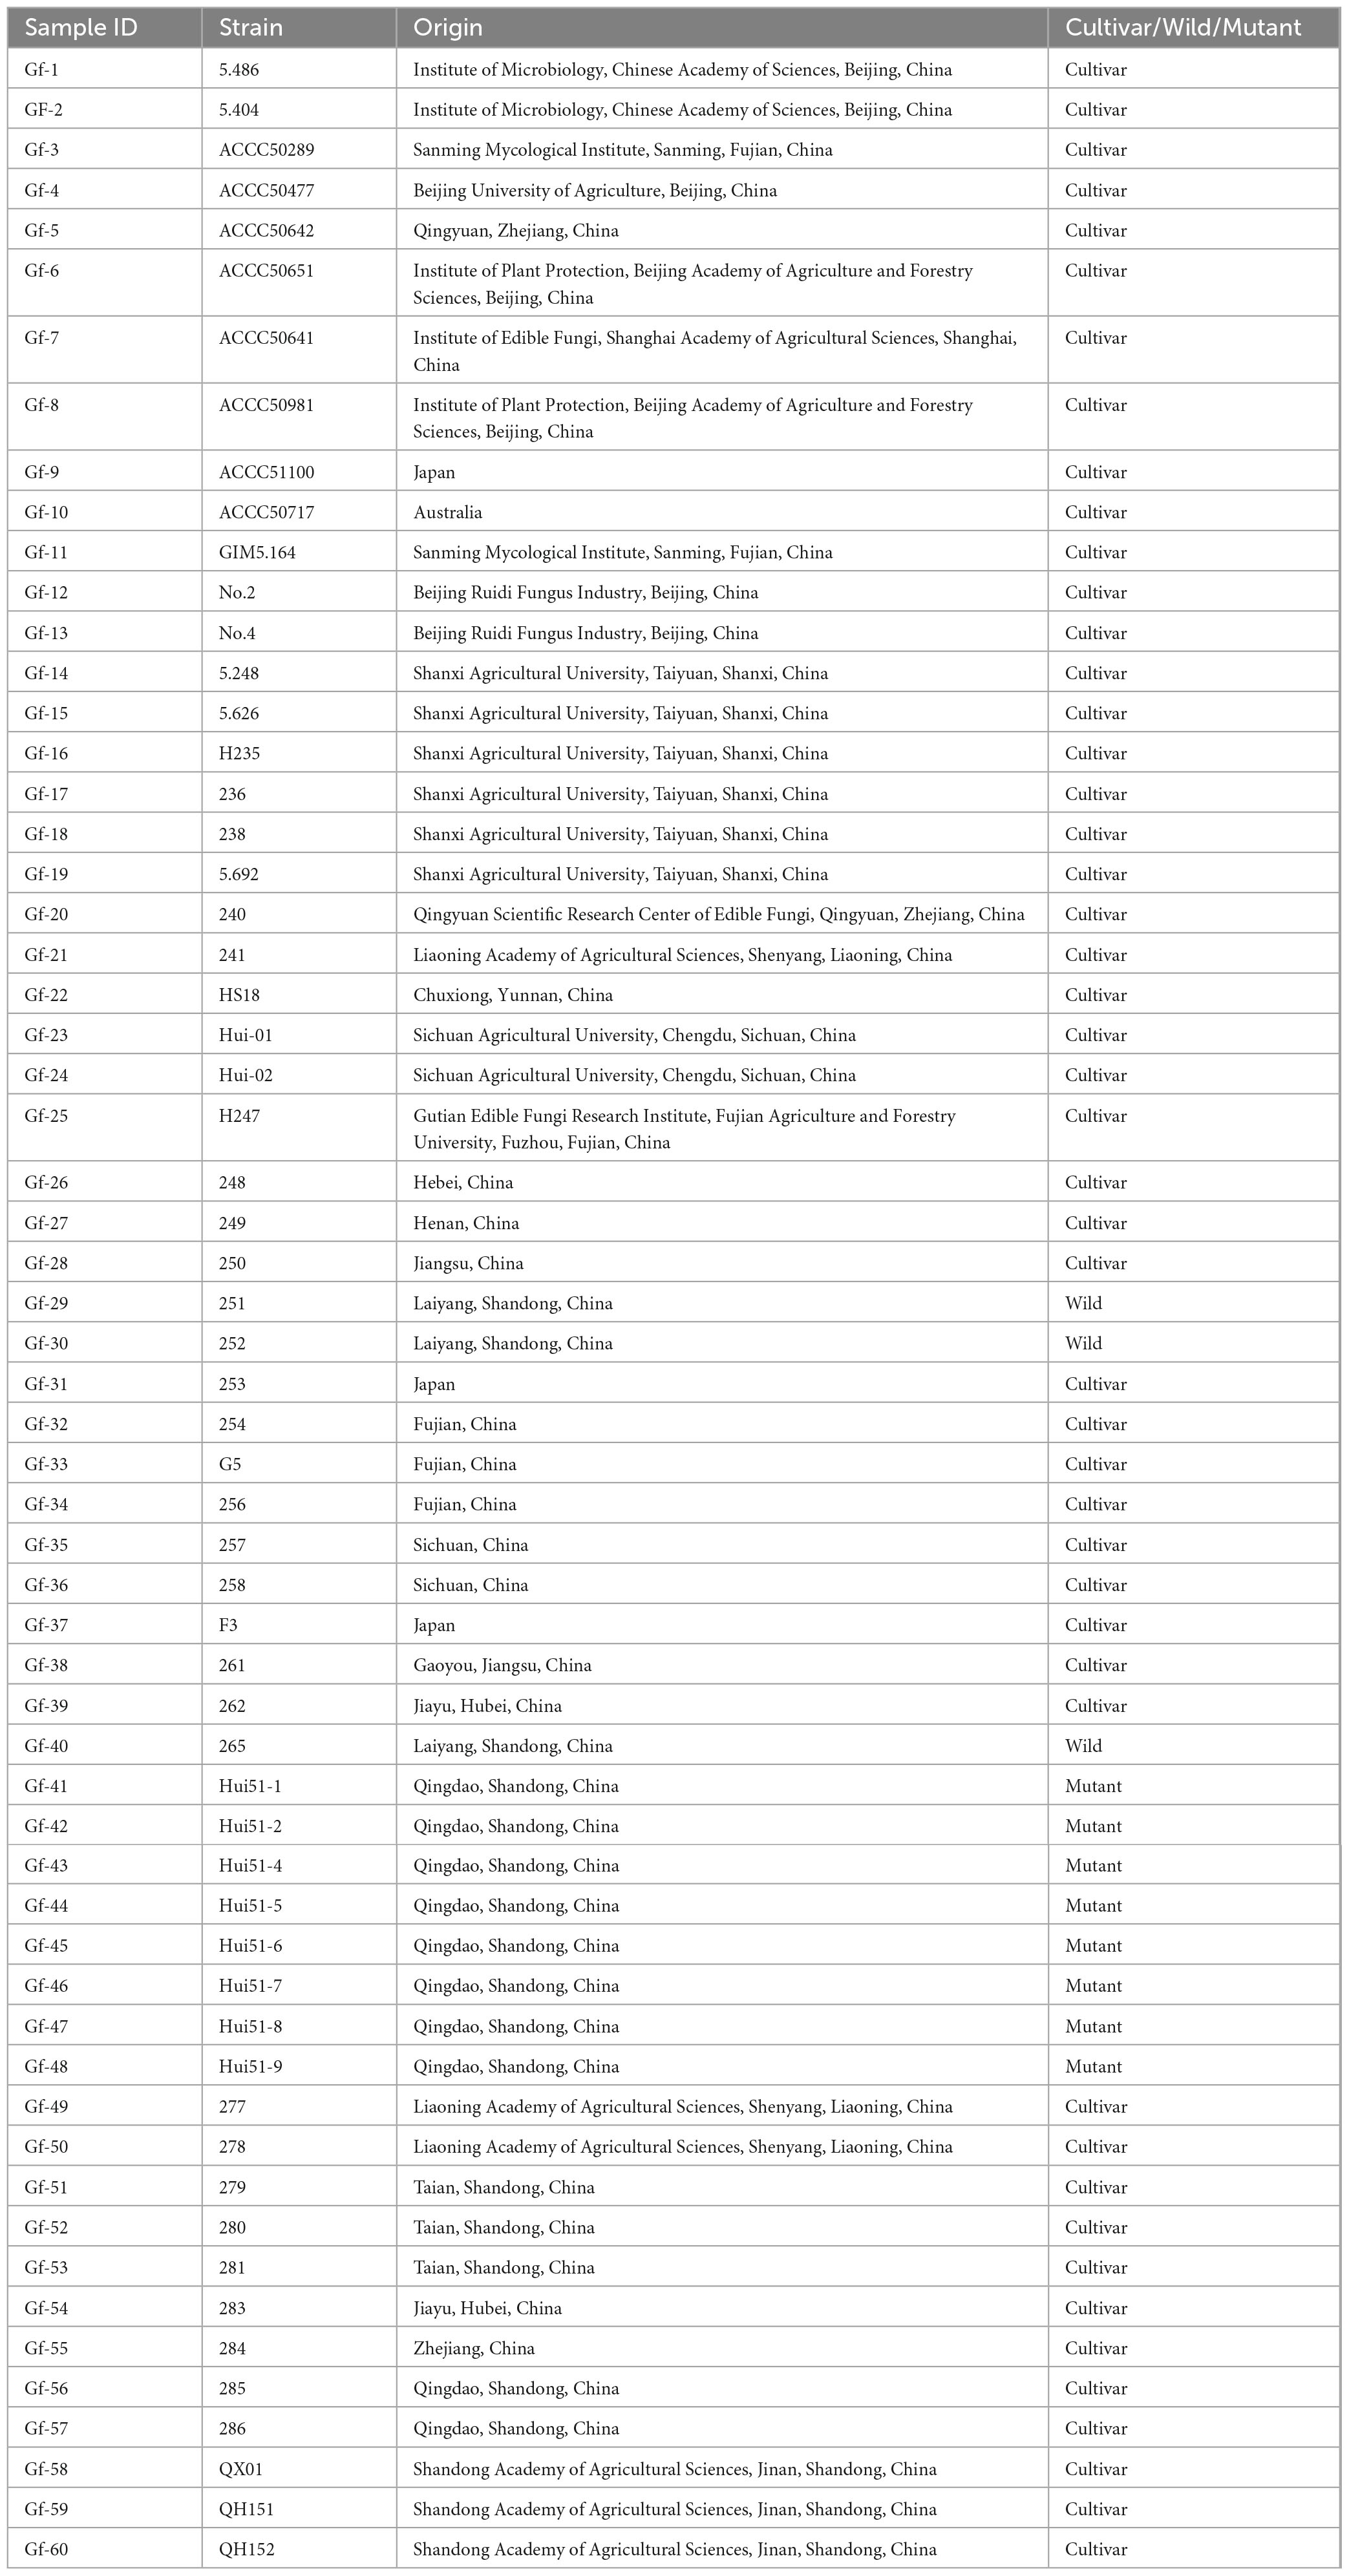
Table 1. Basic information of G. frondosa strains.
The raw reads obtained from sequencing were analyzed using fastqc. After removing the adapters and low-quality reads with fastp software (Chen et al., 2018), the clean reads were mapped to the reference genome using BWA-MEM software (v.0.7.17) with default parameters1 (Li and Durbin, 2009). Information on the sequencing depth, genome coverage, and variation among samples is shown in Table 2.
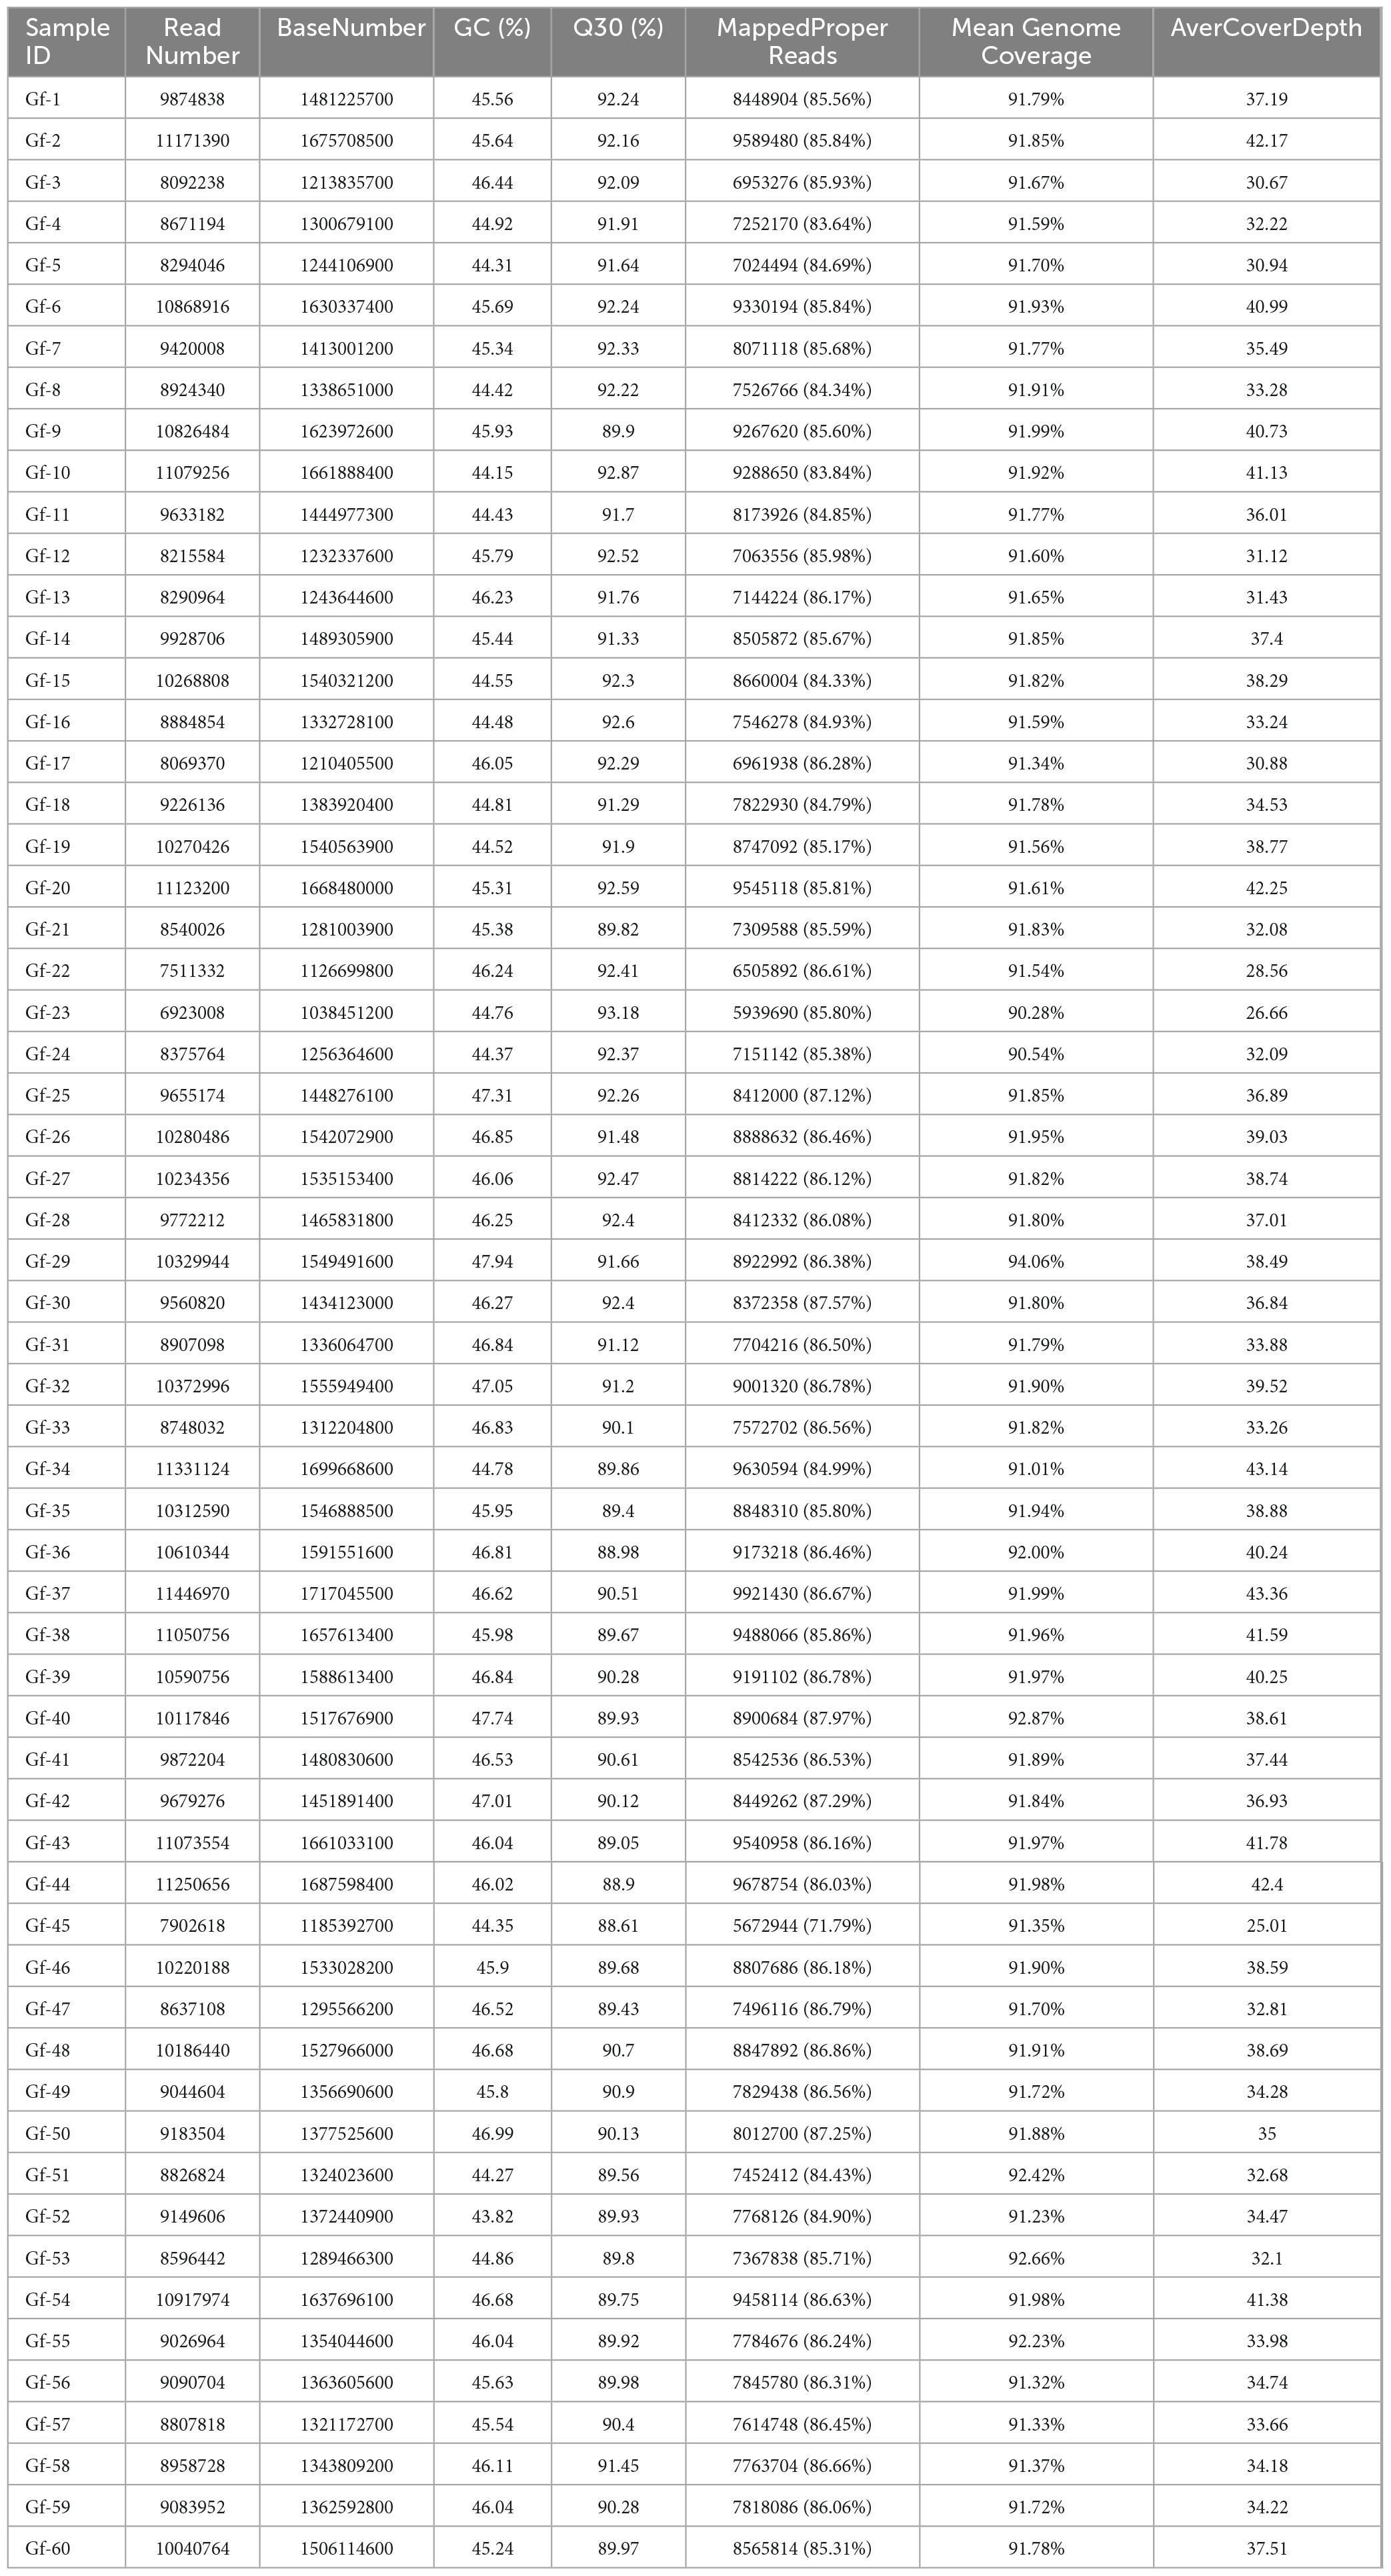
Table 2. Data for whole genome-sequenced strains.
2.2 SNP detection and annotation
Localization analysis of Clean Reads in the reference genome was performed using the GATK (version: v4.1.4.1) software toolkit, and the Mark Duplicate tool in Picard software was used to remove duplicate reads derived from PCR (McKenna et al., 2010). GATK HaplotypeCaller was used to generate raw variants (SNPs and InDels). The raw SNPs were filtered using GATK VariantFiltration with the following parameters: “QD < 2.0, MQ < 40.0, FS > 60.0, MQRankSum < −12.5, and ReadPosRankSum < −8.0”. A DNA raw variation database containing 2.12 million SNPs was generated. SnpEff was used to obtain annotation information on the variant loci from the reference genome (Cingolani et al., 2012). High-quality SNPs were screened from the entire database using bcftools and vcftools software based on the following criteria: Average coverage depth > 5 ×, Minor allele frequency (MAF) > 0.05, AverageQ > 30, Minimum integrity > 0.9 (Danecek et al., 2011).
2.3 Population genetic analysis and core collection development
Phylogenetic trees were constructed based on high-quality SNPs using the neighbor-joining (NJ) method, and the trees were visualized using Fig Tree v1.3.1 software (Oliveira et al., 2020). PCA was performed using GCTA (v1.940) software (Yang et al., 2011). The genetic structure of populations was analyzed using Admixture (v1.3.0) software based on the number of subgroups or ancestors and the similarity among populations; a CV error diagram was made to determine the optimal K-value (Alexander et al., 2009). Core Hunter software was used to screen the core collection, and the representativeness of the core collection was assessed by calculating the Shannon-Weaver diversity index, Nei’s gene diversity index, and PIC (Thachuk et al., 2009). Principal component analysis and cluster analysis were conducted to analyze the constructed core collection (Wang et al., 2021b).
2.4 KASP marker design and genotyping
KASP markers were screened from high-quality SNPs using the following criteria (Yang et al., 2022): (1) SNP sites were conserved in sequences greater than 50 bp before and after the DNA strand on the chromosome; (2) average coverage depth > 5 ×, minor allele frequency (MAF) > 0.05, AverageQ > 30, minimum integrity > 0.9, and the SNP is a double-allele variant; (3) the sequences 100 bp upstream and downstream of the SNP marker were mapped to the reference genome using BLAST software (version: 2.10.1+), and markers at multiple locations in the alignment were removed; and (4) markers had a polymorphic information content (PIC) > 0.2. All PIC calculations were performed in Excel using the following formula:
where Pi and Pj are the frequency of occurrence of the two SNP alleles in all tested accessions, and l is the number of samples (Botstein et al., 1980; Zhang et al., 2020).
The primer design software Primer 3 was used to design the SNP markers, which were converted into KASP markers. When designing the KASP primers, other mutation sites were avoided, and only SNP sites for which primers were successfully designed were considered qualified KASP markers (Zhang et al., 2020). Primers were designed using the following parameters: (1) GC content < 60%; (2) Melting temperature (Tm) between 55 and 61°C; and (3) PCR product size no larger than 120 bp. Primers with FAM- or VIC-tails were synthesized by Sangon Biotech (Shanghai) Co., Ltd. A universal fluorescent tag was added to the 5′ end of the primers F1(FAM): GAAGGTGACCAAGTTCATGCT and F2(VIC): GAAGGTCGGAG. The newly synthesized primers were diluted to 10 μM with 1 × TE buffer (pH 8.0) and then mixed with upstream primer 1: upstream primer 2: downstream universal primer at a ratio of 1:1:3; this mixture was then added to the machine, with 1.25 μL of primer mixture added to every 5 μL of the reaction system. PCR was performed in a total volume of 5 μL containing 1.25 μL of template DNA (50 ng⋅μL–1), 2.5 μL of 2 × KASP Master Mix, and 1.25 μL of primer mix. The membrane of the 96-well PCR reaction plate was sealed, shaken, and centrifuged to ensure that the reaction system was homogeneously mixed; after centrifugation, the PCR reaction was performed using the CFX ConnectTM Real-Time System, Bio-Rad, USA. The cycling program was as follows: 10 min at 94°C; 10 cycles at 95°C for 20 s and 61–55°C for 60 s; 27 cycles at 95°C for 20 s and 55°C for 60 s; and 30 s at 25°C (Wang et al., 2021a). Individual samples were amplified in a 5 μL reaction system in a 96-well plate, and fluorescence detection of the reaction was performed using an Omega Fluorostar scanner; the data were analyzed using KlusterCaller 3.4.1 software, and the assay data were visualized using SNPviewer 2.0 software (Zhang et al., 2020, 2021).
2.4 KASP marker screening, genetic diversity analysis, and fingerprint construction
GenAlEx (version: 6.51b2) software was used to calculate the number of observed alleles (No), number of effective alleles (Ne), observed heterozygosity (Ho), expected heterozygosity (He), and Shannon’s diversity index (I) (Peakall and Smouse, 2012). PowerMarker 3.25 software was used to calculate the polymorphism information content (PIC) and minor allele frequency (MAF) (Liu and Muse, 2005). Neighbor-joining (NJ) trees were constructed based on candidate core and core SNP markers using MEGA 7.0 software. SNP-typing data were imported into STRUCTURE (version 2.3.1) software for analysis, with the K set from 1 to 20, MCMC set to 100,000, and length of the burn-in period set to 500,000; analyses were performed 10 times for each K-value (Falush et al., 2003). Structure Harvester was used to determine the optimal K-value (Evanno et al., 2005). The Q-value matrix was exported using CLUMPP 2.0 software and visualized using the R package poppelper (Jakobsson and Rosenberg, 2007). GenALEX (version: 6.51b2) software was used to calculate the genetic distance matrix and generate a PCA plot (Peakall and Smouse, 2012). Fingerprints were constructed based on candidate core SNP markers and core SNP markers using Perl scripts (Yang et al., 2022).
3 Results
3.1 Whole-genome resequencing data
In this study, 60 strains of G. frondosa were re-sequenced, and approximately 1.4 Gb of clean data per sample were obtained (Table 2 and Supplementary Table 1). After removing the low-quality sequences, a total of 575,355,502 high-quality reads were generated, and the average GC content of the Clean Data was 45.78%; the mean Q20 value was 96.53%, and the mean Q30 value was 91.29%. The size of the genome was 39.28 Mb; the mean genome coverage was 91.7%, the mean depth was 36 ×, and the average mapping rate of reads was 89.24%. The start and stop positions of the paired-end sequences on the reference genome were revealed, and the size and length distribution of the insert fragments after the fragmentation of the sample DNA was normal. The peak length of the insert fragments generally ranged from 300 to 400 bp, indicating that there were no abnormalities in the constructed libraries.
3.2 SNP type and distribution
The genomic variants of all the samples were filtered using GATK, and a collection of high-quality SNP variants of G. frondosa containing 2,125,382 SNP loci was obtained. The number of SNPs identified in each sample averaged 761,106, and the highest number of SNPs were identified in the Gf-4 strain (904,064 SNPs); the lowest number of SNPs were identified in the Gf-45 strain (730,920 SNPs). Further statistical analysis revealed that the number of SNPs per sample for Transitions was 599,093, the number of SNPs per sample for Transversions was 162,013, and the average Ts/Tv was 3.70. The number of SNPs for the heterozygosity type was 376,290, and the number of SNPs for the homozygosity type was 218,424. The C/T and G/A mutation types were the most common. Functional annotation results showed that these SNP mutations mainly occurred in the upstream region and coding sequence (CDS) region of genes, indicating that most of the high-quality SNP variants in G. frondosa were concentrated in the upstream regulatory sequences and CDSs. SNPs within the CDS region could be further categorized into synonymous mutations, non-synonymous mutations, termination codon gain, and termination codon deletion; the number of synonymous and non-synonymous coding mutations accounted for 62.19% and 36.60% of all mutations, respectively (Supplementary Table 2).
3.3 Population genetic analysis based on high-quality SNPs
Phylogenetic trees provide insights into the evolutionary relationships, genetic distances, and evolutionary history of species. To clarify genetic relationships and the degree of differentiation among G. frondosa strains, an NJ analysis of 60 G. frondosa germplasm resources was conducted based on the obtained 829,488 high-quality SNP loci. These strains could be divided into two populations: Pop1 (the green branch) and Pop2 (the blue branch). Pop1 comprised the most strains (41) (Figure 1A). Population structure analysis of G. frondosa germplasm resources was performed using filtered high-quality SNPs (Supplementary Figure 1). The CV error was lowest when K = 5 (Figure 1C), and the lowest cross-validation value was 0.15424. The 60 G. frondosa germplasm resources could be further divided into five subgroups (Figure 1D). The three wild strains Gf-29, Gf-30, and Gf-40 from Shandong Province were nested within Group 3, and this was consistent with their observed geographical distributions.
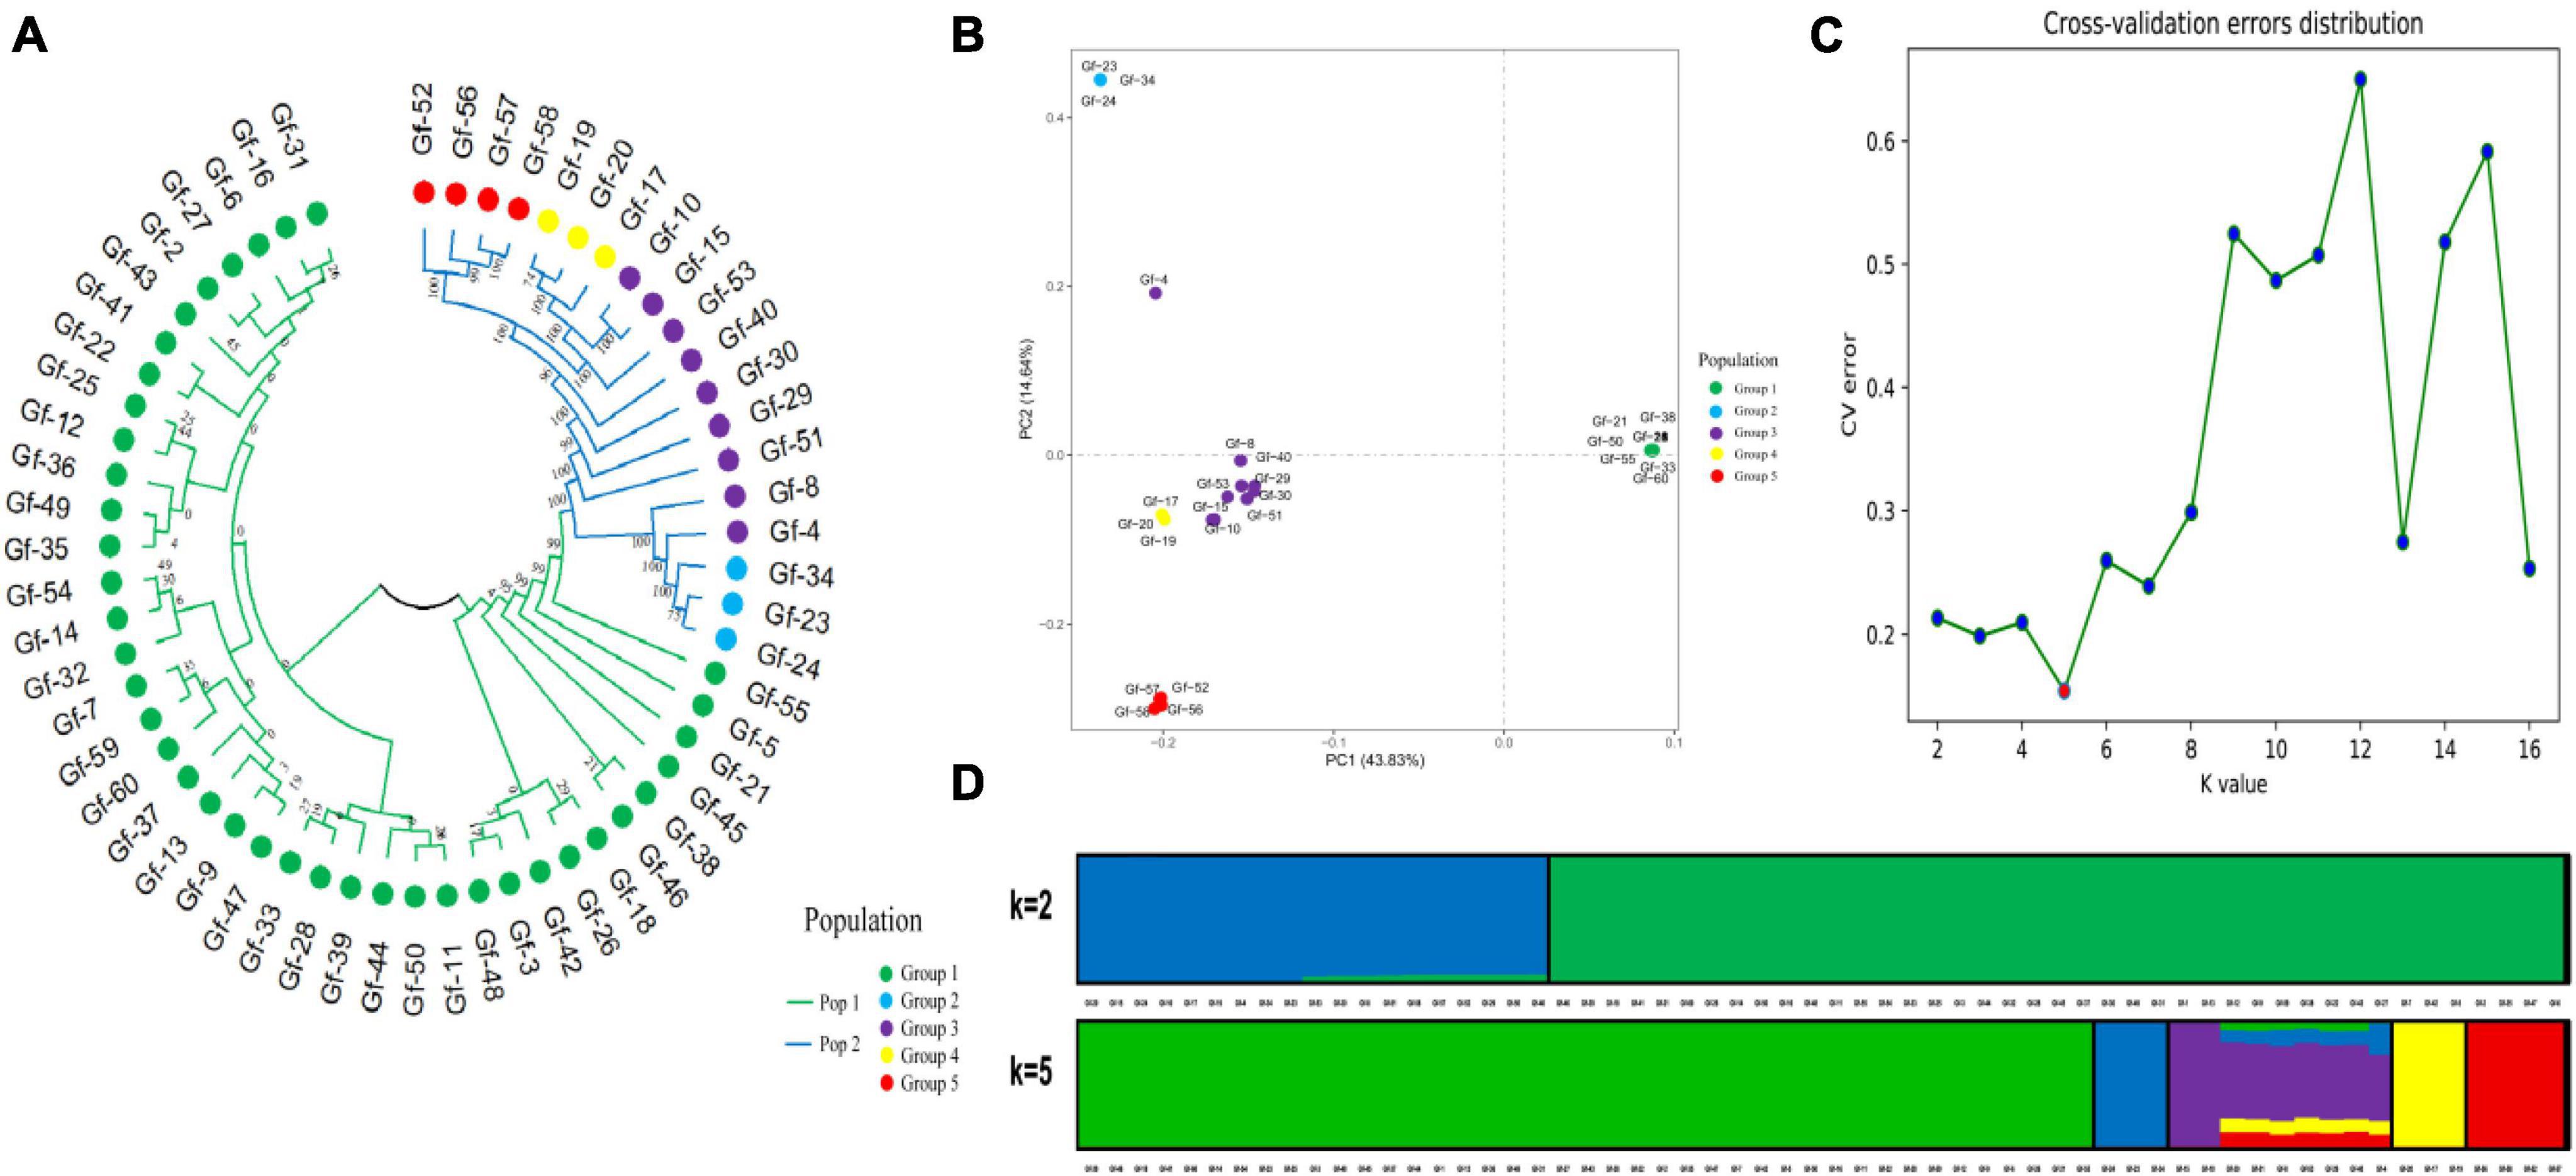
Figure 1. Population genetic analysis of 829,488 SNP loci from 60 G. frondosa. (A) Neighbor-joining phylogenetic tree using 829,488 SNPs in 60 G. frondosa. (B) Principal component analysis of the 60 G. frondosa with 829,488 SNPs. (C) Cross-validation errors distribution. (D) Population structure of the 60 G. frondosa using 829,488 SNPs based on the Admixture output for K = 5.
The first principal component and the second principal component explained 43.83% and 14.64% of the variation in the data, respectively (Figure 1B). and the 60 germplasm resources of G. frondosa could be divided into two categories according to the first principal component; the second population could be further divided into four subgroups according to the second principal component, and Group 3 and Group 4 were closely clustered, which was consistent with the results of the cluster analysis and population structure analysis. Different degrees of variation were observed in the eight aerospace mutagenic strains and the original strain Gf-31, but they were nested within subgroup Group 1; the three cultivated strains Gf-31, Gf-9, and Gf-37 introduced from Japan were nested within subgroup Group 1, indicating that strains from the same country were closely related and that the results of our cluster analysis were reliable.
3.4 Development of core collection
To provide a subset of representative germplasm collections for the selection of parents in G. frondosa breeding, we developed a core collection of G. frondosa germplasm collections using the 829,488 high-quality SNPs. The core collection was selected using Core Hunter software with the parameters set at 19 different values (5%, 10%, 15%, 20%, 25%, 30%, 35%, 40%, 45%, 50%, 55%, 60%, 65%, 70%, 75%, 80%, 85%, 90%, and 95%). Genetic diversity indicators for the core collection are important for assessing the level of genetic diversity of the selected core collection. The core collection included 18 representative G. frondosa germplasm resources, which captured 30% of the total number of original germplasm collections with 100% allele coverage. The observed number of alleles (Na), effective number of alleles (Ne), Shannon’s information index (I), observed heterozygosity (Ho), expected heterozygosity (He), polymorphic information content (PIC), and Nei’s genetic diversity (H) were 1.9995, 1.5773, 0.5239, 0.3814, 0.3471, 0.2805, and 0.3471, respectively (Supplementary Table 3). The results of principal component analysis and cluster analysis showed that the core collection constructed in this study was basically consistent with the distribution of the original germplasm (Wang et al., 2021b), indicating that the core collection constructed under a 30% sampling ratio was representative of the genetic variation in the original collection. Principal component analysis was used to assess the core collection population, the results revealed that representative germplasms are present within all five subgroups, with green representing the core collection population and red representing the non-core collection population (Figure 2). This study will aid future innovation, as well as the utilization of G. frondosa germplasm resources, including the efficient selection and breeding of G. frondosa.
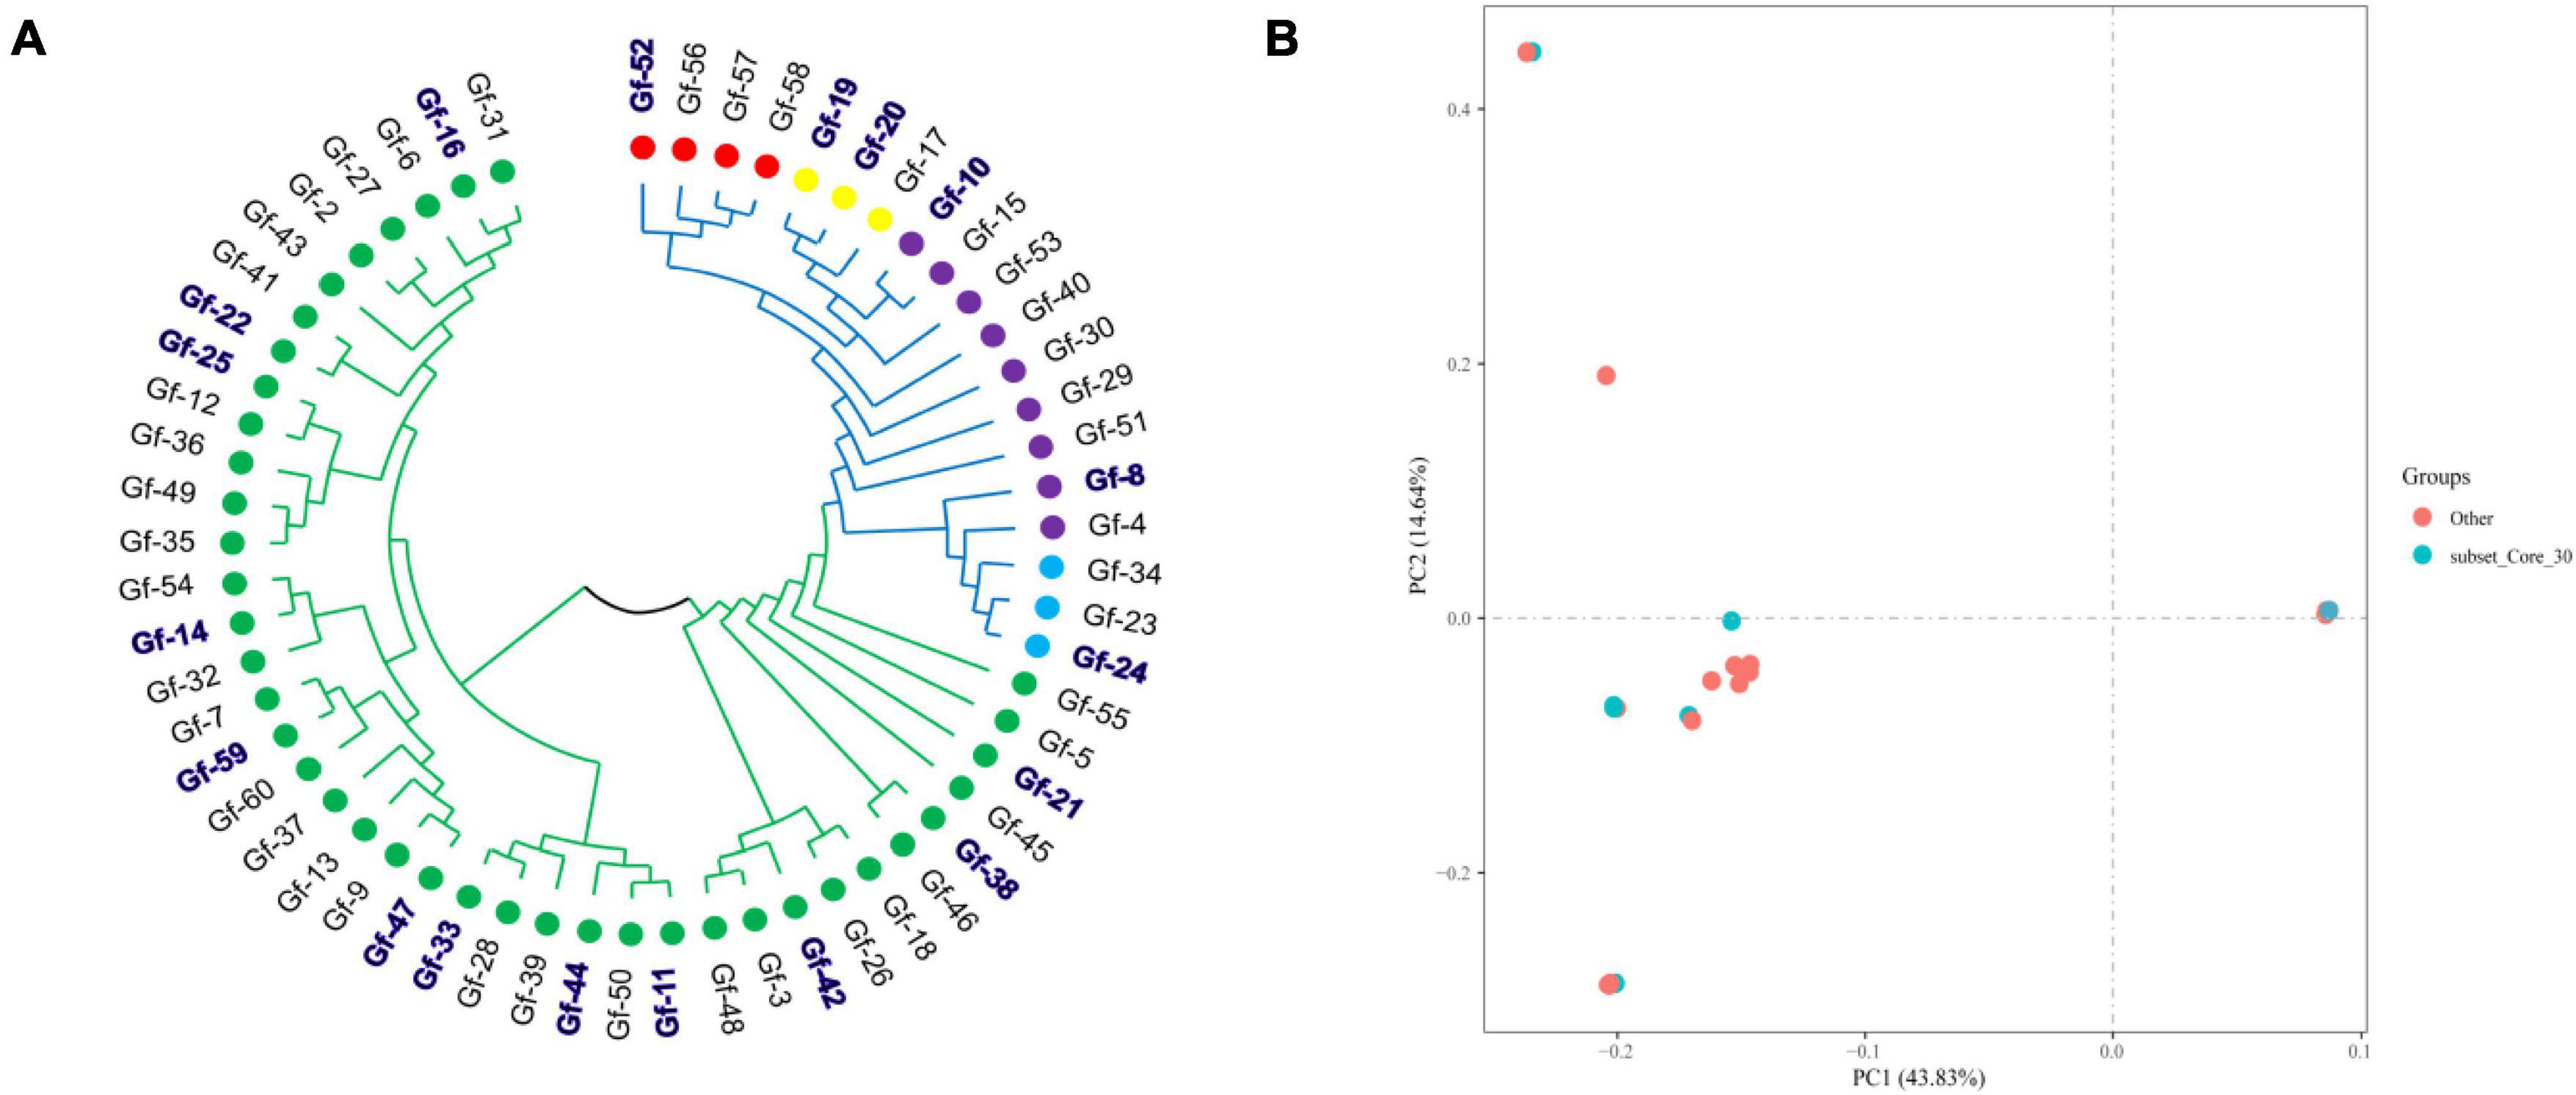
Figure 2. The developed core collection based on 829,488 high-quality SNPs using Core Hunter. (A) Distribution of the core collection in the cluster analysis results; the blue and bold area represents the core germplasm resource population. (B) The core collection population was evaluated using PCA.
3.5 KASP marker design and screening
A set of standard processes based on the SNP variant database, including SNP filtering, KASP marker design, fingerprint construction, and population genetic analysis, were implemented to develop KASP markers. First, SNP sites conserved in sequences greater than 50 bp before and after the DNA strand on the chromosome were extracted and filtered to obtain 16,594 SNP sites; GATK software was used to obtain high-quality SNPs with various criteria (average coverage depth > 5 ×, MAF > 0.05, AverageQ > 30, minimum integrity > 0.9, and the SNP is a double-allele variant), which yielded 3,477 SNP sites. Sequences 100 bp upstream and downstream of the SNP markers were aligned to the reference genome using BLAST software (version 2.10.1+). Markers located at multiple positions in the alignment were removed, which yielded 2,916 SNP sites. Markers with a PIC > 0.20 were retained, and this yielded 1,706 high-quality SNP locus variants (Supplementary Table 4).
The primers for amplifying the SNP markers were designed using Primer 3 software and then transformed into KASP markers; a total of 1,473 markers were successfully designed, with a transformation rate of 86.34% (Supplementary Table 5). A total of 772 SNP markers were identified in the exon region, which accounted for 52.4% of all KASP markers (Supplementary Table 6), 260 SNP markers were distributed in the intron region, which accounted for 17.7% of all KASP markers; and 206 SNP loci were distributed in the gene regulatory region 2 kb upstream and downstream of the gene, which accounted for 14% of all KASP markers (Figure 3).

Figure 3. Distribution of SNP markers; different colors indicate the percentage of regions containing markers.
A combination of physical location, PIC, MAF, observed heterozygosity, and Missing values of G. frondosa genotypes were used to identify candidate core SNPs. Based on the KASP analysis of 60 G. frondosa germplasm resources, KASP genotyping experiments were carried out on 772 SNP markers distributed in the exon region, and 50 high-quality candidate core SNPs were obtained; these candidate core SNP markers can be used to distinguish among G. frondosa populations (Supplementary Table 7).
According to the saturation curve analysis of marker identification efficiency, 12 core markers with high detection rates and high polymorphisms that could distinguish all varieties in this experiment were selected. The PIC values of the 12 core SNP markers were in the range of 0.269 to 0.375, with an average value of 0.337, and 10 out of the 12 core markers had PIC values greater than 0.3. The average MAF value of the 12 markers was 0.343 with a range of 0.2–0.492. The average observed heterozygosity was 0.563, and 83% of the core SNP markers had missing values < 0.10, indicating that the 12 core SNP markers were sufficiently polymorphic (Figure 4). Detailed information on the 12 core SNP markers (marker name, location, variant type, and primer sequences) is provided in Table 3.
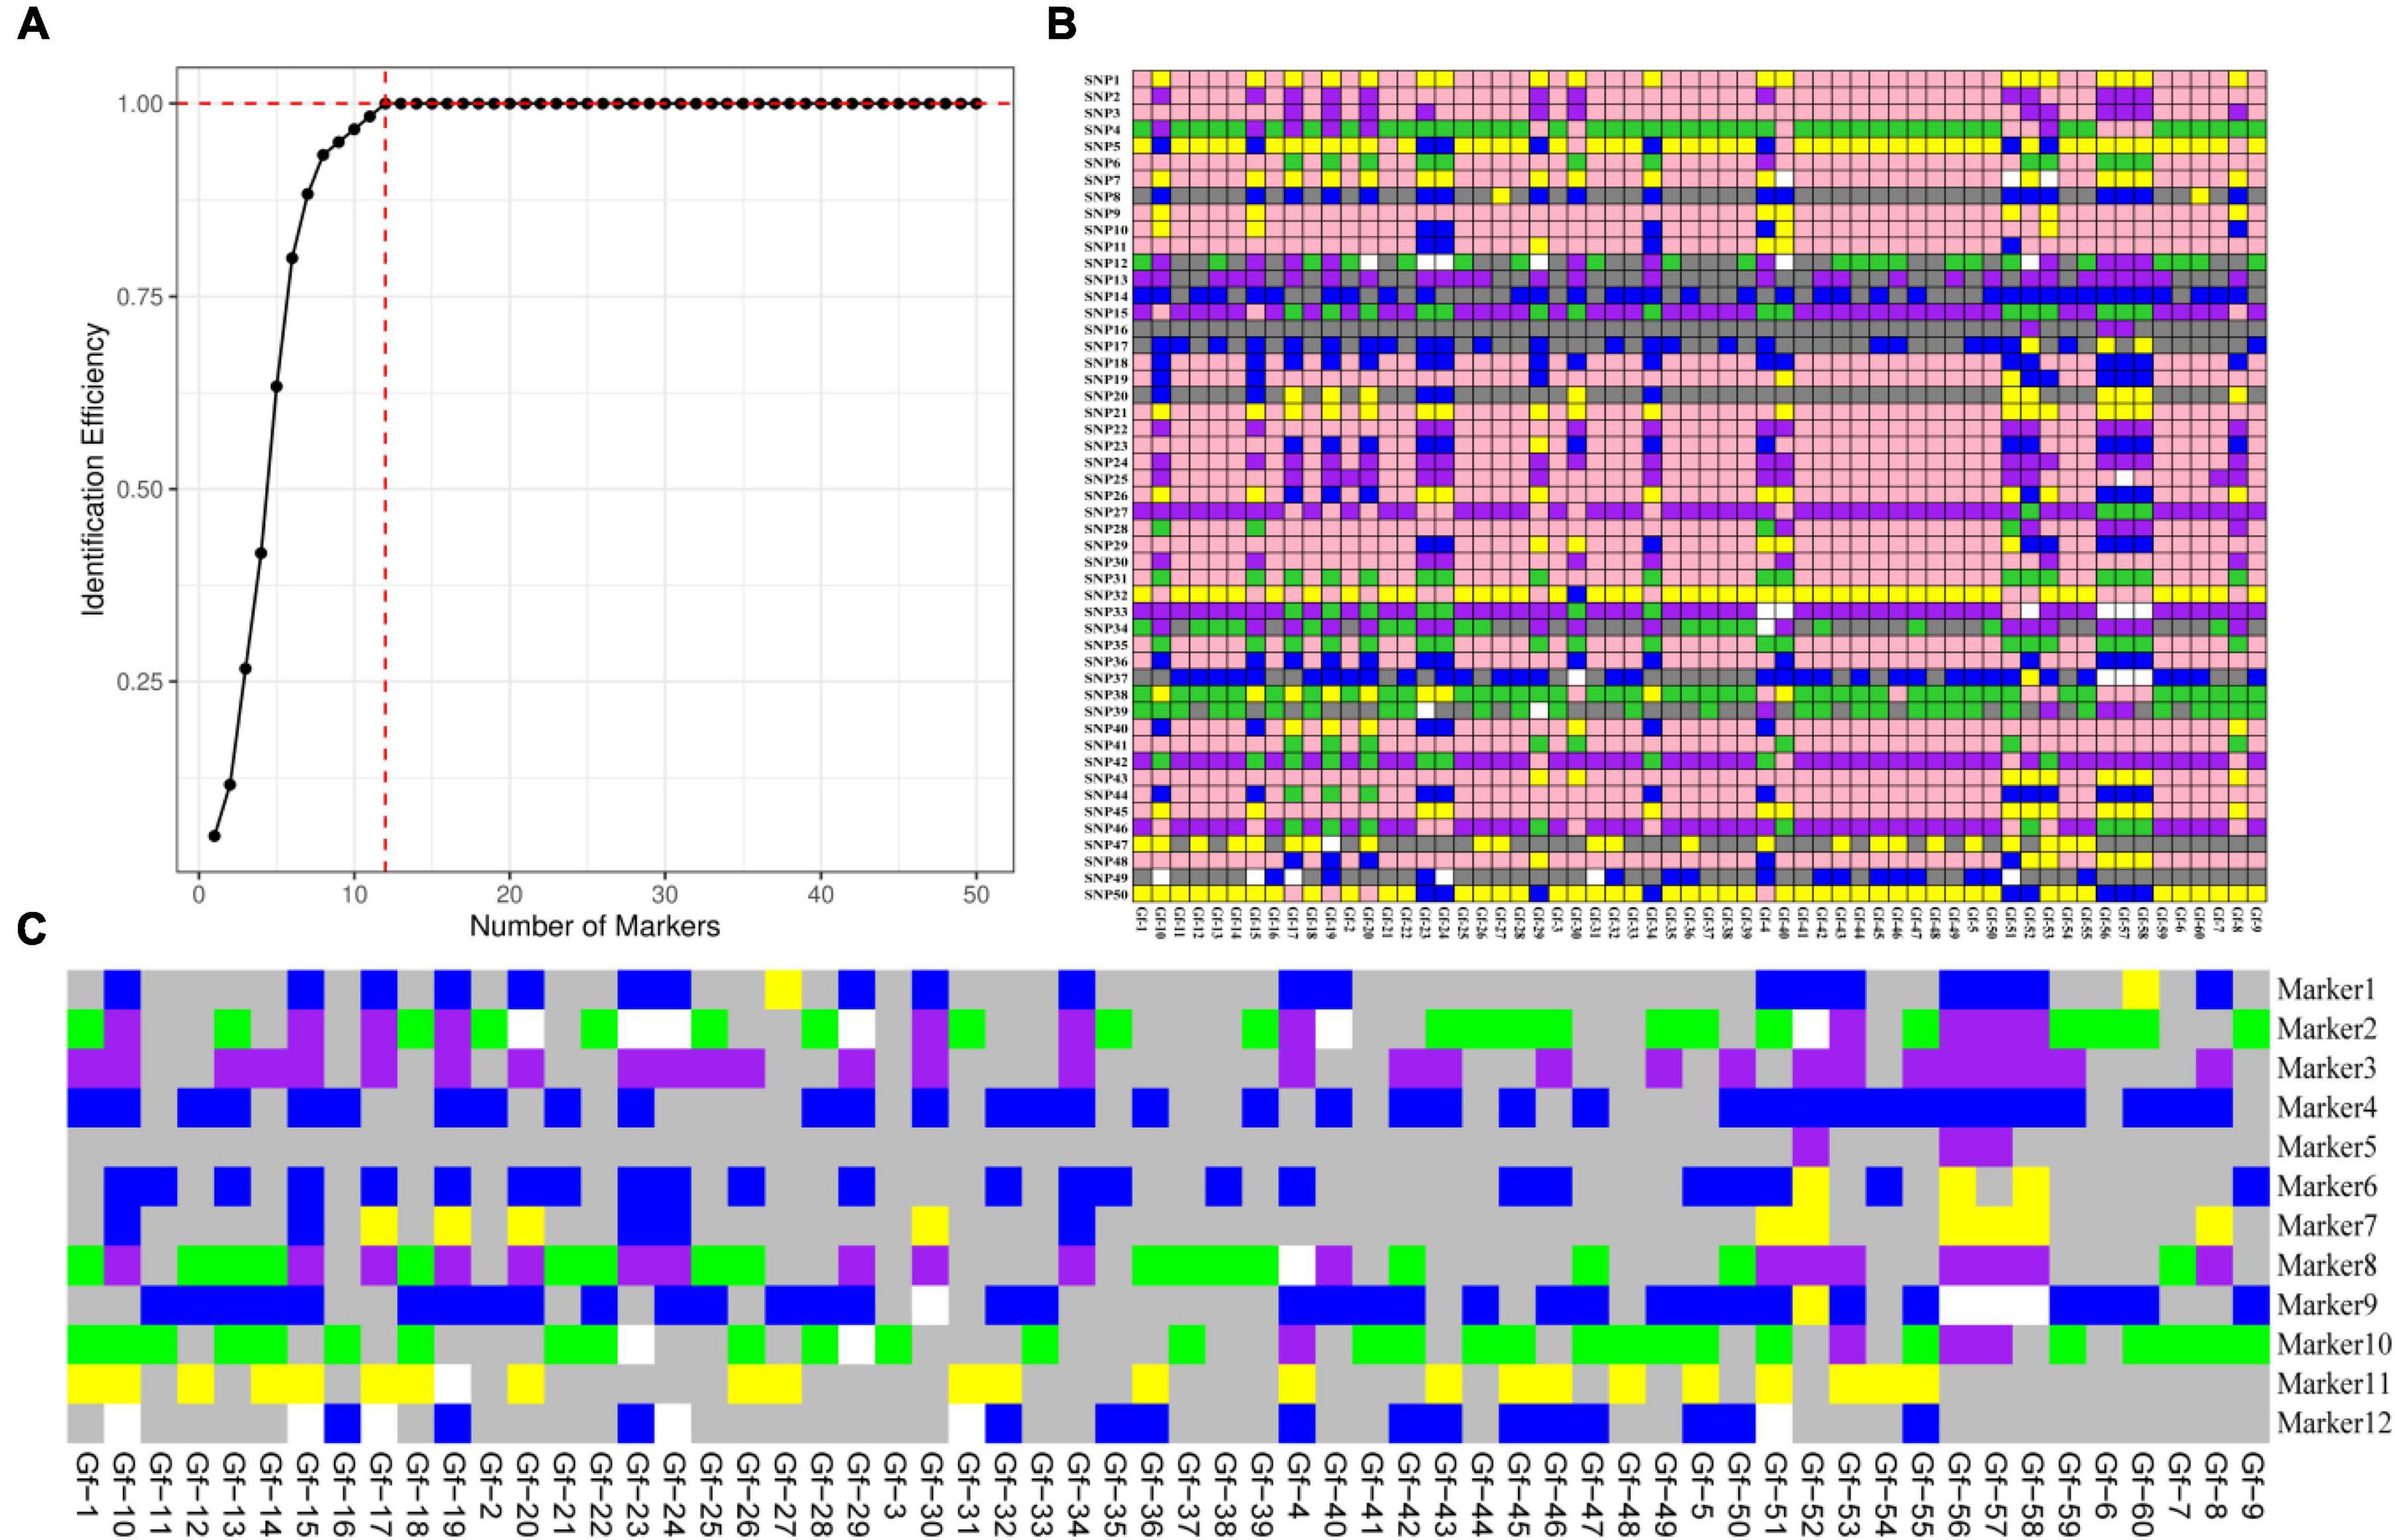
Figure 4. Analysis of genetic diversity indexes based on a core SNP marker set of 60 G. frondosa germplasm resources. (A) Polymorphic information content (PIC). (B) Minor allele frequency (MAF). (C) Observed heterozygosity. (D) Occurrence of missing values.
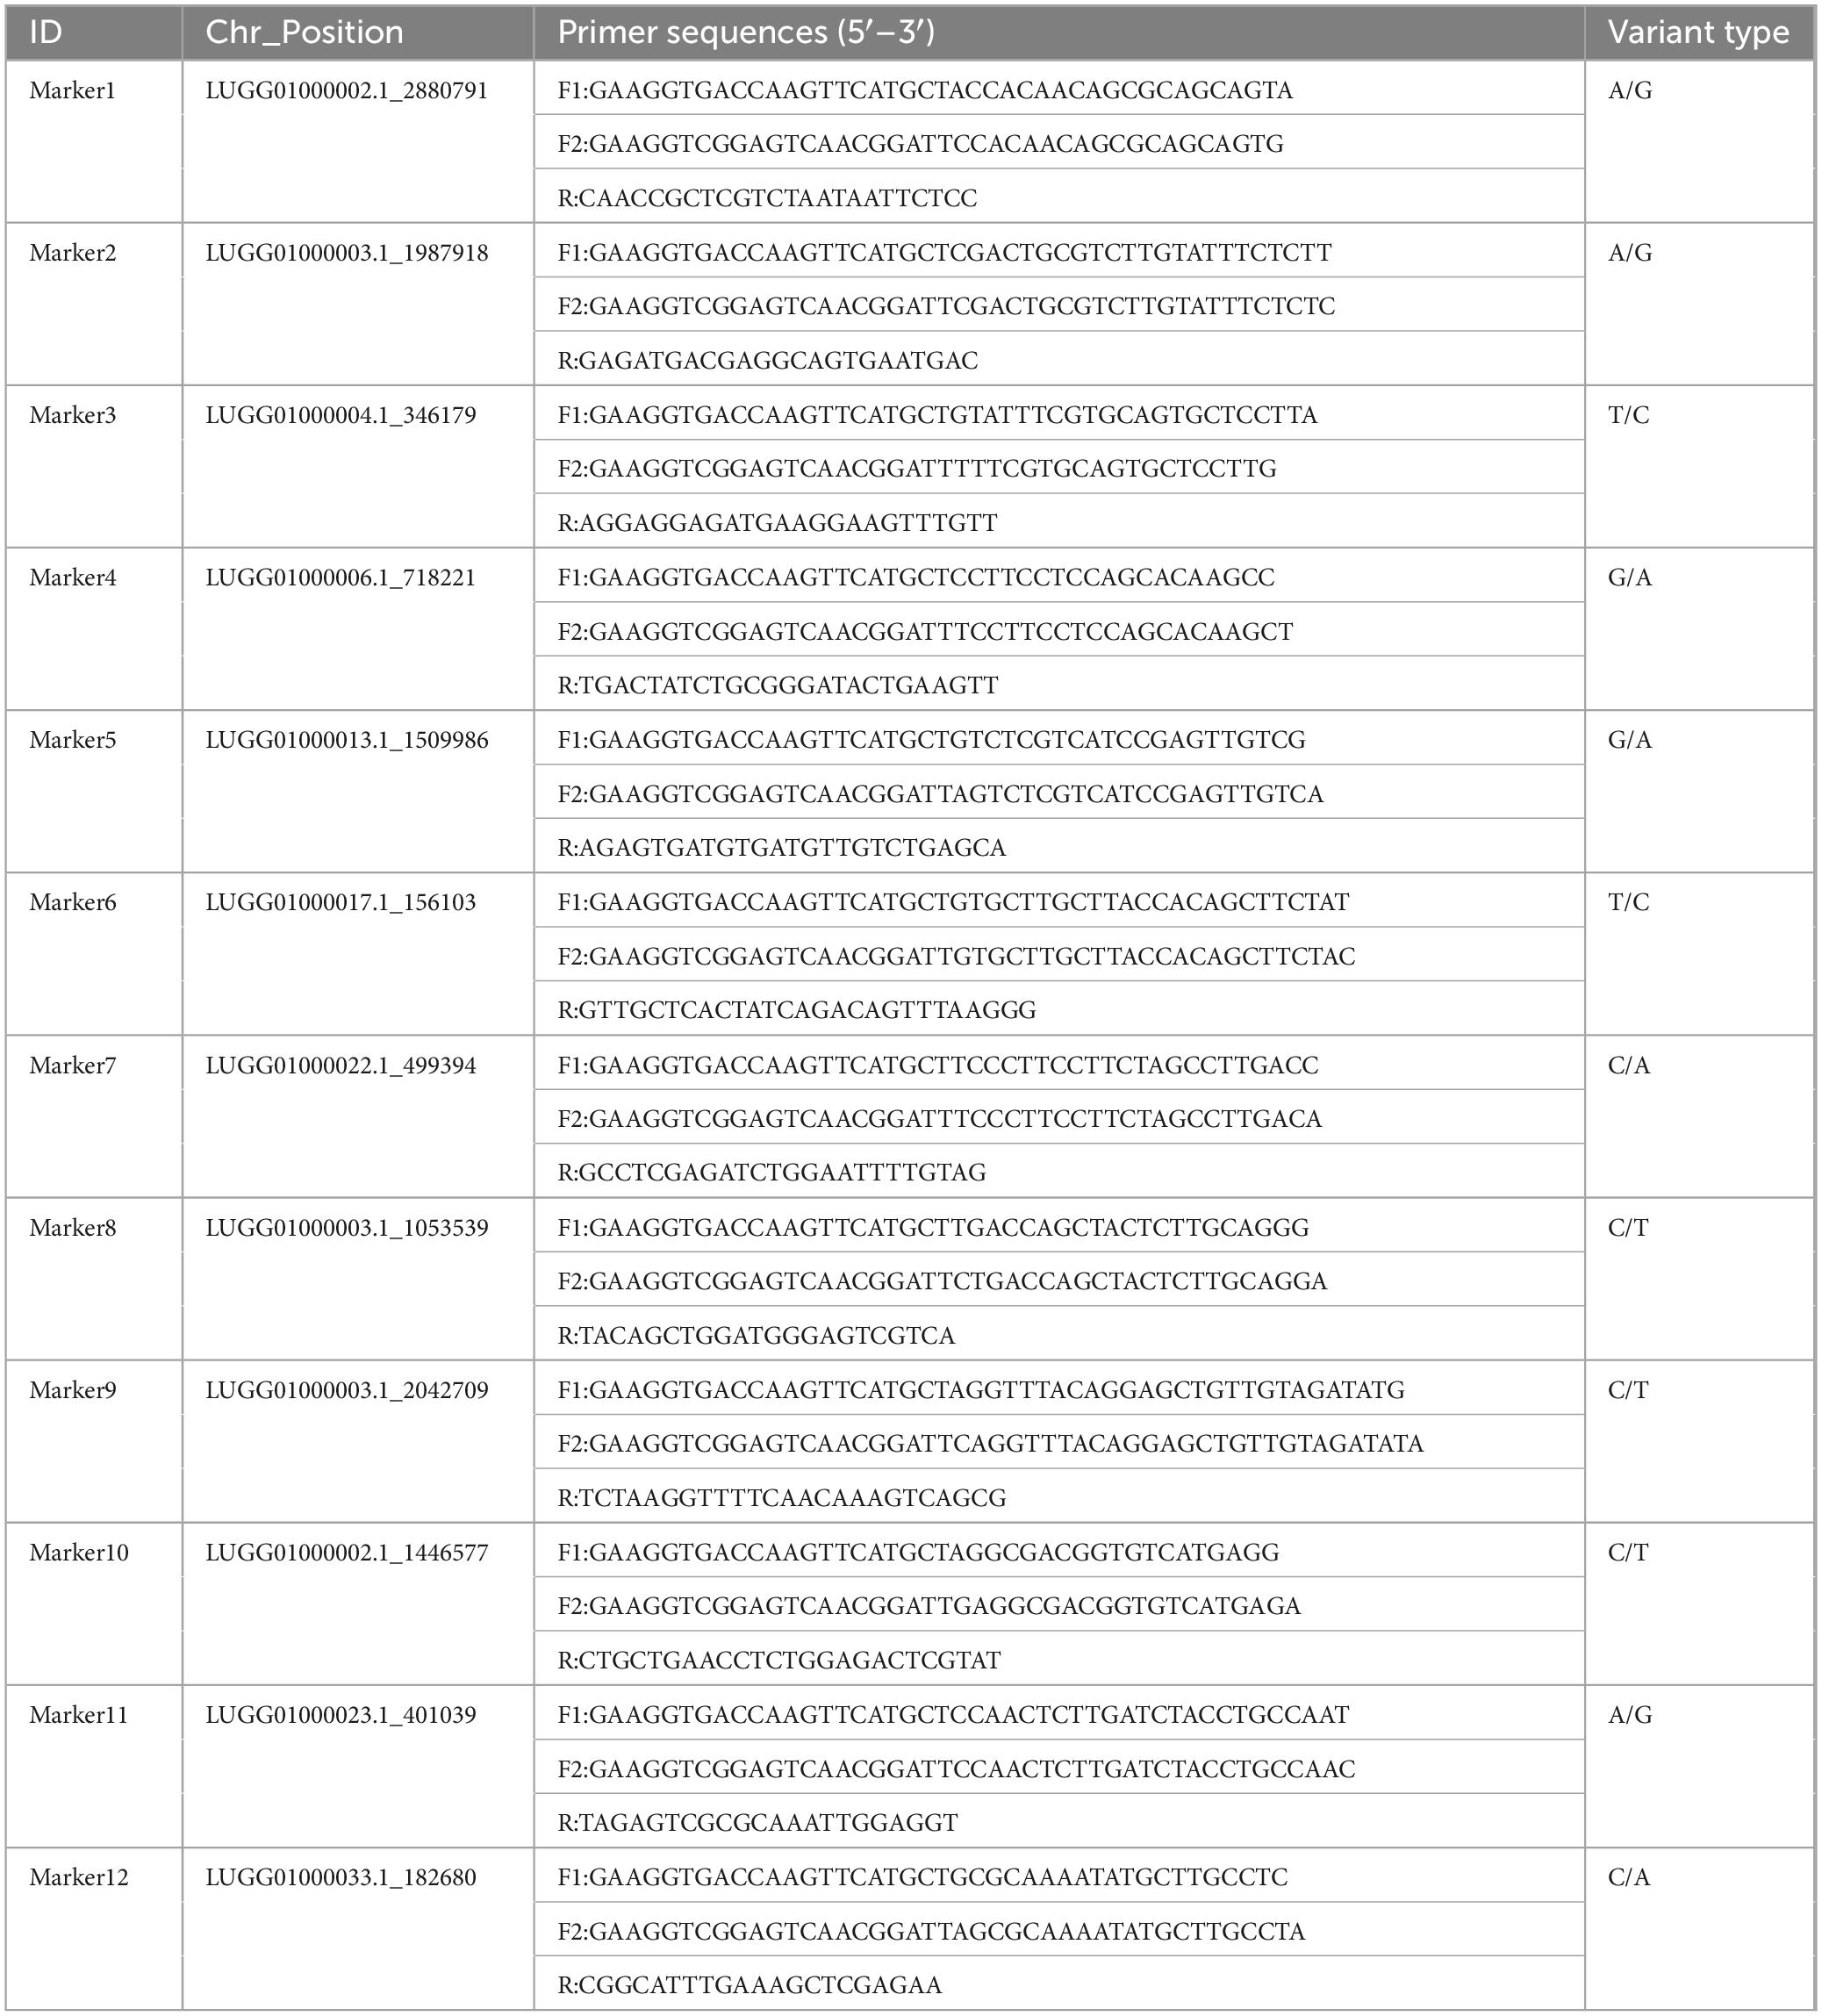
Table 3. KASP primer names, positions, variant types, and sequences for the 12 core SNP markers.
3.6 Genetic diversity analysis based on KASP markers and fingerprint construction
To further evaluate the discriminative ability of candidate core and core SNP markers in G. frondosa germplasm resources, 50 candidate core SNP markers and 12 core SNP markers were used for population genetic diversity analysis (Figure 5 and Supplementary Figures 2, 3). Assessment of the relationships among the 60 G. frondosa germplasm resources using STRUCTURE showed that the optimal K-value was 2, which divided the 60 G. frondosa germplasm resources into two populations using either the 50 candidate core SNPs or the core SNP marker set. PCA and the NJ trees based on the genotyping data were consistent with the results of the population genetic structure analysis when the two SNP marker sets were used. The 50 candidate core markers and 12 core markers, based on the first principal component, can both divide the 60 Grifola frondosa strains into two major groups: Pop1 (41) and Pop2 (19) (Figure 5C). The results thus indicate that the core SNP marker set was highly representative, and its discriminatory power was similar to that of the 50 candidate core SNPs. Based on the 50 candidate core SNPs and the 12 newly developed core SNP markers, we constructed fingerprints of 60 G. frondosa germplasm resources (Figure 6), our findings highlight the efficiency and accuracy of genotyping with the core SNP markers. SNP fingerprinting provided an accurate, rapid, convenient, and efficient method for the identification of G. frondosa germplasm resources.
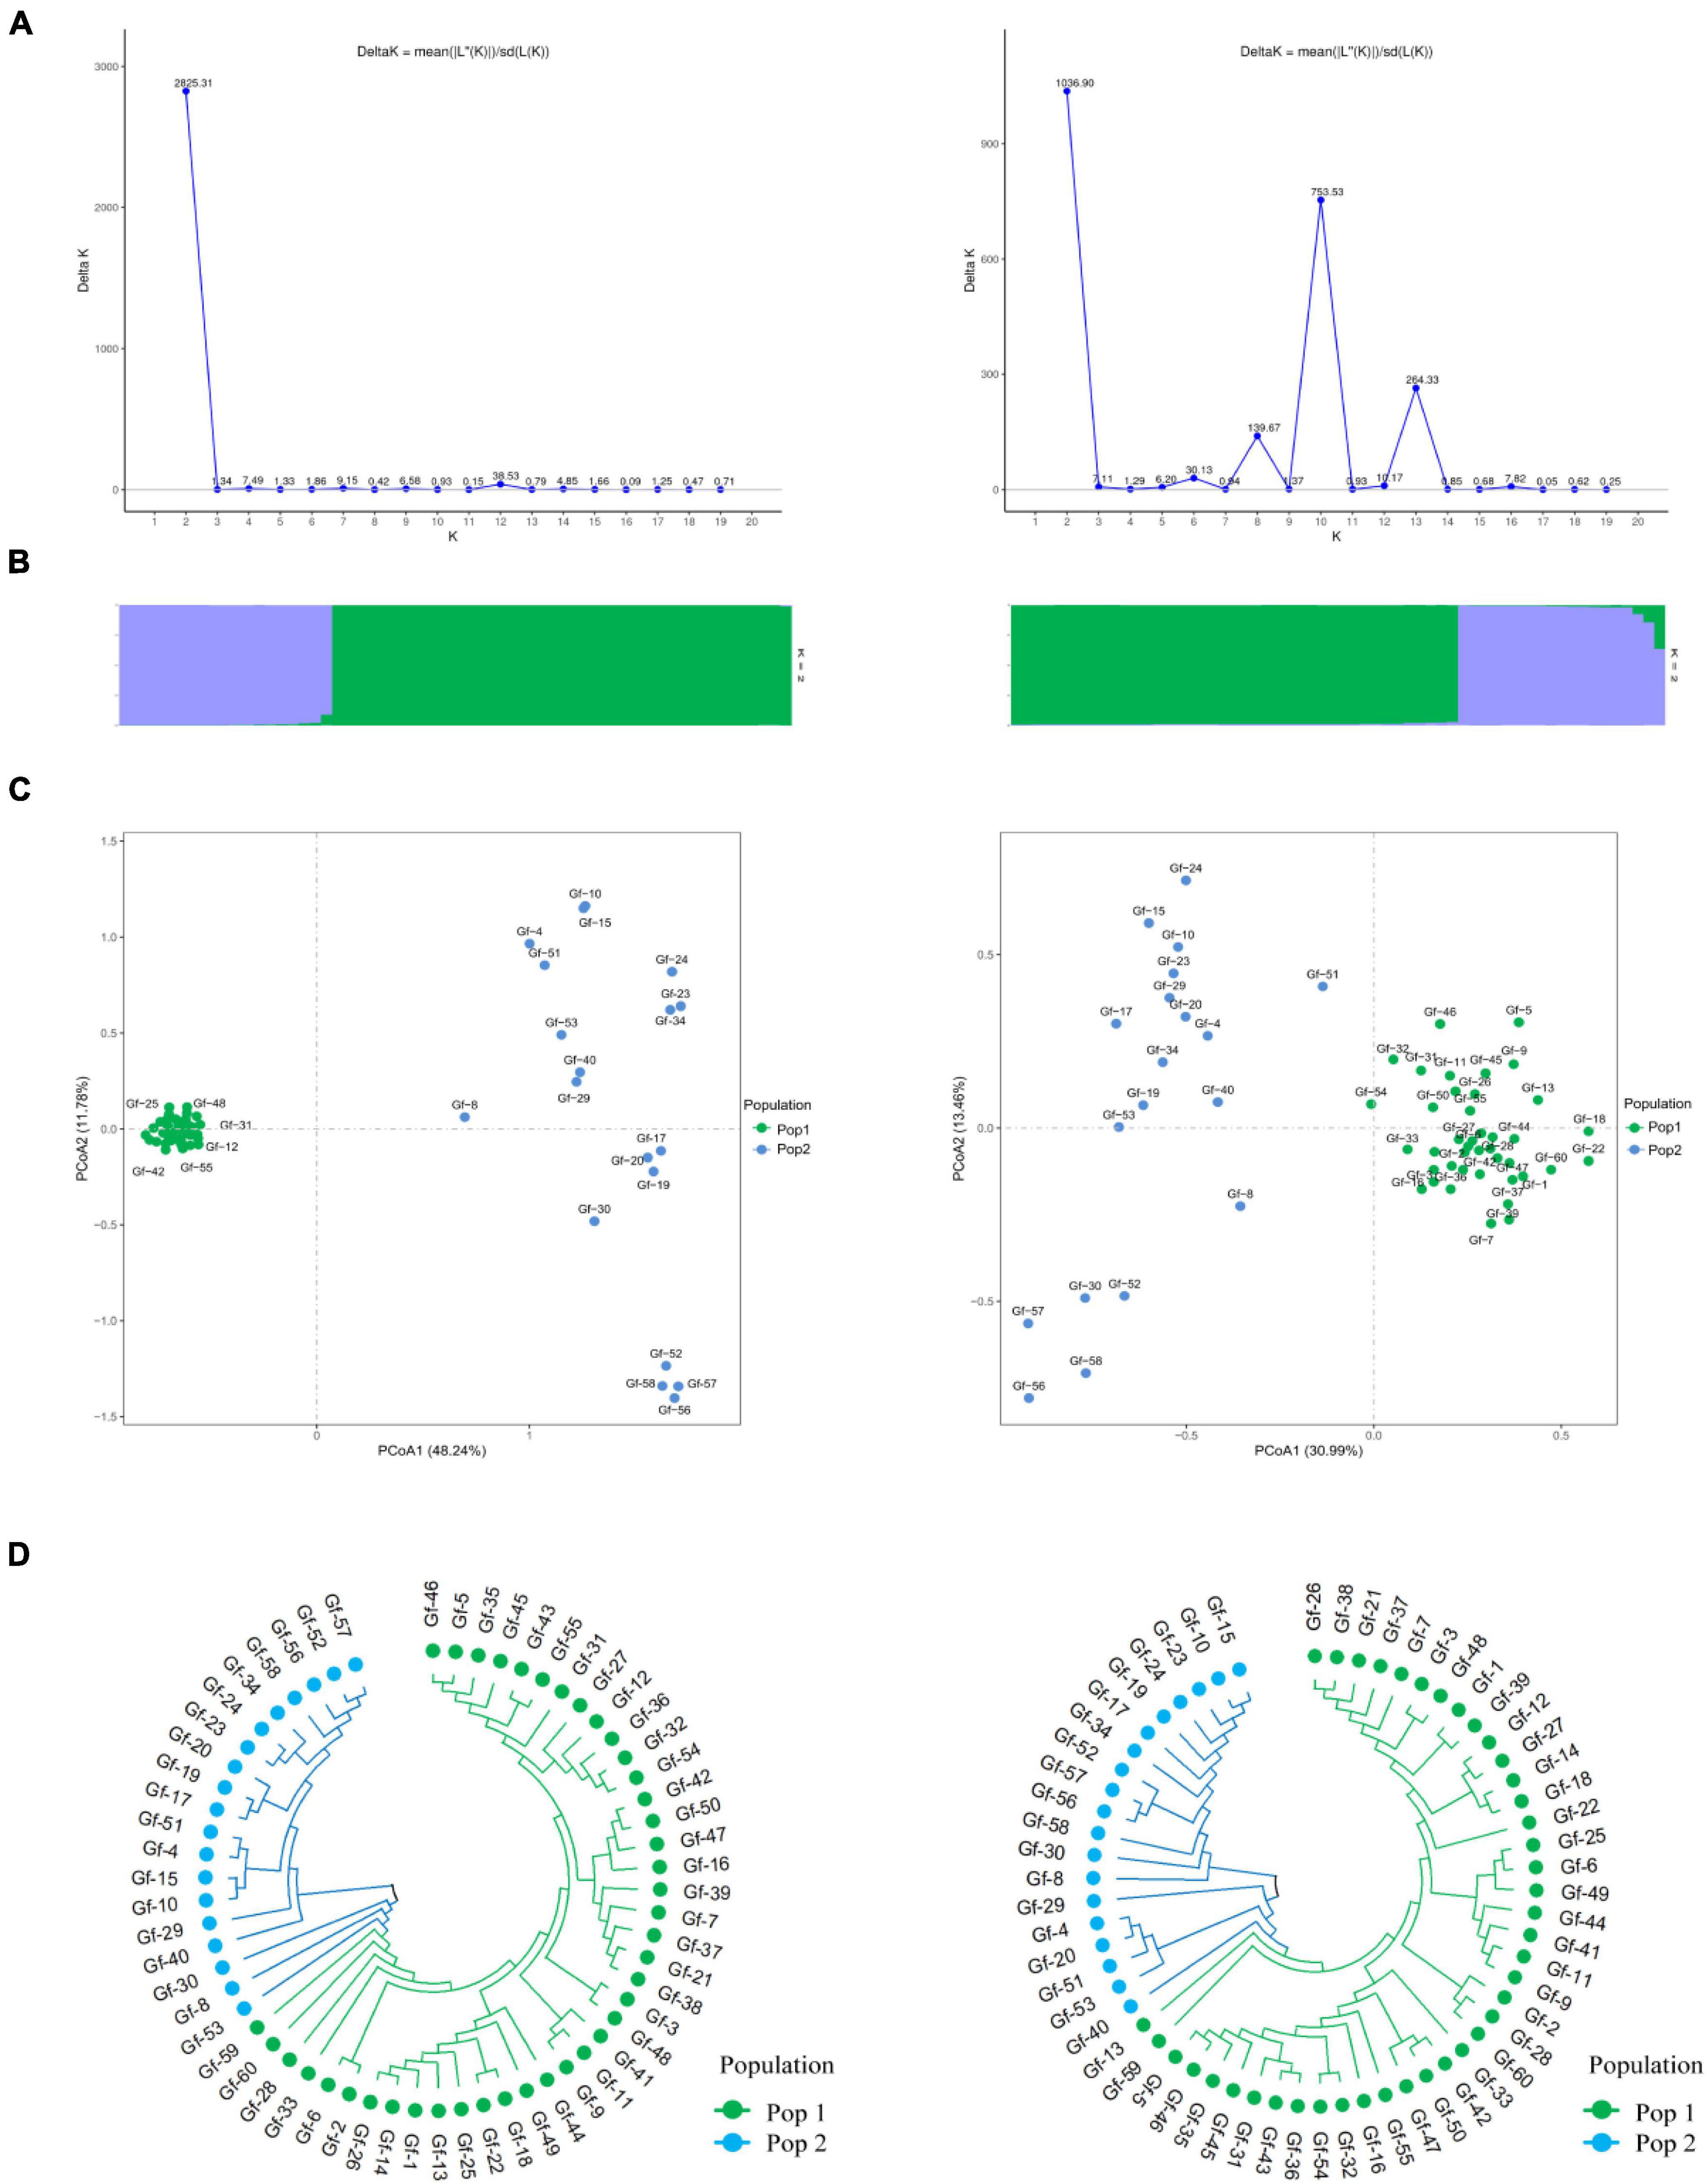
Figure 5. Population diversity analysis of 60 G. frondosa germplasm resources using 50 candidate core SNPs (left) and 12 core SNPs (right). (A) Delta K values. (B) Population structure of the germplasm resources inferred at K = 2. (C) Principal component analysis (PCA) of 60 G. frondosa germplasm resources. (D) Neighbor-joining tree showing a dendrogram of 60 G. frondosa germplasm resources. Green and blue color indicated two different populations.
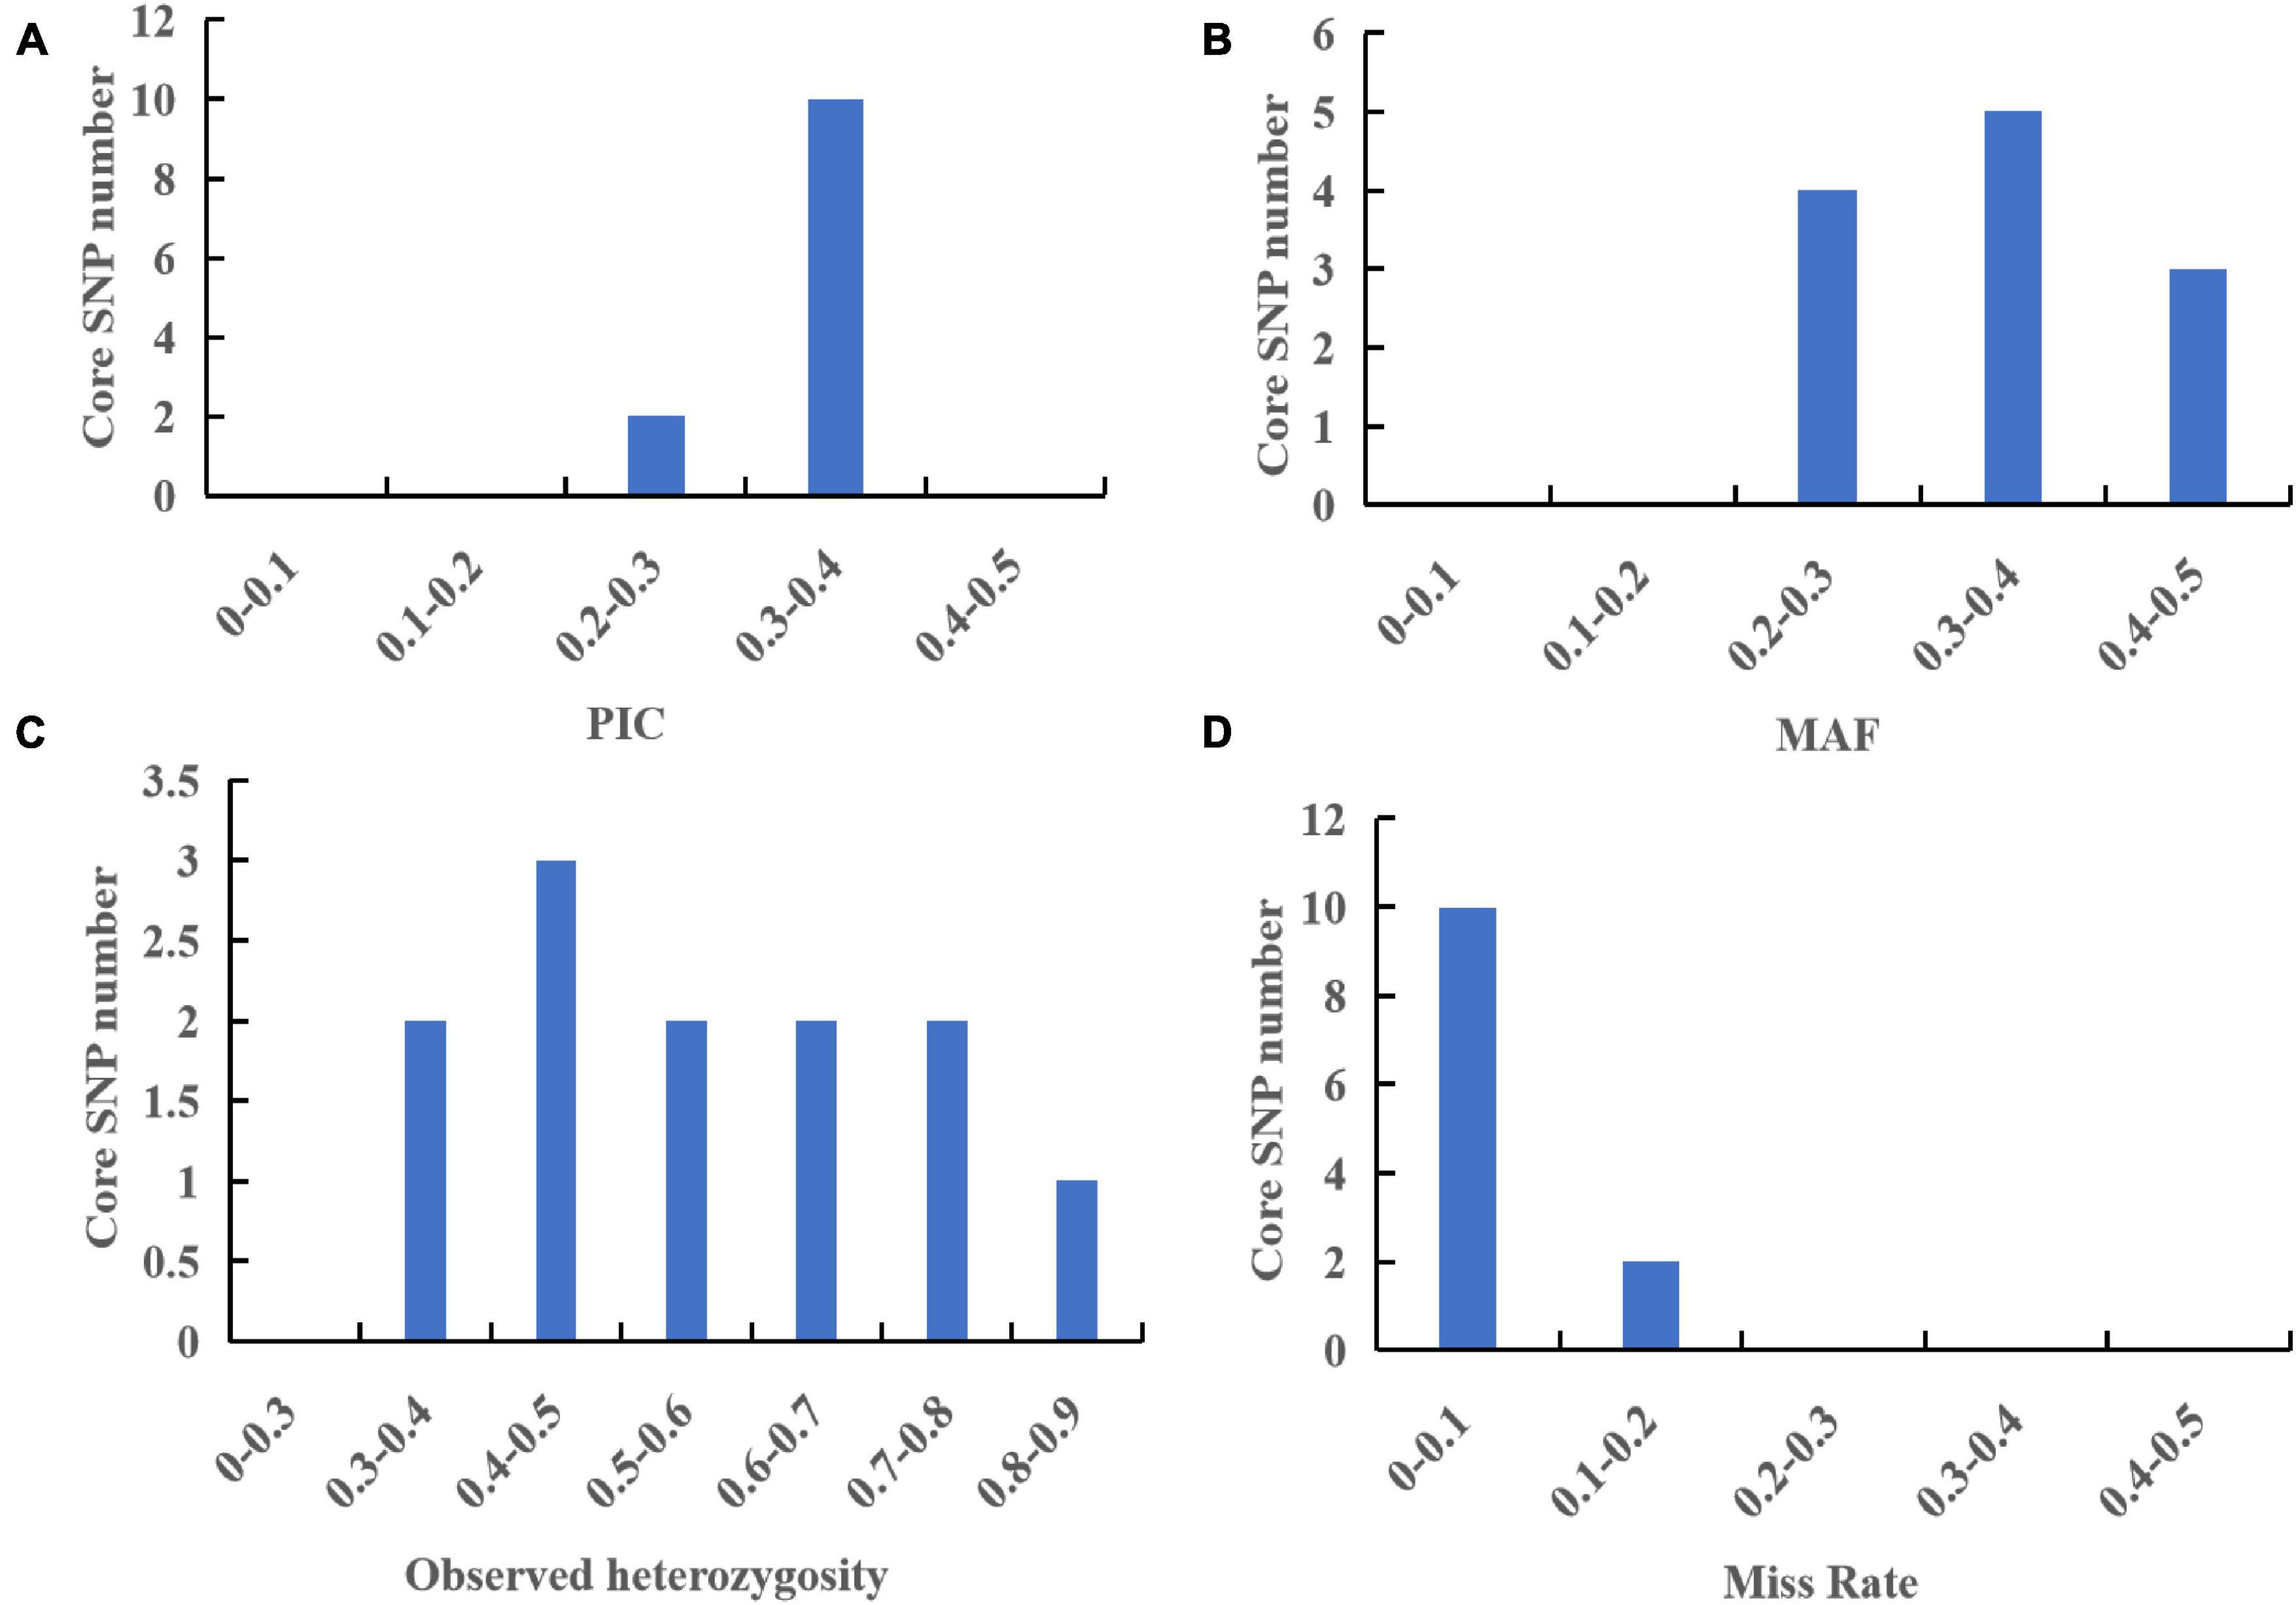
Figure 6. (A) Saturation curve of marker identification efficiency. The horizontal axis indicates the number of markers, and the vertical axis indicates the identification efficiency. (B) Fingerprint construction based on 50 candidate core SNP makers. (C) Fingerprint construction based on 12 core SNP makers; the horizontal axis shows samples, and the vertical axis shows molecular markers; pure genotypes C/C, A/A, T/T, G/G are shown in yellow, green, blue, and purple respectively; the heterozygous genotype in the core marker is gray; the pink represents the heterozygous genotype in the non-core marker; and the deletion genotype is white.
4 Discussion
Germplasm resources are essential for the breeding of edible mushrooms, and the quality of the varieties produced by breeding largely depends on studies of the genetic diversity of these germplasm resources. Techniques for evaluating the genetic diversity of edible mushrooms germplasm resources mainly include morphological markers, cytological markers, biochemical markers, and molecular markers (Wang et al., 2019; Mahmoodi et al., 2021). Molecular markers are nucleotide sequence variants that provide direct indicators of genetic polymorphism at the DNA level. A range of DNA molecular markers, including ITS, RFLP, RAPD, AFLP, ISSR, SRAP, and SCAR markers, have been used for the characterization of G. frondosa germplasm resources (Zhang et al., 2009; Wen et al., 2011; Yang et al., 2016; Wang et al., 2019). No studies have resequenced G. frondosa germplasm resources nor developed SNP markers based on resequenced data.
In this study, 60 G. frondosa germplasm resources were re-sequenced, and a total of 84 Gb of re-sequencing data were obtained, with an average sequencing depth of 36 ×. After mutation detection and filtering, 829,488 high-quality SNP loci were obtained for subsequent analysis. Phylogenetic analysis, PCA, and population structure analysis all showed that the 60 germplasms could be divided into two populations and five subgroups, which is consistent with the results of previous studies. Yang et al. used RAPD and ISSR molecular markers to analyze the genetic diversity of domestically cultivated G. frondosa strains and divided 40 G. frondosa strains into five subgroups (Yang et al., 2016). Wang et al. analyzed the genetic diversity of 42 G. frondosa strains by ISSR and SRAP molecular markers, and divided them into 6 groups, which provided a basis for parent selection in hybrid breeding at molecular level (Wang et al., 2019). Phylogenetic analysis revealed that three of the wild strains, Gf-29, Gf-30, and Gf-40, were nested within Group 3, which has low genetic diversity. This might stem from the proximity of the collection sites of the wild strains. The three cultivated strains Gf-31, Gf-9, and Gf-37 introduced from Japan were nested within Group 1, suggesting that strains from the same country were more closely related. The whole-genome re-sequencing data provided new and more comprehensive evidence for the classification of G. frondosa, clarified the genetic relationships among G. frondosa in China, and provided substantial and valuable genomic resources, which has implications for the improvement of G. frondosa germplasm and molecular breeding. Based on the 829,488 high-quality SNP loci obtained by genome-wide resequencing, 18 representative core germplasms were screened by Core Hunter software. According to the genetic diversity index, PCA, and cluster analysis, the core collection comprised a representative sample of the original germplasm population.
We used a high-throughput SNP genotyping platform to develop a core set of 50 candidate SNP markers from the resequencing data of the 60 G. frondosa germplasm resources. DNA fingerprinting is a simple and economically efficient method that aims to identify large numbers of varieties with few markers. A total of 12 core markers with high detection rates and high levels of polymorphism that could distinguish all varieties in this experiment were selected. Phylogenetic analysis, PCA, and population structure analysis based on candidate core and core SNP markers showed that 60 G. frondosa germplasms could be divided into two populations, and the clustering results were highly consistent with the population re-sequencing data.
Study of the G. frondosa germplasm resources revealed that the G. frondosa population has high genetic variation and a high diversity index; this core collection of G. frondosa thus has major implications both for the economic value of G. frondosa and for future research. Additional analyses are needed to maximize the economic and scientific value of this core collection. First, the materials examined in this study were mainly derived from cultivated species in the main G. frondosa-producing areas in China. The genetic background of G. frondosa germplasm is relatively narrow; wild germplasm contains a large number of excellent alleles, yet these have not been effectively applied. More research on wild strains is needed. There is also a need to finely characterize these strains, as well as conduct analyses of phenotypic traits and biological properties. In the future, the genes related to important agronomic traits of G. frondosa can be further screened by combining GWAS and phenotypic data, and identification of the genes that regulate genetic variation in phenotypic traits is needed to facilitate the fine-mapping of candidate functional regions. Second, G. frondosa is a rare edible and medicinal mushroom with a complex genetic background, and the chromosomal genome assembly has not yet been generated. A high-quality reference genome is essential for studies of population variation and genome evolution. There are a large number of mutations in the genome, including SNPs, InDels, CNVs, and SVs, and these variatns can facilitate the development of specific molecular markers. The materials selected for this study are mostly cultivated species from the main production areas of G. frondosa in China, with a relatively limited genetic background. The number of wild germplasm resources containing rich excellent alleles is limited. In the future, further line breeding should pay more attention to the collection, development, and research of wild strains.
In sum, we constructed a core collection based on whole-genome resequencing and developed a set of core SNP markers that can be used to distinguish among the main cultivated, wild, and mutated varieties of G. frondosa in China. Genetic diversity and population structure analyses were conducted based on the candidate core and core SNP markers, and the results showed that the screened candidate core and core SNP markers could be used to distinguish among all the experimental materials in the phylogenetic tree. DNA fingerprints were constructed based on the screened SNP markers, and this provides an accurate, rapid, convenient, and efficient method for the identification of germplasm resources. These results are important for the preservation and utilization of G. frondosa germplasm resources, variety identification, and the protection of new varieties.
Data availability statement
All the genomic sequence data sets are available in the NCBI Sequence Read Archive under the accession number PRJNA1034769.
Author contributions
BD: Data curation, Project administration, Writing−original draft, Writing−review and editing. ZX: Supervision, Validation, Writing−review and editing. ML: Supervision, Validation, Writing−review and editing. GZ: Supervision, Writing−review and editing. GW: Supervision, Writing−review and editing. YZ: Supervision, Writing−review and editing. ZT: Conceptualization, Funding acquisition, Project administration, Resources, Supervision, Writing−review and editing.
Funding
The author(s) declare financial support was received for the research, authorship, and/or publication of the article. This work was supported by the Key R&D Program of Shandong Province, China (No. 2022LZGC023) and the Taishan Scholars Project Special Foundation (No. tsqn202211188).
Acknowledgments
We thank all the reviewers and editors for providing feedback that helped enhance the manuscript. We also thank the journal for reviewing this manuscript.
Conflict of interest
The authors declare that the research was conducted in the absence of any commercial or financial relationships that could be construed as a potential conflict of interest.
Publisher’s note
All claims expressed in this article are solely those of the authors and do not necessarily represent those of their affiliated organizations, or those of the publisher, the editors and the reviewers. Any product that may be evaluated in this article, or claim that may be made by its manufacturer, is not guaranteed or endorsed by the publisher.
Supplementary material
The Supplementary Material for this article can be found online at: https://www.frontiersin.org/articles/10.3389/fmicb.2024.1417014/full#supplementary-material
Supplementary Figure 1 | Population structure of the 60 G. frondosa using 829,488 SNPs based on the Admixture output from K = 2 to K = 10.
Supplementary Figure 2 | Population genetic structure analysis of 60 germplasm resources of G. frondosa using 50 candidate core SNPs output from K2 to K10.
Supplementary Figure 3 | Population genetic structure analysis of 60 germplasm resources of G. frondosa using 12 core SNPs output from K2 to K10.
Footnotes
- ^ https://ftp.ncbi.nlm.nih.gov/genomes/genbank/fungi/Grifola_frondosa/latest_assembly_versions/GCA_001683735.1_ASM168373v1/
References
Alexander, D. H., Novembre, J., and Lange, K. (2009). Fast model-based estimation of ancestry in unrelated individuals. Genome Res. 19, 1655–1664. doi: 10.1101/gr.094052.109
Bau, T., and Lu, T. (2017). Advance of macro-fungal genomes sequencing. J. Fungal Res. 15, 151–165. doi: 10.3341/j.jfr.2014.1713
Botstein, D., White, R. L., Skolnick, M., and Davis, R. W. (1980). Construction of a genetic linkage map in man using restriction fragment length polymorphisms. Am. J. Hum. Genet. 32, 314–331.
Chen, S., Zhou, Y., Chen, Y., and Gu, J. (2018). fastp: an ultra-fast all-in-one FASTQ preprocessor. Bioinformatics 34, i884–i890. doi: 10.1093/bioinformatics/bty560
Chung, H. K., Kim, K. W., Chung, J. W., Lee, J. R., Lee, S. Y., Dixit, A., et al. (2009). Development of a core set from a large rice collection using a modified heuristic algorithm to retain maximum diversity. J. Integr. Plant Biol. 51, 1116–1125. doi: 10.1111/j.1744-7909.2009.00882.x
Cingolani, P., Platts, A., Wang, L. L., Coon, M., Nguyen, T., Wang, L., et al. (2012). A program for annotating and predicting the effects of single nucleotide polymorphisms, SnpEff. Fly 6, 80–92. doi: 10.4161/fly.19695
Dai, Y. C., Zhou, L. W., Yang, Z. L., Wen, H. A., Bao, T., and Li, T. H. (2010). A revised checklist of edible fungi in China. Mycosystema 29, 1–21. doi: 10.13346/j.mycosystema.2010.01.022
Danecek, P., Auton, A., Abecasis, G., Albers, C. A., Banks, E., DePristo, M. A., et al. (2011). The variant call format and VCFtools. Bioinformatics 27, 2156–2158. doi: 10.1093/bioinformatics/btr330
Doyle, J. J., and Doyle, J. L. (1987). A rapid DNA isolation procedure for small quantities of fresh leaf tissue. Phytochem. Bull. 19, 11–15.
Evanno, G., Regnaut, S., and Goudet, J. (2005). Detecting the number of clusters of individuals using the software STRUCTURE: a simulation study. Mol. Ecol. 14, 2611–2620. doi: 10.1111/j.1365-294X.2005.02553.x
Falush, D., Stephens, M., and Pritchard, J. K. (2003). Inference of population structure using multilocus genotype data: linked loci and correlated allele frequencies. Genetics 164, 1567–1587. doi: 10.1093/genetics/164.4.1567
Huang, L., Yang, M., Li, L., Li, H., Yang, D., Shi, T., et al. (2018). Whole genome re-sequencing reveals evolutionary patterns of sacred lotus (Nelumbo nucifera). J. Integr. Plant Biol. 60, 2–15. doi: 10.1111/jipb.12606
Jakobsson, M., and Rosenberg, N. A. (2007). CLUMPP: a cluster matching and permutation program for dealing with label switching and multimodality in analysis of population structure. Bioinformatics 23, 1801–1806. doi: 10.1093/bioinformatics/btm233
Li, C. T., and Xu, S. (2022). Edible mushroom industry in China: current state and perspectives. Appl. Microbiol. Biotechnol. 106, 3949–3955. doi: 10.1007/s00253-022-11985-0
Li, C. T., Tan, Q., Bian, Y. B., Xie, B. G., Liu, Z. Q., and Li, Y. (2019a). The Status and Prospection of Edible Mushroom Industry in China. J. Fungal Res. 17, 1–12. doi: 10.13341/j.jfr.2019.8001
Li, H., and Durbin, R. (2009). Fast and accurate short read alignment with Burrows-Wheeler transform. Bioinformatics 25, 1754–1760. doi: 10.1093/bioinformatics/btp324
Li, P. R., Su, T. B., Wang, H. P., Zhao, X. Y., Wang, W. H., Yu, Y. J., et al. (2019b). Development of a core set of KASP markers for assaying genetic diversity in Brassica rapa subsp. chinensis Makino. Plant Breed. 138, 309–324. doi: 10.1111/pbr.12686
Li, Y. (2021). The sustainable development of edible fungi industry in China in the post epidemic era. J. Fungal Res. 19, 1–5. doi: 10.13341/j.jfr.2021.0001
Li, Y. D., Luo, X. B., Peng, X., Yang, G. Q., Jin, Y. Y., Zu, G. D., et al. (2024). Development of SNP and InDel markers in radish and their association withphenotypic characters. Acta Agricult. Zhejiangensis 36, 1055–1066.
Li, Z. Y., Yu, H. L., Fang, Z. Y., Yang, L. M., Liu, Y. M., Zhuang, M., et al. (2018). Development of SNP Markers in Cabbage and Construction of DNA Fingerprinting of Main Varieties. Sci. Agricult. Sinica 51, 2771–2788. doi: 10.3864/j.issn.0578-1752.2018.14.014
Liu, J., Li, X., Liu, Y., Xing, C., Xie, Y., Cai, G., et al. (2021). Evaluation of genetic diversity and development of core collections of industrial brewing yeast using ISSR markers. Arch. Microbiol. 203, 1001–1008. doi: 10.1007/s00203-020-02091-8
Liu, J., Wang, Z. R., Li, C., Bian, Y. B., and Xiao, Y. (2015). Evaluating genetic diversity and constructing core collections of Chinese Lentinula edodes cultivars using ISSR and SRAP markers. J. Basic Microbiol. 55, 749–760. doi: 10.1002/jobm.201400774
Liu, K., and Muse, S. V. (2005). PowerMarker: an integrated analysis environment for genetic marker analysis. Bioinformatics 21, 2128–2129. doi: 10.1093/bioinformatics/bti282
Liu, X. B., Li, J., and Yang, Z. L. (2018). Genetic diversity and structure of core collection of winter mushroom (Flammulina velutipes) developed by genomic SSR markers. Hereditas 155, ARTN3. doi: 10.1186/s41065-017-0038-0
Mahmoodi, R., Dadpour, M. R., Hassani, D., Zeinalabedini, M., Vendramin, E., and Leslie, C. A. (2021). Composite core set construction and diversity analysis of Iranian walnut germplasm using molecular markers and phenotypic traits. PLoS One 16:e0248623. doi: 10.1371/journal.pone.0248623
McKenna, A., Hanna, M., Banks, E., Sivachenko, A., Cibulskis, K., Kernytsky, A., et al. (2010). The Genome Analysis Toolkit: a MapReduce framework for analyzing next-generation DNA sequencing data. Genome Res. 20, 1297–1303. doi: 10.1101/gr.107524.110
Oliveira, A. A., Morais, J., Pires, O., and Burmester, I. (2020). Fig tree induced phytophotodermatitis. BMJ Case Rep. 13, 392. doi: 10.1136/bcr-2019-233392
Omar, A. A., Zayed, E. M., Oraby, H. F., Elnaggar, N. Z., Elashtokhy, M. M. A., Basuoni, M. M., et al. (2023). Description of phenotypic, grain quality, molecular fingerprinting, and biodiversity using DNA barcoding of some elite rice genotypes. South Afr. J. Botany 154, 1–11. doi: 10.1016/j.sajb.2023.01.045
Peakall, R., and Smouse, P. E. (2012). GenAlEx 6.5: genetic analysis in Excel. Population genetic software for teaching and research–an update. Bioinformatics 28, 2537–2539. doi: 10.1093/bioinformatics/bts460
Perseguini, J. M., Silva, G. M., Rosa, J. R., Gazaffi, R., Marcal, J. F., Carbonell, S. A., et al. (2015). Developing a common bean core collection suitable for association mapping studies. Genet. Mol. Biol. 38, 67–78. doi: 10.1590/S1415-475738120140126
Su, H., Wang, L., Liu, L., Chi, X., and Zhang, Y. (2008). Use of inter-simple sequence repeat markers to develop strain-specific SCAR markers for Flammulina velutipes. J. Appl. Genet. 49, 233–235. doi: 10.1007/BF03195619
Thachuk, C., Crossa, J., Franco, J., Dreisigacker, S., Warburton, M., and Davenport, G. F. (2009). Core Hunter: an algorithm for sampling genetic resources based on multiple genetic measures. BMC Bioinformatics 10:243. doi: 10.1186/1471-2105-10-243
Tripodi, F., Falletta, E., Leri, M., Angeloni, C., Beghelli, D., Giusti, L., et al. (2022). Anti-Aging and Neuroprotective Properties of Grifola frondosa and Hericium erinaceus Extracts. Nutrients 14, 368. doi: 10.3390/nu14204368
Wang, F. Q., Fan, X. C., Zhang, Y., Sun, L., Liu, C. H., and Jiang, J. F. (2022). Establishment and application of an SNP molecular identification system for grape cultivars. J. Integr. Agric. 21, 1044–1057. doi: 10.1016/S2095-3119(21)63654-7
Wang, F. Q., Zhang, J., Wen, C. L., Fan, X. C., Zhang, Y., Sun, L., et al. (2021a). Identification of Grape Cultivars Based on KASP Markers. Sci. Agric. Sin. 54, 2830–2846. doi: 10.3864/j.issn.0578-1752.2021.13.012
Wang, Y., Wu, X., Li, Y., Feng, Z., Mu, Z., Wang, J., et al. (2021b). Identification and Validation of a Core Single-Nucleotide Polymorphism Marker Set for Genetic Diversity Assessment, Fingerprinting Identification, and Core Collection Development in Bottle Gourd. Front. Plant Sci. 12:747940. doi: 10.3389/fpls.2021.747940
Wang, Y., Wan, L. C., Huang, C. Y., Han, J. D., Li, J., Yang, P., et al. (2019). Genetic Diversity of Grifola frondosa Based on Integrated ISSR and SRAP Analysis. Acta Edulis Fungi 26, 26–36. doi: 10.16488/j.cnki.1005-9873.2019.03.004
Wen, Z. Q., Xiong, F., Chen, J. N., Zhu, J., and Xie, B. G. (2011). Identification of Grifola frondosa germplasm resources using molecular markers. Chin. J. Trop. Crops 32, 1330–1336.
Wu, J. Y., Siu, K. C., and Geng, P. (2021). Bioactive Ingredients and Medicinal Values of Grifola frondosa (Maitake). Foods 10, 95. doi: 10.3390/foods10010095
Xu, J. (2006). Fundamentals of fungal molecular population genetic analyses. Curr. Issues Mol. Biol. 8, 75–89.
Yang, J., Lee, S. H., Goddard, M. E., and Visscher, P. M. (2011). GCTA: A Tool for Genome-wide Complex Trait Analysis. Am. J. Hum. Gen. 88, 76–82. doi: 10.1016/j.ajhg.2010.11.011
Yang, J., Xu, J., Song, Y. M., and Zhu, J. (2016). Screen of Grifola frondosa thermotolerant strains and analysis of the genetic relationship of candidate strains. Genom. Appl. Biol. 35, 396–405. doi: 10.13417/j.gab.035.000396
Yang, Y. Y., Lyu, M. J., Liu, J., Wu, J. N., Wang, Q., Xie, T. Y., et al. (2022). Construction of an SNP fingerprinting database and population genetic analysis of 329 cauliflower cultivars. BMC Plant Biol. 22:522. doi: 10.1186/s12870-022-03920-2
Zhang, J., Yang, J., Zhang, L., Luo, J., Zhao, H., Zhang, J., et al. (2020). A new SNP genotyping technology Target SNP-seq and its application in genetic analysis of cucumber varieties. Sci. Rep. 10:5623. doi: 10.1038/s41598-020-62518-6
Zhang, J., Yang, J., Zhang, L., Luo, J., Zhao, H., Zhang, J., et al. (2021). Author Correction: A new SNP genotyping technology Target SNP-seq and its application in genetic analysis of cucumber varieties. Sci. Rep. 11:8010. doi: 10.1038/s41598-021-86981-x
Zhang, M. Y., Shang, X. D., Li, Y., and Guo, J. (2009). Evaluation of Grifola frondosa Germplasm Using ITS-RFLP and SRAP Markers. Acta Edulis Fungi 16, 5–10. doi: 10.16488/j.cnki.1005-9873.2009.03.006
Zhang, Q. S., Xu, B. L., Liu, L. D., Yuan, Q. Q., Dong, H. X., Cheng, X. H., et al. (2012). Analysis of genetic diversity among Chinese Pleurotus citrinopileatus Singer cultivars using two molecular marker systems (ISSRs and SRAPs) and morphological traits. World J. Microbiol. Biotechnol. 28, 2237–2248. doi: 10.1007/s11274-012-1031-4
Keywords: KASP marker, variety identification, DNA fingerprinting, core collection, edible mushrooms
Citation: Diao B, Xu Z, Liu M, Zhang G, Wang G, Zhang Y and Tian X (2024) Establishment and application of a SNP molecular identification system in Grifola frondosa. Front. Microbiol. 15:1417014. doi: 10.3389/fmicb.2024.1417014
Received: 13 April 2024; Accepted: 22 July 2024;
Published: 08 August 2024.
Edited by:
Surendra Sarsaiya, Zunyi Medical University, ChinaReviewed by:
Sonia Gomes, University of Porto, PortugalHosein Salehian Dehkordi, Chinese Academy of Sciences (CAS), China
Copyright © 2024 Diao, Xu, Liu, Zhang, Wang, Zhang and Tian. This is an open-access article distributed under the terms of the Creative Commons Attribution License (CC BY). The use, distribution or reproduction in other forums is permitted, provided the original author(s) and the copyright owner(s) are credited and that the original publication in this journal is cited, in accordance with accepted academic practice. No use, distribution or reproduction is permitted which does not comply with these terms.
*Correspondence: Xuemei Tian, dHhtQHFhdS5lZHUuY24=
†These authors have contributed equally to this work